Premium Planning Tool V1.0Background to the tool
The tool was built out of frustration. Having traded for many years with a reasonable level of success I was always frustrated that my trading never went up a level. The world of trading is filled with people having so much more success than me and this level of FOMO really bothered me and resulted in inconsistency and countless hours sitting in front of a screen, hoping for the best. I also became a little bit of an indicator junkie - was there a holy grail indicator out there for me? I always felt that as a retail trader I was behind the curve. I started to investigate how the major market participants trade and make money and I was astounded at the level of success that they get from creating strategies and sticking to it. The market is driven largely by a "black boxes" which, for us retail traders are outside of our ability to access. I wanted to build a tool that could give me a traders edge.
Another factor that has always bothered me was when reading investing books there is a general assumption that a standard entry, say 8/13 cross over, works on all stocks. However, it is not the case and it can be frustrating for a trader using a set up and not realizing that the set up is the problem, not the trader. This realization alone has made a huge impact on my trading. The big boxes that control the market know this already.
Also, a lot of indicators that are available don’t take advantage of the backtesting capability provided in Tradingview. It is fairly simple to find 8-9 trades where a set up worked and then fall into the trade of assuming that it cannot fail. Knowing which set ups work and how frequently it will print will change the way that you trade.
The goal with the tool is to identify setups that have worked in the past with a high degree of profitability, high profit factor and low drawdown and using the planning tool allows you to customize the setup to find exactly what you are looking for across any tradeable asset on TradingView.
Over the past 20 years I have realized the following:
1) Not all entries and signals work the same on all stocks
2) Not having a plan in advance lowers your probability of success
3) Developing consistency in analysis is critical
4) Developing confidence in your own plan is more important than whose trades you try to copy
5) Having 30 indicators does not help you trade better - it leads to more frustration
So here is the product of these realisations:
1) The tool looks across the most common entry strategies (MA cross on 5 dimensions of type and 5 common crossovers) and can be used on 19 different time frames giving you guidance on what the best set up is for the stock you are analysing
2) It incorporates volatility into the strategy – when stocks are trading outside of a predetermined volatility band, a trade will not be entered. This accommodates traders who tend to get shaken out of trades too early.
3) It looks at the impact of “buying the dip” – often a common strategy employed by many traders which now can be backtested and reviewed to see if it actually helped or hindered the trade.
4) It measures your trade plan against your R – what you are willing to risk – and calculates your target profit based on your R multiple
5) It provides a non repaint signal on your base strategy and provides you with signals to trade smaller or shorter signals within the bigger strategy.
There are some additional visual tools:
• Squeeze signals - I am a big fan of the TTM squeeze however the Squeeze by itself can be hard to trade. Seeing a squeeze fire long on a chart can add to trade confidence.
• Seeing zones of support and resistance rather than single lines can also give you some leeway in terms of not getting pushed out of a trade too soon.
The backtester is always reviewed on a 2 to 3 year period to get an understanding of win rate %, profit ratio and average duration of trade. As an option trader knowing that a high probability move is playing out allows me to make sure that I don’t undercut the time frame for the expiration of the option relative to the historical average duration of a trade. Backtesting on shorter times is unrealistic.
Key benefits
1) It saves me a ton of time. I don’t have to sit in front of a screen watching ticks each day. I can plan for an entry, set an alert for a trade and when the conditions are met the TradingView system sends me a message and I will go and confirm a trade, execute it, set my alerts for control and move on with my life.
2) It allows me to review trade ideas in a consistent manner using the best trade plan and set up for a stock.
3) It forces me to be patient and not panic (always a good thing). With an adjustable volatility feature I can modify the volatility band in the trade plan to accommodate choppy market conditions.
4) It looks at both sides of the market (long and short) and you can calculate the impact of being market neutral or having a directional bias.
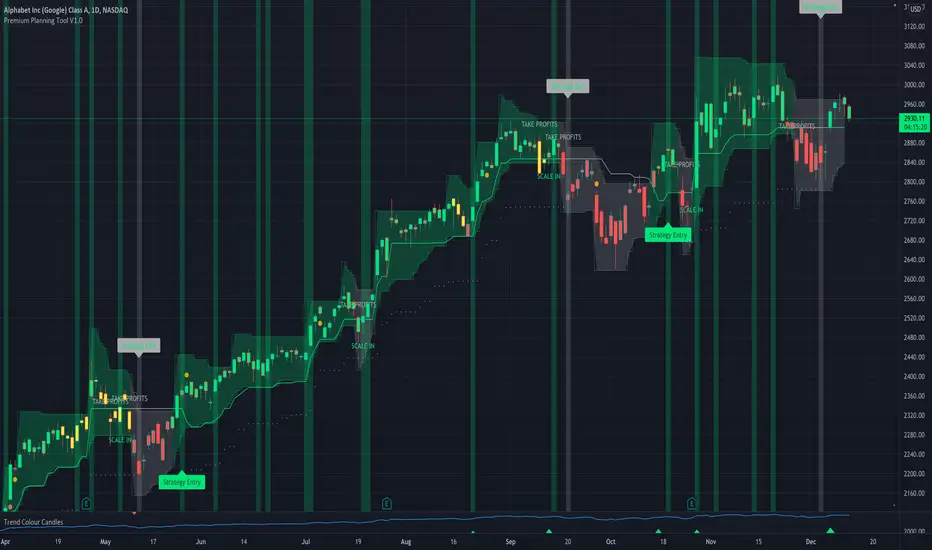
The setup is based on a reversal set up and we are doing a single entry trade here with a base of 4ATR stop using a long call or a bull call debit spread and allowing GOOGL to trade on a 1ATR price band on a daily basis. This strategy has only generated 10 signals since 2018 however it has been profitable 87.5% of the time with a profit factor of 25.26. Personally, on signals with this degree of strength I will trade a long stock purchase on a STRATEGY ENTRY signal and I will look to trade shorter duration option trades (both debit and credit spreads) on the trend signals INSIDE the major buy signal.
As a high probability set up you can trade this signal by itself or you can trade the trend inside the signal which will trigger at 2966. Either way, set your alerts and get on with your life.
I hope this tool helps you to achieve some degree of peace in your trading.
To get access to the tool, please contact the author.
Search in scripts for "backtest"
JMA Quantum Edge: Adaptive Precision Trading System JMA Quantum Edge: Adaptive Precision Trading System - Enhanced Visuals & Risk Management
Get ready to experience a groundbreaking trading strategy that adapts in real-time to market conditions! This powerful, open-source script combines advanced technical analysis with state-of-the-art risk management tools, designed to give you the edge you need in today's dynamic markets.
What It Does:
Adaptive JMA Indicator:
Utilizes a custom Jurik Moving Average (JMA) that adjusts its sensitivity based on market volatility, ensuring you get precise signals even in the most fluctuating environments.
Dynamic Risk Management:
Features built-in support for partial exits (scaling out) to secure profits, along with an optional Kelly Criterion-based position sizing that tailors your exposure based on historical performance metrics.
Robust Error Handling:
Incorporates market condition filters—like minimum volume and maximum allowed gap percentage—to ensure trades are only executed under favorable conditions.
Vivid Visual Enhancements:
Enjoy an animated background that reflects market momentum, dynamic pivot markers, and clearly drawn trend channels. Plus, interactive tables provide real-time performance analytics and detailed error metrics.
Fully Customizable:
With a comprehensive set of inputs, you can easily tailor the strategy to your personal trading style and market preferences. Adjust everything from JMA parameters to refresh intervals for tables and labels!
How to Use It:
Add the Script:
Copy and paste the script into the Pine Script Editor on TradingView and click “Add to Chart.”
Configure Your Settings:
Customize your risk management (capital, commission, position sizing, partial exits, etc.) and tweak the JMA settings to match your preferred trading style. Use the extensive input panel to adjust visuals, alerts, and more.
Backtest & Optimize:
Run the strategy in the Strategy Tester to analyze its historical performance. Monitor real-time analytics and error metrics via the interactive tables, and fine-tune your parameters for optimal performance.
Go Live with Confidence:
Once you're satisfied with the backtest results, use the generated signals for live trading, and let the system help you stay ahead in fast-paced markets!
How to use the imputs:
This cutting-edge strategy is designed to adapt to changing market conditions and offers you complete control over your trading parameters. Here’s a breakdown of what each group of inputs does and how you should use them:
Risk Management & Trade Settings
Recalculate on Every Tick:
What it does: When enabled, the strategy recalculates on every price update.
Recommendation: Leave it true for fast charts.
Initial Capital:
What it does: Sets your starting capital for backtesting, which influences position sizing and performance metrics.
Recommendation: Start with $10,000 (or adjust according to your trading capital).
Commission (%):
What it does: Simulates the cost per trade.
Recommendation: Use a realistic rate (e.g., 0.04%).
Position Size & Quantity Type:
What they do: Define how large each trade will be. Choose between a fixed unit amount or a percentage of equity.
Recommendation: For beginners, the default fixed value is a good start. Experiment later with percentage-based sizing if needed.
Order Comment:
What it does: Adds a label to your orders for easier tracking.
Allow Reverse Orders:
What it does: If disabled, the strategy will close opposing positions before entering a new trade, reducing conflicts.
Enable Dynamic Position Sizing:
What it does: Adjusts trade size based on current volatility.
Recommendation: Beginners may start with this disabled until they understand basic sizing.
Partial Exit Inputs:
What they do:
Enable Partial Exits: When turned on, you can scale out of your position to lock in profits.
Partial Exit Profit (%): The profit percentage that triggers a partial exit.
Partial Exit Percentage: The percentage of your current position to exit. Recommendation: Use defaults (e.g., 5% profit, 50% exit) to secure profits gradually.
Kelly Criterion Option:
What it does: When enabled, adjusts your position sizing using historical performance (win rate and profit factor).
Recommendation: Beginners might leave this disabled until comfortable with backtest performance metrics.
Market Condition Filters:
What they do:
Minimum Volume: Ensures trades occur only when there’s sufficient market activity.
Maximum Gap (%): Prevents trading if there’s an unusually large gap between the previous close and current open. Recommendation: Defaults work well for most markets. If trades seem erratic, consider tightening these limits.
JMA Settings
Price Source:
What it does: The input series for the JMA calculation, typically set to the closing price.
JMA Length:
What it does: Controls the smoothing period of the JMA. Lower values are more sensitive; higher values smooth out the noise. Recommendation: Start with 21.
JMA Phase & Power:
What they do: Adjust how responsive the JMA is. Phase controls timing; power adjusts the intensity. Recommendation: Default settings (63 phase and 3 power) are a balanced starting point.
Visual Settings & Style
Show JMA Line, Pivot Lines, and Pivot Labels:
What they do: Toggle visual elements on your chart for easier signal identification.
Pivot History Count:
What it does: Limits how many historical pivot markers are displayed.
Color Settings (Up/Down Neon Colors):
What they do: Set the visual cues for buy and sell signals.
Pivot Marker & Line Style:
What they do: Choose the style and thickness of your pivot markers and lines.
Show Stats Panel:
What it does: Displays real-time performance and error metrics.
Dynamic Background & Visual Enhancements
Animate Background:
What it does: Changes the background color based on market momentum.
Show Trend Channels & Volume Zones:
What they do: Draw trend channels and highlight areas of high volatility/volume.
Show Data-Rich Labels:
What it does: Displays key metrics like volume, error percentage, and momentum on the chart.
High Volatility Threshold:
What it does: Determines the multiplier for when the chart background should change due to high volatility.
Multi-Timeframe Settings
Higher Timeframe:
What it does: Uses a higher timeframe’s JMA for trend confirmation. Recommendation: Use Daily ('D') or Weekly ('W') for broader trend analysis.
Show HTF Trend Zone & Opacity:
What they do: Display a visual zone from the higher timeframe to help confirm trends.
6. Trailing Stop Settings
Trailing Stop ATR Factor & Offset Multiplier:
What they do: Calculate trailing stops based on the Average True Range (ATR), adjusting stop distances dynamically. Recommendation: Default settings are a good balance but can be fine-tuned based on asset volatility.
Alerts & Notifications
Alerts on Pivot Formation & JMA Crossover:
What they do: Notify you when key events occur.
Dynamic Power Threshold:
What it does: Sets the sensitivity for dynamic alerts.
8. Static Stop Loss / Take Profit
Static Stop Loss (%) & Take Profit (%):
What they do: Allow you to set fixed stop loss or take profit levels. Recommendation: Leave them at 0 to disable if you prefer dynamic risk management, or set them if you have strict risk/reward preferences.
Advanced Settings
ATR Length:
What it does: Determines the period for ATR calculation, impacting trailing stop sensitivity. Recommendation: Start with 14.
Optimization Feedback & Enhanced Error Analysis
Error Metric Length & Error Threshold (%):
What they do: Calculate error metrics (like average error, skewness, and kurtosis) to help you fine-tune the JMA. Recommendation: Use the defaults and adjust if the error metrics seem off during backtesting.
UI - User-Driven Tweaking & Table Customization
Parameter Tweaker Panel, Debug/Performance Table Settings:
What they do: Provide interactive tables that display real-time performance, error metrics, and allow you to monitor strategy parameters.
Refresh Frequency Options (Table & Label Refresh Intervals):
What they do: Set how often the tables and labels update.
Recommendation: Start with an interval of 1 bar; increase it if your chart is too busy.
Important for Beginners:
Default Settings:
All default values have been chosen for balanced performance across different markets. If you ever experience unexpected behavior, start by resetting the inputs to their defaults.
Step-by-Step Adjustments:
Experiment by changing one setting at a time while observing how the strategy’s signals and performance metrics change. This will help you understand the impact of each parameter.
Resetting to Defaults:
If things seem off or you’re not getting the expected results, you can always reset the indicator. Either reload the script or use the “Reset Inputs” option (if available) to revert to the default settings.
Jump in, experiment, and enjoy the power of adaptive precision trading. This strategy is built to grow with your skills—have fun exploring and refining your trading edge!
Happy trading!

Liquidity Trading Algorithm (LTA)
The Liquidity Trading Algorithm is an algorithm designed to provide trade signals based on
liquidity conditions in the market. The underlying algorithm is based on the Liquidity
Dependent Price Movement (LDPM) metric and the Liquidity Dependent Price Stability (LDPS)
algorithm.
Together, LDPM and LDPS demonstrate statistically significant forecasting capabilities for price-
action on equities, cryptocurrencies, and futures. LTA takes these liquidity measurements and
translates them into actionable insights by way of entering or exiting a position based
on the future outlooks, as measured by the current liquidity status.
The benefit of LTA is that it can incorporate these powerful liquidity measurements into
actionable insights with several features designed to help you tailor LTA's behavior and
measurements to your desired vantage point. These customizable features come by the way of determining LTA's assessment style, and additional monitoring systems for avoiding bear and bull traps, along with various other quality of life features, discussed in more detail below.
First, a few quick facts:
- LTA is compatible on a wide array of instruments, including Equities, Futures, Cryptocurrencies, and Forex.
- LTA is compatible on most intervals in so long as the data can be calculated appropriately,
(be sure to do a backtest on timescales less than 1-minue to ensure the data can be computed).
- LTA only measures liquidity at the end of the interval of the chart chosen, and does not respond to conditions during the candle interval, unless specified (such as with `Stops`).
- LTA is interval-dependent, this means it will measure and behave differently on different
intervals as the underlying algorithms are dependent on the interval chosen.
- LTA can utilize fractional share sizing for cryptocurrencies.
- LTA can be restricted to either bullish or bearish indications.
- Additional Monitoring Systems are available for additional risk mitigation.
In short, LTA is a widely applicable, unique algorithm designed to translate liquidity measurements into liquidity insights.
Before getting more into the details, here is a quick list of the main features and settings
available for customization:
- Backtesting Start Date: Manual selection of the start date for the algorithm during backtesting.
- Assessment Style: adjust how LDPM and LDPS measure and respond to changes in liquidity.
- Impose Wait: force LTA to wait before entering or exiting a position to ensure conditions have remained conducive.
- Trade Direction Allowance: Restrict LTA to only long or only short, if desired.
- Position Sizing Method: determine how LTA calculates position sizing.
- Fractional Share Sizing: allow LTA to calculate fractional share sizes for cryptocurrencies
- Max Size Limit: Impose a maximum size on LTA's positions.
- Initial Capital: Indicate how much capital LTA should stat with.
- Portfolio Allotment: Indicate to LTA how much (in percentages) of the available balance should be considered when calculating position size.
- Enact Additional Monitoring Systems: Indicate if LTA should impose additional safety criteria when monitoring liquidity.
- Configure Take Profit, Stop-Loss, Trailing Stop Loss
- Display Information tables on the current position, overall strategy performance, along
with a text output showing LTA's processes.
- Real-time text output and updates on LTA's inner workings.
Let's get into some more of the details.
LTA's Assessment Style
LTA's assessment style determines how LTA collects and responds to changing data. In traditional terms, this is akin to (but not quite exactly the same as) the sensitivity versus specificity spectrum, whereby on one end (the sensitive end), an algorithm responds to changes in data in a reactive manner (which tends to lower its specificity, or how often it is correct in its indications), and on the other end, the opposite one, the algorithm foresakes quick changes for longevity of outlook.
While this is in part true, it is not a full view of the underlying mechanisms that changing the assessment style augments. A better analogy would be that the sensitive end of the spectrum (`Aggressive`) is in a state such that the algorithm wants to changing its outlooks, and as such, with changes in data, the algorithm has to be convinced as to why that is not a good idea to change outlooks, whereas the the more specific states (`Conservative`, `Diamond`) must be convinced that their view is no longer valid and that it needs to be changed.
This means the `Aggressive` and the `Diamond` settings fundamentally differ not just in their
data collection, but also in the data processing such that the `Aggressive` decision tree has to
be convinced that the data is the same (as its defualt is that it has changed),
and the `Diamond` decision tree has to be convinced that the data is not the same, and as such, the outlook need changed.
From there, the algorithm cooks through the data and determines to what the outlook should be changed to, given the current state of liquidity.
`Balanced` lies in the middle of this balance, attempting to balance being open to new ideas while not removing the wisdom of the past, as it were.
On a scale of most `sensitive` to most `specific`, it is as follows: `Aggressive`, `Balanced`,
`Conservative`, `Diamond`.
Functionally, these different modes can help in different liquidity environments, as certain
environments are more conducive to an eager approach (such as found near `Aggressive`) or are more conducive to a more conservative approach, where sudden changes in liquidity are known to be short-lived and unremarkable (such as many previously identified bull or bear traps).
For instance, on low interval views, it can often-times be beneficial to keep the algorithm towards the `Sensitive` end, since on the lower-timeframes, the crosswinds can change quite dramatically; whereas on the longer intervals, it may be useful to maintain a more `Specific` algorithm (such as found near `Diamond` mode) setting since longer intervals typically lend themselves to longer time-horizons, which themselves typically lend themselves to "weathering the storm", as it were.
LTA's Assessment Style is also supported by the Additional Monitoring Systems which works
to add sensitivity without sacrificing specificity by enacting a separate monitoring system, as described below.
Additional Monitoring Systems
The Additional Monitoring System (AMS) attempts to add more context to any changes in liquidity conditions as measured, such that LTA as a whole will have an expanded view into any rapidly changing liquidity conditions before these changes manifest in the traditional data streams. The ideal is that this allows for early exits or early entrances to positions "a head of time".
The traditional use of this system is to indicate when liquidity is suggestive of the end of a particular run (be it a bear run or a bull run), so an early exit can be initiated (and thus,
downside averted) even before the data officially showcase such changes. In such cases (when AMS becomes activated), the algorithm will signal to exit any open positions, and will restrict the opening of any new positions.
When a position is exited because of AMS, it is denoted as an `Early Exit` and if a position is prevented from being entered, the text output will display `AM prevented entry...` to indicate that conditions are not meeting AMS' additional standards.
The algorithm will wait to make any actions while `AMS` is `active` and will only enter into a new position once `AMS` has been `deactivated` and overall liquidity conditions are appropriate.
Functionally, the benefits of AMS translate to:
- Toggeling AMS on will typically see a net reduction in overall profitability, but
- AMS will typically (almost always) reduce max drawdown,
an increases in max runup, and increase return-over-maxdrawdown, and
- AMS can provide benefit for equities that experience a lot of "traps" by navigating early
entrance and early exits.
So in short, AMS is way of adding an additional level of liquidity monitoring that attempts to
exit positions if conditions look to be deteriorating, and to enter conditions if they look to be
improving. The cost of this additional monitoring, however, is a greater number of trades indicated, and a lower overall profitability.
Impose Wait
Note: `Impose Wait` will not force Take Profit, Stop Loss, or Trailing Stop Loss to
wait.
LTA can be indicated to `wait` before entering or exiting a position if desired. This means that if conditions change, whereas without a `wait` imposed, the algorithm would immediately indicate this change via a signal to alter the strategy's position, with a `wait` imposed, the algorithm will `wait` the indicated number of bars, and then re-check conditions before proceeding.
If, while waiting, conditions change to a state that is no longer compatible with the "order-in-
waiting", then the order-in-waiting is removed, and the counts reset (i.e.: conditions must remain favorable to the intended positional change throughout the wait period).
Since LTA works at the end-of-intervals, there is an inherently "built-in" wait of 1 bar when
switching directly from long to short (i.e.: if a full switch is indicated, then it is indicated as
conditions change -> exit new position -> wait until -> check conditions ->
enter new position as indicated). Thus, to impose a wait of `1 bar` would be to effectively have a total of two candles' ends prior to the entrance of the new position).
There are two main styles of `Impose Wait` that you can utilize:
- `Wait` : this mode will cause LTA to `wait` when both entering and exiting a position (in so long as it is not an exit signaled via a Take Profit, Stop Loss or Trailing Stop Loss).
- `Exit-Wait` : This mode will >not< cause LTA to `wait` if conditions require the closing of a position, but will force LTA to wait before entering into a position.
Position:
In addition to the availability to restrict LTA to either a long-only or short-only strategy, LTA
also comprises additional flexibility when deciding on how it should navigate the markets with
regards to sizing. Notably, this flexibility benefits several aspects of LTA's existence, namely the ability to determine the `Sizing Method`, or if `Fractional Share Sizing` should be employed, and more, as discussed below.
Position Sizing Method
There are two main ways LTA can determine the size of a position. Either via the `Fixed-Share` choice, or the `Fixed-Percentage` choice.
- `Fixed-Share` will use the amount indicated in the `Max Sizing Limit` field as the position size, always.
Note: With `Fixed-Share` sizing, LTA will >not< check if the balance is sufficient
prior to signaling an entrance.
- `Fixed-Percentage` will use the percentage amount indicated in the `Portfolio Allotment` field as the percentage of available funds to use when calculating the position size. Additionally, with the `Fixed-Percentage` choice, you can set the `Max Sizing Limit` if desired, which will ensure that no position will be entered greater than the amount indicated in the field.
Fractional Share Sizing
If the underlying instrument supports it (typically only cryptocurrencies), share sizing can be
fractionalized. If this is done, the resulting positin size is rounded to `4 digits`. This means any
position with a size less than `0.00005` will be rounded to `0.0000`
Note: Ensure that the underlying instrument supports fractional share sizing prior
to initiating.
Max Sizing Limit
As discussed above, the `Max Sizing Limit` will determine:
- The position size for every position, if `Sizing Method : Fixed-Share` is utilized, or
- The maximum allowed size, regardless of available capital, if `Sizing Method : Fixed-Percentage` is utilized.
Note: There is an internal maximum of 100,000 units.
Initial Capital
Note: There are 2 `Initial Capital` settings; one in LTA's settings and one in the
`Properties` tab. Ensure these two are the same when doing backtesting.
The initial capital field will be used to determine the starting balanace of the strategy, and
is used to calculate the internal data reporting (the data tables).
Portfolio Allotment
You can specify how much of the total available balance should be used when calculating the share size. The default is 100%.
Stops
Note: Stops over-ride `AMS` and `Impose Wait`, and are not restricted to only the
end-of-candle and will occur instantaneously upon their activation. Neither `AMS` nor `Impose Wait` can over-ride a signal from a `Take-Profit`, `Stop-Loss`, or a `Trailing-Stop Loss`.
LTA enhouses three stops that can be configured, a `Take-Profit`, a `Stop-Loss` and a `Trailing-Stop Loss`. The configurations can be set in the settings in percent terms. These exit signals will always over-ride AMS or any other restrictions on position exit.
Their configuration is rather standard; set the percentages you want the signal to be sent at and so it will be done.
Some quick notes on the `Trailing-Stop Loss`:
- The activation percentage must be reached (in profits) prior to the `Traililng-Stop Loss`
from activating the downside protection. For example, if the `Activation Percentage` is 10%, then unless the position reaches (at any point) a 10% profit, then it will not signal any exits on the downside, should it occur.
- The downside price-point is continuously updated and is calculated from the maximum profit reached in the given position and the loss percentage placed in the appropriate field.
Data Tables and Data Output
LTA provides real-time data output through a variety of mechanisms:
- `Position Table`
The `Position Table` displays information about the current position, including:
> Position Duration : how long the position has been open for.
> Indicates if the side is Long or Short, depending on if it is long or short.
> Entry Price: the price the position was entered at.
> Current Price (% Dif): the current price of the underlying and the %-difference between the entry price and the current price.
> Max Profit ($/%): the maximum profit reached in $ and % terms.
> Current PnL ($/%) : the current PnL for the open position.
- `Performance Table`
The `Performance Table` displays information regarding the overall performance of the algorithm since its `Start Date`. These data include:
> Initial Equity ($): The initial equity the algorithm started with.
> Current Equity ($): The current total equity of the account (including open positions)
> Net Profits ($|%) : The overall net profit in $ and % terms.
> Long / Short Trade Counts: The respective trade counts for the positions entered.
> Total Closed Trades: The running sum of the number of trades closed.
> Profitability: The calculation of the number of profitable trades over the total number of
trades.
> Avg. Profit / Trade: The calculation of the average profit per trade in both $ and % terms.
> Avg. Loss / Trade: The calculation of the average loss per trade in both $ and % terms.
> Max Run-Up: The maximum run-up the algorithm has seen in both $ and % terms.
> Max Drawdown: The maximum draw-down the algorithm has seen in both $ and % terms.
> Return-Over-Max-Drawdown: the ratio of the maximum drawdown against the current net profits.
- `Text Output`
LTA will output, if desired, signals to the text output field every time it analysis or performs and action. These messages can include information such as:
"
08:00:00 >> AM Protocol activated ... exiting position ...
08:00:00 >> Exit Order Created for qty: 2, profit: 380 (4.34%)
...
09:30:00 >> Checking conditions ...
09:30:00 >> AM protocol prevented entry ... waiting ...
"
This way, you can keep an eye out on what is happening "under the hood", as it were.
LTA will produce a message at the end of its assessment at the end of each candle interval, as well as when a position is exited due to a `Stop` or due to `AMS` being activated.
Additionally, the `Text Output` includes a initial message, but for space-constraints, this
can be toggled off with the `Blank Text Output` option within LTA's configurations.
For additional information, please refer to the Author's Instructions below.

Pullback_Power [JackTz]Welcome to Pullback_Power
Pullback_Power is a scalping strategy designed to capitalize on market retracements while incorporating unique dynamic features to enhance profitability.
Calculation
Pullback_Power purely uses moving averages to calculate both entry and exits. Exits can also be set to fixed percentages for both take profit and stop loss.
How the Strategy Works
Statistics show that markets normally do a recovery after each drop. Crypto markets can easily drop up to 20% within a few hours and then do a complete or partial recovery. Pullback_Power utilizes this known pattern alongside pyramiding. The strategy aims to catch one or more entries when the price drops, hoping to make profits when the market recovers from the drop. The fixed take profit and stop loss can be used to define your risk management, while the dynamic exit opportunity is riskier but provides the ability to stay in the trade longer while it recovers. Pullback_Power can make up to four entries. This means it utilizes pyramiding to spread out the entry points, but every exit is a full exit. It is not possible to partially exit.
Utility
Pullback_Power is a scalping strategy suitable for traders who operate with small trades and don't want to stay in the market for too long. Pullback_Power offers precise signals with no repainting. The strategy thrives in volatility, so crypto pairs might yield the best results, although this strategy can be adapted to work on all pairs and markets.
How to Automate It
Pullback_Power utilizes the standard placeholders of strategies on TradingView. This enables the trader to add every data point into a webhook, making it fully flexible to suit every trader's needs. To automate, create an alert, set the webhook URL, and add the JSON body needed for the webhook. An example of a simple JSON webhook with some of the standard strategy placeholders:
{
"side": "{{strategy.order.action}}",
"symbol": "{{ticker}}",
"amount": "{{strategy.order.contracts}}"
}
Read about all the standard placeholders that you can use here: TradingView - Standard strategy placeholders
Originality
Pullback_Power is unique in its ability to create precise signals without repainting while maintaining a solid approach to the pullback strategy. Its simplicity not only makes the strategy easy to use and understand but also highly effective. The simplicity reduces inputs, eliminating overfitting and limits each input to avoid incorrect usage. Many times, default settings are enough to achieve good backtesting results on almost all pairs available. Pullback_Power also differs from many other strategies by its solid code, which enhances performance and provides more reliable backtesting. The clean code increases the resilience and precision of the entries, making it less prone to errors.
Many pullback/scalping strategies normally only works on specific scopes of timeframes or pairs. Pullback_Power can easily be adapted to work on almost every scenario. The biggest change needed is the length of the moving average. The lower the timeframe, the higher a length is needed for proper results. I.e. on a 2H timeframe a length of 3 can yield good results. On a 5min timeframe the length might need to be as high as 70.
How to Use
To use Pullback_Power, add the script to your trading chart. By default, Pullback_Power opens four orders to optimize trade opportunities with a default fee value set at 0.1%. You can change these default settings in the Settings window under the Properties tab. To tailor Pullback_Power to your individual trading style, navigate to the Settings under the Input tab. Here you can configure various inputs to fit your trading style.
- Backtest settings , Start Date:
Defines the date of when the calculation starts. Use this to set the date of when the first trade could potentially emit.
- Backtest settings , End Date:
Defines the date of when the calculation ends. If there are any open trades after this date the close calculations are still live. It only makes sure that new orders cannot be opened after this date.
- Backtest settings , Only trade on weekdays:
This is a toggle you can enable or disable. If enabled it only allows new entries to happen during the normal week days, meaning Monday, Tuesday, Wednesday, Thursday and Friday.
Disable this to enable the script to open trades on all 7 days of the week.
- Open settings , Use dynamic long positions:
This toggle allows you to enable or disable the pullback level calculations after first trade.
If enabled, the calculations of level 2, 3 and 4 continues to happen after each bar, making the levels follow the price with the moving averages calculations.
If disabled, the calculations of the levels stop after the first trade. This means that the levels calculation at the point of the first trade stay fixed until all trades are closed.
You can see the difference of the green lines on the chart when you toggle this flag.
- Open settings , Data type:
This is the bar data used for the moving average calculation when opening trades. The possible data types are Open, High, Low, Close, HL2, HLC3, OHLC4, OC2 and HC2.
- Open settings , Source type:
This is the source used to calculate the moving average. The types available are: SMA, PCMA, EMA, WMA, DEMA, ZLEMA and HMA.
- Open settings , Length:
This is the length used for the moving average calculations. 3 means it takes the last 3 bars of historical data for the calculation.
- Open settings , Offset:
This defines if the calculation should use an offset for the historical data. This does not use a look-forward feature, but a look-backward feature. To prevent any possible repaints the offset can only be positive, not negative.
For instance, if the length is 3 and the offset is 0 the calculation is made from the last 3 bars, making it bar1, bar2 and bar3. If the length is 3 and the offset is 1 the calculation is made from bar2, bar3, and bar4 – offsetting the calculation by 1 bar.
- Leverage settings , Leverage liquidation (1-125):
The script itself does not handle any custom leverage calculation – this must be done in the Properties tabs and increasing the order size.
This setting is made to test a possible liquidation event if using leverage.
By setting this to higher than 1, a red line is visible after the first trade on the chart. This indicates the liquidation price.
If this setting is set to 25, the script will calculate the liquidation price from a x25 leverage. If this price is hit, the scripts stops emitting any orders and the background turns red.
You can use this to test if your settings could handle a certain level of leverage.
- Pullback settings , Pullback 1, 2, 3 and 4:
Each of these settings defines the entry price of each pullback level. If Pullback 1 is set to -6 it means that the moving average calculation should be 6% lower than the actual price.
The same logic applies to Pullback 2, 3 and 4.
Setting any level to 0 will disable the level – eliminating any orders to emit on that level.
This can be used to change the level of pyramiding down from 4 if needed.
If you do this, remember to also change the order size and the pyramiding value in the Properties tab accordingly.
- Close settings , Use dynamic TP and SL:
If enabled, script will exit all orders using the same but separate algorithm for moving averages. This enables the user to define if you want the orders to be closed if the price level of this moving average is hit. The price level for this calculation is visible on the chart by the blue line.
Although you can change the length and offset, as described underneath, this calculation uses the same data and source type defined in the Open settings area.
- Close settings , Length, Close:
This is the length used for the closing moving average calculations. 3 means it takes the last 3 bars of historical data for the calculation.
- Close settings , Offset, Close:
This defines if the calculation for the closing moving average should use an offset for the historical data. Just as the offset used for opening order, this does not use a look-forward feature, but a look-backward feature. To prevent any possible repaints the offset can only be positive, not negative.
For instance, if the length is 3 and the offset is 0 the calculation is made from the last 3 bars, making it bar1, bar2 and bar3. If the length is 3 and the offset is 1 the calculation is made from bar2, bar3, and bar4 – offsetting the calculation by 1 bar.
- Close settings , Use TakeProfit:
This toggle enables/disables a fixed take profit percentage.
- Close settings , TP %:
This sets the wanted % to reach on a take profit. This setting is ignored if the toggle above is disabled.
- Close settings , Use StopLoss:
This toggle enables/disables a fixed stop loss percentage.
- Close settings , SL %:
This sets the wanted % to reach on a stop loss. This setting is ignored if the toggle above is disabled.
Exit on Same Bar as Entry
By default, the script doesn't emit any exit orders on the same bar as the first entry order. Enable "Recalculation: After order is filled" to change this behavior.
Troubleshooting
While Pullback_Power is designed to provide reliable trading signals, you may encounter rare issues. One such issue could be receiving an error message stating "can't open orders with 0 or negative qty." If you encounter this error, it is likely due to specific conditions on the selected timeframe. To resolve this issue, change the timeframe on your trading chart.
Underlying Principles and Value Proposition
Pullback_Power leverages moving averages and volatility behavior to identify market retracements and capitalize on them. The strategy is rooted in the understanding that markets often experience temporary reversals or "pullbacks" before resuming their primary trend. By identifying these pullbacks and entering trades at opportune moments, Pullback_Power aims to capture quick profits from short-term market movements.
The dynamic and fixed calculations of Take Profit (TP) and Stop Loss (SL) levels enhances risk management, ensuring that potential losses are controlled while allowing room for profits to grow. The adaptive approach using the moving averages considers current market conditions, making the strategy flexible and responsive to changing volatility.
Moreover, Pullback_Power's non-repainting nature ensures the reliability of its signals, eliminating hindsight bias and providing traders with actionable insights based on real-time market data.
The strategy's simplicity and effectiveness make it accessible for traders of all experience levels. Whether you're a beginner looking to start scalping or an experienced trader seeking to diversify your trading approach, Pullback_Power offers a balanced blend of simplicity and sophistication to help you navigate the markets with confidence.
By focusing on clear, transparent principles and offering practical tools for risk management, Pullback_Power aims to provide tangible value to traders, empowering them to make informed decisions and optimize their trading outcomes.
Thank you for choosing Pullback_Power. I wish you successful trading!

Market Volatility Strategy (MVS)/Introduction
The Market Volatility Strategy (MVS) is based on volatility as an anomaly for making abnormal returns in the stock market. It uses the VIX, often referred to as the "fear gauge" which measures the market's expectation of 30-day volatility based on S&P 500 index options, as it's measure of volatility.
/Design
The VIX term structure refers to the relationship between the volatility index (VIX) values across different expiration dates. The term structure is important because it provides insights into market sentiment, risk expectations, and potential volatility in the future. The VIX term structure can take on three main shapes:
1. Contango: This occurs when longer-term VIX futures are priced higher than shorter-term futures. It is the most common shape for the VIX term structure.
2. Backwardation: This occurs when shorter-term VIX futures are priced higher than longer-term futures, indicating that the market expects volatility to decrease over time. Backwardation is less common and is typically seen in periods of high market stress or volatility.
3. Flat: A flat term structure happens when the VIX futures are priced similarly across different expiration dates. This indicates that the market's expectations for volatility are consistent over time.
/Trading
The strategy uses an understanding of the VIX term structure to generate buy and sell signals, as it provides valuable information about future volatility expectations and potential risk.
- Buy Signal
Contango suggests that the market expects volatility to increase over time. In a contango environment, the strategy looks for long volatility trades.
- Sell Signal
Backwardation suggests that investors are concerned about the near term and are willing to pay more for immediate protection. In such scenarios, the strategy looks for short volatility trades.
- Cash
A flat term structure can be transitional, moving from contango to backwardation or vice versa, or it may occur when the market is uncertain about future volatility. The strategy is in cash in this environment.
/Signals
The strategy has three signals:
1) Volatility
2) Volatility+
3) Volatility*
This means a maximum of three positions, one for each signal, can be opened simultaneously to maximize gains from volatility.
/Results
The backtest results are based on a starting capital of $13,700 (convenient amount for retail traders) with 5% of equity for the position size and pyramiding of 3 to allow one open position at a time for each signal. Commissions vary from broker to broker and they are calculated in different ways so a simple but very high commission of $3 per order is used in backtesting this strategy. Slippage of 3 ticks is used to ensure the results are representative of real world, market order trading. Trades are generated on the close of the candle to avoid bias. The backtest results are available to view at the bottom of this page.
Note:
Past performance in backtesting does not guarantee future results. Broker execution, market changes and trader psychology can significantly affect strategy performance in live trading.
Originality:
The MVS strategy is unique because it is based on data from the futures and options markets. This is data that is not usually accessible or understood by the retail trader hence, volatility strategies are difficult for them to design. The strategy gives retail traders access to a volatility strategy with no parameters, this greatly reduces the risk of curve fitting while increasing robustness.
/Tickers
This strategy has been backtested primarily on SPXL but it is suitable for use on the VIX ETFs.

Dual Regime Strategy (DRS)/Introduction
The Dual Regime Strategy (DRS) is a composite strategy consisting of two signals, both catering to two different market regimes. The stock market experiences periods of high volatility followed by periods of low volatility, a mean reversion strategy performs well during periods of high volatility while a trend following strategy performs well during periods of low volatility. This is the basis for the mean reversion signal and the momentum signal.
/Signals
1. Mean Reversion Signal
Definition: Mean reversion is a financial theory that suggests that asset prices and financial markets tend to fluctuate around a long-term average or mean value. In other words, when the price of an asset moves significantly away from its historical average, it is likely to revert, or move back, towards that average over time.
Concept: Mean reversion assumes that extreme price movements are temporary and that there is an inherent tendency for prices to return to their historical average or equilibrium level. Traders and investors who follow mean reversion strategies often look for overbought or oversold conditions in the market to identify potential trading opportunities. They believe that when prices deviate too far from their mean, there is a higher probability of a reversal.
DRS strategy: The Keltner Channel is a volatility-based technical indicator that consists of three lines: an upper channel, a lower channel, and a middle channel. It is primarily used for mean reversion strategies. The strategy uses a Keltner channel to trigger the mean reversion signals by identifying potential overbought and oversold conditions.
2. Momentum Signal
Definition: Momentum, in the context of financial markets, refers to the tendency of assets to continue moving in the same direction as their recent past price movements. It is based on the idea that assets that have been performing well recently are more likely to continue performing well, and assets that have been performing poorly are more likely to continue performing poorly.
Concept: Momentum traders and investors seek to identify and ride existing price trends. They believe that there is a persistence in price movements, and they aim to capitalize on this persistence by buying assets that have shown recent strength and selling assets that have shown recent weakness.
DRS strategy: The Exponential Moving Average is used to identify the strength and direction of the existing trend. When the price remains above the moving average, it indicates bullish momentum and vice versa for bearish momentum.
/Results
The backtest results are based on a starting capital of $13,700 (convenient amount for retail traders) with 5% of equity for the position size and pyramiding of 2 to allow one open position at a time for each signal. Commissions vary from broker to broker and they are calculated in different ways so a simple $3 per order is used in backtesting this strategy. Slippage of 3 ticks is used to ensure the results are representative of real world, market order trading. The backtest results are available to view at the bottom of this page.
Note:
Past performance in backtesting does not guarantee future results. Broker execution and market changes can significantly affect strategy performance in live trading.
Originality:
The DRS strategy is unique in its combination of both Momentum Strategy and Mean Reversion Strategy components within a single trading strategy. This dual-regime approach allows the strategy to adapt to different market conditions. Additionally, it incorporates short positions for momentum signals, this ensures that the strategy remains active in bear markets.
1. Mean Reverting Regimes
In mean-reverting regimes, markets exhibit high volatility with prices oscillating around a historical average. The DRS employs the Keltner Channel as a core tool for identifying overbought and oversold conditions, which are prevalent in such regimes.
Detection: The strategy detects mean reverting opportunities when prices deviate significantly from the middle band of the Keltner Channel, signaling an overbought or oversold condition.
Execution: Trades are executed with the expectation that prices will revert to the mean. For example, buying when the price is below the lower band (oversold) and selling when it's above the upper band (overbought).
2. Trending Regimes
In trending regimes, markets move in a persistent direction, either up or down. The DRS utilizes the Exponential Moving Average (EMA) to identify and follow these trends.
Trend Identification: The EMA helps in determining the overall direction of the trend, while the number of days price stays above the moving average indicates the strength of the trend.
Trade Execution: The strategy capitalizes on strong trends by taking positions in the direction of the trend (long positions in uptrends and short positions in downtrends).
/Tickers
This strategy has been backtested primarily on SPY. It also performs well on IWF and QQQ.

Multi-Mode Grid StrategyGrid Strategy (SIMPLE)
█ Overview
This script is a system trading tool designed to generate cash flow from market volatility without relying on short-term directional predictions. It operates on the principle of Grid Trading , creating a mesh of buy and sell orders within a user-defined price range.
The strategy automates the process of "buying the dip" and "selling the bounce" repeatedly. It is most effective in sideways markets or during accumulation phases where the price oscillates within a specific channel.
█ TRADING MINDSET & SETUP GUIDE
To use this tool effectively, you must shift your perspective from "Sniper" (trying to hit the perfect entry) to "Manager" (managing a zone). Here is the required mindset for setting up this strategy:
Shift from Prediction to Range Definition
Don't ask: "Will the price go up or down tomorrow?"
Ask instead: "What is the price range the asset is unlikely to break out of in the coming weeks?"
Your primary job is to define the Grid Top Price (Ceiling) and Grid Bottom Price (Floor). As long as the price stays within this "Arena," the strategy will continue to execute trades.
Embrace Volatility as Fuel
For a trend follower, chop/sideways action is a nightmare. For a Grid Trader, it is fuel. Every time the price crosses a grid line down, it builds inventory. Every time it crosses back up, it realizes profit. You want the price to wiggle as much as possible within your defined boundaries.
Capital Allocation & Survivability
The biggest risk in grid trading is the price crashing below your Grid Bottom Price .
Mindset Check: Before launching, assume the price WILL drop to your bottom price immediately. Can your account handle that drawdown?
The script includes leverage and capital percentage inputs to help you size your position correctly. Never allocate 100% of your capital to a tight range without understanding the liquidation risk.
█ HOW IT WORKS
Grid Construction:
The script divides the space between your Upper Border and Lower Border into specific levels based on the Grid Quantity .
- Arithmetic: Equal spacing between lines (Standard).
- Geometric: Spacing based on mathematical ratios (useful for wider ranges).
Execution Logic:
- Entry: When price crosses below a grid line, a Long position is opened.
- Exit: When price bounces back up by a specific number of grid levels (defined by "Distance of TP"), the specific position is closed for a profit.
Time & Backtesting:
You can set specific Start and End Times . This allows you to backtest how the grid would have performed during specific historical volatility events before deploying it on live markets.
█ VISUALIZATION DASHBOARD
To keep you informed without cluttering the chart, the script features an information table at the bottom right:
Cash Out: Total realized profit booked into the account.
Open Position: How many grid levels are currently active (holding bags) vs. total levels.
Open Trade: The current floating P/L of held positions (Unrealized).
Max Drawdown: The deepest drawdown the strategy experienced during the test period.
RISK DISCLAIMER
Grid trading involves significant risk, particularly in strong trending markets that break out of your range against your position. This strategy does not use a stop-loss per trade; it relies on the user defining a safe "Bottom Price" and allocating capital accordingly. Past performance in backtesting does not guarantee future results. This script is a tool for execution and analysis, not financial advice.

Recovery StrategyDescription:
The Recovery Strategy is a long-only trading system designed to capitalize on significant price drops from recent highs. It enters a position when the price falls 10% or more from the highest high over a 6-month lookback period and adds positions on further 2% drops, up to a maximum of 5 positions. Each trade is held for 6 months before exiting, regardless of profit or loss. The strategy uses margin to amplify position sizes, with a default leverage of 5:1 (20% margin requirement). All key parameters are customizable via inputs, allowing flexibility for different assets and timeframes. Visual markers indicate recent highs for reference.
How It Works:
Entry: Buys when the closing price drops 10% or more from the recent high (highest high in the lookback period, default 126 bars ~6 months). If already in a position, additional buys occur on further 2% drops (e.g., 12%, 14%, 16%, 18%), up to 5 positions (pyramiding).
Exit: Each trade exits after its own holding period (default 126 bars ~6 months), regardless of profit or loss. No stop loss or take-profit is used.
Margin: Uses leverage to control larger positions (default 20% margin, 5:1 leverage). The order size is a percentage of equity (default 100%), adjustable via inputs.
Visualization: Displays blue markers (without text) at new recent highs to highlight reference levels.
Inputs:
Lookback Period for High Peak (bars): Number of bars to look back for the recent high (default: 126, ~6 months on daily charts).
Initial Drop Percentage to Buy (%): Percentage drop from recent high to trigger the first buy (default: 10.0%).
Additional Drop Percentage to Buy (%): Further drop percentage to add positions (default: 2.0%).
Holding Period (bars): Number of bars to hold each position before selling (default: 126, ~6 months).
Order Size (% of Equity): Percentage of equity used per trade (default: 100%).
Margin for Long Positions (%): Percentage of position value covered by equity (default: 20%, equivalent to 5:1 leverage).
Usage:
Timeframe: Designed for daily charts (126 bars ~6 months). Adjust Lookback Period and Holding Period for other timeframes (e.g., 1008 hours for hourly charts, assuming 8 trading hours/day).
Assets: Suitable for stocks, ETFs, or other assets with significant price volatility. Test thoroughly on your chosen asset.
Settings: Customize inputs in the strategy settings to match your risk tolerance and market conditions. For example, lower Margin for Long Positions (e.g., to 10% for 10:1 leverage) to increase position sizes, but beware of higher risk.
Backtesting: Use TradingView’s Strategy Tester to evaluate performance. Check the “List of Trades” for skipped trades due to insufficient equity or margin requirements.
Risks and Considerations:
No Stop Loss: The strategy holds trades for the full 6 months without a stop loss, exposing it to significant drawdowns in prolonged downtrends.
Margin Risk: Leverage (default 5:1) amplifies both profits and losses. Ensure sufficient equity to cover margin requirements to avoid skipped trades or simulated margin calls.
Pyramiding: Up to 5 positions can be open simultaneously, increasing exposure. Adjust pyramiding in the code if fewer positions are desired (e.g., change to pyramiding=3).
Market Conditions: Performance depends on price drops and recoveries. Test on historical data to assess effectiveness in your market.
Broker Emulator: TradingView’s paper trading simulates margin but does not execute real margin trading. Results may differ in live trading due to broker-specific margin rules.
How to Use:
Add the strategy to your chart in TradingView.
Adjust input parameters in the settings panel to suit your asset, timeframe, and risk preferences.
Run a backtest in the Strategy Tester to evaluate performance.
Monitor open positions and margin levels in the Trading Panel to manage risk.
For live trading, consult your broker’s margin requirements and leverage policies, as TradingView’s simulation may not match real-world conditions.
Disclaimer:
This strategy is for educational purposes only and does not constitute financial advice. Trading involves significant risk, especially with leverage and no stop loss. Always backtest thoroughly and consult a financial advisor before using any strategy in live trading.

Signalgo Strategy ISignalgo Strategy I: Technical Overview
Signalgo Strategy I is a systematically engineered TradingView strategy script designed to automate, test, and manage trend-following trades using multi-timeframe price/volume logic, volatility-based targets, and multi-layered exit management. This summary covers its operational structure, user inputs, entry and exit methodology, unique technical features, and practical application.
Core Logic and Workflow
Multi-Timeframe Data Synthesis
User-Defined Timeframe: The user chooses a timeframe (e.g., 1H, 4H, 1D, etc.), on which all strategy signals are based.
Cross-Timeframe Inputs: The strategy imports closing price, volume, and Average True Range (ATR) for the selected interval, independently from the chart’s native timeframe, enabling robust multi-timeframe analysis.
Price Change & Volume Ratio: It calculates the percent change of price per bar and computes a volume ratio by comparing current volume to its 20-bar moving average—enabling detection of true “event” moves vs. normal market noise.
Hype Filtering
Anti-Hype Mechanism: An entry is automatically filtered out if abnormal high volume occurs without corresponding price movement, commonly observed during manipulation or announcement periods. This helps isolate genuine market-driven momentum.
User Inputs
Select Timeframe: Choose which interval drives signal generation.
Backtest Start Date: Specify from which date historical signals are included in the strategy (for precise backtests).
Take-Profit/Stop-Loss Configuration: Internally, risk levels are set as multiples of ATR and allow for three discrete profit targets.
Entry Logic
Trade Signal Criteria:
Price change magnitude in the current bar must exceed a fixed sensitivity threshold.
Volume for the bar must be significantly elevated compared to average, indicating meaningful participation.
Anti-hype check must not be triggered.
Bullish/Bearish Determination: If all conditions are met and price change direction is positive, a long signal triggers. If negative, a short signal triggers.
Signal Debouncing: Ensures a signal triggers only when a new condition emerges, avoiding duplicate entries on flat or choppy bars.
State Management: The script tracks whether an active long or short is open to avoid overlapping entries and to facilitate clean reversals.
Exit Strategy
Take-Profits: Three distinct profit targets (TP1, TP2, TP3) are calculated as fixed multiples of the ATR-based stop loss, adapting dynamically to volatility.
Reversals: If a buy signal appears while a short is open (or vice versa), the existing trade is closed and reversed in a single step.
Time-Based Exit: If, 49 bars after entry, the trade is in-profit but hasn’t reached TP1, it exits to avoid stagnation risk.
Adverse Move Exit: The position is force-closed if it suffers a 10% reversal from entry, acting as a catastrophic stop.
Visual Feedback: Each TP/SL/exit is plotted as a clear, color-coded line on the chart; no hidden logic is used.
Alerts: Built-in TradingView alert conditions allow automated notification for both entries and strategic exits.
Distinguishing Features vs. Traditional MA Strategies
Event-Based, Not Just Slope-Based: While classic moving average strategies enter trades on MA crossovers or slope changes, Signalgo Strategy I demands high-magnitude price and volume confirmation on the chosen timeframe.
Volume Filtering: Very few MA strategies independently filter for meaningful volume spikes.
Real Market Event Focus: The anti-hype filter differentiates organic market trends from manipulated “high-volume, no-move” sessions.
Three-Layer Exit Logic: Instead of a single trailing stop or fixed RR, this script manages three profit targets, time-based closures, and hard adverse thresholds.
Multi-Timeframe, Not Chart-Dependent: The “main” analytical interval can be set independently from the current chart, allowing for in-depth cross-timeframe backtests and system runs.
Reversal Handling: Automatic handling of signal reversals closes and flips positions precisely, reducing slippage and manual error.
Persistent State Tracking: Maintains variables tracking entry price, trade status, and target/stop levels independently of chart context.
Trading Application
Strategy Sandbox: Designed for robust backtesting, allowing users to simulate performance across historical data for any major asset or interval.
Active Risk Management: Trades are consistently managed for both fixed interval “stall” and significant loss, not just via trailing stops or fixed-day closes.
Alert Driven: Can power algorithmic trading bots or notify discretionary traders the moment a qualifying market event occurs.

Timeshifter Triple Timeframe Strategy w/ SessionsOverview
The "Enhanced Timeshifter Triple Timeframe Strategy with Session Filtering" is a sophisticated trading strategy designed for the TradingView platform. It integrates multiple technical indicators across three different timeframes and allows traders to customize their trading Sessions. This strategy is ideal for traders who wish to leverage multi-timeframe analysis and session-based trading to enhance their trading decisions.
Features
Multi-Timeframe Analysis and direction:
Higher Timeframe: Set to a daily timeframe by default, providing a broader view of market trends.
Trading Timeframe: Automatically set to the current chart timeframe, ensuring alignment with the trader's primary analysis period.
Lower Timeframe: Set to a 15-minute timeframe by default, offering a granular view for precise entry and exit points.
Indicator Selection:
RMI (Relative Momentum Index): Combines RSI and MFI to gauge market momentum.
TWAP (Time Weighted Average Price): Provides an average price over a specified period, useful for identifying trends.
TEMA (Triple Exponential Moving Average): Reduces lag and smooths price data for trend identification.
DEMA (Double Exponential Moving Average): Similar to TEMA, it reduces lag and provides a smoother trend line.
MA (Moving Average): A simple moving average for basic trend analysis.
MFI (Money Flow Index): Measures the flow of money into and out of a security, useful for identifying overbought or oversold conditions.
VWMA (Volume Weighted Moving Average): Incorporates volume data into the moving average calculation.
PSAR (Parabolic SAR): Identifies potential reversals in price movement.
Session Filtering:
London Session: Trade during the London market hours (0800-1700 GMT+1).
New York Session: Trade during the New York market hours (0800-1700 GMT-5).
Tokyo Session: Trade during the Tokyo market hours (0900-1800 GMT+9).
Users can select one or multiple sessions to align trading with specific market hours.
Trade Direction:
Long: Only long trades are permitted.
Short: Only short trades are permitted.
Both: Both long and short trades are permitted, providing flexibility based on market conditions.
ADX Confirmation:
ADX (Average Directional Index): An optional filter to confirm the strength of a trend before entering a trade.
How to Use the Script
Setup:
Add the script to your TradingView chart.
Customize the input parameters according to your trading preferences and strategy requirements.
Indicator Selection:
Choose the primary indicator you wish to use for generating trading signals from the dropdown menu.
Enable or disable the ADX confirmation based on your preference for trend strength analysis.
Session Filtering:
Select the trading sessions you wish to trade in. You can choose one or multiple Sessions based on your trading strategy and market focus.
Trade Direction:
Set your preferred trade direction (Long, Short, or Both) to align with your market outlook and risk tolerance. You can use this feature to gauge the market and understand the possible directions.
Tips for Profitable and Safe Trading:
Recommended Timeframes Combination:
LT: 1m , CT: 5m, HT: 1H
LT: 1-5m , CT: 15m, HT: 4H
LT: 5-15m , CT: 4H, HT: 1W
Backtesting:
Always backtest the strategy on historical data to understand its performance under various market conditions.
Adjust the parameters based on backtesting results to optimize the strategy for your specific trading style.
Risk Management:
Use appropriate risk management techniques, such as setting stop-loss and take-profit levels, to protect your capital.
Avoid over-leveraging and ensure that you are trading within your risk tolerance.
Market Analysis:
Combine the script with other forms of market analysis, such as fundamental analysis or market sentiment, to make well-rounded trading decisions.
Stay informed about major economic events and news that could impact market volatility and trading sessions.
Continuous Monitoring:
Regularly monitor the strategy's performance and make adjustments as necessary.
Keep an eye on the results and settings for real-time statistics and ensure that the strategy aligns with current market conditions.
Education and Practice:
Continuously educate yourself on trading strategies and market dynamics.
Practice using the strategy in a demo account before applying it to live trading to gain confidence and understanding.

Anomaly Counter-Trend StrategyA mean-reversion style strategy that automatically spots unusually large price moves over a configurable lookback period and takes the opposite side, with full risk-management, commission and slippage modeling—built in Pine Script® v6.
🔎 Overview
ACTS monitors the percent-change over the past N minutes and, when that move exceeds your chosen threshold, enters a counter-trend position (short on a strong rise; long on a sharp fall). It’s ideal for markets that often “overshoot” and snap back, and can be applied on any symbol or timeframe.
⚙️ Key Features
Anomaly Detection: Detect abnormal price swings based on a user-defined % change over a lookback period.
Counter-Trend Entries: Auto-enter short on rise anomalies, long on fall anomalies (with seamless flat↔reverse transitions).
Risk Management: Configurable stop-loss and take-profit in ticks per trade.
Realistic Modeling: Simulates commissions (0.05 % default), slippage (2 ticks), and percent-of-equity sizing.
Immediate Bar-Close Execution: Orders processed on bar close for faster fills.
Visual Aids: Optional on-chart BUY/SELL triangles and background highlights during anomaly periods.
⚙️ Inputs
Input Default Description
Percentage Threshold (%) 2.00 Min % move over lookback to trigger an anomaly.
Lookback Period (Minutes) 15 Number of minutes over which to measure change.
Stop Loss (Ticks) 100 Distance from entry for stop-loss exit.
Take Profit (Ticks) 200 Distance from entry for take-profit exit.
Plot Trade Signal Shapes (on/off) true Show BUY/SELL triangles on chart.
Highlight Anomaly Background true Shade background during anomaly bars.
📊 How to Use
Add to Chart: Apply the script to any ticker & timeframe.
Tune: Adjust your percentage threshold and lookback to match each instrument’s volatility.
Review Backtest: Check built-in strategy performance (drawdown, Sharpe, etc.) under the Strategy Tester tab.
Go Live: Once optimized, link to alerts or your trade execution system.
⚠️ Disclaimer
This script is provided “as-is” for educational purposes and backtesting only. Past performance does not guarantee future results. Always backtest thoroughly, manage your own risk, and consider market conditions before live trading.
Enjoy experimenting—and may your counter-trend entries catch the next big snapback!
Supertrend + MACD CrossoverKey Elements of the Template:
Supertrend Settings:
supertrendFactor: Adjustable to control the sensitivity of the Supertrend.
supertrendATRLength: ATR length used for Supertrend calculation.
MACD Settings:
macdFastLength, macdSlowLength, macdSignalSmoothing: These settings allow you to fine-tune the MACD for better results.
Risk Management:
Stop-Loss: The stop-loss is based on the ATR (Average True Range), a volatility-based indicator.
Take-Profit: The take-profit is based on the risk-reward ratio (set to 3x by default).
Both stop-loss and take-profit are dynamic, based on ATR, which adjusts according to market volatility.
Buy and Sell Signals:
Buy Signal: Supertrend is bullish, and MACD line crosses above the Signal line.
Sell Signal: Supertrend is bearish, and MACD line crosses below the Signal line.
Visual Elements:
The Supertrend line is plotted in green (bullish) and red (bearish).
Buy and Sell signals are shown with green and red triangles on the chart.
Next Steps for Optimization:
Backtesting:
Run backtests on BTC in the 5-minute timeframe and adjust parameters (Supertrend factor, MACD settings, risk-reward ratio) to find the optimal configuration for the 60% win ratio.
Fine-Tuning Parameters:
Adjust supertrendFactor and macdFastLength to find more optimal values based on BTC's market behavior.
Tweak the risk-reward ratio to maximize profitability while maintaining a good win ratio.
Evaluate Market Conditions:
The performance of the strategy can vary based on market volatility. It may be helpful to evaluate performance in different market conditions or pair it with a filter like RSI or volume.
Let me know if you'd like further tweaks or explanations!

Equilibrium Candles + Pattern [Honestcowboy]The Equilibrium Candles is a very simple trend continuation or reversal strategy depending on your settings.
How an Equilibrium Candle is created:
We calculate the equilibrium by measuring the mid point between highest and lowest point over X amount of bars back.
This now is the opening price for each bar and will be considered a green bar if price closes above equilibrium.
Bars get shaded by checking if regular candle close is higher than open etc. So you still see what the normal candles are doing.
Why are they useful?
The equilibrium is calculated the same as Baseline in Ichimoku Cloud. Which provides a point where price is very likely to retrace to. This script visualises the distance between close and equilibrium using candles. To provide a clear visual of how price relates to this equilibrium point.
This also makes it more straightforward to develop strategies based on this simple concept and makes the trader purely focus on this relationship and not think of any Ichimoku Cloud theories.
Script uses a very simple pattern to enter trades:
It will count how many candles have been one directional (above or below equilibrium)
Based on user input after X candles (7 by default) script shows we are in a trend (bg colors)
On the first pullback (candle closes on other side of equilibrium) it will look to enter a trade.
Places a stop order at the high of the candle if bullish trend or reverse if bearish trend.
If based on user input after X opposite candles (2 by default) order is not filled will cancel it and look for a new trend.
Use Reverse Logic:
There is a use reverse logic in the settings which on default is turned on. It will turn long orders into short orders making the stop orders become limit orders. It will use the normal long SL as target for the short. And TP as stop for the short. This to provide a means to reverse equity curve in case your pair is mean reverting by nature instead of trending.
ATR Calculation:
Averaged ATR, which is using ta.percentile_nearest_rank of 60% of a normal ATR (14 period) over the last 200 bars. This in simple words finds a value slightly above the mean ATR value over that period.
Big Candle Exit Logic:
Using Averaged ATR the script will check if a candle closes X times that ATR from the equilibrium point. This is then considered an overextension and all trades are closed.
This is also based on user input.
Simple trade management logic:
Checks if the user has selected to use TP and SL, or/and big candle exit.
Places a TP and SL based on averaged ATR at a multiplier based on user Input.
Closes trade if there is a Big Candle Exit or an opposite direction signal from indicator.
Script can be fully automated to MT5
There are risk settings in % and symbol settings provided at the bottom of the indicator. The script will send alert to MT5 broker trying to mimic the execution that happens on tradingview. There are always delays when using a bridge to MT5 broker and there could be errors so be mindful of that. This script sends alerts in format so they can be read by tradingview.to which is a bridge between the platforms.
Use the all alert function calls feature when setting up alerts and make sure you provide the right webhook if you want to use this approach.
There is also a simple buy and sell alert feature if you don't want to fully automate but still get alerts. These are available in the dropdown when creating an alert.
Almost every setting in this indicator has a tooltip added to it. So if any setting is not clear hover over the (?) icon on the right of the setting.
The backtest uses a 4% exposure per trade and a 10 point slippage. I did not include a commission cause I'm not personaly aware what the commissions are on most forex brokers. I'm only aware of minimal slippage to use in a backtest. Trading conditions vary per broker you use so always pay close attention to trading costs on your own broker. Use a full automation at your own risk and discretion and do proper backtesting.

TradingView.To Strategy Template (with Dyanmic Alerts)Hello traders,
If you're tired of manual trading and looking for a solid strategy template to pair with your indicators, look no further.
This Pine Script v5 strategy template is engineered for maximum customization and risk management.
Best part?
This Pine Script v5 template facilitates the dynamic construction of TradingView.TO alerts, sparing users the time and effort of mastering the TradingView.TO syntax and manually create alert commands.
This powerful tool gives much power to those who don't know how to code in Pinescript and want to automate their indicators' signals via TradingView.TO bot.
IMPORTANT NOTES
TradingView.TO is a trading bot software that forwards TradingView alerts to your brokers (examples: Binance, Oanda, Coinbase, Bybit, Metatrader 4/5, ...) for automating trading.
Many traders don't know how to create TradingView.TO dynamically-compatible alerts using the data from their TradingView scripts.
Traders using trading bots want their alerts to reflect the stop-loss/take-profit/trailing-stop/stop-loss to break options from your script and then create the orders accordingly.
This script showcases how to create TradingView.TO alerts dynamically.
TRADINGVIEW ALERTS
1) You'll have to create one alert per asset X timeframe = 1 chart.
Example: 1 alert for BTC/USDT on the 5 minutes chart, 1 alert for BTC/USDT on the 15-minute chart (assuming you want your bot to trade the BTC/USDT on the 5 and 15-minute timeframes)
2) Select the Order fills and alert() function calls condition
3) For each alert, the alert message is pre-configured with the text below
{{strategy.order.alert_message}}
Please leave it as it is.
It's a TradingView native variable that will fetch the alert text messages built by the script.
4) TradingView.TO uses webhook technology - setting a webhook URL from the alerts notifications tab is required.
KEY FEATURES
I) Modular Indicator Connection
* plug your existing indicator into the template.
* Only two lines of code are needed for full compatibility.
Step 1: Create your connector
Adapt your indicator with only 2 lines of code and then connect it to this strategy template.
To do so:
1) Find in your indicator where the conditions print the long/buy and short/sell signals.
2) Create an additional plot as below
I'm giving an example with a Two moving averages cross.
Please replicate the same methodology for your indicator, whether a MACD , ZigZag, Pivots , higher-highs, lower-lows or whatever indicator with clear buy and sell conditions.
//@version=5
indicator("Supertrend", overlay = true, timeframe = "", timeframe_gaps = true)
atrPeriod = input.int(10, "ATR Length", minval = 1)
factor = input.float(3.0, "Factor", minval = 0.01, step = 0.01)
= ta.supertrend(factor, atrPeriod)
supertrend := barstate.isfirst ? na : supertrend
bodyMiddle = plot(barstate.isfirst ? na : (open + close) / 2, display = display.none)
upTrend = plot(direction < 0 ? supertrend : na, "Up Trend", color = color.green, style = plot.style_linebr)
downTrend = plot(direction < 0 ? na : supertrend, "Down Trend", color = color.red, style = plot.style_linebr)
fill(bodyMiddle, upTrend, color.new(color.green, 90), fillgaps = false)
fill(bodyMiddle, downTrend, color.new(color.red, 90), fillgaps = false)
buy = ta.crossunder(direction, 0)
sell = ta.crossunder(direction, 0)
//////// CONNECTOR SECTION ////////
Signal = buy ? 1 : sell ? -1 : 0
plot(Signal, title = "Signal", display = display.data_window)
//////// CONNECTOR SECTION ////////
Important Notes
🔥 The Strategy Template expects the value to be exactly 1 for the bullish signal and -1 for the bearish signal
Now, you can connect your indicator to the Strategy Template using the method below or that one.
Step 2: Connect the connector
1) Add your updated indicator to a TradingView chart
2) Add the Strategy Template as well to the SAME chart
3) Open the Strategy Template settings, and in the Data Source field, select your 🔌Connector🔌 (which comes from your indicator)
Note it doesn’t have to be named 🔌Connector🔌 - you can name it as you want - however, I recommend an explicit name you can easily remember.
From then, you should start seeing the signals and plenty of other stuff on your chart.
🔥 Note that whenever you update your indicator values, the strategy statistics and visuals on your chart will update in real-time
II) BOT Risk Management:
- Max Drawdown:
Mode: Select whether the max drawdown is calculated in percentage (%) or USD.
Value: If the max drawdown reaches this specified value, set a value to halt the bot.
- Max Consecutive Days:
Use Max Consecutive Days BOT Halt: Enable/Disable halting the bot if the max consecutive losing days value is reached.
- Max Consecutive Days: Set the maximum number of consecutive losing days allowed before halting the bot.
- Max Losing Streak:
Use Max Losing Streak: Enable/Disable a feature to prevent the bot from taking too many losses in a row.
- Max Losing Streak Length: Set the maximum length of a losing streak allowed.
Margin Call:
- Use Margin Call: Enable/Disable a feature to exit when a specified percentage away from a margin call to prevent it.
Margin Call (%): Set the percentage value to trigger this feature.
- Close BOT Total Loss:
Use Close BOT Total Loss: Enable/Disable a feature to close all trades and halt the bot if the total loss is reached.
- Total Loss ($): Set the total loss value in USD to trigger this feature.
Intraday BOT Risk Management:
- Intraday Losses:
Use Intraday Losses BOT Halt: Enable/Disable halting the bot on reaching specified intraday losses.
Mode: Select whether the intraday loss is calculated in percentage (%) or USD.
- Max Intraday Losses (%): Set the value for maximum intraday losses.
Limit Intraday Trades:
- Use Limit Intraday Trades: Enable/Disable a feature to limit the number of intraday trades.
- Max Intraday Trades: Set the maximum number of intraday trades allowed.
Restart Intraday EA:
III) Order Types and Position Sizing
- Choose between market or limit orders.
- Set your position size directly in the template.
Please use the position size from the “Inputs” and not the “Properties” tab.
I know it's redundant. - the template needs this value from the "Inputs" tab to build the alerts, and the Backtester needs it from the "Properties" tab.
IV) Advanced Take-Profit and Stop-Loss Options
- Choose to set your SL/TP in either USD or percentages.
- Option for multiple take-profit levels and trailing stop losses.
- Move your stop loss to break even +/- offset in USD for “risk-free” trades.
V) Miscellaneous:
Retry order openings if they fail.
Order Types:
Select and specify order type and price settings.
Position Size:
Define the type and size of positions.
Leverage:
Leverage settings, including margin type and hedge mode.
Session:
Limit trades to specific sessions.
Dates:
Limit trades to a specific date range.
Trades Direction:
Direction: Specify the market direction for opening positions.
VI) Logger
The TradingView.TO commands are logged in the TradingView logger.
You'll find more information about it in this TradingView blog post .
WHY YOU MIGHT NEED THIS TEMPLATE
1) Transform your indicator into a TradingView.TO trading bot more easily than before
Connect your indicator to the template
Create your alerts
Set your EA settings
2) Save Time
Auto-generated alert messages for TradingView.TO.
I tested them all and checked with the support team what could/couldn’t be done.
3) Be in Control
Manage your trading risks with advanced features.
4) Customizable
Fits various trading styles and asset classes.
REQUIREMENTS
* Make sure you have your TradingView.TO account
* If there is any issue with the template, ask me in the comments section - I’ll answer quickly.
BACKTEST RESULTS FROM THIS POST
1) I connected this strategy template to a dummy Supertrend script.
I could have selected any other indicator or concept for this script post.
I wanted to share an example of how you can quickly upgrade your strategy, making it compatible with TradingView.TO.
2) The backtest results aren't relevant for this educational script publication.
I used realistic backtesting data but didn't look too much into optimizing the results, as this isn't the point of why I'm publishing this script.
This strategy is a template to be connected to any indicator - the sky is the limit. :)
3) This template is made to take 1 trade per direction at any given time.
Pyramiding is set to 1 on TradingView.
The strategy default settings are:
* Initial Capital: 100000 USD
* Position Size: 1%
* Commission Percent: 0.075%
* Slippage: 1 tick
* No margin/leverage used

ProfitView Strategy TemplateHello traders,
This script took me a full week of coding/testing, sweat, and tears - and I’m too nice as I’m giving it for free to the community.
If you're tired of manual trading and looking for a solid strategy template to pair with your indicators, look no further.
This Pine Script v5 strategy template is engineered for maximum customization and risk management.
Best part?
This Pine Script v5 template facilitates the dynamic construction of ProfitView alerts, sparing users the time and effort of mastering the ProfitView syntax and manually creating alert commands.
This powerful tool gives much power to those who don't know how to code in Pinescript and want to automate their indicators' signals via the ProfitView Chrome extension.
IMPORTANT NOTES
ProfitView is a trading bot software that forwards TradingView alerts to your brokers (examples: Binance, Oanda, Coinbase, Bybit, etc.) for automating trading.
Many traders don't know how to dynamically create ProfitView-compatible alerts using the data from their TradingView scripts.
Traders using trading bots want their alerts to reflect the stop-loss/take-profit/trailing-stop/stop-loss to break options from your script and then create the orders accordingly.
This script showcases how to create ProfitView alerts dynamically.
TRADINGVIEW ALERTS
1) You'll have to create one alert per asset X timeframe = 1 chart.
Example: 1 alert for EUR/USD on the 5 minutes chart, 1 alert for EUR/USD on the 15-minute chart (assuming you want your bot to trade the EUR/USD on the 5 and 15-minute timeframes)
2) Select the Order fills and alert() function calls condition
3) For each alert, the alert message is pre-configured with the text below
{{strategy.order.alert_message}}
Please leave it as it is.
It's a TradingView native variable that will fetch the alert text messages built by the script.
4) ProfitView doesn't use webhook technology, so setting a webhook URL from the alerts notifications tab is unnecessary.
KEY FEATURES
I) Modular Indicator Connection
* plug your existing indicator into the template.
* Only two lines of code are needed for full compatibility.
Step 1: Create your connector
Adapt your indicator with only 2 lines of code and then connect it to this strategy template.
To do so:
1) Find in your indicator where the conditions print the long/buy and short/sell signals.
2) Create an additional plot as below
I'm giving an example with a Two moving averages cross.
Please replicate the same methodology for your indicator, whether a MACD , ZigZag, Pivots , higher-highs, lower-lows or whatever indicator with clear buy and sell conditions.
//@version=5
indicator("Supertrend", overlay = true, timeframe = "", timeframe_gaps = true)
atrPeriod = input.int(10, "ATR Length", minval = 1)
factor = input.float(3.0, "Factor", minval = 0.01, step = 0.01)
= ta.supertrend(factor, atrPeriod)
supertrend := barstate.isfirst ? na : supertrend
bodyMiddle = plot(barstate.isfirst ? na : (open + close) / 2, display = display.none)
upTrend = plot(direction < 0 ? supertrend : na, "Up Trend", color = color.green, style = plot.style_linebr)
downTrend = plot(direction < 0 ? na : supertrend, "Down Trend", color = color.red, style = plot.style_linebr)
fill(bodyMiddle, upTrend, color.new(color.green, 90), fillgaps = false)
fill(bodyMiddle, downTrend, color.new(color.red, 90), fillgaps = false)
buy = ta.crossunder(direction, 0)
sell = ta.crossunder(direction, 0)
//////// CONNECTOR SECTION ////////
Signal = buy ? 1 : sell ? -1 : 0
plot(Signal, title = "Signal", display = display.data_window)
//////// CONNECTOR SECTION ////////
Important Notes
🔥 The Strategy Template expects the value to be exactly 1 for the bullish signal and -1 for the bearish signal
Now, you can connect your indicator to the Strategy Template using the method below or that one.
Step 2: Connect the connector
1) Add your updated indicator to a TradingView chart
2) Add the Strategy Template as well to the SAME chart
3) Open the Strategy Template settings, and in the Data Source field, select your 🔌Connector🔌 (which comes from your indicator)
Note it doesn’t have to be named 🔌Connector🔌 - you can name it as you want - however, I recommend an explicit name you can easily remember.
From then, you should start seeing the signals and plenty of other stuff on your chart.
🔥 Note that whenever you update your indicator values, the strategy statistics and visuals on your chart will update in real-time
II) BOT Risk Management:
- Max Drawdown:
Mode: Select whether the max drawdown is calculated in percentage (%) or USD.
Value: If the max drawdown reaches this specified value, set a value to halt the bot.
- Max Consecutive Days:
Use Max Consecutive Days BOT Halt: Enable/Disable halting the bot if the max consecutive losing days value is reached.
- Max Consecutive Days: Set the maximum number of consecutive losing days allowed before halting the bot.
- Max Losing Streak:
Use Max Losing Streak: Enable/Disable a feature to prevent the bot from taking too many losses in a row.
- Max Losing Streak Length: Set the maximum length of a losing streak allowed.
Margin Call:
- Use Margin Call: Enable/Disable a feature to exit when a specified percentage away from a margin call to prevent it.
Margin Call (%): Set the percentage value to trigger this feature.
- Close BOT Total Loss:
Use Close BOT Total Loss: Enable/Disable a feature to close all trades and halt the bot if the total loss is reached.
- Total Loss ($): Set the total loss value in USD to trigger this feature.
Intraday BOT Risk Management:
- Intraday Losses:
Use Intraday Losses BOT Halt: Enable/Disable halting the bot on reaching specified intraday losses.
Mode: Select whether the intraday loss is calculated in percentage (%) or USD.
- Max Intraday Losses (%): Set the value for maximum intraday losses.
Limit Intraday Trades:
- Use Limit Intraday Trades: Enable/Disable a feature to limit the number of intraday trades.
- Max Intraday Trades: Set the maximum number of intraday trades allowed.
Restart Intraday EA:
- Use Restart Intraday EA: Enable/Disable a feature to restart the bot at the first bar of the next day if it has been stopped with an intraday risk management safeguard.
III) Order Types and Position Sizing
- Choose between market, limit, or stop orders.
- Set your position size directly in the template.
Please use the position size from the “Inputs” and not the “Properties” tab.
I know it's redundant. - the template needs this value from the "Inputs" tab to build the alerts, and the Backtester needs it from the "Properties" tab.
IV) Advanced Take-Profit and Stop-Loss Options
- Choose to set your SL/TP in either pips or percentages.
- Option for multiple take-profit levels and trailing stop losses.
- Move your stop loss to break even +/- offset in pips for “risk-free” trades.
V) Miscellaneous
Retry order openings if they fail.
Order Types:
Select and specify order type and price settings.
Position Size:
Define the type and size of positions.
Leverage:
Leverage settings, including margin type and hedge mode.
Session:
Limit trades to specific sessions.
Dates:
Limit trades to a specific date range.
Trades Direction:
Direction: Specify the market direction for opening positions.
VI) Notifications (Telegram/Discord/Email/IFTTT/Twilio/SMS)
Customize notifications sent to Telegram, Discord, Email, IFTTT, Twilio, and ProfitView Logger.
VII) Logger
The ProfitView commands are logged in the TradingView logger.
You'll find more information about it in this TradingView blog post .
WHY YOU MIGHT NEED THIS TEMPLATE
1) Transform your indicator into a ProfitView trading bot more easily than before
Connect your indicator to the template
Create your alerts
Set your EA settings
2) Save Time
Auto-generated alert messages for ProfitView.
I tested them all and checked with the support team what could/couldn’t be done.
3) Be in Control
Manage your trading risks with advanced features.
4) Customizable
Fits various trading styles and asset classes.
REQUIREMENTS
* Make sure you have your ProfitView account and do the settings correctly in your Chrome extension. If you don't know how to do it, read the documentation + ask for help in the ProfitView Discord support channel.
* If there is any issue with the template, ask me in the comments section - I’ll answer quickly.
BACKTEST RESULTS FROM THIS POST
1) I connected this strategy template to a dummy Supertrend script.
I could have selected any other indicator or concept for this script post.
I wanted to share an example of how you can quickly upgrade your strategy, making it compatible with ProfitView.
2) The backtest results aren't relevant for this educational script publication.
I used realistic backtesting data but didn't look too much into optimizing the results, as this isn't the point of why I'm publishing this script.
This strategy is a template to be connected to any indicator - the sky is the limit. :)
3) This template is made to take 1 trade per direction at any given time.
Pyramiding is set to 1 on TradingView.
The strategy default settings are:
* Initial Capital: 100000 USD
* Position Size: 1%
* Commission Percent: 0.075%
* Slippage: 1 tick
* No margin/leverage used
Best regards,
Dave

EMA bands + leledc + bollinger bands trend following strategy v2The basics:
In its simplest form, this strategy is a positional trend following strategy which enters long when price breaks out above "middle" EMA bands and closes or flips short when price breaks down below "middle" EMA bands. The top and bottom of the middle EMA bands are calculated from the EMA of candle highs and lows, respectively.
The idea is that entering trades on breakouts of the high EMAs and low EMAs rather than the typical EMA based on candle closes gives a bit more confirmation of trend strength and minimizes getting chopped up. To further reduce getting chopped up, the strategy defaults to close on crossing the opposite EMA band (ie. long on break above high EMA middle band and close below low EMA middle band).
This strategy works on all markets on all timeframes, but as a trend following strategy it works best on markets prone to trending such as crypto and tech stocks. On lower timeframes, longer EMAs tend to work best (I've found good results on EMA lengths even has high up to 1000), while 4H charts and above tend to work better with EMA lengths 21 and below.
As an added filter to confirm the trend, a second EMA can be used. Inputting a slower EMA filter can ensure trades are entered in accordance with longer term trends, inputting a faster EMA filter can act as confirmation of breakout strength.
Bar coloring can be enabled to quickly visually identify a trend's direction for confluence with other indicators or strategies.
The goods:
Waiting for the trend to flip before closing a trade (especially when a longer base EMA is used) often leaves money on the table. This script combines a number of ways to identify when a trend is exhausted for backtesting the best early exits.
"Delayed bars inside middle bands" - When a number of candle's in a row open and close between the middle EMA bands, it could be a sign the trend is weak, or that the breakout was not the start of a new trend. Selecting this will close out positions after a number of bars has passed
"Leledc bars" - Originally introduced by glaz, this is a price action indicator that highlights a candle after a number of bars in a row close the same direction and result in greatest high/low over a period. It often triggers when a strong trend has paused before further continuation, or it marks the end of a trend. To mitigate closing on false Leledc signals, this strategy has two options: 1. Introducing requirement for increased volume on the Leledc bars can help filter out Leledc signals that happen mid trend. 2. Closing after a number of Leledc bars appear after position opens. These two options work great in isolation but don't perform well together in my testing.
"Bollinger Bands exhaustion bars" - These bars are highlighted when price closes back inside the Bollinger Bands and RSI is within specified overbought/sold zones. The idea is that a trend is overextended when price trades beyond the Bollinger Bands. When price closes back inside the bands it's likely due for mean reversion back to the base EMA in which this strategy will ideally re-enter a position. Since the added RSI requirements often make this indicator too strict to trigger a large enough sample size to backtest, I've found it best to use "non-standard" settings for both the bands and the RSI as seen in the default settings.
"Buy/Sell zones" - Similar to the idea behind using Bollinger Bands exhaustion bars as a closing signal. Instead of calculating off of standard deviations, the Buy/Sell zones are calculated off multiples of the middle EMA bands. When trading beyond these zones and subsequently failing back inside, price may be due for mean reversion back to the base EMA. No RSI filter is used for Buy/Sell zones.
If any early close conditions are selected, it's often worth enabling trade re-entry on "middle EMA band bounce". Instead of waiting for a candle to close back inside the middle EMA bands, this feature will re-enter position on only a wick back into the middle bands as will sometimes happen when the trend is strong.
Any and all of the early close conditions can be combined. Experimenting with these, I've found can result in less net profit but higher win-rates and sharpe ratios as less time is spent in trades.
The deadly:
The trend is your friend. But wouldn't it be nice to catch the trends early? In ranging markets (or when using slower base EMAs in this strategy), waiting for confirmation of a breakout of the EMA bands at best will cause you to miss half the move, at worst will result in getting consistently chopped up. Enabling "counter-trend" trades on this strategy will allow the strategy to enter positions on the opposite side of the EMA bands on either a Leledc bar or Bollinger Bands exhaustion bar. There is a filter requiring either a high/low (for Leledc) or open (for BB bars) outside the selected inner or outer Buy/Sell zone. There are also a number of different close conditions for the counter-trend trades to experiment with and backtest.
There are two ways I've found best to use counter-trend trades
1. Mean reverting scalp trades when a trend is clearly overextended. Selecting from the first 5 counter-trend closing conditions on the dropdown list will usually close the trades out quickly, with less profit but less risk.
2. Trying to catch trends early. Selecting any of the close conditions below the first 5 can cause the strategy to behave as if it's entering into a new trend (from the wrong side).
This feature can be deadly effective in profiting from every move price makes, or deadly to the strategy's PnL if not set correctly. Since counter-trend trades open opposite the middle bands, a stop-loss is recommended to reduce risk. If stop-losses for counter-trend trades are disabled, the strategy will hold a position open often until liquidation in a trending market if th trade is offsides. Note that using a slower base EMA makes counter-trend stop-losses even more necessary as it can reduce the effectiveness of the Buy/Sell zone filter for opening the trades as price can spend a long time trending outside the zones. If faster EMAs (34 and below) are used with "Inner" Buy/Zone filter selected, the first few closing conditions will often trigger almost immediately closing the trade at a loss.
The niche:
I've added a feature to default into longs or shorts. Enabling these with other features (aside from the basic long/short on EMA middle band breakout) tends to break the strategy one way or another. Enabling default long works to simulate trying to acquire more of the asset rather than the base currency. Enabling default short can have positive results for those high FDV, high inflation coins that go down-only for months at a time. Otherwise, I use default short as a hedge for coins that I hold and stake spot. I gain the utility and APR of staking while reducing the risk of holding the underlying asset by maintaining a net neutral position *most* of the time.
Disclaimer:
This script is intended for experimenting and backtesting different strategies around EMA bands. Use this script for your live trading at your own risk. I am a rookie coder, as such there may be errors in the code that cause the strategy to behave not as intended. As far as I can tell it doesn't repaint, but I cannot guarantee that it does not. That being said if there's any question, improvements, or errors you've found, drop a comment below!

Multiple Timeframe RSI Bot for 3commas (works w/o 3commas too)Overview
A few days ago I wrote a new RSI-based strategy. The idea was that you could set up buy and sell RSI thresholds and when RSI crossed that threshold it would make a buy or a sell depending on which one it hit. It worked very well on multiple coins that I tested. I then started to think that maybe there was a better way to execute this concept using multiple timeframe RSIs and this bot represents that idea. It is better and more versatile than the previous bot in every single way. In fact at this point I think this is my most elegant bot to date. It's not as flashy as my other scipts but it is an extremely reliable performer and comes with lower risk than some of my other more outlandish automated trading ideas.
Concept
This script monitors the RSI of all timeframes you have picked in settings and displays chosen values on your chart. It defaults to 5m, 15m and 30m enabled with the rest of the timeframe options disabled and it will only show the RSI chart of timeframes you are currently using. You can specify one or more (in any combination) from the following list:
1m
5m
15m
30m
1h
4h
1d
1w
On each bar it checks each timeframe's RSI value to see if it is is lower (for a buy) or higher (for a sell) than the respective threshold you have picked in settings for that timeframe. On any given bar if enough of your used RSI values are above or below their respective thresholds to be equal to or greater than your set Number of Thresholds for Buy value a buy or sell is executed. In other words, when the number of total (different timeframed) RSI buy thresholds currently met is equal to or greater than the Number of Thresholds for a Buy value you set in settings, a buy is placed. Similarly, when the total number of differently timeframed RSI sell thresholds currently hit is equal to or greater than the total sell threshold you have in settings, a sell is placed.
I have had the best results using 5m, 15 and 30m together with the total threshold value for both buys and sells set to three which is what I left as the default. However, there are limitless ways to use this and I'm sure that over the coming months I will come up with some more creative ways to use it. Please experiment a bit and if you feel like sharing you can comment on this page as to what you find works best.
Like all my scripts this includes a date backtester. I have the start date set to Nov 1, 2021 because I feel you should never backtest a new strategy on older data if you don't specifically have a reason to do it. You likely won't get reliable results, hence the date selector.
Settings
Number of Thresholds for Buy
This is a global setting. You can use any positive whole number here that is one or greater. If it is set to one, one or more of the RSI thresholds you have selected for each chart timeframe will need to be lower than the RSI threshold value you have set for that particular timeframe's settings and once that happens the bot will buy. For example, if I have this value set to (1) and I am using a 5m, 15m and 30m chart, a buy will be placed on the first bar that any of these RSIs drop to below the respective value you have set for them in settings. If I have it set to two in the same scenario, I will need at least two RSI values to be below their respective thresholds. Since each RSI value is set separately you have a ton of creative options here. I refer to the number of currently met RSI buy thresholds per bar as 'buy count' going forward in this document. The buy count resets to zero each bar which means they will all need to be met on the same bar. You will need to make sure this setting is equal to or less than the number of differently timeframed RSIs you are using or it won't ever buy. For example, if you are using only a 5m and 15m RSI but I have the Number of Thresholds for Buy set to three it will never make a buy because you will have at max two thresholds met.
Number of Thresholds for Sell
This is the same concept above except for sells obviously. I chose to make these independent for maximum flexibility but you can obviously use the same value for both if you'd like. I refer to the number of currently met RSI sell thresholds as 'sell count' for the rest of this document. You will need to make sure this number is equal to or less than the number of differently timeframed RSIs you are using or you will potentially get a buy but never a sell. Use the backtester to figure this out or message me if you get stuck.
Display Multi RSI Table?
This will show you all of the available RSI settings that are currently in play. Note that only timeframes which are equal to or higher than your current TradingView chart timeframe will be accurate. This is due to the fact that these values are looked up once per bar, so if you are set to a 1h chart you won't get 5m values every 5m, instead getting the 5m RSI once per hour. For best results set your chart to the lowest timeframe that you have enabled from the options below this.
Use XX RSI?
This turns a particular timeframe's RSI off and on. If you turn it off it will disappear from the chart and its thresholds won't be applied to the strategy.
XX RSI Length
You can set the RSI length for each timeframe you want to use separately. The default value is 14.
XX RSI Buy / Sell Threshold
These are all also set separately for each timeframe. Any time XX timeframe's RSI is below the Buy Threshold for that timeframe it will increase the buy count by +1 for that bar. Since the count resets to zero each bar, you will need to have at least your Number of Thresholds for Buy worth of RSI values below their respective thresholds on any given bar for a buy to happen. The opposite is true for sells.
Usage
For each timeframe you pick you will also need to set a buy and a sell threshold. I have the defaults set to 30 and 70 which is pretty standard but you should experiment and see what works best for you. Each individual timeframe has its own buy and sell threshold which makes this script about as customizable as you want it to be.
Set your chart to the lowest timeframe that you are using, ie if you are using 1h, 4h and 1d use a 1h chart. If you are using 5m, 15m and 30m use a 5m chart. You need to do this because it will only refresh each RSI on the interval your chart is set to, so if you have 5m, 15m and 30m but use a 1h chart the strategy will basically lose most of its effectiveness because there should be twelve different 5m RSI values in each hour but you will only recalculate once every hour since your chart is set to one hour, and will therefore only get one 5m value, one 15m value and one 30m value per 1h bar. If you don't understand this just trust me and set it to the lowest timeframe you are currently using.
I didn't put a stop loss in this version but I will in the next update.
I think that's about it! If you have questions please ask. I give access to this script away for free for testing but in order to use it with 3commas you will need the entire script. Message me if you want it and we can figure something out.

Crypto Scalping Strategy by SAIFOverview
An optimized scalping strategy designed for cryptocurrency markets, focusing on breakout opportunities with strict risk controls and optional safe compounding features. This strategy combines price action, volume analysis, and multi-timeframe trend confirmation.
Key Features
Breakout Detection System
Identifies significant price breakouts using dynamic channel analysis
Confirms breakouts with volume surge validation
Filters trades based on multi-timeframe trend alignment
Multi-Timeframe Trend Confirmation
Analyzes 1-hour and 4-hour timeframes for trend direction
Only takes trades aligned with higher timeframe trends
Uses long-term moving averages for trend validation
Advanced Risk Management
Conservative default risk: 1% per trade
ATR-based stop-loss placement (2x ATR)
Trailing stop mechanism to protect profits
Minimum profit target before trailing activates
Built-in position sizing based on account equity
Safe Capital Management Options
Fixed Capital Mode: Trade with consistent position sizes
Safe Compounding Mode: Gradually scales position size based on realized profits only
Drawdown Protection: 80% equity floor prevents excessive capital erosion
Leverage Control: 10x leverage factored into position calculations
Technical Filters
Momentum confirmation via oscillator conditions
Directional movement analysis
Volume threshold requirements
Trend strength validation
Position Sizing
The strategy automatically calculates position sizes based on:
Your specified risk percentage
Current ATR volatility
Available leverage
Account equity (with optional compounding)
Trade Management
Entry: Executes on confirmed breakouts with volume and trend alignment
Stop Loss: Placed at 2x ATR from entry
Take Profit: Uses trailing stops that activate after minimum profit threshold
Exit: Automatically managed through strategy exits
Customization Options
Adjustable channel length for breakout detection
Configurable volume multiplier for surge detection
Customizable oscillator thresholds
Flexible ATR period for volatility measurement
Optional compounding vs. fixed capital modes
Adjustable trailing stop parameters
Visual Features
Channel boundaries plotted on chart
Entry signals marked with arrows
Background coloring indicates trend direction
Real-time info table shows:
Current risk level
Compounding status
Capital values
Drawdown protection status
Alert Capabilities
Built-in alert conditions for:
Buy signals (breakout opportunities)
Sell signals (breakdown opportunities)
Important Disclaimers
⚠️ Educational Purpose Only: This strategy is provided for educational and research purposes. It is not investment advice.
⚠️ High-Risk Trading: Scalping and leverage trading carry substantial risk of loss. Cryptocurrency markets are highly volatile.
⚠️ Not Financial Advice: This tool does not constitute financial, investment, or trading advice. Always conduct your own research and consult qualified professionals.
⚠️ Leverage Warning: This strategy uses 10x leverage, which can amplify both gains and losses significantly.
⚠️ Backtesting Limitations: Past performance does not guarantee future results. Real trading involves slippage, execution delays, and emotional factors not present in backtesting.
⚠️ Capital at Risk: Only trade with capital you can afford to lose completely. Never trade with borrowed money or funds needed for living expenses.
Commission & Fees
Commission: 0.13% per trade
Initial capital: $100 (default)
Commission costs are factored into backtest results
Best Practices
Start Small: Begin with minimum capital and conservative risk settings
Test Thoroughly: Backtest across different market conditions and timeframes
Monitor Performance: Track win rate, profit factor, and maximum drawdown
Adjust Parameters: Optimize settings for your specific trading pairs
Use Alerts: Set up notifications to avoid missing opportunities
Manage Emotions: Follow the strategy rules consistently without override
Recommended Markets
High liquidity cryptocurrency pairs (BTC, ETH major pairs)
Assets with clear trending behavior
Markets with sufficient volume for scalping
Timeframes: 1H to 4H charts recommended
Risk Reminder
Scalping requires:
Quick decision-making
Tight risk management
Consistent discipline
Understanding of market microstructure
Proper capitalization
Always practice proper risk management. The strategy includes safety features, but no system can eliminate trading risk entirely. Trade responsibly.

Hash Momentum Strategy# Hash Momentum Strategy
## 📊 Overview
The **Hash Momentum Strategy** is a professional-grade momentum trading system designed to capture strong directional price movements with precision timing and intelligent risk management. Unlike traditional EMA crossover strategies, this system uses momentum acceleration as its primary signal, resulting in earlier entries and better risk-to-reward ratios.
---
## ⚡ What Makes This Strategy Unique
### 1. Momentum-Based Entry System
Most strategies rely on lagging indicators like moving average crossovers. This strategy captures momentum *acceleration* - entering when price movement is gaining strength, not after the move has already happened.
### 2. Programmable Risk-to-Reward
Set your exact R:R ratio (1:2, 1:2.5, 1:3, etc.) and the strategy automatically calculates stop loss and take profit levels. No more guessing or manual calculations.
### 3. Smart Partial Profit Taking
Lock in profits at multiple stages:
- **First TP**: Take 50% off at 2R
- **Second TP**: Take 40% off at 2.5R
- **Final TP**: Let 10% ride to maximum target
This approach locks in gains while letting winners run.
### 4. Dynamic Momentum Threshold
Uses ATR (Average True Range) multiplied by your threshold setting to adapt to market volatility. Volatile markets = higher threshold. Quiet markets = lower threshold.
### 5. Trade Cooldown System
Prevents overtrading and revenge trading by enforcing a cooldown period between trades. Configurable from 1-24 bars.
### 6. Optional Session & Weekend Filters
Filter trades by Tokyo, London, and New York sessions. Optional weekend-off toggle to avoid low-liquidity periods.
---
## 🎯 How It Works
### Signal Generation
**STEP 1: Calculate Momentum**
- Momentum = Current Price - Price
- Check if Momentum > ATR × Threshold Multiplier
- Momentum must be accelerating (positive change in momentum)
**STEP 2: Confirm with EMA Trend Filter**
- Long: Price must be above EMA
- Short: Price must be below EMA
**STEP 3: Check Filters**
- Not in cooldown period
- Valid session (if enabled)
- Not weekend (if enabled)
**STEP 4: ENTRY SIGNAL TRIGGERED**
### Risk Management Example
**Example Long Trade:**
- Entry: $100
- Stop Loss: $97.80 (2.2% risk)
- Risk Amount: $2.20
**Take Profit Levels:**
- TP1: $104.40 (2R = $4.40) → Close 50%
- TP2: $105.50 (2.5R = $5.50) → Close 40%
- Final: $105.50 (2.5R) → Close remaining 10%
---
## ⚙️ Settings Guide
### Core Strategy
**Momentum Length** (Default: 13)
Number of bars for momentum calculation. Higher = stronger but fewer signals.
**Momentum Threshold** (Default: 2.25)
ATR multiplier. Higher = only trade biggest moves.
**Use EMA Trend Filter** (Default: ON)
Only long above EMA, short below EMA.
**EMA Length** (Default: 28)
Period for trend-confirming EMA.
### Filters
**Use Trading Session Filter** (Default: OFF)
Restrict trading to specific sessions.
**Tokyo Session** (Default: OFF)
Trade during Asian hours (00:00-09:00 JST).
**London Session** (Default: OFF)
Trade during European hours (08:00-17:00 GMT).
**New York Session** (Default: OFF)
Trade during US hours (08:00-17:00 EST).
**Weekend Off** (Default: OFF)
Disable trading on Saturdays and Sundays.
### Risk Management
**Stop Loss %** (Default: 2.2)
Fixed percentage stop loss from entry.
**Risk:Reward Ratio** (Default: 2.5)
Your target reward as multiple of risk.
**Use Partial Profit Taking** (Default: ON)
Take profits in stages.
**First TP R:R** (Default: 2.0)
First target as multiple of risk.
**First TP Size %** (Default: 50)
Percentage of position to close at TP1.
**Second TP R:R** (Default: 2.5)
Second target as multiple of risk.
**Second TP Size %** (Default: 40)
Percentage of position to close at TP2.
### Trade Management
**Use Trade Cooldown** (Default: ON)
Prevent overtrading.
**Cooldown Bars** (Default: 6)
Bars to wait after closing a trade.
---
## 🎨 Visual Elements
### Chart Indicators
🟢 **Green Dot** (below bar) = Long entry signal
🔴 **Red Dot** (above bar) = Short entry signal
🔵 **Blue X** (above bar) = Long position closed
🟠 **Orange X** (below bar) = Short position closed
**EMA Line** = Trend direction (green when bullish, red when bearish)
**White Line** = Entry price
**Red Line** = Stop loss level
**Green Lines** = Take profit levels (TP1, TP2, Final)
### Dashboard
When not in real-time mode, a dashboard displays:
- Current position (LONG/SHORT/FLAT)
- Entry price
- Stop loss price
- Take profit price
- R:R ratio
- Current momentum strength
- Total trades
- Win rate
- Net profit %
---
## 📈 Recommended Settings by Timeframe
### 1-Hour Timeframe (Default)
- Momentum Length: 13
- Momentum Threshold: 2.25
- EMA Length: 28
- Stop Loss: 2.2%
- R:R Ratio: 2.5
- Cooldown: 6 bars
### 4-Hour Timeframe
- Momentum Length: 24-36
- Momentum Threshold: 2.5
- EMA Length: 50
- Stop Loss: 3-4%
- R:R Ratio: 2.0-2.5
- Cooldown: 6-8 bars
### 15-Minute Timeframe
- Momentum Length: 8-10
- Momentum Threshold: 2.0
- EMA Length: 20
- Stop Loss: 1.5-2%
- R:R Ratio: 2.0
- Cooldown: 4-6 bars
---
## 🔧 Optimization Tips
### Want More Trades?
- Decrease Momentum Threshold (2.0 instead of 2.25)
- Decrease Momentum Length (10 instead of 13)
- Decrease Cooldown Bars (4 instead of 6)
### Want Higher Quality Trades?
- Increase Momentum Threshold (2.5-3.0)
- Increase Momentum Length (18-24)
- Increase Cooldown Bars (8-10)
### Want Lower Drawdown?
- Increase Cooldown Bars
- Use tighter stop loss
- Enable session filters (trade only high-liquidity sessions)
- Enable Weekend Off
### Want Higher Win Rate?
- Increase R:R Ratio (may reduce total profit)
- Increase Momentum Threshold (fewer but stronger signals)
- Use longer EMA for trend confirmation
---
## 📊 Performance Expectations
Based on typical backtesting results:
- **Win Rate**: 35-45%
- **Profit Factor**: 1.5-2.0
- **Risk:Reward**: 1:2.5 (configurable)
- **Max Drawdown**: 10-20%
- **Trades/Month**: 8-15 (1H timeframe)
**Note:** Win rate may appear low, but with 2.5:1 R:R, you only need ~29% win rate to break even. The strategy aims for quality over quantity.
---
## 🎓 Strategy Logic Explained
### Why Momentum > EMA Crossover?
**EMA Crossover Problems:**
- Signals lag behind price
- Late entries = poor R:R
- Many false signals in ranging markets
**Momentum Advantages:**
- Catches moves as they start accelerating
- Earlier entries = better R:R
- Adapts to volatility via ATR
### Why Partial Profit Taking?
**Without Partial TPs:**
- All-or-nothing approach
- Winners often turn to losers
- High stress watching open positions
**With Partial TPs:**
- Lock in 50% at first target
- Reduce risk to breakeven
- Let remainder ride for bigger gains
- Lower psychological pressure
### Why Trade Cooldown?
**Without Cooldown:**
- Revenge trading after losses
- Overtrading in choppy markets
- Emotional decision-making
**With Cooldown:**
- Forces discipline
- Waits for new setup to develop
- Reduces transaction costs
- Better signal quality
---
## ⚠️ Important Notes
1. **This is a momentum strategy, not an EMA strategy**
The EMA only confirms trend direction. Momentum generates the actual signals.
2. **Backtest thoroughly before live trading**
Past performance ≠ future results. Test on your specific asset and timeframe.
3. **Use proper position sizing**
Risk 1-2% of account per trade maximum. The strategy uses 100% equity by default (adjust in Properties).
4. **Dashboard auto-hides in real-time**
Clean chart for live trading. Visible during backtesting.
5. **Customize for your trading style**
All settings are fully adjustable. No single "best" configuration.
---
## 🚀 Quick Start Guide
1. **Add to Chart**: Apply to your preferred asset and timeframe
2. **Keep Defaults**: Start with default settings
3. **Backtest**: Review historical performance
4. **Paper Trade**: Test with simulated money first
5. **Go Live**: Start small and scale up
---
## 💡 Pro Tips
**Tip 1: Combine Timeframes**
Use higher timeframe (4H) for trend direction, lower timeframe (1H) for entries.
**Tip 2: Avoid News Events**
Major news can cause whipsaws. Consider manual intervention during high-impact events.
**Tip 3: Monitor Momentum Strength**
Dashboard shows momentum in sigma (σ). Values >1.0σ indicate very strong momentum.
**Tip 4: Adjust for Volatility**
In high-volatility markets, increase threshold and stop loss. In quiet markets, decrease them.
**Tip 5: Review Losing Trades**
Check if losses are hitting stop loss or reversing. Adjust stop accordingly.
---
## 📝 Changelog
**v1.0** - Initial Release
- Momentum-based signal generation
- EMA trend filter
- Programmable R:R ratio
- Partial profit taking (3 stages)
- Trade cooldown system
- Session filters (Tokyo/London/New York)
- Weekend off toggle
- Smart dashboard (auto-hides in real-time)
- Clean visual design
---
## 🙏 Credits
Developed by **Hash Capital Research**
If you find this strategy useful, please give it a like and share with others!
---
## ⚖️ Disclaimer
This strategy is for educational purposes only. Trading involves substantial risk of loss and is not suitable for all investors. Past performance is not indicative of future results. Always do your own research and consult with a qualified financial advisor before trading.
---
## 📬 Feedback
Have suggestions or found a bug? Leave a comment below! I'm continuously improving this strategy based on community feedback.
---
**Happy Trading! 🚀📈**

Intellect TBTS V02 [Strategy]📌 Intellect V01 TBO – Trend Breakout Options Strategy
Intellect V01 TBO is an intraday trend-breakout strategy designed for index traders who follow Nifty, BankNifty, and FinNifty.
It identifies trend shifts using structural pivots, adaptive trendlines, and volatility-adjusted breakout zones.
The strategy provides automatic Long/Short signals, optional stop-loss and target projections, and allows users to generate alert messages that include index-option strike information.
🔍 How the Strategy Works
1. Pivot-Based Structure
The script identifies short-term high and low pivots using a user-defined period.
These pivots become anchor points for constructing directional trendlines.
2. Dynamic Trendline Projection
For each pivot, the script builds:
A projected trendline
Two offset lines above/below
A volatility band based on ATR
These help detect potential breakout zones.
3. Breakout Signal Logic
A trade signal is generated when price crosses the projected trendline:
Long Signal – detected when price breaks above a pivot-derived trendline.
Short Signal – detected when price breaks below a pivot-derived trendline.
Users may optionally restrict entries to a specific time window.
🎯 Stop-Loss & Target Zones
When a trade is active:
SL and TP levels are set using ATR-based volatility distance
Levels appear visually on the chart if enabled
Exits occur automatically when TP/SL is hit
The strategy also closes open trades near the end of the session (default 3:10 PM)
These levels are for visual and backtesting support only.
📝 Index Option Strike Calculation (For Alert Text Only)
The strategy can dynamically compute:
ATM strike (with optional bias)
Correct expiry day for Nifty (weekly) and BankNifty/FinNifty (monthly Tuesday)
CE strike for Long signals
PE strike for Short signals
This strike information is only included in alert text for users who configure external automation.
It does not affect backtesting results inside TradingView.
⏱️ Time Window Filter (Optional)
Users may define:
Start time
End time
Outside this window, no new trades are generated.
🎛️ User Adjustable Inputs
Pivot lookback period
Trendline style and extension
Display of target/stop-loss
Expiry selection mode
Strike-bias
Lot size (for alert formatting only)
Time filter settings
🔔 Alert Messages
Alerts include:
Direction (Long/Short)
Strike details
Option type (CE/PE)
Quantity
A formatted JSON message
TradingView does not execute these orders.
Users are responsible for managing external automation independently.
⚠️ Important Notes
This script does not integrate with any broker by default.
It does not place trades automatically; alerts only send text.
Backtests simulate index movement, not live option pricing.
We recommend using realistic slippage and commission settings.
✔️ This strategy is intended for educational and analytical use. Adjust settings as needed.
✅ 2. CLEAN CHART BEFORE PUBLISHING
To avoid moderator flags:
Do This Before Publishing:
✔ Remove all manual drawings
✔ Hide any other indicators on the chart
✔ Use light or clean background
✔ Keep only signals/SL/TP from your script
If you leave extra drawings, moderators may hide the script again.
✅ 3. FINAL PUBLISHING CHECKLIST
Before you click Publish, verify:
✔ Description matches the one above
✔ No broker names anywhere
✔ No "algo trading" or "automation" advertising
✔ Backtest settings are realistic
Commission enabled
Slippage > 1
Reasonable lot assumption
✔ Chart is clean
✔ Script is set to “Strategy” and compiles without warnings

Sigma Trinity ModelAbstract
Sigma Trinity Model is an educational framework that studies how three layers of market behavior interact within the same trend: (1) structural momentum (Rasta), (2) internal strength (RSI), and (3) continuation/compounding structure (Pyramid). The model deliberately combines bar-close momentum logic with intrabar, wick-aware strength checks to help users see how reversals form, confirm, and extend. It is not a signal service or automation tool; it is a transparent learning instrument for chart study and backtesting.
Why this is not “just a mashup”
Many scripts merge indicators without explaining the purpose. Sigma Trinity is a coordinated, three-engine study designed for a specific learning goal:
Rasta (structure): defines when momentum actually flips using a dual-line EMA vs smoothed EMA. It gives the entry/exit framework on bar close for clean historical study.
RSI (energy): measures internal strength with wick-aware triggers. It uses RSI of LOW (for bottom touches/reclaims) and RSI of HIGH (for top touches/exhaustion) so users can see intrabar strength/weakness that the close can hide.
Pyramid (progression): demonstrates how continuation behaves once momentum and strength align. It shows the logic of adds (compounding) as a didactic layer, also on bar close to keep historical alignment consistent.
These three roles are complementary, not redundant: structure → strength → progression.
Architecture Overview
Execution model
Rasta & Pyramid: bar close only by default (historically stable, easy to audit).
RSI: per tick (realtime) with bar-close backup by default, using RSI of LOW for entries and RSI of HIGH for exits. This makes the module sensitive to intra-bar wicks while still giving a close-based safety net for backtests.
Stops (optional in strategy builds): wick-accurate: trail arms/ratchets on HIGH; stop hit checks with LOW (or Close if selected) with a small undershoot buffer to avoid micro-noise hits.
Visual model
Dual lines (EMA vs smoothed EMA) for Rasta + color fog to see direction and compression/expansion.
Rungs (small vertical lines) drawn between the two Rasta lines to visualize wave spacing and rhythm.
Clean labels for Entry/Exit/Pyramid Add/RSI events. Everything is state-locked to avoid spamming.
Module 1 — Rasta (Structural Momentum Layer)
Goal: Identify structural momentum reversals and maintain a consistent, replayable backbone for study.
Method:
Compute an EMA of a chosen price source (default Close), and a smoothed version (SMA/EMA/RMA/WMA/None selectable).
Flip points occur when the EMA line crosses the smoothed line.
Optional EMA 8/21 trend filter can gate entries (long-bias when EMA8 > EMA21). A small “adaptive on flip” option lets an entry fire when the filter itself flips to ON and the EMA is already above the smoothed line—useful for trend resumption.
Why bar close only?
Bar-close Rasta gives a stable, auditable timeline for the structure of the trend. It teaches users to separate “structure” (close-resolved) from “energy” (intrabar, via RSI).
Visuals:
Fog between the lines (green/red) to show regime.
Rungs between lines to show spread (compression vs expansion).
Optional plotting of EMA8/EMA21 so users can see the gating effect.
Module 2 — RSI (Internal Strength / Energy Layer)
Goal: Reveal the intrabar strength/weakness that often precedes or confirms structural flips.
Method:
Standard RSI with adjustable length and signal smoothing for the panel view.
Logic uses wick-aware sources:
Entry trigger: RSI of LOW (same RSI length) touching or below a lower band (default 15). Think of it as intraband reactivation from the bottom, using the candle’s deepest excursion.
Exit trigger: RSI of HIGH touching or above an upper band (default 85). Think of it as exhaustion at the top, using the candle’s highest excursion.
Realtime + Close Backup: fires intrabar on tick, but if the realtime event was missed, the close backup will note it at bar end.
Cooldown control: optional bars-between-signals to avoid rapid re-triggers on choppy sequences.
Why wick-aware RSI?
A close-only RSI can miss the true micro-extremes that cause reversals. Using LOW/HIGH for triggers captures the behavior that traders actually react to during the bar, while the bar-close backup preserves historical reproducibility.
Module 3 — Pyramid (Continuation / Compounding Layer)
Goal: Teach how continuation behaves once a trend is underway, and how adds can be structured.
Method:
Same dual-line logic as Rasta (EMA vs smoothed EMA), but only fires when already in a position (or after prior entry conditions).
Supports the same EMA 8/21 filter and optional adaptive-on-flip behavior.
Bar close only to maintain historical cohesion.
What it teaches:
Adds tend to cluster when momentum persists.
Students can experiment with add spacing and compare “one-shot entries” vs “laddered adds” during strong regimes.
How the Pieces Work Together
Rasta establishes the structural frame (when the wave flip is real enough to record at close).
RSI validates or challenges that structure by tracking intrabar energy at the extremes (low/high touches).
Pyramid shows what sustained continuation looks like once (1) and (2) align.
This produces a layered view: Structure → Energy → Progression. Users can see when all three line up (strongest phases) and when they diverge (riskier phases or transitions).
How to Use It (Step-by-Step)
Quick Start
Apply script to any symbol/timeframe.
In Strategy/Indicator Properties:
Enable On every tick (recommended).
If available, enable Using bar magnifier and choose a lower resolution (e.g., 1m) to simulate intrabar fills more realistically.
Keep On bar close unchecked if you want to observe realtime logic in live charts (strategies still place orders on close by platform design).
Default behavior: Rasta & Pyramid = bar close; RSI = per tick with close backup.
Reading the Chart
Watch for Rasta Entry/Exit labels: they define clean structural turns on close.
Watch RSI Entry (LOW touch at/below lower band) and RSI Exit (HIGH touch at/above upper band) to gauge internal energy extremes.
Pyramid Add labels reveal continuation phases once a move is already in progress.
Tuning
Rasta smoothing: choose SMA/EMA/RMA/WMA or None. Higher smoothing → later but cleaner flips; lower smoothing → earlier but choppier.
RSI bands: a common educational setting is 15/85 for strong extremes; 20/80 is a bit looser.
Cooldown: increase if you see too many RSI re-fires in chop.
EMA 8/21 filter: toggle ON to study “trend-gated” entries, OFF to study raw momentum flips.
Backtesting Notes (for Strategy Builds)
Stops (optional): trail is armed when price advances by a trigger (default D–F₀), ratchets only upward from HIGH, and hits from LOW (or Close if chosen) with a tiny undershoot buffer to avoid micro-wicks.
Order sequencing per bar (mirrors the script’s code comments):
Trail ratchet via HIGH
Intrabar stop hit via LOW/CLOSE → immediate close
If still in position at bar close: process exits (Rasta/RSI)
If still in position at bar close: process Pyramid Add
If flat at bar close: process entries (Rasta/RSI)
Platform reality: strategies place orders at bar close in historical testing; the intrabar logic improves realism for stops and event marking but final order timestamps are still close-resolved.
Inputs Reference (common)
Modules: enable/disable RSI and Pyramid learning layers.
Rasta: EMA length, smoothing type/length, EMA8/21 filter & adaptive flip, fog opacity, rungs on/off & limit.
RSI: RSI length, signal MA length (panel), Entry band (LOW), Exit band (HIGH), cooldown bars, labels.
Pyramid: EMA length, smoothing, EMA8/21 filter & adaptive adds.
Execution: toggle Bar Close Only for Rasta/Pyramid; toggle Realtime + Close Backup for RSI.
Stops (strategy): Fixed Stop % (first), Fixed Stop % (add), Trail Distance %, Trigger rule (auto D–F₀ or custom), undershoot buffer %, and hit source (LOW/CLOSE).
What to Study With It
Convergence: how often RSI-LOW entry touches precede the next Rasta flip.
Divergence: cases where RSI screams exhaustion (HIGH >= upper band) but Rasta hasn’t flipped yet—often transition zones.
Continuation: how Pyramid adds cluster in strong moves; how spacing changes with smoothing/filter choices.
Regime changes: use EMA8/21 filter toggles to see what happens at macro turns vs chop.
Limitations & Scope
This is a learning tool, not a trade copier. It does not provide financial advice or automated execution.
Intrabar results depend on data granularity; bar magnifier (when available) can help simulate lower-resolution ticks, but true tick-by-tick fills are a platform-level feature and not guaranteed across all symbols.
Suggested Publication Settings (Strategy)
Initial capital: 100
Order size: 100 USD (cash)
Pyramiding: 10
Commission: 0.25%
Slippage: 3 ticks
Recalculate: ✓ On every tick
Fill orders: ✓ Using bar magnifier (choose 1m or similar); leave On bar close unchecked for live viewing.
Educational License
Released under the Michael Culpepper Gratitude License (2025).
Use and modify freely for education and research with attribution. No resale. No promises of profitability. Purpose is understanding, not signals.

Quantura - Quantified Price Action StrategyIntroduction
“Quantura – Quantified Price Action Strategy” is an invite-only Pine Script strategy designed to combine multiple price action concepts into a single trading framework. It integrates supply and demand zones, liquidity sweeps and runs, fair value gaps (FVGs), RSI filters, and EMA trend confirmation. The strategy also provides a visual overlay with dynamic trend-colored candles for easier chart interpretation. It is intended for multi-market use across cryptocurrencies, Forex, equities, and indices.
Originality & Value
The strategy is original in how it unifies several institutional-style price action elements and validates trades only when they align. This reduces noise compared to using single indicators in isolation. Its unique value lies in the combination of:
Supply & Demand detection: Dynamic boxes identified through pivots, ATR, and volume sensitivity.
Liquidity sweeps and runs: Detects when swing highs/lows are broken and retested, distinguishing between liquidity grabs (sweeps) and directional runs.
RSI filter: Can be set to normal or aggressive, confirming momentum before trades.
Fair Value Gaps (FVGs): Optional detection and filtering of price inefficiencies.
EMA filter: Aligns trades with the broader market trend.
Trend candle visualization: Candles dynamically colored bullish, bearish, or neutral, based on strategy positions.
This layered confluence approach ensures that entries are not taken on a single condition but require agreement across several dimensions of market structure, momentum, and order flow.
Functionality & Indicators
Supply & Demand Zones: Zones are created when pivots, ATR sensitivity, and volume thresholds overlap.
Liquidity: Swing highs and lows are tracked, with options for sweep (fakeout/reversal) or run (continuation) detection.
RSI: Confirms long signals when oversold and shorts when overbought, with configurable aggressiveness.
FVG filter: Adds validation by requiring price interaction with inefficiency zones.
EMA filter: Ensures longs are above EMA and shorts below EMA.
Signals & Visualization: Trade entries are marked on the chart, while candles change color to reflect trade direction and status.
Parameters & Customization
Supply & Demand: Sensitivity (swing range, volume multiplier, ATR multiplier) and display options.
Liquidity filter: Mode (Run or Sweep), display, and swing length.
RSI: Enable/disable, length, and style (normal or aggressive).
Fair Value Gaps: Sensitivity via ATR factor, optional volume filter, and display toggles.
EMA: Length, enable/disable, and visualization.
Risk management: Up to three configurable take-profit levels, stop-loss, break-even logic, and capital-based position sizing.
Visualization: Custom candle coloring and optional overlay for better clarity.
Default Properties (Strategy Settings)
Initial Capital: 10,000 USD
Position Size: 100% of equity per trade (backtest default)
Commission: 0.1%
Slippage: 1
Pyramiding: 0 (only one position at a time)
Note: The default of 100% equity per trade is used for testing purposes only and would not be sustainable in real trading. A typical allocation in practice would be between 1–5% of account equity per trade, sometimes up to 10%.
Backtesting & Performance
Backtests on XPTUSD over 2.5 years with the default settings produced:
164 trades
67.68% win rate
Profit factor: 1.7
Maximum drawdown: 27.81%
These results show how the confluence of supply/demand, liquidity, and RSI filters can produce robust setups. However, past performance does not guarantee future results. While the trade count (164) is sufficient for statistical analysis, results may vary across markets and timeframes.
Risk Management
Three configurable take-profit levels with percentage allocation.
Initial stop-loss based on user-defined percentage.
Dynamic stop-loss that adjusts with market movement.
Break-even logic that shifts stops to entry after predefined gains.
Position sizing based on risk percentage of equity.
This framework allows both conservative and aggressive configurations, depending on user preference.
Limitations & Market Conditions
Works best in volatile and liquid markets such as crypto, metals, indices, and FX.
May produce false signals in low-volume or sideways environments.
Unexpected news or macro events can override technical conditions.
Default position sizing of 100% equity is highly aggressive and should be reduced before any practical use.
Usage Guide
Add “Quantura – Quantified Price Action Strategy” to your chart.
Select Supply & Demand, Liquidity, RSI, EMA, and FVG settings according to your market and timeframe.
Configure risk management: take-profits, stop-loss, and risk-per-trade percentage.
Use the Strategy Tester to analyze statistics, equity curve, and performance under different conditions.
Optimize parameters before applying the strategy to different markets.
Author & Access
Developed 100% by Quantura. Published as an Invite-Only script.
Important
This description complies with TradingView’s publishing rules. It clarifies originality, explains the underlying logic, discloses default properties, and presents backtest results with realistic disclaimers.

Moon Phases + Blood MoonWhat it is
This is a simple, time-based strategy that goes long on full moons and exits on the next new moon, while visually highlighting historically known “Blood Moon” (total lunar eclipse) dates. It’s built for exploratory testing of lunar timing effects on price, not for predictive claims.
Why it’s useful / originality
Most lunar scripts only mark phases. This one (1) computes lunar phases on the chart, (2) normalizes and flags Blood Moon days from a curated list, and (3) turns the phase changes into an executable strategy with clear, reproducible entry/exit rules and a configurable start date—so traders can quickly evaluate whether a lunar timing overlay adds any edge on their market/timeframe.
How it works (concept)
Moon phase detection: Uses Julian date conversion and standard astronomical approximations to determine the most recent phase change at each bar. The script classifies phase turns as +1 = New Moon and –1 = Full Moon, tracking the latest valid time to avoid lookahead.
Blood Moon tagging: A built-in array of UTC timestamps (total lunar eclipses) is date-matched to the current session and marked as “Blood Moon” when a full moon coincides with a listed date.
Signals & trades
Plot circles above/below bars: New Moon (above), Full Moon (below), Blood Moon (below, red).
Entry: Long at Full Moon once the bar time ≥ the user’s Start date.
Exit: Close the long on the next New Moon.
How to use
Add to your chart (non-monthly timeframes only).
Optionally adjust the Start date (default: 2001-12-31 UTC) to control the backtest window.
Use the color inputs to style New Moon / Full Moon / Blood Moon markers.
Evaluate performance on liquid symbols and timeframes that provide a sufficient number of phase cycles.
Default / publish settings
Initial capital: $10,000 (suggested)
Commission: 0.05% per trade (suggested)
Slippage: 1 tick (suggested)
Position sizing: TradingView strategy defaults (no leverage logic is added).
Timeframes: Intraday/Daily/Weekly supported. Monthly is blocked by design.
Chart type: Use standard chart types only (no Heikin Ashi, Renko, Kagi, P&F, Range) for signals/backtests.
Reading the chart
New Moon: soft gray circle above bars.
Full Moon: soft yellow circle below bars.
Blood Moon (if date-matched): soft red circle below bars.
The script also ensures symbol/timeframe context is visible—keep your chart clean so the markers are easy to interpret.
Limitations & important notes
This is a time-based heuristic. It does not forecast price and does not repaint via lookahead tricks; it avoids future leakage by anchoring to the last known phase time at each bar.
No non-standard chart signals. Using non-standard charts can produce unrealistic results.
Strategy properties like commission/slippage materially affect results—please set them to realistic values.
Backtests should include a large sample (ideally >100 trades over many cycles) to make statistics meaningful.
Past performance does not guarantee future results.
Open-source reuse / credits
Uses standard, public-domain techniques for Julian date conversion and lunar-phase approximations.
Blood Moon dates are incorporated as a hard-coded list for convenience; you may extend or adjust this list as needed.
No third-party proprietary code is reused.
Changelog / versioning
v1: Initial public release on Pine v6 with phase detection, Blood-Moon tagging, and a minimal long-only phase strategy.