VWAP Combo: Bands + MACD + Volume + AlertsBands: These are dynamic bands using a 20-period standard deviation and 1.5× width by default. Adjust lookback or bandMultiplier to tighten or widen.
Candle Colors: Green = MACD bullish, Red = bearish.
Volume Spike: Orange triangle when volume > 1.5× average.
Alerts: Fire on breakout, bounce, or combo confirmation.
Search in scripts for "band"

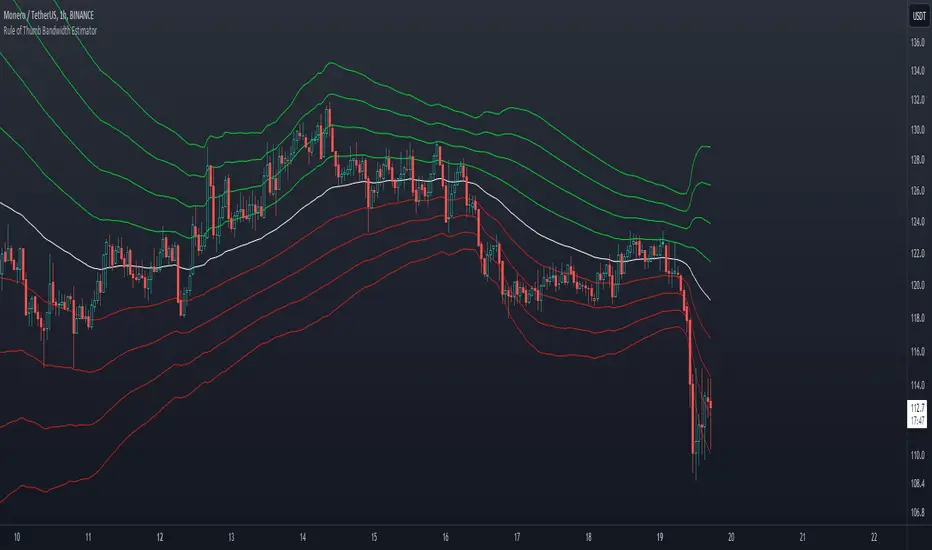
Bandwidth Bands - Silverman's rule of thumbWhat are Bandwidth Bands?
This indicator uses Silverman Rule of Thumb Bandwidth to estimate the width of bands around the rolling moving average which takes in the log transformation of price to remove most of price skewness for the rest of the volatility calculations and then a exp() function is performed to convert it back to a right skewed distribution. These bandwidths bands could offer insights into price volatility and trading extremes.
Silverman rule of thumb bandwidth:
The Silverman Rule of Thumb Bandwidth is a heuristic method used to estimate the optimal bandwidth for kernel density estimation, a statistical technique for estimating the probability density function of a random variable. In the context of financial analysis, such as in this indicator, it helps determine the width of bands around a moving average, providing insights into the level of volatility in the market. This method is particularly useful because it offers a quick and straightforward way to estimate bandwidth without requiring extensive computational resources or complex mathematical calculation
The bandwidth estimator automatically adjust to the characteristics of the data, providing a flexible and dynamic measure of dispersion that can capture variations in volatility over time. Standard deviations alone may not be as adaptive to changes in data distributions. The Bandwidth considers the overall shape and structure of the data distribution rather than just focusing on the spread of data points.
Settings
Source
Sample length
1-4 SD options to disable or enable each band
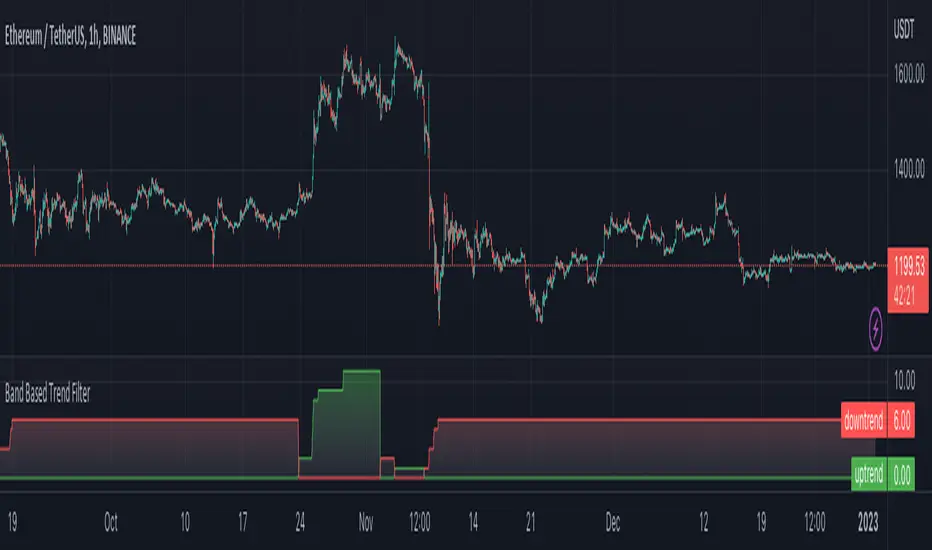
Band Based Trend FilterSimilar to RelativeBandwidthFilter , this script is also a simple trend filter which can be used to define your trading zone.
🎲 Concept
On contrary to reversal mindset, we define trend when price hits either side of the band. If close price hits upper band then it is considered as bullish and if close price hits lower band, then it is considered bearish. Further, trend strength is measured in terms of how many times the price hits one side of the band without hitting other side. Hit is counted only if price has touched middle line in between the touches. This way price walks on the bands are considered as just one hit.
🎲 Settings
Settings are minimal and details can be found in the tooltips against each parameters
🎲 Usage
This can be used with your own strategy to filter your trading/non-trading zones based on trend . Script plots a variable called "Trend" - which is not shown on chart pane. But, it is available in the data window. This can be used in another script as external input and apply logic.
Trend values can be
1 : Allow only Long
-1 : Allow only short
0 : Do not allow any trades
Bands Bands (BanB)This indicator uses bands to show the trend of other bands.
The middle bands are used to show the price trend and the other bands are for the middle bands.
The Spike and Plunge bands can also act as a sort of "Bollinger Bands" for middle bands, though not exactly.
----- HOW TO USE IT -----
Zoom out in the 30 minute chart. Use 15 minute chart to pinpoint your entries.
Use with price-action trading and with indicators showing overbought & oversold levels.
The numbers below correlate with the numbers in the chart.
1) Price hits the Middle Spike line. The "ARL" bands hit the Bottom Spike line. This is a good indication that price will proceed under the Bottom Spike line.
2) Price hits the Bottom Plunge line. The "ARL" bands hit the Middle Plunge line. This is a good indication that price will proceed above the Middle Plunge line.
3) Notice how price spikes up near the Spike lines but doesn't touch. Notice how the Plunge lines have a strong pull downwards. This shows a continued down trend.
4) The same pattern as numbers 2 & 3 reoccur. This time, however, the proceeding price spike is substantially lower.
5) The price and middle bands finally bounce off the Top Plunge line and starts to get closer to the Spike bands.
6) Price and middle bands finally touch the Bottom Spike line and the Spike Bands and the Plunge Bands come closer together.
7) Narrowing Spike and Plunge Bands show a sideways market. Notice number 1, the bands are far apart -- more volatility is present.
Middle Bands:
The bottom, blue lines are fairly accurate dip-rebounds on the 30 minute chart. Use level indicators to find reversing trends (e.g., RSI, Stoch, etc.).
Price action hovering in between the blue lines and around the center indicate a low volatility market or a consolidating market.
----- HOW THIS INDICATOR IS ORIGINAL; WHAT IT DOES AND HOW IT DOES IT -----
This indicator has an original, unique ability to view the trend of bands in a substantially larger overview when zoomed out.
Normally, one would have to switch to higher time frames to get a sense of a larger market trend.
However, doing so will change any bands indicator to accommodate the new price action in relation to the new time frame.
To avoid this, the middle bands are placed in between two bands to see the trend of the bands that show the trend of price action.
----- VERSION -----
The "ARL Bands" in this indicator are NOT the same as the "ARL Bands" indicator.
They are "ARLs" set in an entirely different context, format, and amount and so does not constitute as a different version of "ARL Bands".
The "ARL Bands" indicator only has 4 lines and can be adjusted to any level. They are mainly focused on rebounds at desired levels.
The 13 "ARLs" here cannot be adjusted and are mainly focused on anticipating/calculating probabilities of peak and dip rebounds.
If any discrepancy should arise, let it be stated here that the "ARLs" in this indicator are considered to be a forked codebase to conserve the functionality of "ARL Bands".
This is proven by the differences described underneath "VERSION", which is located 7 lines above.

Band-Zigzag - TrendFollower Strategy [Trendoscope]Strategy Time!!!
Have built this on my earlier published indicator Band-Zigzag-Trend-Follower . This is just one possible implementation of strategy on Band-Based-Zigzag .
🎲 Notes
Experimental prototype. Not financial advise and strategy not guaranteed to make money despite backtest results
Not created or tested for any specific instrument or timeframe
Test and adopt with own risk
🎲 Strategy
This is trend following strategy built based on Bands and Zigzag. Traits of trend following strategies are
Lower win rate (Yes, thats right)
High risk reward (Compensates low win rate)
Higher drawdown
If market is choppy, trend following methods suffer.
The script implements few points to overcome the negatives such as lower win rate and higher drawdown by actively assessing pivots on the direction of trend along. This helps us take regular profits and exit on time during the end of trend. Most of the other concepts are defined and explained in indicator - Band-Zigzag-Trend-Follower and Band-Based-Zigzag
Defining a trend following method is simple. Basic rule of trend following is Buy High and Sell Low (Yes, you heard it right). To explain further - methodology involve finding an established trend which is flying high and join the trend with proper risk and optimal stop. Once you get into the trade, you will not exit unless there is change in the trend. Or in other words, the parameters which you used to define trend has reversed and the trend is not valid anymore.
🎯 Using bands
When price breaks out of upper bands (example, Bollinger Band , Keltener Channel, or Donchian Channel), with a pre determined length and multiplier, we can consider the trend to be bullish and similarly when price breaks down the lower band, we can consider the trend to be bearish .
🎯 Using Pivots
Simple logic using zigzag or pivot points is that when price starts making higher highs and higher lows, we can consider this as uptrend. And when price starts making lower highs and lower lows, we can consider this as downtrend. There are few supertrend implementations I have published in the past based on zigzags and pivot points .
Drawbacks of both of these methods is that there will be too many fluctuations in both cases unless we increase the reference length. And if we increase the reference length, we will have higher drawdown.
🎯 Band Based Zigzag Method
Here we use bands to define our pivot high and pivot low - this makes sure that we are identifying trend only on breakouts as pivots are only formed on breakouts
Our method also includes pivot ratio to cross over 1.0 to be able to consider it as trend. This means, we are waiting for price also to make new high high or lower low before making the decision on trend. But, this helps us ignore smaller pivot movements due to the usage of bands.
I have also implemented few tricks such as sticky bands (Bands will not contract unless there is breakout) and Adaptive Bands (Band will not expand unless price is moving in the direction of band). This makes the trend following method very robust.
To avoid fakeouts, we also use percentB of high/low in comparison with price retracement to define breakout.
🎲 Settings
Settings are fairly simpler and are explained as below. You will find most of the required information in tooltips.

Band-Zigzag Based Trend FollowerWe defined new method to derive zigzag last month - which is called Channel-Based-Zigzag . This script is an example of one of the use case of this method.
🎲 Trend Following
Defining a trend following method is simple. Basic rule of trend following is Buy High and Sell Low (Yes, you heard it right). To explain further - methodology involve finding an established trend which is flying high and join the trend with proper risk and optimal stop. Once you get into the trade, you will not exit unless there is change in the trend. Or in other words, the parameters which you used to define trend has reversed and the trend is not valid anymore.
Few examples are:
🎯 Using bands
When price breaks out of upper bands (example, Bollinger Band, Keltener Channel, or Donchian Channel), with a pre determined length and multiplier, we can consider the trend to be bullish and similarly when price breaks down the lower band, we can consider the trend to be bearish.
Here are few examples where I have used bands for identifying trend
Band-Based-Supertrend
Donchian-Channel-Trend-Filter
🎯 Using Pivots
Simple logic using zigzag or pivot points is that when price starts making higher highs and higher lows, we can consider this as uptrend. And when price starts making lower highs and lower lows, we can consider this as downtrend. There are few supertrend implementations I have published in the past based on zigzags and pivot points.
Adoptive-Supertrend-Pivots
Zigzag-Supertrend
Drawbacks of both of these methods is that there will be too many fluctuations in both cases unless we increase the reference length. And if we increase the reference length, we will have higher drawdown.
🎲 Band Based Zigzag Method
Band Based Zigzag will help overcome these issues by combining both the methods.
Here we use bands to define our pivot high and pivot low - this makes sure that we are identifying trend only on breakouts as pivots are only formed on breakouts.
Our method also includes pivot ratio to cross over 1.0 to be able to consider it as trend. This means, we are waiting for price also to make new high high or lower low before making the decision on trend. But, this helps us ignore smaller pivot movements due to the usage of bands.
I have also implemented few tricks such as sticky bands (Bands will not contract unless there is breakout) and Adaptive Bands (Band will not expand unless price is moving in the direction of band). This makes the trend following method very robust.
To avoid fakeouts, we also use percentB of high/low in comparison with price retracement to define breakout.
🎲 The indicator
The output of indicator is simple and intuitive to understand.
🎯 Trend Criteria
Uptrend when last confirmed pivot is pivot high and has higher retracement ratio than PercentB of High. Else, considered as downtrend.
Downtrend when last confirmed pivot is pivot low and has higher retracement ratio than PercentB of High. Else, considered as uptrend.
🎯 Settings
Settings allow you to select the band type and parameters used for calculating zigzag and then trend. Also has few options to hide the display.

Bandes MogalefMogalef Bands Indicator
Overview
The Mogalef Bands indicator projects future price ranges by combining linear regression and standard deviation calculations. It dynamically updates bands only on significant breakout movements, providing potential support/resistance levels and trend direction.
Authors
- **J.Galabert**: Original inventor
- **R.Morando**: Made the indicator displayable
- **E.Lefort**: Contributed to studies and statistics

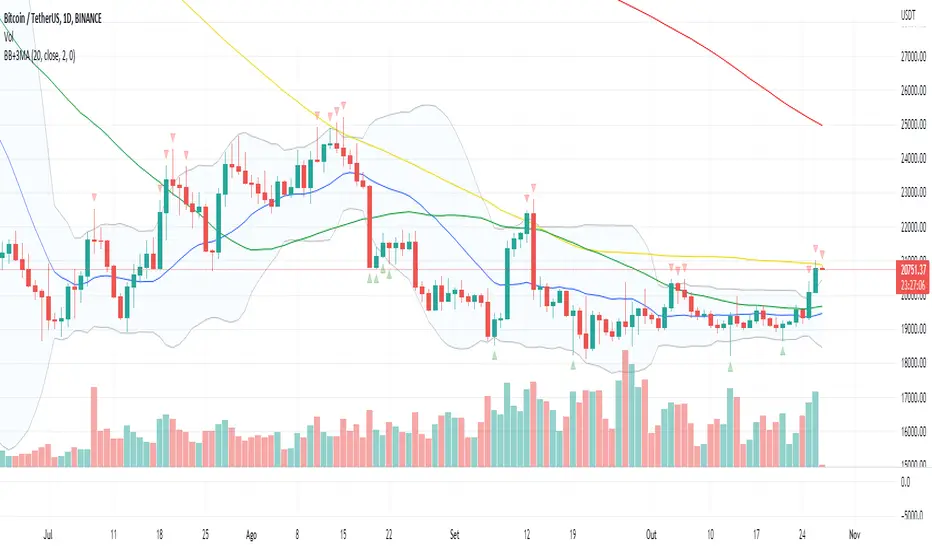
Bandas de Bollinger + 3 Medias Moviles SimplesDenota de una forma poco invasiva, cuando el precio alcanza las Bandas de Bollinger, y permite apreciar al mismo tiempo las medias móviles de 200,100 y 50 a fin de estar alerta a sus cruces, nos obstante, dicho indicador, debe ser apoyado junto con otros indicadores en los mercados financieros que estén al alza o a la baja.
Descargo de responsabilidad: Este contenido los datos, indicadores y valores reflejados, es solo para fines informativos y no debe interpretarse como asesoramiento legal, fiscal, de inversión, financiero o de otro tipo.
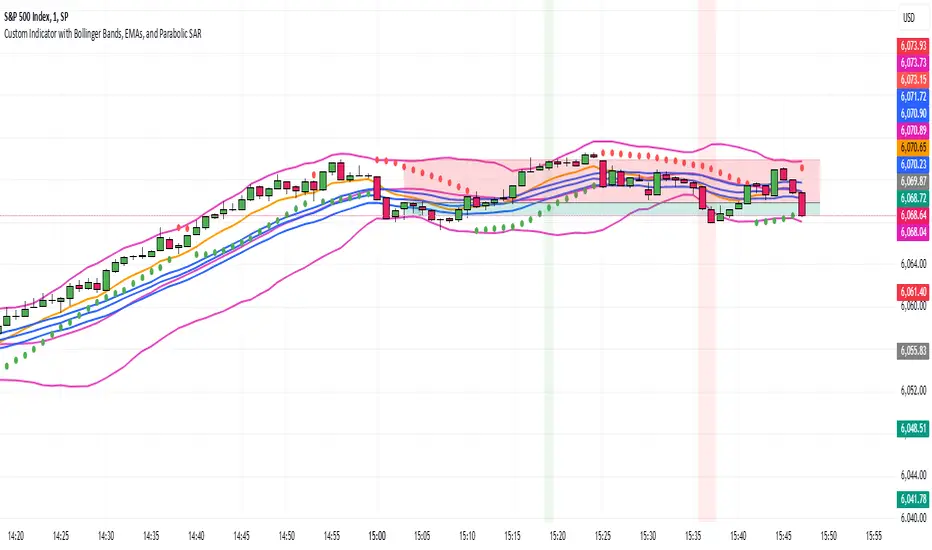
Jumbalika BandsThis indicator is designed using several common technical analysis tools: Bollinger Bands, Exponential Moving Averages (EMAs), and the Parabolic SAR. I'll walk you through each section to explain how it works and how you can use it:
1. Bollinger Bands
Bollinger Bands are used to measure volatility and overbought/oversold conditions. It consists of three lines:
Basis (Middle Line): A simple moving average (SMA) of the price over a defined period (in this case, 20 periods).
Upper Band: The basis plus a certain number of standard deviations. It represents the upper boundary of expected price movement.
Lower Band: The basis minus the same number of standard deviations. It represents the lower boundary of expected price movement.
Interpretation:
Overbought: If the price moves above the upper band, it could signal that the asset is overbought.
Oversold: If the price moves below the lower band, it could signal that the asset is oversold.
Volatility: A wider band indicates higher volatility, and a narrower band indicates lower volatility.
2. Exponential Moving Averages (EMAs)
The indicator plots four different EMAs:
9-period EMA: This is a short-term trend indicator.
20-period EMA on Close: This is another medium-term trend indicator, based on the close price.
20-period EMA on High: A variation of the 20-period EMA, but based on the high prices.
20-period EMA on Low: A variation of the 20-period EMA, but based on the low prices.
Interpretation:
9 EMA: A faster-moving average that responds quicker to price changes. It can be used to identify short-term trends.
20 EMA: A slower-moving average that reacts more gradually to price changes. It helps identify the broader trend.
High/Low EMAs: These give additional insights into the extremes of price action, which can help identify possible support or resistance levels.
Trading signals (common usage):
Crossover: When a shorter EMA (like the 9 EMA) crosses above a longer EMA (like the 20 EMA), it could be a bullish signal. When it crosses below, it could be a bearish signal.
3. Parabolic SAR
The Parabolic SAR is a trend-following indicator that is used to identify potential price reversals. The Parabolic SAR is plotted as a series of dots either above or below the price, depending on the trend:
Below the price: The trend is up (bullish).
Above the price: The trend is down (bearish)
4. Background Coloring (Optional)
The background will change color when the price crosses the Bollinger Bands:
Green background when the price is above the upper Bollinger Band.
Red background when the price is below the lower Bollinger Band.
Adjust the values for Bollinger Bands, EMAs, and Parabolic SAR directly in the indicator settings to suit your trading preferences.
Bollinger Bands: If the price is above the upper band, it might indicate an overbought condition, while if it's below the lower band, it might indicate an oversold condition.
EMAs: The 9 EMA is often used to track short-term trends, while the 20-period EMAs (on the close, high, and low) help analyze the broader market trend.
Parabolic SAR: The Parabolic SAR is often used to identify trend reversals. If the SAR is below the price, the trend is up, and if it's above the price, the trend is down.
Background Color: The background coloring helps visually highlight potential market conditions when the price breaks out of the Bollinger Bands.
Example Use Case:
Decide the trend based on the parabolic SAR, when the bar touches the upper or lower Bollinger take a short or long position based on the price action using EMAs.
Bollinger Bands CustomThe indicator is a customized version of Bollinger Bands with added trading signals. This indicator is designed to help traders identify potential entry (buy) and exit (sell) points based on the interaction between the price and the Bollinger Bands. Below, I will explain in detail its purpose, how it works, and how to use it.
Purpose of the Indicator
The main purpose of this indicator is:
Identify market volatility: Bollinger Bands expand and contract based on price volatility.
Provide trading signals: The indicator generates buy signals (BUY) when the price crosses the lower band and sell signals (SELL) when the price crosses the upper band.
Help identify dynamic support and resistance levels: The upper and lower bands act as dynamic resistance and support levels.
How the Indicator Works
The indicator is based on three main components:
Moving Average (SMA): It calculates the simple moving average (SMA) of the price over a specified period (length).
Bollinger Bands:
The upper band is calculated as the moving average plus a standard deviation multiplied by a factor (mult).
The lower band is calculated as the moving average minus a standard deviation multiplied by the same factor.
Trading signals:
A BUY signal is generated when the price crosses above the lower band.
A SELL signal is generated when the price crosses below the upper band.
How to Use the Indicator
Here is a step-by-step guide on how to use the indicator on TradingView:
1. Add the Indicator to the Chart
Copy the Pine Script code you created.
Open TradingView and go to the Pine Editor.
Paste the code and click "Add to Chart."
The indicator will be displayed directly on the price chart.
2. Customize the Parameters
You can customize the following parameters:
Moving Average Length (length): Set the period for the moving average (default is 20).
Price Source (source): Choose the price to use (default is the closing price).
Standard Deviation Multiplier (mult): Set the multiplier for the standard deviation (default is 2.0).
3. Interpret the Signals
BUY Signal: When you see a "BUY" label below a candle, it means the price has crossed above the lower band. This could indicate a buying opportunity.
SELL Signal: When you see a "SELL" label above a candle, it means the price has crossed below the upper band. This could indicate a selling opportunity.
4. Use Bollinger Bands as Support and Resistance
If the price approaches the upper band, it might indicate a resistance level.
If the price approaches the lower band, it might indicate a support level.
5. Monitor the Colored Background
The chart background turns light green when there is a BUY signal and light red when there is a SELL signal. This helps you quickly identify signals.
Practical Example
Suppose you are analyzing a daily chart of a stock or cryptocurrency:
If the price crosses above the lower band, the indicator will show a "BUY" label. You might consider this as a signal to open a long position.
If the price crosses below the upper band, the indicator will show a "SELL" label. You might consider this as a signal to close a long position or open a short position.
Limitations and Considerations
False signals: In range-bound markets, Bollinger Bands can generate many false signals. It is advisable to use this indicator in combination with other technical analysis tools.
Extreme volatility: During periods of high volatility, the bands expand, and signals may become less reliable.
Confirmation: It is always good practice to confirm signals with other indicators (e.g., RSI, MACD) or candlestick analysis.
Conclusion
My indicator is a useful tool for identifying potential trading opportunities based on Bollinger Bands. However, as with any indicator, it is important to use it in combination with other forms of analysis and risk management to maximize effectiveness. Happy trading! 🚀

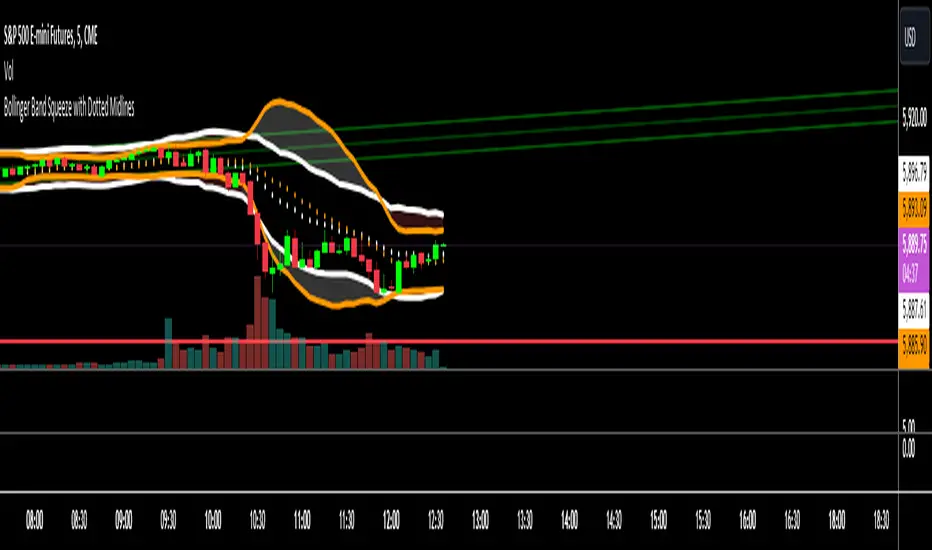
Bollinger Band Squeeze with Dotted MidlinesBollinger Band Squeeze with Dotted Midlines
Overview:
The Bollinger Band Squeeze with Dotted Midlines indicator is a powerful tool designed to identify periods of low volatility in the market, known as "squeeze" conditions, which often precede significant price movements. By combining Bollinger Bands and Keltner Channels, this indicator highlights when the market is consolidating and prepares traders for potential breakouts.
Key Features:
• Squeeze Detection: The indicator fills the area between the Bollinger Bands and Keltner Channels with a semi-transparent red color when both the upper and lower Bollinger Bands are within the Keltner Channels. This visual cue signifies a squeeze condition.
• Dynamic Color Filling: When the Bollinger Bands move outside the Keltner Channels, the fill color changes to a semi-transparent white, indicating the end of the squeeze and the potential start of increased volatility.
• Enhanced Visual Clarity:
o Upper and Lower Bands: The upper and lower lines of both the Bollinger Bands and Keltner Channels are plotted with increased thickness (3pt) for better visibility.
o Midlines with Dotted Effect: The middle lines (50% lines) for both the Bollinger Bands and Keltner Channels are plotted as dotted lines using circles with a thinner line width (1pt), providing a clear yet unobtrusive reference point.
Indicator Components:
1. Bollinger Bands (Orange Lines):
o Upper Bollinger Band: Calculated as the moving average plus a multiple of the standard deviation.
o Lower Bollinger Band: Calculated as the moving average minus a multiple of the standard deviation.
o Middle Bollinger Band: The simple moving average (SMA) of the closing price.
2. Keltner Channels (White Lines):
o Upper Keltner Channel: Calculated as the exponential moving average (EMA) plus a multiple of the average true range (ATR).
o Lower Keltner Channel: Calculated as the EMA minus a multiple of the ATR.
o Middle Keltner Channel: The EMA of the closing price.
3. Squeeze Condition Fill:
o Red Fill (40% Opacity): Indicates a squeeze condition where the Bollinger Bands are entirely within the Keltner Channels.
o White Fill (40% Opacity): Indicates normal market conditions where the Bollinger Bands have moved outside the Keltner Channels.
How to Use:
1. Identifying Squeeze Conditions:
o Look for Red Filled Areas: When you see the area between the Bollinger Bands and Keltner Channels filled in semi-transparent red, it signals a squeeze condition. This means the market is experiencing low volatility and may be preparing for a significant move.
2. Preparing for Potential Breakouts:
o Monitor for Fill Color Changes: A transition from red to white fill suggests that the squeeze is ending, and volatility is increasing. Traders often interpret this as a potential opportunity for a breakout in either direction.
3. Utilizing Midlines:
o Reference Midlines for Trend Direction: The dotted midlines provide insight into the overall trend. Crossing of the price above or below these lines can offer additional confirmation for trading decisions.
Customization Options:
• Bollinger Bands Settings:
o Length: Default is 20 periods. Adjust to change the sensitivity of the bands.
o Multiplier: Default is 2.0. Modify to increase or decrease the band width based on standard deviation.
• Keltner Channels Settings:
o Length: Default is 20 periods. Alter to adjust the responsiveness of the channels.
o Multiplier: Default is 1.5. Change to widen or narrow the channels based on average true range.
Advantages:
• Visual Clarity: Enhanced line thickness and semi-transparent fills make it easy to spot key market conditions at a glance.
• Early Warning System: By identifying squeeze conditions, traders can anticipate potential breakouts and plan their strategies accordingly.
• Flexible Application: Suitable for various timeframes and trading styles, including day trading, swing trading, and position trading.
Limitations:
• False Signals: Like all technical indicators, it may produce false signals, especially in choppy or range-bound markets.
• Should Be Used with Other Indicators: For better accuracy, it's recommended to use this indicator in conjunction with other technical analysis tools and not as a standalone signal generator.
Conclusion:
The Bollinger Band Squeeze with Dotted Midlines indicator is a valuable addition to any trader's toolkit. By effectively highlighting periods of consolidation and potential breakout points, it aids in making informed trading decisions. The visual enhancements improve usability, allowing traders to quickly interpret market conditions and respond appropriately.
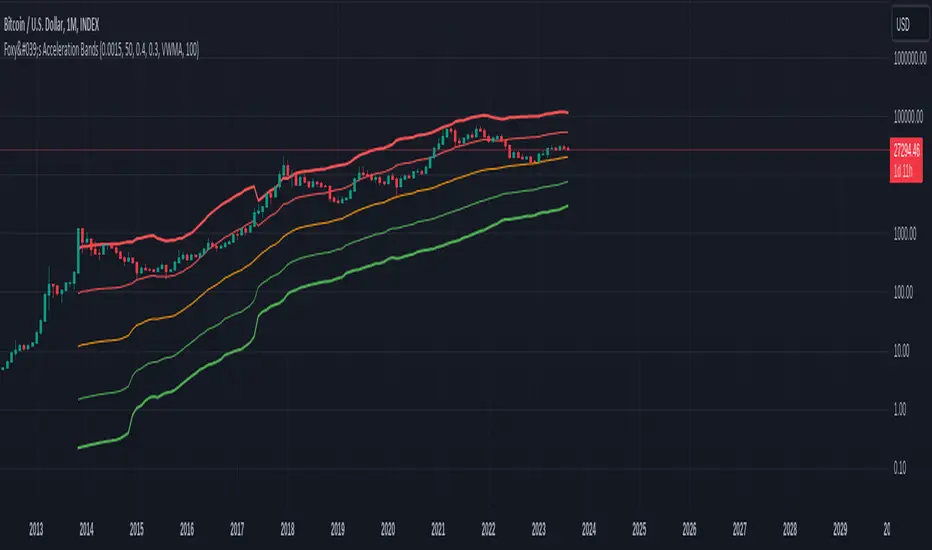
Foxy's Acceleration BandsFoxy's Acceleration Bands is a dynamic technical indicator designed to help traders identify potential support and resistance levels using logarithmic regression and adaptable moving averages. By plotting bands around price movements, this indicator offers insights into potential zones where price acceleration, resistance, and support might occur.
How to Use:
Apply the "Foxy's Acceleration Bands" indicator to your TradingView chart.
Customize the indicator parameters as per your requirements:
factor: Adjust the sensitivity of the bands.
length: Set the length for moving averages and regression calculations.
mult: Modify the multiplier for upper bands.
Show Middle Bands: Toggle the display of middle bands.
Show Upper Bands: Toggle the display of upper bands.
Band MA Type: Choose the moving average type for the bands.
Middle MA Type: Select the moving average type for the central band.
Draw Prediction: Enable prediction lines for potential future price trends.
Prediction Slope Type: Choose between a fixed or dynamic slope length for prediction lines.
Fixed Slope Length: Set the slope length for prediction lines (if enabled).
Interpretation:
Upper Bands: The red upper bands indicate potential resistance zones where price acceleration might occur.
Middle Bands: The orange central band provides insights into the prevailing price trend.
Lower Bands: The green lower bands suggest potential support zones where price deceleration might happen.
Prediction Lines: If enabled, dotted lines visualize potential future price trends based on historical data.
Important Note: Foxy's Acceleration Bands is designed to assist traders in identifying potential support and resistance zones. Always complement its insights with other analysis techniques and prudent risk management strategies.
VWAP & Band Cross Strategy v6VWAP & Band Cross Strategy v6: Script Summary
This Pine Script implements a highly flexible, multi-layered trading strategy centered around the Volume Weighted Average Price (VWAP) and its associated Standard Deviation Bands.
The strategy is designed to test various entry/exit models based on how the price interacts with the central VWAP line and the upper/lower volatility bands, with extensive risk management and confirmation filters.
1. Core Mechanics (VWAP & Bands)
VWAP Calculation: Calculates the VWAP based on a user-defined source (default is the close price).
Standard Deviation Bands: Creates upper and lower bands by calculating the standard deviation of the price (over 20 periods by default) and multiplying it by a user-defined Multiplier (default is 2.0). These bands dynamically expand and contract with volatility.
Plotting: The script clearly plots the VWAP (purple), the Upper Band (green), and the Lower Band (red), with a colored fill between the bands.
2. Entry Triggers
The core entry logic is based on a single, user-selected cross event between the price and the VWAP/Bands. The user can choose from six predefined entry types:
Entry Type Category
Entry Trigger (Long)
Entry Trigger (Short)
Mean Reversion
Price crosses over the Lower Band.
Price crosses under the Upper Band.
Trend Following
Price crosses over the Upper Band (Breakout).
Price crosses under the Lower Band (Breakout).
VWAP Cross
Price crosses over the VWAP.
Price crosses under the VWAP.
3. Filters and Confirmation
Trades are only executed if they pass a series of optional filters, making the strategy highly customizable:
Technical Confirmation (Optional): Users can enable and configure up to three additional indicators that must align with the trade direction:
RSI: Price must be Oversold (for Long) or Overbought (for Short).
SMMA: Price must be above the SMMA (for Long) or below (for Short).
MACD: MACD line must cross the Signal line and the Histogram must be positive/negative.
Time and Day Filters: Trades are restricted to a defined Entry Start/End Hour/Minute window, and only execute on user-selected Trading Days of the week.
Trade Direction: Can be toggled to execute Long Only, Short Only, or Both.
4. Advanced Risk Management (Daily Limits)
The strategy incorporates robust daily limits that reset at a configured Daily Reset Hour/Minute:
Daily Profit/Loss Limits: If the running total of Realized PnL (closed trades) + Unrealized PnL (open position) exceeds a user-defined Daily Take Profit (in Ticks) or falls below the Daily Stop Loss (in Ticks), the strategy locks out new trades and immediately closes any open position.
Max Daily Trades: Prevents the strategy from entering more than a specified number of trades per day.
5. Exit Logic
The strategy exit is also highly configurable via the Exit Type setting:
Fixed Ticks / ATR / Capped ATR: If one of these is selected, the script calculates a static Stop Loss and Take Profit level upon entry, using either fixed tick values or dynamic values based on the Average True Range (ATR), which are then executed using Pine Script's strategy.exit function.
Cross Exits (VWAP/Bands): If selected, the position is closed when the price crosses the VWAP or a specific band in the opposite direction.
End-of-Day Close: An unconditional exit that closes all open positions at a user-defined Close All Hour/Minute, regardless of profit/loss or limit status, preventing positions from being held overnight.

Normalized Bollinger Band DistanceThis TradingView script calculates and visualizes the Normalized Bollinger Band Distance to analyze the relative spread of Bollinger Bands as a percentage of the moving average. It also determines thresholds based on global statistics to highlight unusual market conditions. Here's a detailed description:
Indicator Overview
Purpose: The indicator measures the normalized distance between the upper and lower Bollinger Bands relative to the Simple Moving Average (SMA). It helps identify periods of high or low volatility.
Visualization: Displays the normalized distance along with dynamic thresholds based on global statistical calculations (mean and standard deviation).
Inputs
Length (length): Defines the period for the SMA and Bollinger Bands calculation. Default is 200.
Standard Deviations (stdDev): Number of standard deviations for the Bollinger Bands. Default is 2.
Calculation
Bollinger Bands:
Upper Band:
SMA
+
(
Standard Deviation
×
stdDev
)
SMA+(Standard Deviation×stdDev)
Lower Band:
SMA
−
(
Standard Deviation
×
stdDev
)
SMA−(Standard Deviation×stdDev)
Normalized Distance:
Normalized Distance
=
Upper Band
−
Lower Band
SMA
Normalized Distance=
SMA
Upper Band−Lower Band
Global Statistics:
Global Mean (
𝜇
μ): Average of all normalized distances up to the current bar.
Global Standard Deviation (
𝜎
σ): Standard deviation of all normalized distances up to the current bar.
High Threshold:
𝜇
+
1.5
×
𝜎
μ+1.5×σ
Low Threshold:
𝜇
−
1.5
×
𝜎
μ−1.5×σ
Visualization
Normalized Distance Plot:
The normalized distance is plotted in blue as a percentage for easy interpretation.
Threshold Lines:
High Threshold: Red line to signal unusually high volatility.
Low Threshold: Green line to signal unusually low volatility.
Mean Line: White line indicating the average normalized distance.
Zero Line: Horizontal white line for reference.
Use Case
High Threshold Breach: Indicates an unusual increase in Bollinger Band width relative to the SMA, signaling potential high market volatility.
Low Threshold Breach: Indicates an unusual narrowing of Bollinger Band width, suggesting low volatility and potential consolidation.
Trend Analysis: Observe how the normalized distance evolves over time to anticipate market conditions.

LA - EMA Bands with MTF DashboardDetailed Explanation of the LA - EMA Bands with MTF Dashboard Indicator
This custom Pine Script v6 indicator, designed for Trading View, overlays EMA-based price channels on the chart while incorporating a multi-timeframe (MTF) dashboard for broader market context. It focuses on visualizing trend direction and momentum through three sets of EMA bands, each representing different time horizons, and extends this with a tabular dashboard that summarizes signals across user-selected timeframes. The bands help identify support, resistance, and trend shifts, while the dashboard provides at-a-glance alignment across multiple periods, aiding in confirming trades or spotting divergences. Unlike volatility-based channels (e.g., Bollinger or Keltner), it relies solely on EMAs for simplicity and lag-reduced responsiveness.
Inputs Section
The script begins with user-configurable options grouped for ease. A timeframe input allows specifying a resolution for the EMA bands' data fetching, defaulting to the chart's timeframe if left empty—this enables higher-timeframe overlays on lower charts for context.
Next, a shared source input defines the price data for all midlines, defaulting to the midpoint of high and low (hl2) but customizable to close, open, or others.
The EMA bands have dedicated toggles and length inputs for each of the three sets: the first (long-term) defaults to 144 periods, the second (medium-term) to 72, and the third (short-term) to 12. These are inlined for compact settings panels, with minimum lengths of 1 to prevent errors.
A boolean toggle controls the visibility of the MTF dashboard. Following this are nine pairs of inputs for dashboard timeframes: each pair includes a show/hide toggle and an editable timeframe string (e.g., '1' for 1-minute, 'D' for daily). Defaults progress from short (1, 3, 5 minutes) to longer (15, 30, 60 minutes, daily, weekly, monthly), grouped in inlines for organization. Only enabled and non-empty timeframes appear in the dashboard.
Helpers Section
Two utility functions are defined here. The first computes an EMA on any source series over a specified length using Trading View's built-in function, reused throughout for midlines and bands.
The second function generates a signal string ("B" for buy/bullish, "S" for sell/bearish, or "-" for neutral) based on the direction of an EMA applied to high prices. It compares the current EMA value to the previous one, mirroring the band fill logic for consistency in the dashboard.
Core Components per Band Set:
Midline: An EMA calculated on a user-selectable source price (default: hl2, which is the midpoint between high and low prices). This acts as the central trend line.
Upper Band: An EMA applied directly to the high prices of each bar.
Lower Band: An EMA applied to the low prices of each bar.
These form a channel that captures the smoothed range of price action, highlighting potential support (lower band), resistance (upper band), and overall trend direction (midline).
Multiple Band Sets: The indicator includes three independent EMA band sets, each with its own length parameter for customization:
EMA1 (default length: 144) – Focuses on long-term trends.
EMA2 (default length: 72) – Targets medium-term trends.
EMA3 (default length: 12) – Emphasizes short-term momentum.
Each set can be toggled on or off via input checkboxes, allowing users to reduce chart clutter if needed.
Visual Elements:
Midline Plot: Displayed as a line colored based on its direction compared to the previous bar: green for rising (bullish), red for falling (bearish), and black for neutral (flat).
Band Fill: The area between the upper and lower bands is filled with a semi-transparent color indicating the trend of the upper band: light green for rising (suggesting expanding highs/upward momentum) and light pink for falling (contracting highs/downward pressure). The bands themselves are plotted in blue with a thin linewidth.
Multi-Timeframe Support: Users can input a custom timeframe (e.g., 'D' for daily), and the indicator fetches data from that resolution. This enables higher-timeframe context on lower-timeframe charts, such as viewing daily EMA bands on a 1-hour chart.
Calculation Mechanics:
All EMAs are computed using Trading View's built-in ta.ema() function.
Data is retrieved in a single request.security() call for efficiency, with lookahead enabled to avoid repainting.
No multipliers or volatility adjustments are included, making it a simple EMA-based envelope rather than a true volatility channel.
In practice, this indicator helps traders identify trend strength, potential breakouts (price crossing bands), or mean-reversion opportunities (price bouncing within bands). It's particularly useful for swing or position trading where multi-period alignment (e.g., all midlines green) signals conviction.
Pros
Multi-Period Insight: By combining short (12), medium (72), and long (144) periods, it offers a layered view of trends across time horizons, helping confirm alignments or divergences without needing multiple separate indicators.
Visual Clarity: Color-coded trends and fills make it easy to spot bullish/bearish shifts at a glance, reducing analysis time.
Flexibility: Custom timeframe input allows for multi-timeframe analysis, while shared source and toggles provide user control.
Simplicity and Efficiency: Purely EMA-based, it's computationally light and avoids overcomplication, making it accessible for beginners while still useful for spotting channel-based setups like squeezes or expansions.
No Repainting: With lookahead, plots are stable once bars close.
Cons
Lagging Nature: EMAs inherently lag price action, especially longer ones like 144-period, which may cause delayed signals in fast-moving or ranging markets.
Lack of Volatility Adjustment: Unlike Keltner Channels or Bollinger Bands, it doesn't incorporate ATR or standard deviation, so bands may not accurately reflect true volatility—potentially leading to false breakouts in high-volatility environments.
Chart Clutter: Displaying all three band sets simultaneously can overcrowd the chart, particularly on lower timeframes or volatile assets.
Subjective Interpretation: Color changes and band interactions require trader discretion; there's no built-in alerting or quantitative signals, which might lead to inconsistent results.
Market Dependency: Defaults may not suit all assets (e.g., stocks vs. crypto); shorter periods like 12 could whipsaw in noisy markets, while 144 might be too slow for intraday trading.
Justification for Default Values (12, 72, and 144)
The default lengths of 12, 72, and 144 are not arbitrary but draw from established trading principles, particularly W.D. Gann's geometric and numerical theories, as well as Fibonacci sequences, to create a harmonic progression for short-, medium-, and long-term analysis. Here's the rationale:
12 (Short-Term): This is a common period for capturing recent momentum in technical indicators, often seen in setups like the MACD (which uses 12- and 26-day EMAs). It aligns with natural cycles, such as the 12 months in a year, and in Gann theory, 12 serves as a base unit for squaring price and time (e.g., in the "Square of 12" where multiples like 12, 24, etc., measure cycles in days, weeks, or months). At 12 periods, the EMA reacts quickly to price changes without excessive noise, making it ideal for short-term trend detection.
72 (Medium-Term): This acts as an intermediate bridge, derived from Gann's divisions of the 360-degree circle (a key Gann concept representing a full cycle). Specifically, 72 is 360/5 (relating to pentagonal geometry and natural harmonics) and appears in Gann's time cycle measurements (e.g., as a multiple in the Square of 12: 12×6=72). It's roughly half of 144, providing a balanced midpoint for medium-term trends without overlapping too closely with the others. In practice, 72 periods smooth out short-term fluctuations while still responding to developing trends.
144 (Long-Term): This is a powerhouse number in trading lore, being both 12 squared (12×12=144, central to Gann's "Square of 144" for monthly charts and major cycle turns, as there are 12 months in a year) and a Fibonacci sequence value (1, 1, 2, 3, 5, 8, 13, 21, 34, 55, 89, 144...). Fibonacci periods are popular in moving averages for their alignment with natural growth patterns in markets, and 144 is often used for long-term regime definition (e.g., confirming trends over 144 bars). It helps identify major support/resistance in extended cycles.
Overall, these values form a geometric/harmonic series (12, 72=12×6, 144=12×12), promoting alignment with market cycles as per Gann and Fibonacci principles, rather than generic lengths like 50 or 200. They can be adjusted based on the asset or timeframe, but the defaults provide a starting point rooted in time-tested trading numerology for balanced multi-period analysis.
Please use this along with other indicators (eg. Pivot, MACD, etc) for better results.

Advanced BB Bands with PlotThis code implements an advanced version of Bollinger Bands with additional moving averages, ATR-based bands, step lines, market direction indicators, and real-time data display. Here’s a breakdown of the functionality:
1. Inputs and Parameters:
length: The base period used for calculating the moving averages and the typical price.
atr_length: The length used for calculating the Average True Range (ATR).
step_length: The period for calculating step lines (highest high and lowest low over a given period).
2. Core Calculations:
Typical Price: (high + low + close) / 3 is the base for the moving averages.
ATR: ta.atr(atr_length) is used to create dynamic bands around the moving averages.
PL Dot: An average of the typical prices from the current and past two bars. This provides a short-term trend indicator.
3. Multiple Moving Averages (MAs):
Three simple moving averages (ma1, ma2, ma3) are calculated using different multiples of the base length. These help indicate short-, mid-, and long-term trends.
4. Step Lines:
Step Up: Highest close over the step_length.
Step Down: Lowest close over the step_length. These act as short-term support and resistance levels.
5. Outer Bands:
Upper Band: ma1 + 2 * ATR, an upper boundary based on ATR volatility.
Lower Band: ma1 - 2 * ATR, a lower boundary. Together, these form a dynamic range around the short-term moving average.
6. Market Direction:
Bullish or Bearish condition is determined by comparing ma1 and ma2. If ma1 is above ma2, the market is bullish; otherwise, it's bearish. This decision is displayed on the TradingView chart using a table.
7. Visual Elements:
Moving Averages (ma1, ma2, ma3): Plotted in different colors (blue, purple, white) to indicate different timeframes.
PL Dot: A step line plot for the PL Dot, which helps in spotting short-term trends.
Step Lines: Step-up and step-down levels plotted in lime and red, respectively.
Outer Bands: Upper and lower ATR-based bands plotted in aqua, with a filled region between the bands for easy visualization of price volatility.
Candlestick Coloring: Green bars for bullish and red for bearish price action.
8. Real-Time Board Display:
A table is created in the top-right corner of the chart to display:
The current closing price.
The market direction ("Bullish" or "Bearish").
The PL Dot value. The table updates on the most recent bar (barstate.islast).
9. Dynamic Labels:
On the most recent bar, labels are added dynamically to the upper and lower bands and the ma1. These labels help in identifying the values of key indicators directly on the chart.
10. Signals and Alerts:
Bullish and Bearish Cross: Visual signals are plotted on the chart when ma1 crosses above or below ma2. These are represented as up and down triangles, providing potential buy/sell signals.
Key Features Summarized:
Multi-Timeframe Moving Averages: 3 MAs based on different timeframes.
Dynamic ATR Bands: ATR-based upper and lower boundaries for volatility measurement.
Step Lines: Short-term high and low lines for support/resistance.
PL Dot: A short-term trend identifier.
Real-Time Dashboard: Live updates of price, trend, and PL Dot on the chart.
Visual Alerts: Dynamic labeling and crossover signals to assist in decision-making.
This script is designed for traders who want to track price movement within bands, evaluate trends across multiple timeframes, and visualize short-term market direction with dynamic alerts.

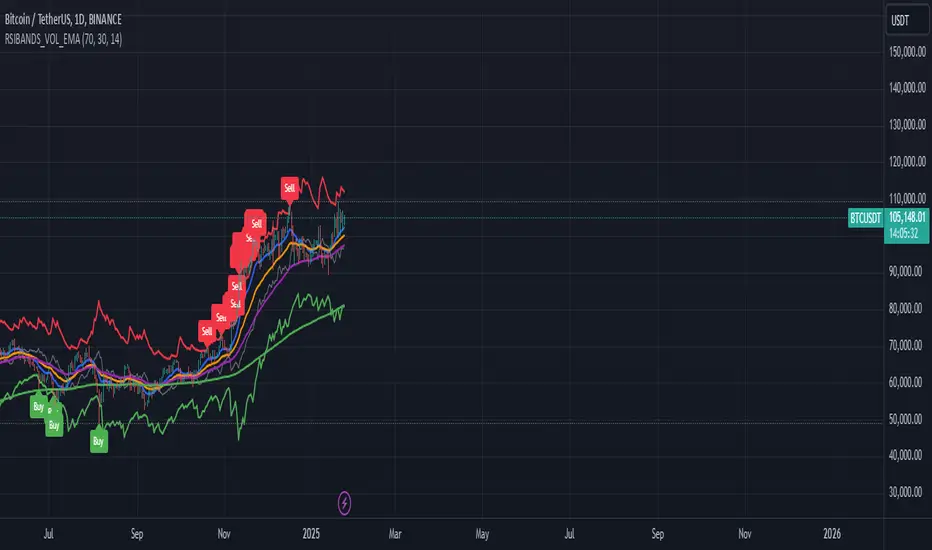
RSI Bands with Volume and EMAThis script is a comprehensive technical analysis tool designed to help traders identify key market signals using RSI bands, volume, and multiple Exponential Moving Averages (EMAs). It overlays the following on the chart:
RSI Bands: The script calculates and plots two bands based on the Relative Strength Index (RSI), indicating overbought and oversold levels. These bands act as dynamic support and resistance zones:
Resistance Band (Upper Band): Plotted when the RSI exceeds the overbought level, typically indicating a potential sell signal.
Support Band (Lower Band): Plotted when the RSI falls below the oversold level, typically indicating a potential buy signal.
Midline: The average of the upper and lower bands, acting as a neutral reference.
Buy/Sell Labels: Labels are dynamically added to the chart when price reaches the overbought or oversold levels.
A "Buy" label appears when the price reaches the oversold (lower) band.
A "Sell" label appears when the price reaches the overbought (upper) band.
Volume Indicator: The script visualizes trading volume as histograms, with red or green bars representing decreasing or increasing volume, respectively. The volume height is visually reduced for better clarity and comparison.
Exponential Moving Averages (EMAs): The script calculates and plots four key EMAs (12, 26, 50, and 200) to highlight short-term, medium-term, and long-term trends:
EMA 12: Blue
EMA 26: Orange
EMA 50: Purple
EMA 200: Green
The combined use of RSI, volume, and EMAs offers traders a multi-faceted view of the market, assisting in making informed decisions about potential price reversals, trends, and volume analysis. The script is particularly useful for identifying entry and exit points on charts like BTC/USDT, although it can be applied to any asset.
SMA with ATR BandsSMA with ATR Bands
This custom indicator combines the Simple Moving Average (SMA) with Average True Range (ATR) bands. It’s designed to help traders identify potential price reversals and gauge volatility. Here’s what it does:
Simple Moving Average (SMA):
The SMA represents the average price over a specified period.
It acts as a trend-following line, smoothing out price fluctuations.
The blue line on the chart represents the SMA.
ATR Bands:
The ATR measures volatility by calculating the average range between high and low prices.
We add and subtract the ATR (multiplied by a user-defined factor) from the SMA to create the bands.
The green upper band and red lower band dynamically adjust based on volatility.
How to Use It:
Volatility Signals: When the bands are close together (a “squeeze”), it indicates low volatility. A breakout often follows.
Overbought/Oversold: Price touching the upper band suggests overbought conditions, while touching the lower band suggests oversold conditions.
Trend Confirmation: The indicator can confirm trends.
Feel free to use this indicator on TradingView to enhance your trading strategy. Remember to customize the parameters according to your preferences. Happy trading! 📈🚀
arpit bollinger bandStrategy Overview:
This strategy utilizes Bollinger Bands based on a 20-period Exponential Moving Average (EMA) with a standard deviation multiplier of 1.5. It is designed to generate early trading signals based on the relationship between the price action and the Bollinger Bands.
Bollinger Bands Calculation:
The upper Bollinger Band is calculated as the 20-period EMA of the closing prices plus 1.5 times the standard deviation of the same period.
The lower Bollinger Band is calculated as the 20-period EMA of the closing prices minus 1.5 times the standard deviation.
Entry Criteria:
Buy Signal: A buy signal is generated when the current candle's high exceeds the high of the candle two periods ago, which had closed below the lower Bollinger Band. This condition implies an anticipation of a bullish reversal.
Sell Signal: A sell signal is generated when the current candle's low falls below the low of the candle two periods ago, which had closed above the upper Bollinger Band. This condition suggests an anticipated bearish reversal.
Stop Loss and Take Profit:
The stop loss for a buy order is set slightly below the low of the current candle, and for a sell order, it is set slightly above the high of the current candle.
The take profit level is determined based on a predefined risk-reward ratio of 1:3. This means the take profit target is set at a distance three times greater than the distance between the entry price and the stop loss.
Risk Management:
The strategy includes an input option to adjust the risk-reward ratio, allowing for flexibility in managing the trade's potential risk versus reward.
Trade Execution:
The strategy automatically plots the buy and sell signals on the chart and executes the trades according to the defined conditions. It also visually indicates the stop loss levels for each trade.
Usage Notes:
This strategy is designed for use in the TradingView platform using Pine Script version 5.
It is important to backtest and paper trade the strategy before using it in live trading to understand its performance characteristics and risk profile.
The strategy should be used as part of a comprehensive trading plan, considering market conditions, trader risk tolerance, and personal trading goals.

Customizable 52 Week High & Range BandsTitle: Customizable 52 Week High & Range Bands Indicator
Description:
The "Customizable 52 Week High & Range Bands" indicator is a novel tool designed for traders and investors who seek to gain insights into an asset's long-term performance while simultaneously identifying potential support and resistance levels through customizable percentage-based range bands.
Key Features:
52-Week High Visualization: At its core, this indicator pinpoints the highest price reached by an asset over the past 52 weeks, offering a clear view of its peak performance in the yearly window.
Adjustable Range Bands: Unlike fixed indicators, this tool allows users to set a custom percentage above and below the 52-week high to create upper and lower range bands. These bands are invaluable for traders looking to gauge potential breakout or pullback zones relative to historical highs.
Strategic Decision-Making: By adjusting the range bands, users can tailor the indicator to match their trading style, whether it be conservative or aggressive, making it a versatile addition to any trading strategy.
How to Use:
Customize the Percentage: Begin by setting your desired percentage for the range bands through the indicator settings. This will adjust the upper and lower bands to encapsulate the range you're interested in monitoring.
Analyze the Bands: The 52-week high and its corresponding range bands are plotted directly on the chart, offering immediate visual cues. Look for price actions that approach or breach these bands to identify potential trading opportunities.
Incorporate into Your Strategy: Use the information provided by the indicator in conjunction with other analysis tools or indicators to refine your trading decisions and strategies.
This indicator stands out by providing not just a static view of the past year's performance but a dynamic tool that can be customized to fit the individual trader's needs, making it a valuable addition to the TradingView Community.

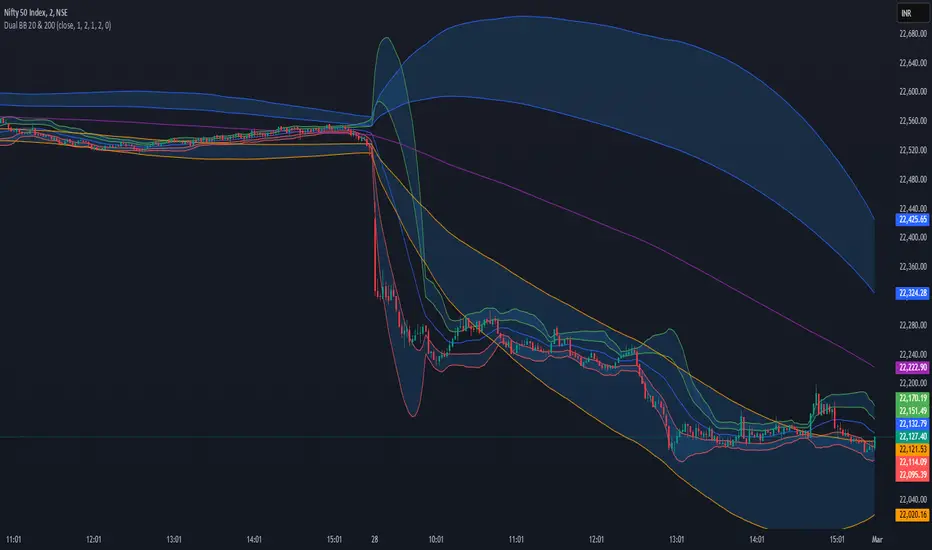
Dual Bollinger Bands (20 & 200)Dual Bollinger Bands (20 & 200) - Enhanced Trading Strategy
Overview
The Dual Bollinger Bands (20 & 200) indicator is an enhanced version of the Double Bollinger Bands by Alixnet. This advanced tool integrates two sets of Bollinger Bands with 20-period (short-term) and 200-period (long-term) moving averages, helping traders identify market trends, volatility, and potential trade setups more effectively.
Key Features
✅ Two Bollinger Band Sets – Short-term (20-period) and Long-term (200-period).
✅ Enable/Disable Each BB – Customize visibility for better analysis.
✅ Multiple Standard Deviations – Identify different levels of volatility.
✅ Background Fill for Clarity – Highlights volatility zones.
How to Use This Indicator Effectively
1. Understanding the Two Bollinger Bands
BB1 (20-Period): Measures short-term price movements and volatility.
BB2 (200-Period): Acts as a long-term trend filter to determine the dominant trend.
2. Trade Entries & Exits
Bullish Trade Setup (Long Entry)
🔹 Price Above 200 MA Basis Line (BB2) – Confirms an uptrend.
🔹 Price Pulls Back to the Lower Band of BB1 (20 MA) – Ideal buy opportunity.
🔹 Confirmation: If price bounces off the lower BB1 band and moves back toward the midline or upper band, enter a long position.
🔹 Exit: When price touches or exceeds the upper BB1 band.
Bearish Trade Setup (Short Entry)
🔹 Price Below 200 MA Basis Line (BB2) – Confirms a downtrend.
🔹 Price Pulls Back to the Upper Band of BB1 (20 MA) – Ideal short opportunity.
🔹 Confirmation: If price gets rejected at the upper BB1 band and moves downward, enter a short position.
🔹 Exit: When price reaches or drops below the lower BB1 band.
3. Avoiding Sideways Markets
❌ Avoid trading when price stays between the two bands of BB1 without breaking out.
❌ Flat 200 MA Line (BB2 Basis) indicates a ranging market – best to wait for a breakout.
✅ Wait for Price to Cross the 200 MA Basis Line to confirm trend direction before entering trades.
4. Catching Trending Moves
✅ Strong Trend Confirmation: When price stays above or below the 20-period BB bands and also above/below the 200-period MA.
✅ Trend Continuation: If price consolidates near the upper or lower bands without breaking opposite levels.
✅ Breakout Confirmation: Look for a candle close outside BB1 bands with momentum to confirm strong moves.
Final Thoughts
The Dual Bollinger Bands (20 & 200) indicator is a powerful tool for both short-term traders and long-term investors. By combining the short-term volatility of the 20-period BB with the long-term trend of the 200-period BB, traders can make more informed trading decisions, filter out noise, and capture high-probability trade setups.
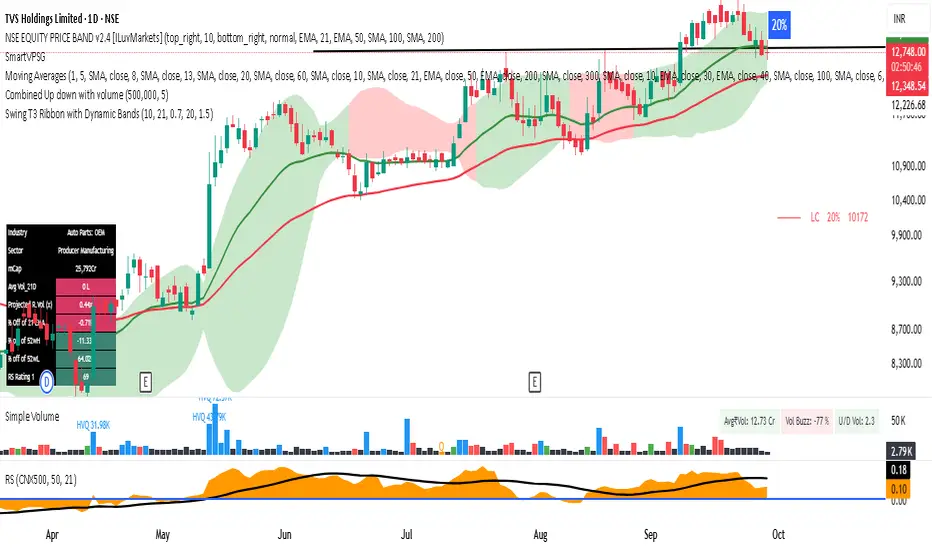
Swing T3 Ribbon with Dynamic Bandswing T3 Ribbon with Dynamic Bands
This indicator combines T3 moving averages with a dynamic Bollinger-style ribbon to highlight early trend changes and volatility-driven price moves.
Key Features:
T3 Ribbon: Fast T3 vs. Slow T3 shows trend direction; ribbon color is green for bullish, red for bearish.
Dynamic Bands: Bands fluctuate with recent price volatility, similar to Bollinger Bands, providing a visual guide for overbought/oversold areas.
Early Swing Markers:
E0 (Early Upswing): Price above top band while trend is temporarily bearish.
Ex (Early Downswing): Price below bottom band while trend is temporarily bullish.
Alerts:
Early upswing (E0)
Early downswing (Ex)
Price crossing the bottom (red) band from below.
Purpose:
Helps traders detect early trend reversals or price breakouts in the context of volatility.
Dynamic bands adapt to changing market conditions, giving a more responsive signal than fixed-width ribbons.
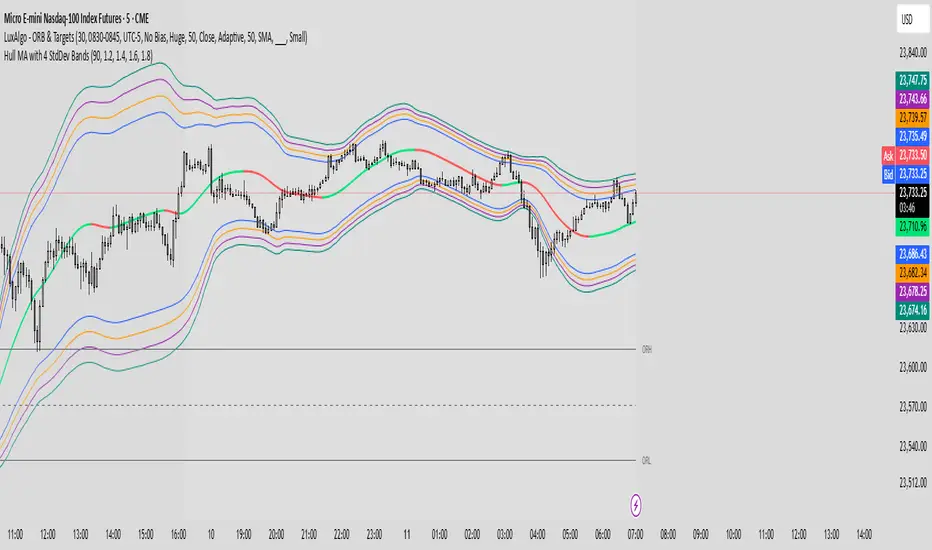
Hull MA with 4 StdDev Bandsull MA with Multi-StdDev Bands
This indicator plots a Hull Moving Average (HMA) of (High + Low) / 2 with a default length of 90, surrounded by four customizable standard deviation bands.
Features:
Dynamic Hull MA coloring: Green when price trend is rising, red when falling.
Customizable deviation levels: Default set to 1.2, 1.4, 1.6, and 1.8 standard deviations, adjustable in the settings.
4 upper and 4 lower volatility bands: Based on the standard deviation of price relative to the Hull MA, providing a clear visual of potential overbought and oversold zones.
Uses:
Identify trend direction quickly via Hull MA color change.
Monitor volatility expansion/contraction.
Spot potential reversal or breakout areas when price interacts with outer bands.