Standard Error Bands**Standard Error Bands Indicator: A Statistically Robust Tool for Trend Analysis**
The Standard Error Bands (SEB) indicator is a powerful technical analysis tool designed to help traders identify and assess trends with greater accuracy. Unlike traditional band indicators (e.g., Bollinger Bands) that rely on price averages, SEB leverages linear regression and statistical measures of volatility to offer deeper insights into market dynamics.
**How It Works**
1. **Linear Regression:** The indicator first calculates a linear regression line to model the underlying price trend. This line represents the "best fit" of price data over the specified lookback period.
2. **Standard Error:** Next, it calculates the standard error of the regression. This statistical measure quantifies the average distance between actual prices and the regression line, effectively acting as a volatility gauge.
3. **Smoothing:** Both the linear regression line and the standard error values are smoothed using a Simple Moving Average (SMA) to reduce noise and enhance the visual clarity of the bands.
4. **Band Construction:** The upper and lower bands are formed by adding/subtracting a multiple of the smoothed standard error from the smoothed linear regression line. The default multiplier is 2, representing approximately 95% of price action expected within the bands under normal market conditions.
**Key Insights**
* **Trend Strength:** Tight bands suggest a strong, well-defined trend with low volatility. Prices tend to adhere closely to the regression line, indicating a high probability of trend continuation.
* **Trend Weakness/Change:** Widening or expanding bands signal increased volatility and potential trend weakness. Prices deviating from the regression line may suggest an impending trend reversal or a shift into a sideways consolidation phase.
* **Entry/Exit Signals:**
* Consider entering a trade when prices break out of the bands in the direction of the trend, especially if the bands were previously tight.
* Conversely, consider exiting a trade when prices pierce the bands against the trend or when the bands start to widen significantly.
**Use Cases**
* **Trend Identification:** SEB can help traders identify trends earlier and more accurately than moving average-based indicators.
* **Trend Confirmation:** The bands can be used to confirm the validity and strength of an existing trend.
* **Volatility Assessment:** Changes in band width provide valuable insights into market volatility, aiding risk management decisions.
* **Entry/Exit Timing:** SEB can be incorporated into trading strategies to generate timely entry and exit signals.
**Important Considerations**
* **Parameter Optimization:** Experiment with different lookback periods, smoothing values, and standard error multipliers to find the optimal settings for your preferred trading style and market conditions.
* **Supplementary Indicators:** Combine SEB with other technical indicators (e.g., momentum oscillators, volume analysis) for a more comprehensive market assessment.
* **Backtesting:** Thoroughly backtest any SEB-based trading strategy to ensure its effectiveness before deploying it in live markets.
**Disclaimer:** Technical indicators like SEB are valuable tools but should not be used in isolation. Always consider price action or fundamental factors and risk management principles when making trading decisions.
Search in scripts for "band"

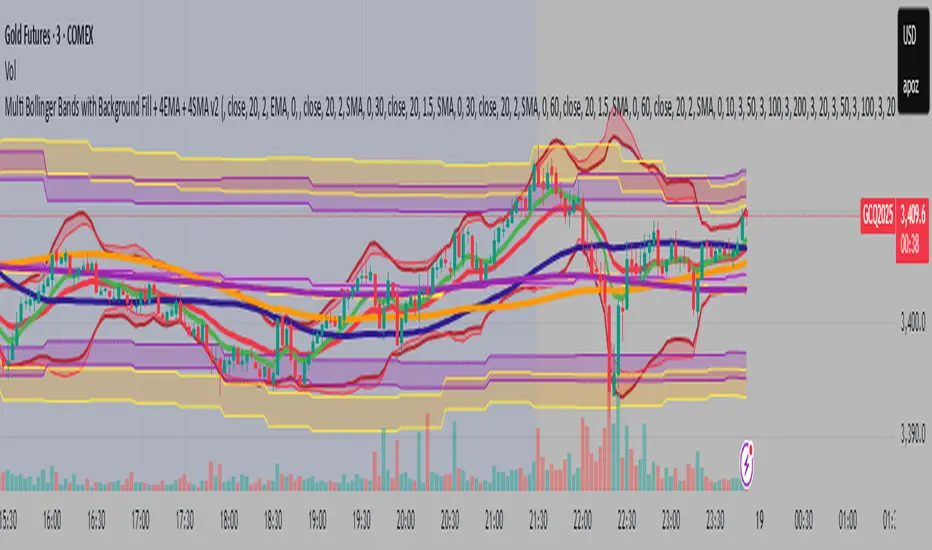
Multi Bollinger Bands with Background FillMulti Bollinger Bands with Background Fill
多組帶狀背景布林通道
This indicator plots six independent Bollinger Bands channels on the price chart, each fully configurable with customizable period length, standard deviation, and colors for upper, lower, and middle bands. Users can choose to display or hide each channel and its middle band independently.
A distinctive feature of this tool is the option to enable colored background fills between paired Bollinger Bands (channels 1&2, 3&4, and 5&6) to visually highlight volatility zones, improving the clarity of price action and aiding in multi-timeframe volatility analysis.
Key Features:
Six independent Bollinger Bands channels with separate visibility toggles.
Adjustable length and standard deviation for each channel.
Option to display or hide the middle band (basis) for each channel.
Unique colored background fills between paired upper and lower bands for enhanced visual interpretation.
Custom color settings for each band and background for better differentiation.
This indicator is designed for traders looking for advanced multi-layered volatility insights and clearer visual guidance when analyzing price behavior across different timeframes. It is suitable for various trading strategies including trend analysis and volatility-based setups.
Bollinger Band StrategyDescription of the Bollinger Band Breakout Strategy
This trading strategy, credited to Siddhart Bhanushali, is a momentum-based approach that uses Bollinger Bands and a 22-period Simple Moving Average (SMA) to identify high-probability breakout trades. It focuses on detecting periods of low volatility (contraction) followed by high volatility (expansion) to enter trades with a favorable risk-reward ratio. The strategy is designed to capture significant price movements in trending markets, with clear rules for entry, stop loss, and profit targets.
Strategy Overview
The strategy generates buy and sell signals based on specific conditions involving the 22-period SMA and Bollinger Bands. It aims to enter trades when the price breaks out of a consolidation phase, confirmed by the direction of the SMA and the behavior of a green or red candle relative to the Bollinger Bands. The minimum target for each trade is a 1:2 risk-reward ratio.
Credit
This strategy is credited to Siddhart Bhanushali, who designed it to leverage Bollinger Band breakouts in trending markets, providing a clear and systematic approach to trading with defined risk-reward parameters.
ATR+StdTR Band and Trailing StopThis Pine Script code plots the "ATR+StdTR Band and Trailing Stop," serving as a tool for volatility-based risk management and trend detection. While bands are typically set using a multiple of ATR, this script uses StdTR (the True Range standard deviation) and sets the band width based on ±(ATR + n times StdTR). StdTR is a great tool for detecting price volatility and anomalies, allowing traders to adapt to rapid changes in extreme market conditions. This helps traders proactively manage risk during sudden market fluctuations.
The following features are provided:
Table Display
A table is shown on the chart, allowing traders to visually track the current ATR value, StdTR (σ), and the long/short stop-loss levels (±ATR ± nσ). This enables real-time monitoring of risk management data.
Band Plots
The script plots bands that combine ATR with StdTR (nσ).
The upper and lower bands are calculated using the previous candle’s closing price (the source is customizable) and are plotted as ±(ATR + nσ), providing a clear visual of the price range.
ATR ± nσ Trailing Stop
The trailing stop dynamically adjusts the stop-loss levels based on price movements. In an uptrend, the stop-loss rises, while in a downtrend, it lowers, helping traders lock in profits while minimizing losses during significant reversals.
Breakout Detection
Breakouts are detected when the price exceeds the upper band or drops below the lower band. A visual marker (X) is displayed on the chart, allowing traders to quickly recognize when the price has moved beyond normal volatility ranges, making it easier to respond to trend formations or reversals.
Customization Points:
The ATR period and StdTR (n) are fully customizable.
The source for ATR band calculation can be adjusted, allowing traders to choose from close, open, high, low, etc.
The table’s display position and design (text color, size, etc.) can be customized to present the information clearly and effectively.

BBMA Enhanced Pro - Multi-Timeframe Band Breakout StrategyShort Title : BBMA Pro
Overview
The BBMA Enhanced Pro is a professional-grade trading indicator that builds on the Bollinger Bands Moving Average (BBMA) strategy, pioneered by Omar Ali , a Malaysian forex trader and educator. Combining Bollinger Bands with Weighted Moving Averages (WMA) , this indicator identifies high-probability breakout and reversal opportunities across multiple timeframes. With advanced features like multi-timeframe Extreme signal detection, eight professional visual themes, and a dual-mode dashboard, it’s designed for traders seeking precision in trending and consolidating markets. Optimized for dark chart backgrounds, it’s ideal for forex, stocks, and crypto trading.
History
The BBMA strategy was developed by Omar Ali (BBMA Oma Ally) in the early 2010s, gaining popularity in the forex trading community, particularly in Southeast Asia. Building on John Bollinger’s Bollinger Bands, Omar Ali integrated Weighted Moving Averages and a multi-timeframe approach to create a structured system for identifying reversals, breakouts, and extreme conditions. The BBMA Enhanced Pro refines this framework with modern features like real-time dashboards and customizable visualizations, making it accessible to both novice and experienced traders.
Key Features
Multi-Timeframe Extreme Signals : Detects Extreme signals (overbought/oversold conditions) on both current and higher timeframes simultaneously, a rare feature that enhances signal reliability through trend alignment.
Professional Visual Themes : Eight distinct themes (e.g., Neon Contrast, Fire Gradient) optimized for dark backgrounds.
Dual-Mode Dashboard : Choose between Full Professional (detailed metrics) or Simplified Trader (essential info with custom notes).
Bollinger Band Squeeze Detection : Identifies low volatility periods (narrow bands) signaling potential sideways markets or breakouts.
Confirmation Labels : Displays labels when current timeframe signals align with recent higher timeframe signals, highlighting potential consolidations or squeezes.
Timeframe Validation : Prevents selecting the same timeframe for current and higher timeframe analysis.
Customizable Visualization : Toggle signal dots, EMA 50, and confirmation labels for a clean chart experience.
How It Works
The BBMA Enhanced Pro combines Bollinger Bands (20-period SMA, ±2 standard deviations) with WMA (5 and 10 periods) to generate trade signals:
Buy Signal : WMA 5 Low crosses above the lower Bollinger Band, indicating a recovery from an oversold condition (Extreme buy).
Sell Signal : WMA 5 High crosses below the upper Bollinger Band, signaling a rejection from an overbought condition (Extreme sell).
Extreme Signals : Occur when prices or WMAs move significantly beyond the Bollinger Bands (±2σ), indicating statistically rare overextensions. These often coincide with Bollinger Band Squeezes (narrow bands, low standard deviation), signaling potential sideways markets or impending breakouts.
Multi-Timeframe Confirmation : The indicator’s unique strength is its ability to detect Extreme signals on both the current and higher timeframe (HTF) within the same chart. When the HTF generates an Extreme signal (e.g., buy), and the current timeframe follows with an identical signal, it suggests the lower timeframe is aligning with the HTF’s trend, increasing reliability. Labels appear only when this alignment occurs within a user-defined lookback period (default: 50 bars), highlighting periods of band contraction across timeframes.
Bollinger Band Squeeze : Narrow bands (low standard deviation) indicate reduced volatility, often preceding consolidation or breakouts. The indicator’s dashboard tracks band width, helping traders anticipate these phases.
Why Multi-Timeframe Extremes Matter
The BBMA Enhanced Pro’s multi-timeframe approach is rare and powerful. When the higher timeframe shows an Extreme signal followed by a similar signal on the current timeframe, it suggests the market is following the HTF’s trend or entering a consolidation phase. For example:
HTF Sideways First : If the HTF Bollinger Bands are shrinking (low volatility, low standard deviation), it signals a potential sideways market. Waiting for the current timeframe to show a similar Extreme signal confirms this consolidation, reducing the risk of false breakouts.
Risk Management : By requiring HTF confirmation, the indicator encourages traders to lower risk during uncertain periods, waiting for both timeframes to align in a low-volatility state before acting.
Usage Instructions
Select Display Mode :
Current TF Only : Shows Bollinger Bands and WMAs on the chart’s timeframe.
Higher TF Only : Displays HTF bands and WMAs.
Both Timeframes : Combines both for comprehensive analysis.
Choose Higher Timeframe : Select from 1min to 1D (e.g., 15min, 1hr). Ensure it differs from the current timeframe to avoid validation errors.
Enable Signal Dots : Visualize buy/sell Extreme signals as dots, sourced from current, HTF, or both timeframes.
Toggle Confirmation Labels : Display labels when current timeframe Extremes align with recent HTF Extremes, signaling potential squeezes or consolidations.
Customize Dashboard :
Full Professional Mode : View metrics like BB width, WMA trend, and last signal.
Simplified Trader Mode : Focus on essential info with custom trader notes.
Select Visual Theme : Choose from eight themes (e.g., Ice Crystal, Royal Purple) for optimal chart clarity.
Trading Example
Setup : 5min chart, HTF set to 1hr, signal dots and confirmation labels enabled.
Buy Scenario : On the 5min chart, WMA 5 Low crosses above the lower Bollinger Band (Extreme buy), confirmed by a recent 1hr Extreme buy signal within 50 bars. The dashboard shows narrow bands (squeeze), and a green label appears.
Action : Enter a long position, targeting the middle band, with a stop-loss below the recent low. The HTF confirmation suggests a strong trend or consolidation phase.
Sell Scenario : WMA 5 High crosses below the upper Bollinger Band on the 5min chart, confirmed by a recent 1hr Extreme sell signal. The dashboard indicates a squeeze, and a red label appears.
Action : Enter a short position, targeting the middle band, with a stop-loss above the recent high. The aligned signals suggest a potential reversal or sideways market.
Customization Options
BBMA Display Mode : Current TF Only, Higher TF Only, or Both Timeframes.
Higher Timeframe : 1min to 1D.
Visual Theme : Eight professional themes (e.g., Neon Contrast, Forest Glow).
Line Style : Smooth or Step Line for HTF plots.
Signal Dots : Enable/disable, select timeframe source (Current, Higher, or Both).
Confirmation Labels : Toggle and set lookback window (1-100 bars).
Dashboard : Enable/disable, choose mode (Full/Simplified), and set position (Top Right, Bottom Left, etc.).
Notes
Extreme Signals and Squeezes : Extreme signals often occur during Bollinger Band contraction (low standard deviation), signaling potential sideways markets or breakouts. Use HTF confirmation to filter false signals.
Risk Management : If the HTF shows a squeeze (narrow bands), wait for the current timeframe to confirm with an Extreme signal to reduce risk in choppy markets.
Limitations : Avoid trading Extremes in highly volatile markets without additional confirmation (e.g., volume, RSI).
Author Enhanced Professional Edition, inspired by Omar Ali’s BBMA strategy
Version : 6.0 Pro - Simplified
Last Updated : September 2025
License : Mozilla Public License 2.0
We’d love to hear your feedback! Share your thoughts or questions in the comments below.

Bollinger Bands Multi TFBollinger Bands Multi TF Indicator
Overview
The Bollinger Bands Multi TF Indicator allows traders to overlay two sets of Bollinger Bands from different timeframes onto the same chart. This provides a broader market perspective by helping identify volatility and trend direction across multiple timeframes.
Features
✅ Dual Timeframe Support – Configure Bollinger Bands for two different timeframes (default: 15 min & 5 min).
✅ Customizable Moving Averages – Choose from SMA, EMA, SMMA (RMA), WMA, or VWMA as the basis line for each band.
✅ Dynamic Standard Deviation – Adjust the standard deviation multiplier for each timeframe.
✅ Visual Clarity – Different colors for each Bollinger Band set, with background filling for better visualization.
How to Use
🔹 Use the higher timeframe Bollinger Bands to identify overall trend and key resistance/support levels.
🔹 Use the lower timeframe Bollinger Bands for fine-tuned entry/exit signals within the broader trend.
🔹 A tightening of bands may indicate low volatility, signaling a potential breakout.
🔹 A widening of bands may suggest increased volatility and trend continuation.
Ideal For
📈 Intraday and swing traders looking for multi-timeframe confluence.
📊 Volatility-based traders who use Bollinger Bands for breakouts or reversals.
📍 Any trader wanting a deeper market context beyond a single timeframe.

Triple HMA Bands (1.2 / 1.4 / 1.6)📈 Triple HMA Bands — Custom Volatility & Trend Indicator
Description:
The Triple HMA Bands indicator combines the Hull Moving Average (HMA) with volatility-based envelopes, similar to Bollinger Bands, to visualize trend direction and market extremes.
The HMA (length 90) serves as the central trend line, offering a smooth and responsive view of market direction.
Surrounding the HMA are three dynamic bands calculated using standard deviations of price:
Inner Band (1.2σ) — normal volatility range.
Middle Band (1.4σ) — elevated volatility zone.
Outer Band (1.6σ) — statistically extreme price movement.
The shaded zones between the bands help visualize volatility expansion and contraction, making it easier to identify:
Trend strength and stability
Potential reversal zones
Breakout or breakdown events
How to Use:
Price staying within the inner band may indicate a stable trend or consolidation.
Price reaching or exceeding the outer band suggests overbought/oversold conditions and potential reversal.
Widening bands = rising volatility; narrowing bands = low volatility, often before a breakout.
This indicator is ideal for trend traders, mean reversion strategies, or anyone wanting a volatility-sensitive trend filter.
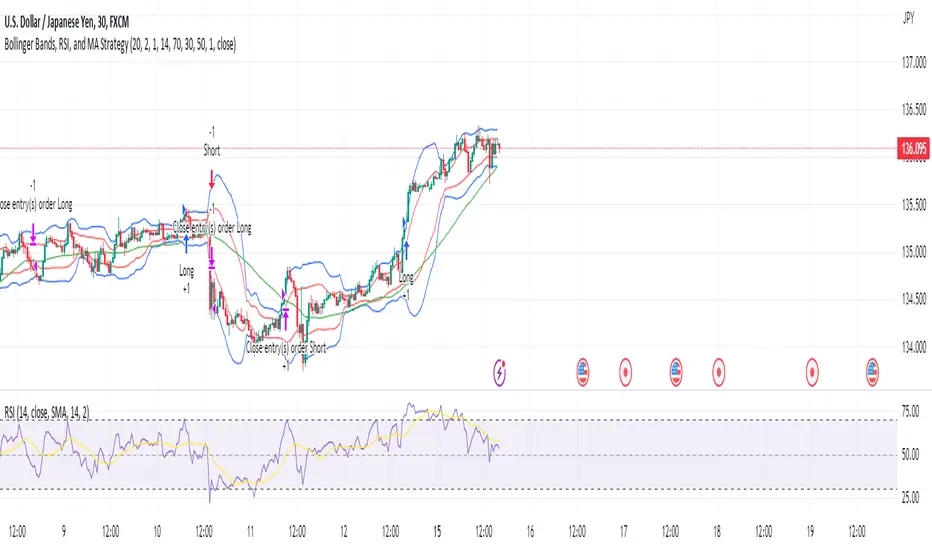
Bollinger Bands, RSI, and MA StrategyThe "Bollinger Bands, RSI and MA Strategy" is a trend-following strategy that combines the Bollinger Bands indicator, the Relative Strength Index (RSI), and a moving average (MA). It aims to identify potential entry and exit points in the market based on price volatility, momentum, and trend.
The strategy uses two Bollinger Bands with different standard deviations to create price channels. The default settings for the Bollinger Bands are a length of 20 periods and a standard deviation of 2.0. The upper and lower bands of the Bollinger Bands serve as dynamic resistance and support levels, respectively.
The RSI indicator is employed to gauge the strength of price momentum.
The strategy also incorporates a 50-period moving average (MA) to help identify the overall trend direction. When the price is above the MA, it suggests an uptrend, and when the price is below the MA, it suggests a downtrend.
The entry conditions for long trades are when the RSI is above the overbought level and there is no contraction in the Bollinger Bands. For short trades, the entry conditions are when the RSI is below the oversold level and there is no contraction in the Bollinger Bands.
The exit conditions for long trades are when the RSI drops below the overbought level or when the price closes below the 50-period MA.
For short trades, the exit conditions are when the RSI goes above the oversold level or when the price closes above the 50-period MA.
The strategy generates alerts for potential long and short entry signals, as well as for exit signals when the specified conditions are met. These alerts can be used to receive notifications or take further actions, such as placing trades manually or using automated trading systems.
It is important to note that this strategy serves as a starting point and should be thoroughly backtested and validated with historical data before applying it to live trading. Additionally, it is recommended to consider risk management techniques, including setting appropriate stop-loss and take-profit levels, to effectively manage trades.
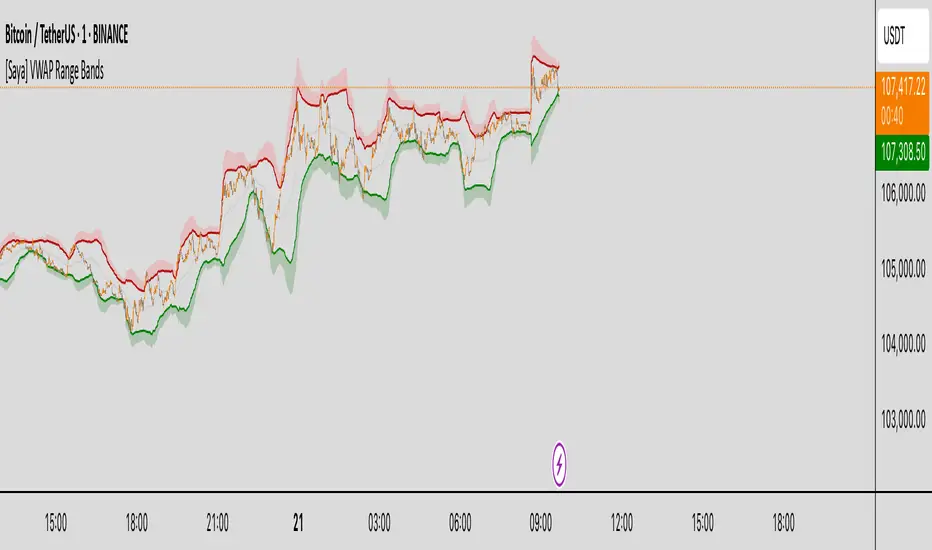
[Saya] VWAP Range Bands VWAP Range Bands is a custom volatility-based indicator that visualizes dynamic support and resistance zones using a volume-weighted average price (VWAP) combined with adaptive deviation bands.
🔍 Features:
• VWAP-based midline for mean reversion insight
• Dynamic upper and lower bands based on average deviation or standard deviation
• Visual highlights when price crosses extreme zones
• Optional deviation count table to monitor how often price breaks out
Great for identifying high-probability reversal or continuation areas in both trending and ranging markets.
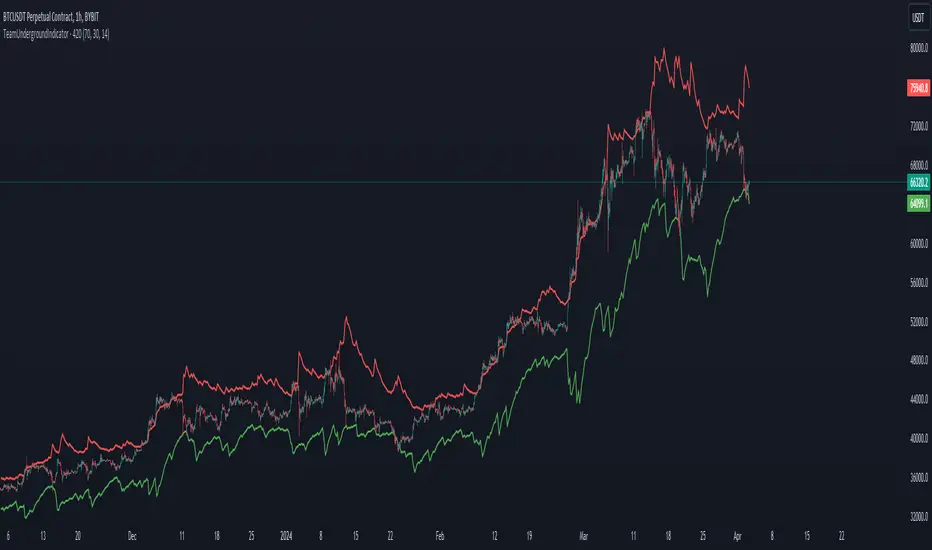
Team Undergrounds Magic RSI BandsWhat is this indicator?
This indicator shows RSI but visualize as bands with custom timeframe settings. Normal RSI doesn't really visualse well when the price gets overbought/oversold and generally because of candle closes it can be hard to determine if the price has already touched the prefered RSI level. The custom timeframe allows you to go to shorter or longer timeframes on the chart while maintaining the same timeframe on the RSI indicator.
How does it work?
Add this indicator to the chart, and you'll see 2 bands (green and red). By standard settings, the green band shows when price goes below 30 RSI and the red line when price goes above 70 on the RSI. By standard settings the RSI band is set to 7 hour because this tends to work well with Bitcoin and crypto in general, but the timeframe can be changed in the settings. 12hr, 3hr, 3D, 1W are all good timeframes based off personal preference. The overbought/oversold level and RSI length can also be adjusted.
Indicator is not a financial advice tool, and offcourse, data can always change. Past price does not predict future price by defintion.
Foxy's Logarithmic Bollinger BandsThis versatile indicator plots logarithmic Bollinger Bands on any financial asset or timeframe in the TradingView platform. Unlike traditional Bollinger Bands, which use simple arithmetic calculations, Foxy's LBB employs logarithmic scales to better capture and visualize percentage-based price movements.
The core functionality includes:
Basis Line: A central moving average line calculated on the log10 of the selected price source (default is close price). Multiple moving average types are available, including SMA, EMA, RMA, and volume-weighted variants.
Upper/Lower Bands 1: The first set of upper and lower bands, plotted at a user-defined number of standard deviations (default 2.0) above and below the Basis Line.
Upper/Lower Bands 2: A second set of bands plotted at a different standard deviation level (default 3.0) to cater to different volatility preferences.
Offset: An option to vertically offset the plotted lines for better visualization alongside other indicators or studies.
By using a logarithmic scale, Foxy's LBB provides a more accurate representation of percentage-based price changes, making it particularly useful for analyzing and trading volatile assets or markets with significant price swings.
Traders can leverage this indicator for various purposes, such as identifying potential overbought/oversold conditions, gauging volatility levels, and spotting trend continuations or reversals based on the interaction between price and the band levels.
Whether you're a seasoned trader or just starting, Foxy's LBB offers a powerful and flexible tool to enhance your technical analysis and decision-making process in the TradingView environment.

S2BU2 True Range BandsWhat it is:
A twist on the DMI and ATR indicators.
How it is calculated:
What you see is a basic 14-period EMA calculated based on the opening price of the candle.
Extending from this base is the average true range, showing the expected realistic movement in that direction.
How you may interpret what you see:
Extended movement outside of those bands indicates a strong trend and also indicates a bad time to enter. In a sideways market the best time to get in and out is whenever the chart crosses the upper/lower bands. As usual, do not use this indicator alone to determine your entries/exits. If you find a regular behaviour related to this indicator that is not mentioned here feel free to reach out to me. I will consider adding it the list
How you may improve accuracy:
Most obvious - combine with different indicators measuring different things. This indicator measures potential direction. You may combine it with a simple trendindicator, momentum-indicator, etc. There is little use in combining it with another indicator measuring the same thing. When using 2 indicators for the same aspect, pick the one that is more reliable or reacts faster - depending on your preference and strategy.
Another Option to improve accuracy is to overlap the indicator on several timeframes. Dissonance is weakness. Ressonance is strength. if you see many tfs showing the same movement it may be a good time to get in - you will have to judge it yourself though ;)

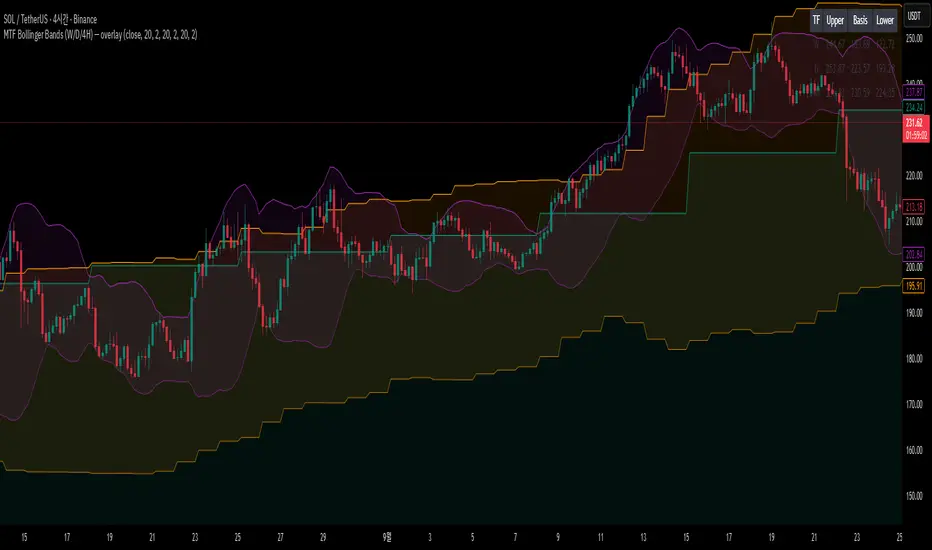
MTF Bollinger Bands (W/D/4H)MTF Bollinger Bands (W/D/4H)
Always mark the 1W 1D 4H bolinger band regardless of the time frame.
Bollinger Bands (Log Scale)📈 Bollinger Bands on log scale are broken.
Many traders use log charts for better price symmetry—but still apply Bollinger Bands calculated on linear price. That mismatch creates distorted signals.
Here’s what I found:
- Standard deviation becomes misleading on log scale
- Band width no longer reflects true volatility
- Breakout signals lose behavioral clarity
🛠 So I rewrote the logic.
My version calculates Bollinger Bands using log(price) for both mean and deviation, then maps the result back to price. It behaves correctly on log charts and aligns better with behavioral scoring.

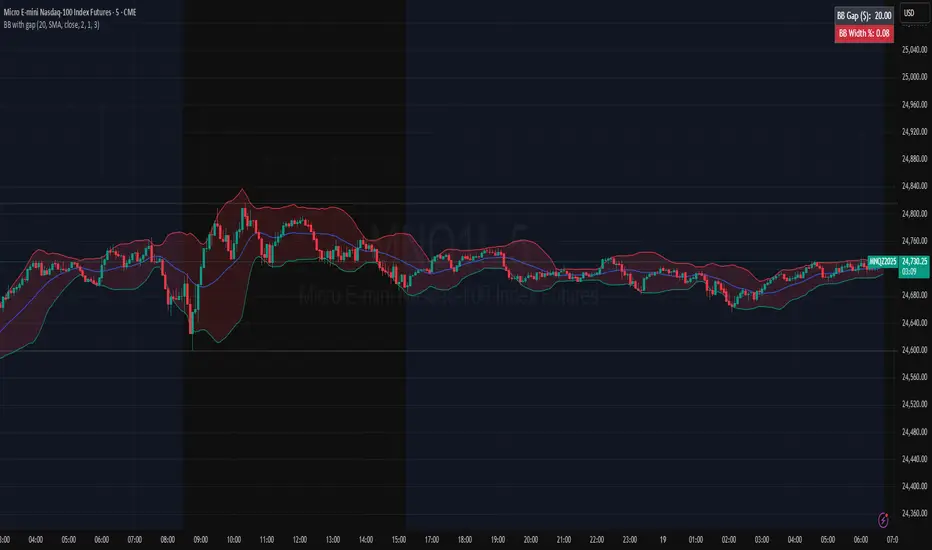
Bollinger Bands (with Width/GaUGE)This overlay plots standard Bollinger Bands and makes volatility obvious. The fill between bands is color-coded by band width (tight = red “squeeze”, wide = teal “expansion”, mid = yellow). A compact table (top-right) shows live BB Gap ($) and BB Width (%), and the width also appears in the status line. Thresholds for squeeze/expansion are user-set. Use it to avoid low-volatility chop and time breakouts when width expands.
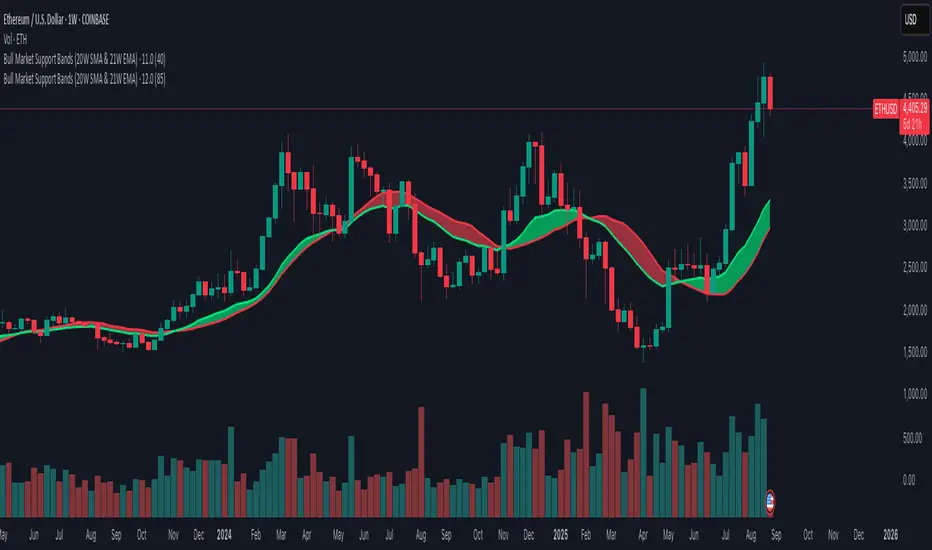
Bull Market Support Bands (20W SMA & 21W EMA)This indicator plots the 20-week Simple Moving Average (SMA) and the 21-week Exponential Moving Average (EMA), together forming the Bull Market Support Bands (BMSB).
Fully compatible with any chart; values are calculated using the weekly timeframe, even if applied on daily charts.
Adjustable band transparency in settings.
Includes optional alerts when EMA crosses above/below SMA.
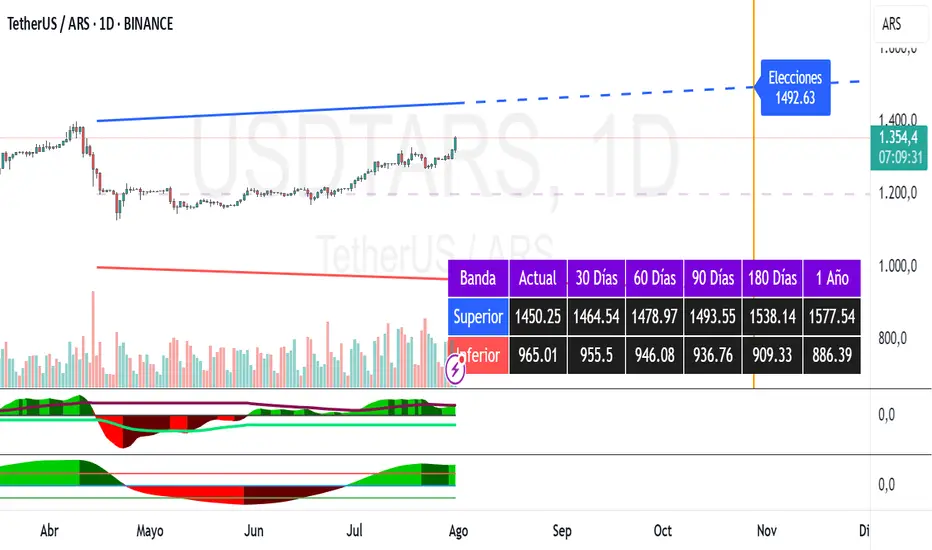
Dollar Bands [TNI]This script shows divergences bands implemented by Argentine Goverment this year for the Argentine Currency USDARS.
You can change the fix monthly and date/price init, and create upper or lower band cross alerts.
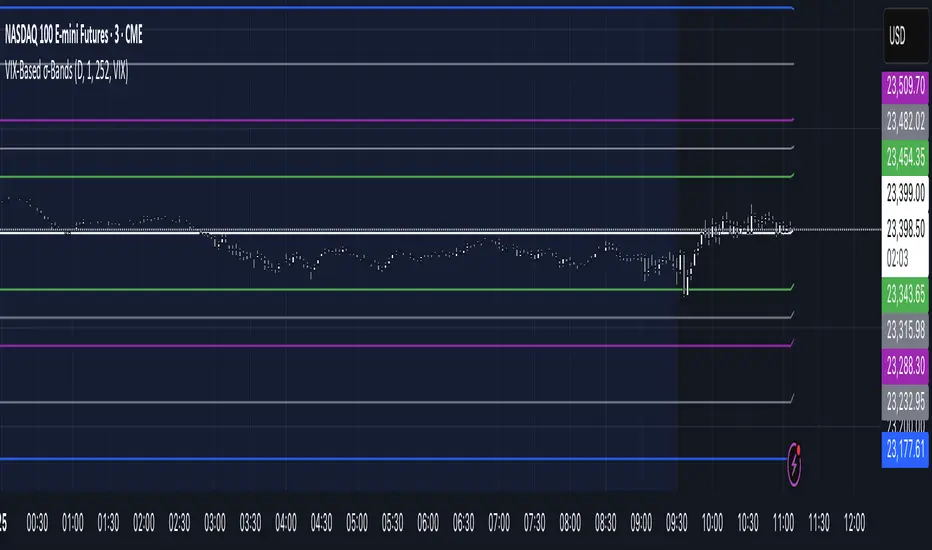
VIX‑Based σ‑BandsThis Pine Script v5 indicator builds a volatility‑based envelope around yesterday’s close using CBOE’s volatility indices. It dynamically pulls VIX, VXN, VXD or RVX—depending on whether you’re charting ES, NQ, YM or RTY—and converts annualized volatility into dollar‑move bands at ±¼ σ, ±½ σ, ±1 σ, and ±2 σ. Optional “mid‑lines” fill in the gaps between each band for even finer precision.
Bollinger Band Touch with SMI and MACD AngleThis strategy is intended for short timeframes to enter and exit when price touches lower and upper bollinger bands with confluence on RSI and MACD

MA 6 Ribbon-Bollinger BandSix Moving Averages and Bollinger bands are mixed into a single indicator, just to help trading all in one
Ari Bull BandThe ARI Bull Band is an indicator based on EMA, HMA and RSI.
When the band is GREEN, the market is on an uptrend.
When the band is RED, the market is on a downtrend.
When the band is Green:
If the candle closes above the band and RSI is overbought, a red triangle will be painted on the top of the candle, suggesting a selling opportunity
When the band is Red:
If the candle closes below the band and RSI is oversold, a green triangle will be painted on the bottom of the candle, suggesting a buying opportunity
Why are the band painted with different shades?
Different shades of red and green identify the relationship between the price and its moving averages.
When the price is below the band and the price action is a downtrend, the band will be painted purple.
When the price is above the band and the price action is an uptrend, the band will be painted in dark Green.

Bollinger Bands with momentum SMA'sA useful tool to look for add on opportunities. The settiing are such that 4Hr shows a Bollinger band for the daily TF. That's the settings to get a higher time frame picture but with a lower time frame focus