DS Gurukul RoundupRoundup (Support & Resistance Indicator) For Bank Nifty
By DS Gurukul
To be used only for Bank Nifty.
Indicator Overview
The Round Figure Indicator identifies key psychological support and resistance levels based on round numbers. These levels often act as strong turning points in price action due to trader psychology and institutional order placement.
How It Works
Key Levels:
Mid Band (Black Solid Line): Major round number
Upper Band (Green Solid Line): Mid Band (resistance)
Lower Band (Red Solid Line): Mid Band (support)
Sub-Bands (Dotted Lines): ±100 levels for tighter zones
Alerts: Triggers when price touches any band, signaling potential reversals or breakouts.
Trading Strategy
✅ Bounce Trades:
Buy near Lower Band or Mid Sub-Lower with bullish confirmation (e.g., hammer candle).
Sell near Upper Band or Mid Sub-Upper with bearish rejection (e.g., shooting star).
✅ Breakout Trades:
Enter long on a close above Upper Band with volume.
Enter short on a close below Lower Band with momentum.
⚠️ Risk Management:
Place stops just beyond the opposite sub-band.
Avoid trading if price is stuck between mid/sub-bands (choppy market).
Why It Works
Round numbers attract limit orders (support/resistance).
Institutions use these levels for stop placements and profit targets.
Works across all timeframes (scalping to swing trading).
🔔 Tip: Combine with RSI/MACD for higher-probability trades!
Search in scripts for "bands"

VWAP table with color
## 📊 VWAP Table with Color – Clear VWAP Deviation at a Glance
This script displays a **VWAP (Volume-Weighted Average Price)** table in a non-intrusive, color-coded panel on your chart. It helps you **quickly assess where the current price stands relative to VWAP**, classified into sigma bands (standard deviations). The goal is to provide valuable VWAP insight **without cluttering the chart with multiple lines**.
---
### 🔍 Purpose & Concept
VWAP is a powerful tool used by institutional traders to measure the average price an asset has traded at throughout the day, based on both volume and price.
In this script:
- We **do not plot traditional VWAP lines** with multiple ±1σ, ±2σ, etc., on the chart.
- Instead, we **summarize VWAP and its relative position in a table**, color-coded by deviation.
- This provides the **same information**, but in a **cleaner, minimal, and visually digestible format**.
---
### 🧠 VWAP Deviation Classification
The script calculates how far the current price is from the VWAP, in units of **standard deviation (σ)**.
The formula is:
```plaintext
VWAP Delta σ = (Current Price - VWAP) / Standard Deviation
```
This gives you a normalized value for deviation from VWAP, and it is **clamped between -3 and +3** to avoid extreme outliers.
Each range is color-coded and classified as:
| VWAP Δσ | Zone | Interpretation | Color |
|---------|---------------|------------------------------------------|--------------|
| -3σ | Far Below | Strongly below VWAP – potentially oversold | 🔴 Red |
| -2σ | Below | Below VWAP – bearish territory | 🟠 Orange |
| -1σ | Slightly Below| Slightly under VWAP – weak signal | 🟡 Yellow |
| 0σ | At VWAP | Price is around VWAP – neutral zone | ⚪ Gray |
| +1σ | Slightly Above| Slightly above VWAP – weak bullish | 🟢 Lime Green |
| +2σ | Above | Above VWAP – bullish signal | 🟢 Green |
| +3σ | Far Above | Strongly above VWAP – potentially overbought | 🟦 Teal |
This **compact summary in the table** provides a clear situational view while keeping the chart clean.
---
### ⚙️ User Customization
Users can configure:
- **VWAP σ Multiplier** (default 0.1) to set the width of the optional VWAP band on the chart.
- **Table Position** (Top Center, Bottom Right, etc.).
- **Text Size** and **Text Color**.
- **Hide VWAP logic**: VWAP data can be hidden automatically on higher timeframes (e.g., daily or weekly).
- **Enable/disable the VWAP ±σ band lines** (optional visual aid).
---
### 📐 Technical Highlights
- VWAP is recalculated each day using `ta.vwap(hlc3, isNewPeriod, 1)`.
- The band width uses standard deviation and the selected multiplier: `VWAP ± σ * multiplier`.
- Table updates dynamically with the new VWAP values each day.
- To **avoid floating-point rounding issues**, `vwapDelta` is rounded before comparison, ensuring correct background color display.
---
### ✅ Why Use This?
- Keeps your chart **visually clean and readable**.
- Gives **immediate context** to current price action relative to VWAP.
- Helps **discretionary traders** or **scalpers** decide whether price is stretched too far from the mean.
- Easier than tracking multiple σ bands manually.
---
### Example Usage:
- On intraday timeframes, you can identify price exhaustion as it hits ±2σ or ±3σ.
- On a 5-minute chart, if price touches `+3σ`, you may consider taking profits on longs.
- On reversal setups, watch for price at `-3σ` with bullish divergence.
---
### 🧩 Future Enhancements (Optional Ideas)
- Add alerts for when `vwapDelta` crosses thresholds like ±2σ or ±3σ.
- Let user select the timeframe for VWAP source (e.g., 1H, 5M, etc.).
- Extend to display VWAP on session or weekly basis.
---
Let me know if you want a version of this script formatted and cleaned up for direct TradingView publication (with annotations, credits, and formatting). Would you like that?

BAS EnhancedBAS Enhanced Indicator – A Powerful Market Trend & Volatility Tool
The BAS Enhanced Indicator is a cutting-edge trading tool designed to help traders analyze market trends, volatility, and price momentum with precision. This indicator builds upon traditional Bollinger Bands concepts, integrating adaptive price action tracking, dynamic band width analysis, and advanced smoothing techniques to generate clear and actionable trading insights.
🔹 Key Features & Benefits:
✅ Smart Price Selection – Choose between Close, High, Low, HL2, or HLC3 to tailor the indicator to different market conditions.
✅ Dynamic Band Analysis – Measures price movements relative to dynamically calculated upper and lower bands for real-time market assessment.
✅ Volatility & Trend Strength Measurement – The indicator uses a unique Width Calculation (wd) to gauge market volatility, helping traders understand the strength of price movements.
✅ Composite Indicator Calculation – Combines price position and band width with customizable power functions to provide a more refined momentum signal.
✅ Smoothing for Accuracy – Uses Exponential Moving Average (EMA) and Simple Moving Average (SMA) for a clearer trend visualization, reducing noise in volatile markets.
✅ Two Signal Lines for Confirmation – Includes customizable bullish and bearish signal lines, allowing traders to identify breakouts and reversals with greater confidence.
✅ Visual & Alert-Based Trading Signals – The indicator plots:
Smoothed Composite Indicator (Blue Line) – Tracks market momentum
%D Moving Average (Red Line) – A secondary smoothing layer for trend confirmation
Mid Values (Orange & Purple Lines) – Additional volatility references
Signal Lines (Green & Red Horizontal Lines) – Key breakout levels
✅ Built-in Alerts for Trade Signals – Get notified instantly when:
Bullish Alert 🚀 – The indicator crosses above the upper signal line
Bearish Alert 📉 – The indicator crosses below the lower signal line
📈 How to Use the BAS Enhanced Indicator?
🔹 Trend Trading: Use crossovers above Signal Line 2 as a potential buy signal and crossovers below Signal Line 1 as a potential sell signal.
🔹 Volatility Monitoring: When the band width (wd) expands, market volatility is increasing – ideal for breakout traders. When wd contracts, market volatility is low, signaling potential consolidation.
🔹 Momentum Confirmation: Use the %D Moving Average to confirm sustained trend movements before entering a trade.
🚀 Why Use BAS Enhanced?
This indicator is perfect for day traders, swing traders, and trend-followers looking to enhance their market timing, filter false signals, and improve decision-making. Whether you're trading stocks, forex, or crypto, BAS Enhanced helps you stay ahead of market movements with precision and clarity.
🔔 Add BAS Enhanced to your TradingView toolkit today and trade smarter with confidence!

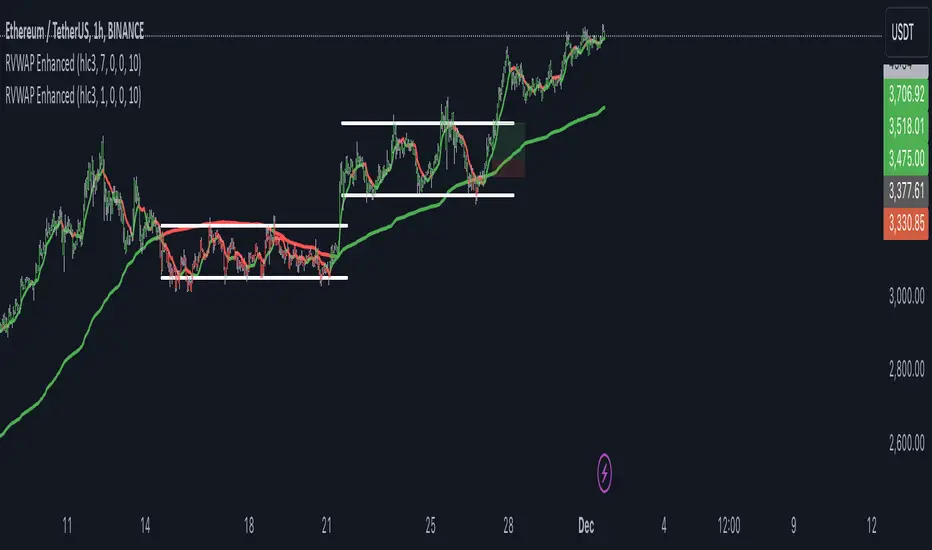
RVWAP ENHANCED**Rolling VWAP with Alerts and Markers**
This Pine Script indicator enhances the traditional Rolling VWAP (Relative Volume Weighted Average Price) by adding dynamic features for improved visualization and alerting.
### Features:
1. **Dynamic VWAP Line Coloring**:
- The VWAP line changes color based on the relationship with the closing price:
- **Green** when the price is above the VWAP.
- **Red** when the price is below the VWAP.
2. **Candle and Background Coloring**:
- **Candles**: Colored green if the close is above the VWAP and red if below.
- **Background**: Subtle green or red shading indicates the price’s position relative to the VWAP.
3. **Alerts**:
- Alerts notify users when the VWAP changes direction:
- "VWAP Turned Green" for price crossing above the VWAP.
- "VWAP Turned Red" for price crossing below the VWAP.
4. **Small Dot Markers**:
- Tiny dots are plotted below the candles to mark VWAP state changes:
- **Green dot** for VWAP turning green.
- **Red dot** for VWAP turning red.
5. **Custom Time Period**:
- Users can select either a dynamic time period based on the chart's timeframe or a fixed time period (customizable in days, hours, and minutes).
6. **Standard Deviation Bands (Optional)**:
- Standard deviation bands around the VWAP can be enabled for further analysis.
This script is designed to provide clear and actionable insights into market trends using the RVWAP, making it an excellent tool for traders who rely on volume-based price action analysis.
OTT CollectionIf you are not yet familiar with OTT, this script could provide an introduction to help you get started.
"Optimized Trend Tracker" (OTT) is an effective trend-following indicator created by Anıl Özekşi . It aims to detect the current trend direction based on an elegant mathematical construct. The key defining characteristic of OTT is its reliance on a trailing-stop mechanism. This enables OTT to identify price movements and follow the price until a reversal occurs. The widespread adoption of OTT in various algo-trading platforms has fostered the development of diverse applications of the indicator over time. Examining its history, eight distinct applications emerge.
1) OTT - Optimized Trend Tracker
2) TOTT - Twin Ott
3) OTT Channel - Half Channel & Fibonacci Channel
4) RISOTTO - Rsi Ott
5) SOTT - Stochastic Ott
6) HOTT & LOTT - Highest-Lowest Ott + Sum Option
7) ROTT - Relative Ott
8) FT - "Fırsatçı" Trend
BONUS: RTR - Relative True Range
Each system functions as an independent indicator and the "OTT Collection" is intended to present all of them in a single script.
ORIGINALITY
Primarily, this script introduces previously unreleased OTT applications on Tradingview (RISOTTO, ROTT, FT). In contrast to previously published examples that treat OTT as a variable, this script portrays OTT as a function, rendering it adaptable for more intricate computations. Consequently, OTT has evolved into a versatile tool capable of facilitating complex analyses. Furthermore, this script offers an innovative feature that permits the blocking of consecutive signals in the same direction, catering to user preferences. (This feature is crucial for all indicators utilizing band structures such as TOTT and HOTT-LOTT).
USAGE
It is simple to use. The settings section of the indicator groups the parameters. In first group, the System parameter allows you to select the OTT system you want to display on the chart. Activating the Pyramiding parameter enables the display of consecutive signals in the same direction (for TOTT and HOTT-LOTT). In the second group you can change the display options with the Barcolor, Signal and Bars parameters. The OTT system you select is configured with the parameters in the group with the corresponding system heading. (For example, suppose you select OTT CHANNEL in the system parameter. The parameters defining the channels are grouped under the heading "OTT CHANNELS" in the settings section.) Also the parameters you chose are displayed in table form on the chart screen. The table also presents the total number of bars on the chart and the number of signals generated by the selected system.
MECHANICS
Let's take a look at how the indicator works. This indicator incorporates eight distinct OTT systems, each characterized by unique parameters, lines, and signals. (Exception: OTT Channel does not include any referenced signals.)
1) WHAT IS "OTT"?
OTT comprises two lines: Support and Target. There's an up-trending market when the Support is superior to the Target, and a down-trending market when the Support is inferior to the Target. It is governed by two parameters. The Support (moving average) is determined by the Length parameter, while the Multiplier parameter is employed for percentage calculations. Lower values are adept at capturing short-term fluctuations, whereas higher values are more adept at identifying long-term trends. These principles apply to all parameters within the indicator.
DETAILED INFO : The OTT function in the script automatically performs the calculation process described in this section. So, if you know how OTT works you can skip the details. To comprehend its functioning, it's essential to grasp the "MOST" indicator, also devised by Anıl Özekşi. The fundamental principle of MOST involves creating bands that function akin to a trailing stop-loss. Initially, a moving average, referred to as the 'Support,' is established. (Anıl Özekşi employs VAR/VIDYA as the moving average type in all his systems.) Subsequently, the Support line is adjusted both upward and downward by a percentage multiplier to establish a band system. In the context of the trailing stop-loss concept, when the Support line approaches either the lower or upper band, the respective band ceases to move in parallel with the Support line and becomes horizontal. Consequently, the Support always intersects the band at some point. The values of the upper or lower bands, determined by this intersection, are referred to as the MOST line. OTT is generated by consolidating the values of MOST shifted upwards and downwards by half the coefficient percentage into a single line using the same method as above, and calculating the value of this line from two bars ago. Support is the data series of OTT and it serves as a source in OTT function. The OTT line is named as "Target" in this scipt. Support and Target will automatically vary according to the OTT application selected in the "System" parameter.
2) WHAT IS "TOTT"?
Twin OTT , also known as the "OTT Band," involves three parameters: Length, Multiplier, and Band Multiplier. It consists of three lines: Support, Upper Line, and Lower Line. OTT is determined by the Length and Multiplier parameters, while TOTT is calculated by adjusting OTT upwards and downwards as per the Band Multiplier parameter. The indicator generates signals based on the intersections of the Support and these two new OTT levels.
3) WHAT IS "OTT CHANNEL"?
Similar to TOTT, the OTT CHANNEL is also based on shifted OTT levels, employing a similar calculation method. The primary distinction lies in the fact that TOTT has a single Band Multiplier, whereas OTT CHANNEL incorporates two line multipliers for the band. It encompasses four parameters: Length, Multiplier, Upper Line Multiplier, and Lower Line Multiplier. OTT is defined by the Length and Multiplier parameters. The Upper Line Multiplier and Lower Line Multiplier parameters establish the channel boundaries by shifting the OTT line. Subsequently, levels are drawn between the upper and lower lines. The additional Channel Type parameter determines which levels are displayed on the chart. The "Half Channel" option draws channels shifted by half the coefficient. The "Fibonacci Channel" option draws channels shifted by 0.382 and 0.618 coefficients. The "Both" option plots all levels.
4) WHAT IS "RISOTTO"?
OTT also has application examples in momentum oscillators. RISOTTO utilizes the RSI indicator and operates with three parameters. The RSI is defined by the Length 1 parameter, while the Support is determined by the Length 2 parameter. The Multiplier parameter is utilized for percentage calculations. RISOTTO comprises two lines: Support and Target. To ensure more stable calculations, a constant (+1000) is added to the oscillator average when applying OTT to momentum oscillators. This approach eradicates nonsensical results stemming from percentage calculations when the oscillator reaches a value of 0. The indicator generates signals based on the intersection of these two lines.
5) WHAT IS "SOTT"?
Stochastic OTT is an another example of application on oscillator. Its working principle is akin to that of RISOTTO. It operates with three parameters. The Stochastic %k is defined by the Length 1 parameter, while the Stochastic %d is determined by the Length 2 parameter. The Multiplier parameter is utilized for percentage calculations. SOTT comprises two lines: Support and Target. The indicator generates signals based on the intersection of these two lines.
6) WHAT IS "HOTT-LOTT"?
OTT can be applied to the highest and lowest series as well. HOTT-LOTT operates with three parameters: Length, Multiplier, and Sum N Bars. The highest and lowest series are defined by the Length parameter. The Multiplier parameter is utilized for percentage calculations. It encompasses two lines: Upper Line and Lower Line, where HOTT employs the highest series and LOTT uses the lowest series. If the 'High' price surpasses HOTT, the indicator generates Long signals. Similarly, if the 'Low' price falls below LOTT, the indicator generates Short signals. When the Sum N Bars option is activated, signals are generated based on the confirmation concept for N bars.
7) WHAT IS "ROTT"?
Relative OTT serves as a valuable tool for long-period filters. ROTT operates with two parameters. The Support is determined by the length parameter and equals twice the moving average. The Multiplier parameter is utilized for percentage calculations. The indicator generates signals based on the intersection of these two lines.
8) WHAT IS "FT"?
"Fırsatçı" (opportunistic) Trend is a system that revolves around two levels, namely major and minor OTT. It operates with three parameters: Length, Major Multiplier, and Minor Multiplier. FT comprises two lines, Support and Target. The indicator generates signals based on the intersection of these two lines.
9) WHAT IS "RTR"?
Relative True Range is not an OTT system; however, it serves as a complementary feature. It does not have any referenced signals. RTR is devised to obtain a normalized result of the current market volatility. It operates with two parameters: ATR, which is determined by the Length 1 parameter, and RTR, defined by the Length 2 parameter.
A TIP
If any indicator is defined in function form instead of the OTT function, the applications can also be adapted for different indicators. E.g. Supertrend, PMAX, AlphaTrend, etc.
UPDATE
Anıl Özekşi is a competent algotrader who shares his work with open sources. I will update the indicator as new applications are released.
DISCLEIMER
This is just an indicator, nothing more. The script is for informational and educational purposes only. The use of the script does not constitute professional and/or financial advice. The responsibility for risks associated with the use of the script is solely owned by the user. Do not forget to manage your risk. And trade as safely as possible. Good luck!

PUBG//Pluto star appears on a chart when price goes in the in the extreme price range territory, i.e. beyond 2 standard deviation from the mean (or mid Bollinger Band).
//What makes a Pluto Star appear on a chart:
//1. Check if the candle 's' high and low, both are completely outside of the Bollinger Bands (close, 20, 2) - Lets call it Pluto Star Candle
//2. Pluto Star Candle must not be a result of sudden price movement. Hence the previous candle must give a BB Blast.
// In other words, the candle must have it's either open or close outside of Bollinger Bands, to confirm a BB Blast before the Pluto Star
//3. Candle, following the Pluto Star must not break the high (in case of upper BB i.e. short call) or low (in case of lower BB, i.e. long call), to confirm the reversal to the mean
// This implies that Pluto Star appears on chart, above/below the next candle of actual Pluto Star Candle

Log Regression Channel (Dezza Fixed v2)This custom indicator builds a curved Logarithmic Regression Channel designed for long-term Bitcoin and macro asset analysis. It performs a linear regression on the logarithm of price to estimate the market’s fair-value growth curve, then converts that back into price space to form upper and lower deviation bands.
It helps identify where price sits relative to its long-term exponential trend — showing potential overvaluation (upper band) or undervaluation (lower band) zones.
Best used on weekly or monthly charts to visualise market cycles and fair-value reversion. Adjustable inputs let you control lookback length, band width, and midline visibility.

Log Regression Channel (Dezza)This custom indicator builds a curved Logarithmic Regression Channel designed for long-term Bitcoin and macro asset analysis. It performs a linear regression on the logarithm of price to estimate the market’s fair-value growth curve, then converts that back into price space to form upper and lower deviation bands.
It helps identify where price sits relative to its long-term exponential trend — showing potential overvaluation (upper band) or undervaluation (lower band) zones.
Best used on weekly or monthly charts to visualise market cycles and fair-value reversion. Adjustable inputs let you control lookback length, band width, and midline visibility.

Hurst Dual-Channel + ECDF Early Reentry (Single Trigger)Hello,
This indicator can be useful during ranging market phases, especially on short timeframes such as 5 minutes, within a statistically contrarian approach.
It combines two quantitative methodologies:
– Hurst-type adaptive channels, which measure short- and medium-term price deviations using the ATR (Average True Range);
– an Empirical Cumulative Distribution Function (ECDF), which locates the current price between its recent extremes (0 corresponding to the lower bound, 1 to the upper bound).
The goal is to identify relative overbought and oversold zones, where the price exceeds the channels and then begins to revert toward its statistical mean.
The indicator does not issue trading recommendations: it merely highlights specific statistical conditions for research and analytical purposes.
The “BUY” and “SELL” labels indicate such technical configurations:
– ECDF < 0.2 with price returning above the lower channels → bullish reentry.
– ECDF > 0.9 with price returning below the upper channels → bearish reentry.
The parameters (channel periods, ECDF window, smoothing) allow you to fine-tune the sensitivity of the analysis according to instrument volatility or chosen timeframe.
🟩 Buy Signal (BUY)
A buy signal is triggered when a strong downside deviation pushes the price below both channels, followed by a gradual reentry inside the bands.
More precisely:
– The low is below both channels (low < scb and low < mcb).
– The ECDF crosses back above 0.19 (exit from oversold).
– Both events occur within the last six bars.
– The price moves back above the lower channel (high > scb).
– No previous long signal is active.
This configuration represents a statistical reentry to the mean after an excessive drop.
🟥 Sell Signal (SELL)
Conversely, a sell signal appears when a strong upside deviation pushes the price above both channels, followed by a pullback below them:
– The high exceeds both channels (high > sct and high > mct).
– The ECDF crosses below 0.9 (exit from overbought).
– Both events occur within the last six bars.
– The price falls back below the upper channel (low < sct).
– No previous short signal is active.
This reflects a bearish reentry following a statistical overextension.
⚙️ Operating Logic
Each signal is triggered only once per cycle thanks to the variables triggered_long and triggered_short, preventing duplicates until a new extreme occurs.
The tool is designed for visual analysis and pattern research, not for automated execution.
🔍 ECDF Principle and Calculation
The ECDF is a non-parametric measure of a value’s position within its recent distribution:
ECDF(X)=number of values ≤XNECDF(X) = \frac{\text{number of values } \le X}{N}ECDF(X)=Nnumber of values ≤X
It expresses the empirical proportion of observations below the current value.
Example:
If, among the last 100 observations, 85 are below the current price, then
ECDF=0.85ECDF = 0.85ECDF=0.85
→ The price is at the 85th percentile, statistically high relative to recent history.
Strengths: robust, model-free, well-suited to asymmetric or non-normal market regimes.
Limitations: it does not measure amplitude and depends on the selected window size.
🌊 Intuitive Analogy: The River and the Gauge
Imagine a river with a depth gauge:
– The Z-Score tells you how many meters above the average level the water currently stands.
– The ECDF tells you in how many past cases the water level was lower than it is now.
The Z-Score assumes the river always follows the same symmetrical pattern.
The ECDF simply observes reality — adapting naturally, even when the current becomes unpredictable.
Final note:
This indicator is designed for visual and statistical exploration of price behavior.
The signals represent statistical states, not trade instructions.
Entering long or short positions based on them is entirely at your own discretion and risk.

Institutional Rolling VWAPs • 3 lines Institutional Rolling VWAPs • 3 lines + editable σ bands. 3 x modifiable vwaps, time anchored, same for ltf and htf

Master Simple Indicator 2.0Master Simple Indicator 2.0 combines dynamic moving average signals with ATR-based price bands. It plots a volatility range around the current price using customizable ATR length, smoothing, and multiplier settings, while also highlighting long/short opportunities when price crosses a 120-period moving average. Visual cues and alerts help identify momentum shifts, trend direction, and potential trade entries across all timeframes.

NQ bands 50/65.5/100this is a indicator that puts lines 50 points above and below price, 65.5 points above and below price and 100 points above and below price for the Nasdaq Futures.

Log Returns (Quant Lab)Log Returns Indicator
This indicator calculates the logarithmic return of each bar using the formula:
logReturn = ln(Close / Close )
It then visualizes:
• A log-return histogram (green for positive, red for negative returns)
• A rolling mean of log returns (yellow line)
• ±1 standard deviation bands around the mean (orange lines)
This indicator is used to:
• Measure the true statistical return behavior of the asset
• Detect volatility expansions and contractions
• Identify abnormal return spikes (news, liquidation cascades, manipulation)
• Evaluate market efficiency and momentum strength
• Prepare quantitative features for machine learning models
In simple terms, the Log Returns indicator shows whether the asset’s recent price behavior is normal or statistically unusual.

Bollinger-Yanovskyy bands of perpendicular volatilityDifferent mathematical approach to volatility - measured in square root from a product of price distance by time distance (geometrically 90 degrees to a projected MA basis).
With MA length as a factor of this volatility STDEV, creating a self-tuning feedback loop basically.

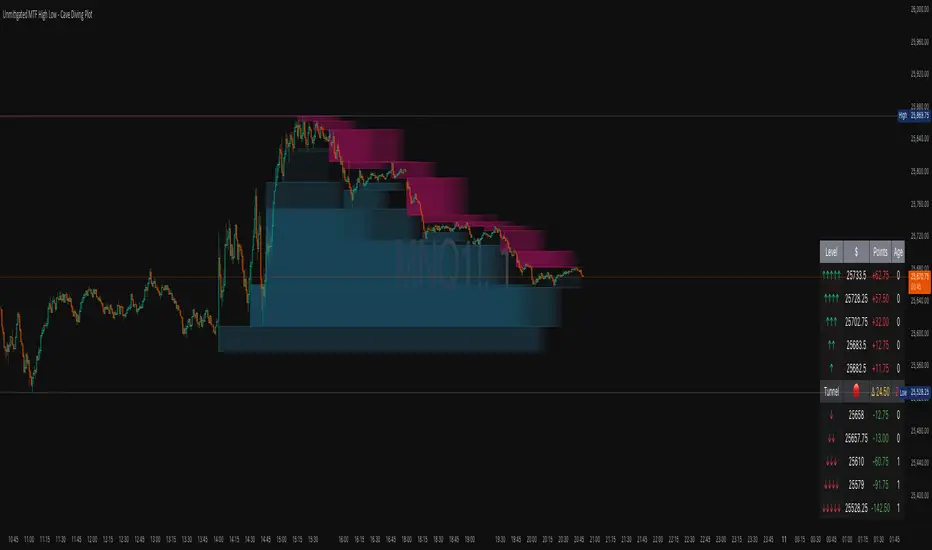
Unmitigated MTF High Low - Cave Diving Plot
IntroductionThe Unmitigated MTF High Low -
Cave Diving Plot is a multi-timeframe (MTF) indicator designed for NQ and ES futures traders who want to identify high-probability entry and exit zones based on unmitigated price levels. The "Cave Diving" visualization helps you navigate between support (floor) and resistance (ceiling) zones, while the integrated Strat analysis provides directional context.
Who Is This For?
Futures traders (NQ, ES) trading during ETH and RTH sessions
Scalpers and day traders looking for precise entry/exit levels
Traders using The Strat methodology for directional analysis
Anyone seeking confluence between price action and key levels
Core Concepts
1. Unmitigated Level:
An unmitigated level is a price high or low that has been created but not yet tested (touched) by price. These levels act as magnets - price often returns to test them.Key Properties:
Resistance (Highs): Price has created a high but hasn't revisited it
Support (Lows): Price has created a low but hasn't revisited it
Mitigation: When price touches a level, it becomes "mitigated" and loses strength
2. The Cave Diving MetaphorThink of trading as cave diving between two zones:
┌─────────────────────────────────┐
│ CEILING (Upper Band) │ ← 1st & 2nd Unmitigated Highs
│ 🟥 Resistance Zone │
├─────────────────────────────────┤
│ │
│ THE TUNNEL │ ← Price navigates here
│ (Trading Channel) │
│ │
├─────────────────────────────────┤
│ 🟢 Support Zone │
│ FLOOR (Lower Band) │ ← 1st & 2nd Unmitigated Lows
└─────────────────────────────────┘
Trading Concept:
Ceiling: Formed by the 1st and 2nd most recent unmitigated highs
Floor: Formed by the 1st and 2nd most recent unmitigated lows
Tunnel: The space between ceiling and floor where price operates
Cave Diving: Navigating between these zones for entries and exits
3. Session-Based Age TrackingLevels are tracked by session age:
Session: 6:00 PM to 5:00 PM NY time (23-hour window)
Age 0: Created in the current session (today)
Age 1: Created 1 session ago (yesterday)
Age 2+: Older levels (more significant)
Why Age Matters:
Older unmitigated levels are typically stronger magnets
Fresh levels (Age 0) may be weaker and easier to break
Age 2+ levels often provide high-probability reversal zones
Indicator Components
Visual Elements
1. Colored Bands (Cave Zones)Upper Band (Pink/Maroon - 95% transparency)
Space between 1st and 2nd unmitigated highs
Acts as resistance zone
Price often hesitates or reverses here
Lower Band (Teal - 95% transparency)
Space between 1st and 2nd unmitigated lows
Acts as support zone
Price often finds buyers here
2. Information Table Located in your chosen corner (default: Bottom Right), the table displays:
5 most recent unmitigated highs (top section)
Tunnel row (middle separator)
5 most recent unmitigated lows (bottom section)
Reading the TableTable Structure
┌────────┬──────────┬────────┬───────┐
│ Level │ $ │ Points │ Age │
├────────┼──────────┼────────┼───────┤
│ ↑↑↑↑↑ │ 21,450.25│ +45.30 │ 3 │ ← 5th High (oldest)
│ ↑↑↑↑ │ 21,425.50│ +32.75 │ 2 │ ← 4th High
│ ↑↑↑ │ 21,410.00│ +25.00 │ 1 │ ← 3rd High
│ ↑↑ │ 21,400.75│ +18.50 │ 1 │ ← 2nd High
│ ↑ │ 21,395.25│ +12.00 │ 0 │ ← 1st High (newest)
├────────┼──────────┼────────┼───────┤
│ Tunnel │ 🟢 │ Δ 85.50│ 2U │ ← Current State
├────────┼──────────┼────────┼───────┤
│ ↓ │ 21,310.00│ -15.25 │ 0 │ ← 1st Low (newest)
│ ↓↓ │ 21,295.50│ -22.75 │ 1 │ ← 2nd Low
│ ↓↓↓ │ 21,280.25│ -30.00 │ 1 │ ← 3rd Low
│ ↓↓↓↓ │ 21,265.75│ -38.50 │ 2 │ ← 4th Low
│ ↓↓↓↓↓ │ 21,250.00│ -45.00 │ 3 │ ← 5th Low (oldest)
└────────┴──────────┴────────┴───────┘Column
Breakdown
Column 1: Level (Arrows)
Green arrows (↑): Resistance levels above current price
Red arrows (↓): Support levels below current price
Arrow count: Indicates recency (1 arrow = newest, 5 arrows = oldest)
Why This Matters:
More arrows = older level = stronger magnet for price
Column 2: $ (Price)
Exact price of the unmitigated level
Use this for limit orders and stop placement
Column 3: Points (Distance)
Positive (+) for highs: Points above current price
Negative (-) for lows: Points below current price
Helps gauge proximity to key levels
Trading Application:
If you're +2.50 points from resistance, a reversal may be imminent
If you're -45.00 points from support, you're far from the floor
Column 4: Age (Sessions)
Number of full 6pm-5pm sessions the level has survived
Age 0: Created today (current session)
Age 1+: Created in previous sessions
Significance Ladder:
Age 0: Weak, may break easily
Age 1-2: Medium strength
Age 3+: Strong, high-probability reaction zone
Tunnel Row (Critical Information)│ Tunnel │ 🟢 │ Δ 85.50│ 2U │
└─┬─┘ └─┬─┘ └──┬──┘ └─┬─┘
│ │ │ │
Label Direction Range Strat
1. Tunnel Label: Identifies the separator row
2. Direction Indicator (🟢/🔴)
🟢 Green Circle: Current 15m bar closed bullish (above previous close)
🔴 Red Circle: Current 15m bar closed bearish (below previous close)
3. Δ (Delta/Range)
Distance in points between 1st High and 1st Low
Shows the tunnel width (trading range)
Example: Δ 85.50 = 85.50 points between ceiling and floor
Trading Use:
Wide tunnel (>100 points): More room to trade, consider range strategies
Narrow tunnel (<50 points): Tight range, expect breakout
4. Strat Pattern
1: Inside bar (consolidation)
2U: 2 Up (bullish directional bar)
2D: 2 Down (bearish directional bar)
3: Outside bar (expansion/volatility)
Color Coding:
Green: 2U (bullish)
Red: 2D (bearish)
Yellow: 3 (expansion)
Gray: 1 (inside/neutral)
Mid-term Valuation Indicator | MiesOnChartsMedium-Term Valuation Indicator
This medium-term valuation indicator integrates multiple valuation metrics to assist investors in identifying oversold and overbought market conditions with greater precision.
How it works:
This indicator uses an average of multiple valuation indicators like technical mean reversion, sentiment and on-chain indicators. Its core innovation is an adaptive z-score aggregation that normalizes these diverse inputs (e.g., RSI for mean reversion or NUPL for on-chain sentiment) into a unified score, minimizing noise from isolated metrics and providing a more reliable valuation snapshot than traditional single-indicator tools.
All included indicators have individual flexible metrics, allowing users to customize them as needed. Additionally, the script uses color-coding based on the aggregation of z-scores, which aids in visualizing whether the market is overvalued or undervalued.
How to Interpret:
The indicator employs adaptive standard deviation bands to define extreme market zones. The red band signals a strongly overbought condition, while the green band indicates a significantly oversold condition.
How to Apply:
Investors can leverage these extreme levels as strategic points for taking profits or implementing dollar-cost averaging (DCA) strategies, optimizing entry and exit decisions in the market.
Disclaimer: NOT Financial advice. Past performance is not indicative of future results. No trading strategy can guarantee success in financial markets.

01 TMA Centered BandsA dynamic, adaptive volatility channel used to identify trend direction, overbought/oversold zones, and precise reversal points.
Features:
Real-time centered TMA calculation
Market volatility detection
Reversal zones with high-probability signals
Works on all timeframes and assets
Benefits:
Helps you catch early trend shifts
Filters out market noise during ranging periods

Tiki TorchPlots unique FVGs in combination with bollinger bands with custom settings. When 2 consecutive FVGs plot, the torch appears! Alerts included as well.

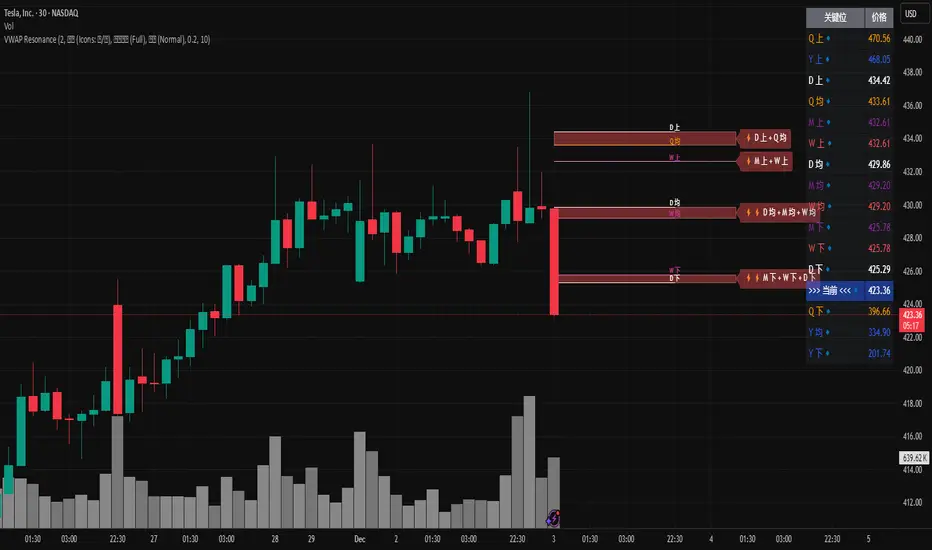
MTF VWAP Resonance [By Testeded]📈 MTF VWAP Resonance Hunter
(多级别 VWAP 共振捕猎者 - 终极版)
🇬🇧 English Description
1. Design Philosophy: The Institutional Edge
While typical indicators measure simple price action, VWAP (Volume Weighted Average Price) measures Value and Institutional Cost.
Professional traders and algorithms anchor their decisions to time-based benchmarks: Daily, Weekly, Monthly, and Quarterly. When prices return to these levels, they are testing the average cost basis of the market participants from that period.
The Logic of "Multi-Level Resonance" (MTF): A single VWAP line can be broken. However, when the Daily VWAP, Weekly Upper Band, and Quarterly Basis all overlap at the exact same price level, a "Market Consensus" is formed. This tool uses a background algorithm to detect these overlaps across 6 Timeframes (4H to Year) and visualizes them as "Resonance Boxes" instead of cluttering your chart with lines.
2. Key Features
⚓ Anchored VWAP Engine: Calculates VWAP + Standard Deviation Bands for 4H, Daily, Weekly, Monthly, Quarterly, and Yearly cycles simultaneously.
⚡ Smart Resonance Radar: Automatically detects when levels from different timeframes cluster together.
2-Line Confluence: ⚡ (Watch)
3-Line Confluence: ⚡⚡ (Strong)
4+ Line Confluence: ⚡⚡⚡ (Iron Wall)
🧘 Visual Modes (Zen / Focus):
Full Mode: Shows lines, dashboard, and resonance boxes.
Focus Mode: Hides lines, keeps dashboard and boxes.
Zen Mode: Hides EVERYTHING except the Resonance Boxes. Pure price action.
🏢 The Quarterly Line: Specifically designed to track the Quarterly VWAP, a critical level for institutional rebalancing and earnings cycles.
🎨 Customizable UI: Adjustable table text size (Small to Huge) and display styles.
3. How to Trade
Identify the Wall: Look for Red Boxes (Resistance) or Green Boxes (Support) with high star ratings (⚡⚡).
Read the Dashboard: Check the label (e.g., Q VWAP + W Lower). This tells you exactly who is defending this level (e.g., "Quarterly Buyers defending cost").
Sniper Entry: Wait for price to touch the Resonance Box. These levels often trigger sharp reversals or major breakouts.
🇨🇳 中文说明 (Chinese Description)
1. 设计哲学:多级别的全局视角
布林带反映的是波动率,而 VWAP(成交量加权平均价) 反映的是**“真金白银的持仓成本”**。
机构交易者和算法通常会锚定特定的时间周期进行交易:日内、周线、月线以及季度线。 “多级别共振”的逻辑: 单一周期的 VWAP 很容易失效。但是,当 日线 VWAP、周线上轨 和 季度线成本 在同一个价格位置重叠时,意味着短线、中线和长线资金在此处达成了**“价值共识”。 本指标通过后台算法,同时监控 6个时间周期 (4H - 年线),将这些重叠的价位转化为可视化的“共振框”**,提供一个多级别的全局视角。
2. 核心功能
⚓ 全周期锚定 VWAP:后台实时计算 4H, 日线, 周线, 月线, 季度线, 年线 的 VWAP 及其标准差轨道。
⚡ 智能共振雷达:自动检测不同周期的关键位重叠。
2线共振:⚡ (关注)
3线共振:⚡⚡ (强力支撑/阻力)
4线以上:⚡⚡⚡ (核弹级/铁壁共振)
🧘 显示模式 (Zen / Focus):
全面模式:显示所有线条 + 表格 + 共振框。
专注模式:隐藏线条,保留表格 + 共振框。
极简模式 (Zen):隐藏一切干扰,只显示共振框。像狙击手一样只看目标。
🏢 季度线增强:特别加入了 Quarterly VWAP (季度线),这是机构季末调仓和财报周期的重要防守线。
🎨 高度客制化:支持调整表格文字大小(从“小”到“巨大”),适配各种分辨率屏幕。
3. 实战用法
寻找“墙壁”:关注图表上的 红色共振框 (阻力) 或 绿色共振框 (支撑),尤其是带有 ⚡⚡ 标志的区域。
解读筹码:看一眼右上角的仪表盘标签(例如 Q VWAP + W Lower)。这意味着“季度级别的平均成本”与“周线级别的超卖线”重合,支撑力度极强。
警报交易:开启警报功能。不需要盯着屏幕,当价格撞上共振框时,指标会自动通知你。
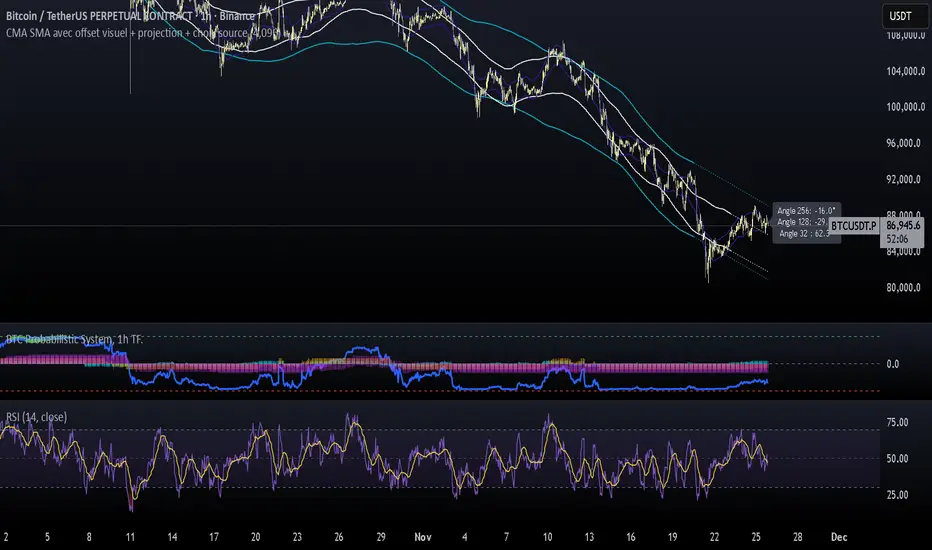
CMA SMA avec offset visuel + projection + choix sourceCMA Channels are a set of bands built around a Centered Moving Average (CMA), a tool often used in market cycle analysis (e.g., Hurst).
Unlike a regular moving average, the CMA is shifted forward in time to remove lag and reveal the underlying cyclical structure of price.
9 Custom Horizontal Levels + Text LabelsThis tool provides nine fully customizable price levels for volatility-based analysis.
Each line allows manual price input and independent control of visibility, color, and style.
Common uses include constructing volatility bands such as ±1 SD and ±2 SD around a settlement or reference price. Traders can quickly map key levels, visualize market structure, and adapt the lines to fit any strategy.

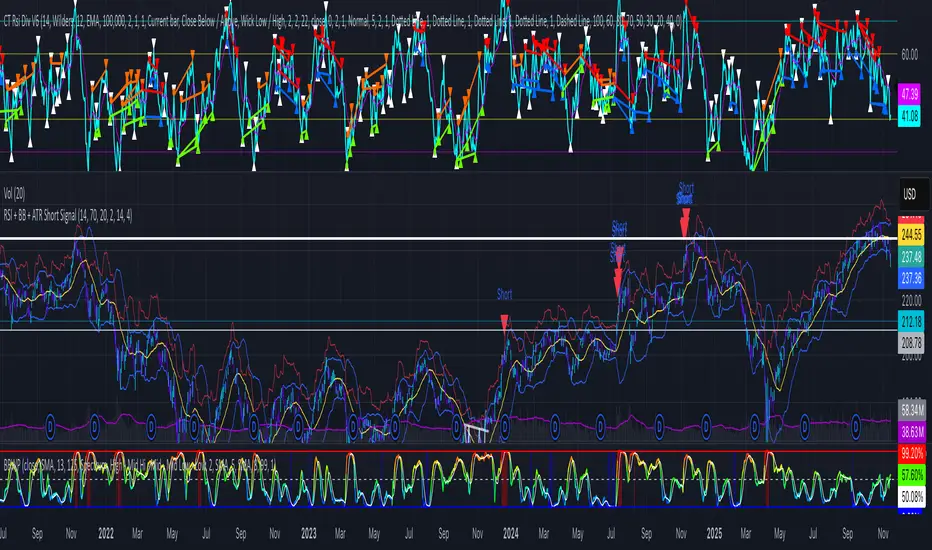
RSI + BB + ATR Short SignalThis indicator highlights potential short setups by combining three conditions:
RSI Overbought – RSI must be above the user-defined level.
Bollinger Band Break – Price must close above the upper Bollinger Band.
Extended Above the 5-Day Low – Price must sit at least X ATR above the recent 5-day low.
When all conditions line up on the same bar, the script plots a red triangle above the candle and triggers an alert so you can act immediately.
To help visualise the setup, the script also plots the full Bollinger Bands (upper, middle, lower) and a line showing the threshold of 5-day-low + ATR × multiplier. You can adjust RSI length and level, Bollinger settings, ATR length, and the ATR multiplier.
Keltner Channels (StevenCharts) [LONGTERM]This indicator plots Keltner Channels from your current timeframe plus three fully customizable Higher Timeframes (HTF) simultaneously.
It is designed for multi-timeframe analysis, allowing you to see how price interacts with long-term support and resistance levels without ever leaving your chart. All HTF levels are non-repainting and plot as clean, stable "steps."
Key Features:
Four Timeframes in One: Plots Current, HTF 1, HTF 2, and HTF 3.
"Band Zones": Each HTF features an inner "band" based on a percentage of the total channel width.
Built-in Reversion Signals: Get buy/sell signals (triangles) when price closes back inside the selected channel.
Signal Source Selector: Choose which timeframe's bands (Current or HTF) you want to use for generating signals and alerts.
Time Filter: Includes an option to only show levels for the most recent 'X' days, keeping your chart clean and focused.