RSI Games 1.2he "RSI Games 1.2" indicator enhances the standard RSI by adding several layers of analysis:
Standard RSI Calculation: It calculates the RSI based on a configurable length (default 14 periods) and a user-selected source (default close price).
RSI Bands: It plots horizontal lines at 70 (red, overbought), 50 (yellow, neutral), and 30 (green, oversold) to easily identify extreme RSI levels.
RSI Smoothing with Moving Averages (MAs) and Bollinger Bands (BBs):
You can apply various types of moving averages (SMA, EMA, SMMA, WMA, VWMA) to smooth the RSI line.
If you choose "SMA + Bollinger Bands," the indicator will also plot Bollinger Bands around the smoothed RSI, providing dynamic overbought/oversold levels based on volatility.
The RSI line itself changes color based on whether it's above (green) or below (red) its smoothing MA.
It also fills the area between the RSI and its smoothing MA, coloring it green when RSI is above and red when below.
Bollinger Band Signals: When Bollinger Bands are enabled, the indicator marks "Buy" signals (green arrow up) when the RSI crosses above the lower Bollinger Band and "Sell" signals (red arrow down) when it crosses below the upper Bollinger Band.
Background Coloring: The background of the indicator pane changes to light green when RSI is below 30 (oversold) and light red when RSI is above 70 (overbought), visually highlighting extreme conditions.
Divergence Detection: This is a key feature. The indicator automatically identifies and labels:
Regular Bullish Divergence: Price makes a lower low, but RSI makes a higher low. This often signals a potential reversal to the upside.
Regular Bearish Divergence: Price makes a higher high, but RSI makes a lower high. This often signals a potential reversal to the downside.
Hidden Bullish Divergence: Price makes a higher low, but RSI makes a lower low. This can indicate a continuation of an uptrend.
Hidden Bearish Divergence: Price makes a lower high, but RSI makes a higher high. This can indicate a continuation of a downtrend.
Divergences are visually marked with labels and can trigger alerts.
Search in scripts for "bands"

RSI-Adaptive T3 [ChartPrime]The RSI-Adaptive T3 is a precision trend-following tool built around the legendary T3 smoothing algorithm developed by Tim Tillson , designed to enhance responsiveness while reducing lag compared to traditional moving averages. Current implementation takes it a step further by dynamically adapting the smoothing length based on real-time RSI conditions — allowing the T3 to “breathe” with market volatility. This dynamic length makes the curve faster in trending moves and smoother during consolidations.
To help traders visualize volatility and directional momentum, adaptive volatility bands are plotted around the T3 line, with visual crossover markers and a dynamic info panel on the chart. It’s ideal for identifying trend shifts, spotting momentum surges, and adapting strategy execution to the pace of the market.
HOIW IT WORKS
At its core, this indicator fuses two ideas:
The T3 Moving Average — a 6-stage recursively smoothed exponential average created by Tim Tillson , designed to reduce lag without sacrificing smoothness. It uses a volume factor to control curvature.
A Dynamic Length Engine — powered by the RSI. When RSI is low (market oversold), the T3 becomes shorter and more reactive. When RSI is high (overbought), the T3 becomes longer and smoother. This creates a feedback loop between price momentum and trend sensitivity.
// Step 1: Adaptive length via RSI
rsi = ta.rsi(src, rsiLen)
rsi_scale = 1 - rsi / 100
len = math.round(minLen + (maxLen - minLen) * rsi_scale)
pine_ema(src, length) =>
alpha = 2 / (length + 1)
sum = 0.0
sum := na(sum ) ? src : alpha * src + (1 - alpha) * nz(sum )
sum
// Step 2: T3 with adaptive length
e1 = pine_ema(src, len)
e2 = pine_ema(e1, len)
e3 = pine_ema(e2, len)
e4 = pine_ema(e3, len)
e5 = pine_ema(e4, len)
e6 = pine_ema(e5, len)
c1 = -v * v * v
c2 = 3 * v * v + 3 * v * v * v
c3 = -6 * v * v - 3 * v - 3 * v * v * v
c4 = 1 + 3 * v + v * v * v + 3 * v * v
t3 = c1 * e6 + c2 * e5 + c3 * e4 + c4 * e3
The result: an evolving trend line that adapts to market tempo in real-time.
KEY FEATURES
⯁ RSI-Based Adaptive Smoothing
The length of the T3 calculation dynamically adjusts between a Min Length and Max Length , based on the current RSI.
When RSI is low → the T3 shortens, tracking reversals faster.
When RSI is high → the T3 stretches, filtering out noise during euphoria phases.
Displayed length is shown in a floating table, colored on a gradient between min/max values.
⯁ T3 Calculation (Tim Tillson Method)
The script uses a 6-stage EMA cascade with a customizable Volume Factor (v) , as designed by Tillson (1998) .
Formula:
T3 = c1 * e6 + c2 * e5 + c3 * e4 + c4 * e3
This technique gives smoother yet faster curves than EMAs or DEMA/Triple EMA.
⯁ Visual Trend Direction & Transitions
The T3 line changes color dynamically:
Color Up (default: blue) → bullish curvature
Color Down (default: orange) → bearish curvature
Plot fill between T3 and delayed T3 creates a gradient ribbon to show momentum expansion/contraction.
Directional shift markers (“🞛”) are plotted when T3 crosses its own delayed value — helping traders spot trend flips or pullback entries.
⯁ Adaptive Volatility Bands
Optional upper/lower bands are plotted around the T3 line using a user-defined volatility window (default: 100).
Bands widen when volatility rises, and contract during compression — similar to Bollinger logic but centered on the adaptive T3.
Shaded band zones help frame breakout setups or mean-reversion zones.
⯁ Dynamic Info Table
A live stats panel shows:
Current adaptive length
Maximum smoothing (▲ MaxLen)
Minimum smoothing (▼ MinLen)
All values update in real time and are color-coded to match trend direction.
HOW TO USE
Use T3 crossovers to detect trend transitions, especially during periods of volatility compression.
Watch for volatility contraction in the bands — breakouts from narrow band periods often precede trend bursts.
The adaptive smoothing length can also be used to assess current market tempo — tighter = faster; wider = slower.
CONCLUSION
RSI-Adaptive T3 modernizes one of the most elegant smoothing algorithms in technical analysis with intelligent RSI responsiveness and built-in volatility bands. It gives traders a cleaner read on trend health, directional shifts, and expansion dynamics — all in a visually efficient package. Perfect for scalpers, swing traders, and algorithmic modelers alike, it delivers advanced logic in a plug-and-play format.

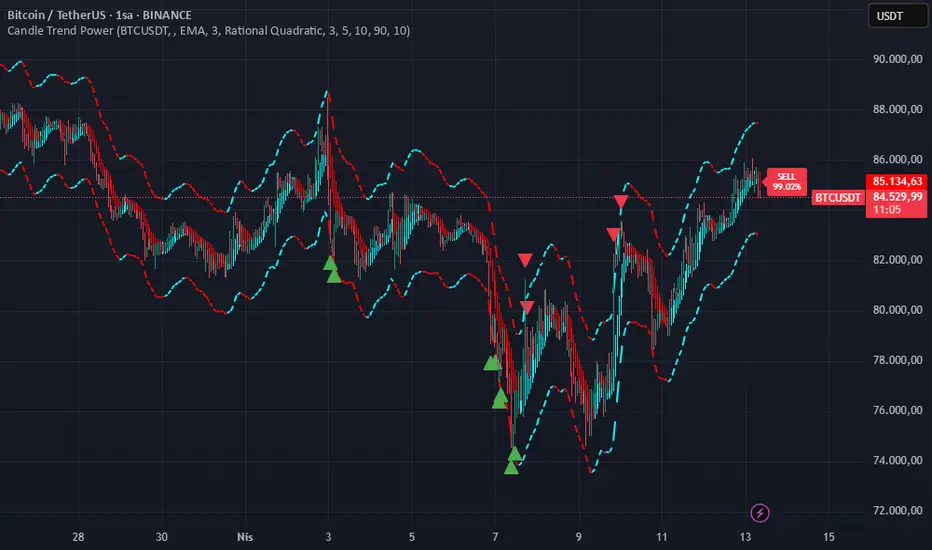
Candle Trend PowerThe Candle Trend Power is a custom technical indicator designed for advanced trend analysis and entry signal generation. It combines multiple smoothing methods, candle transformations, and volatility bands to visually and analytically enhance your trading decisions.
🔧 Main Features:
📉 Custom Candle Types
It transforms standard OHLC candles into one of several advanced types:
Normal Candles, Heikin-Ashi, Linear Regression, Rational Quadratic (via kernel filtering), McGinley Dynamic Candles
These transformations help traders better see trend continuations and reversals by smoothing out market noise.
🧮 Smoothing Method for Candle Data
Each OHLC value can be optionally smoothed using:
EMA, SMA, SMMA (RMA), WMA, VWMA, HMA, Mode (Statistical mode) Or no smoothing at all.
This flexibility is useful for customizing to different market conditions.
📊 Volatility Bands
Volatility-based upper and lower bands are calculated using:
Band = price ± (price% + ATR * multiplier)
They help identify overbought/oversold zones and potential reversal points.
📍 Candle Color Logic
Each candle is colored:
Cyan (#00ffff) if it's bullish and stronger than the previous candle
Red (#fd0000) if it's bearish and weaker
Alternating bar index coloring improves visual clarity.
📈 Trend Momentum Labels
The script includes a trend strength estimation using a smoothed RSI:
If the candle is bullish, it shows a BUY label with the overbought offset.
If bearish, it shows a SELL label with the oversold offset.
These labels are dynamic and placed next to the bar.
📍 Signal Markers
It also plots triangles when the price crosses the volatility bands:
Triangle up for potential long
Triangle down for potential short
✅ Use Case Summary
This script is mainly used for:
Visual trend confirmation with enhanced candles
Volatility-based entry signals
RSI-based trend momentum suggestions
Integrating different smoothing & transformation methods to fine-tune your strategy
It’s a flexible tool for both manual traders and automated system developers who want clear, adaptive signals across different market conditions.
💡 What's Different
🔄 Candle Type Transformations
⚙️ Custom Candle Smoothing
📉 Candle's Multi-level Volatility Bands
🔺 Dynamic Entry Signals (Buy/Sell Labels)
❗Important Note:
This script is provided for educational purposes and does not constitute financial advice. Traders and investors should conduct their research and analysis before making any trading decisions.
LTP+ (Satori)Description:
- The LTP+ (Satori) indicator is a powerful tool designed for traders seeking to enhance their market analysis and decision-making processes. Utilizing a unique logistic kernel regression method, this indicator provides a smoothed moving average (MA) that adapts to market volatility, allowing traders to identify potential entry and exit points effectively.
Features:
- Non-Repainting: The indicator ensures that its signals remain valid and do not change after the bar has closed, providing reliable insights for traders.
- Customizable Settings: Users can adjust various parameters, including:
+ Bandwidth: Controls the sensitivity of the indicator to price changes. Higher values can smooth out fluctuations, while lower values can provide more responsive signals.
+ Deviation: Sets the standard deviation multiplier, allowing users to visualize upper and lower bounds on price movement.
+ Line Style: Choose between solid, dotted, or dashed lines for visual preferences.
+Label Visibility: Option to display bullish and bearish labels, enhancing visual clarity on the chart.
- Visual Elements:
+ Main Line: Displays the non-repaint moving average, colored according to the price direction (bullish or bearish).
+ Standard Deviation Bands: Upper and lower bands are plotted to indicate potential volatility levels, helping traders assess risk.
+ Directional Labels: Up and down arrows are displayed at significant crossover points, providing clear signals for potential market reversals.
Use Cases:
+ Trend Analysis: Traders can utilize the smoothed moving average to identify prevailing trends in the market, aiding in both long and short trading strategies.
+ Signal Generation: The indicator's crossover points and standard deviation bands can serve as actionable buy or sell signals, providing traders with key insights into market movements.
+ Risk Management: By visualizing volatility through standard deviation bands, traders can make informed decisions about position sizing and stop-loss placement.
- How to Use:
1. Apply the LTP+ (Satori) indicator to your chart on TradingView.
2. Adjust the bandwidth and deviation settings based on your trading style and market conditions.
3. Monitor the main line for crossover events, and observe the standard deviation bands to assess market volatility.
4. Utilize the directional labels for additional confirmation of potential entry or exit points.
Conclusion:
- The LTP+ (Satori) indicator combines advanced statistical techniques with user-friendly features, making it an essential tool for traders looking to improve their market analysis. Whether you are a beginner or an experienced trader, this indicator can help you navigate the complexities of financial markets with greater confidence.

True Amplitude Envelopes (TAE)The True Envelopes indicator is an adaptation of the True Amplitude Envelope (TAE) method, based on the research paper " Improved Estimation of the Amplitude Envelope of Time Domain Signals Using True Envelope Cepstral Smoothing " by Caetano and Rodet. This indicator aims to create an asymmetric price envelope with strong predictive power, closely following the methodology outlined in the paper.
Due to the inherent limitations of Pine Script, the indicator utilizes a Kernel Density Estimator (KDE) in place of the original Cepstral Smoothing technique described in the paper. While this approach was chosen out of necessity rather than superiority, the resulting method is designed to be as effective as possible within the constraints of the Pine environment.
This indicator is ideal for traders seeking an advanced tool to analyze price dynamics, offering insights into potential price movements while working within the practical constraints of Pine Script. Whether used in dynamic mode or with a static setting, the True Envelopes indicator helps in identifying key support and resistance levels, making it a valuable asset in any trading strategy.
Key Features:
Dynamic Mode: The indicator dynamically estimates the fundamental frequency of the price, optimizing the envelope generation process in real-time to capture critical price movements.
High-Pass Filtering: Uses a high-pass filtered signal to identify and smoothly interpolate price peaks, ensuring that the envelope accurately reflects significant price changes.
Kernel Density Estimation: Although implemented as a workaround, the KDE technique allows for flexible and adaptive smoothing of the envelope, aimed at achieving results comparable to the more sophisticated methods described in the original research.
Symmetric and Asymmetric Envelopes: Provides options to select between symmetric and asymmetric envelopes, accommodating various trading strategies and market conditions.
Smoothness Control: Features adjustable smoothness settings, enabling users to balance between responsiveness and the overall smoothness of the envelopes.
The True Envelopes indicator comes with a variety of input settings that allow traders to customize the behavior of the envelopes to match their specific trading needs and market conditions. Understanding each of these settings is crucial for optimizing the indicator's performance.
Main Settings
Source: This is the data series on which the indicator is applied, typically the closing price (close). You can select other price data like open, high, low, or a custom series to base the envelope calculations.
History: This setting determines how much historical data the indicator should consider when calculating the envelopes. A value of 0 will make the indicator process all available data, while a higher value restricts it to the most recent n bars. This can be useful for reducing the computational load or focusing the analysis on recent market behavior.
Iterations: This parameter controls the number of iterations used in the envelope generation algorithm. More iterations will typically result in a smoother envelope, but can also increase computation time. The optimal number of iterations depends on the desired balance between smoothness and responsiveness.
Kernel Style: The smoothing kernel used in the Kernel Density Estimator (KDE). Available options include Sinc, Gaussian, Epanechnikov, Logistic, and Triangular. Each kernel has different properties, affecting how the smoothing is applied. For example, Gaussian provides a smooth, bell-shaped curve, while Epanechnikov is more efficient computationally with a parabolic shape.
Envelope Style: This setting determines whether the envelope should be Static or Dynamic. The Static mode applies a fixed period for the envelope, while the Dynamic mode automatically adjusts the period based on the fundamental frequency of the price data. Dynamic mode is typically more responsive to changing market conditions.
High Q: This option controls the quality factor (Q) of the high-pass filter. Enabling this will increase the Q factor, leading to a sharper cutoff and more precise isolation of high-frequency components, which can help in better identifying significant price peaks.
Symmetric: This setting allows you to choose between symmetric and asymmetric envelopes. Symmetric envelopes maintain an equal distance from the central price line on both sides, while asymmetric envelopes can adjust differently above and below the price line, which might better capture market conditions where upside and downside volatility are not equal.
Smooth Envelopes: When enabled, this setting applies additional smoothing to the envelopes. While this can reduce noise and make the envelopes more visually appealing, it may also decrease their responsiveness to sudden market changes.
Dynamic Settings
Extra Detrend: This setting toggles an additional high-pass filter that can be applied when using a long filter period. The purpose is to further detrend the data, ensuring that the envelope focuses solely on the most recent price oscillations.
Filter Period Multiplier: This multiplier adjusts the period of the high-pass filter dynamically based on the detected fundamental frequency. Increasing this multiplier will lengthen the period, making the filter less sensitive to short-term price fluctuations.
Filter Period (Min) and Filter Period (Max): These settings define the minimum and maximum bounds for the high-pass filter period. They ensure that the filter period stays within a reasonable range, preventing it from becoming too short (and overly sensitive) or too long (and too sluggish).
Envelope Period Multiplier: Similar to the filter period multiplier, this adjusts the period for the envelope generation. It scales the period dynamically to match the detected price cycles, allowing for more precise envelope adjustments.
Envelope Period (Min) and Envelope Period (Max): These settings establish the minimum and maximum bounds for the envelope period, ensuring the envelopes remain adaptive without becoming too reactive or too slow.
Static Settings
Filter Period: In static mode, this setting determines the fixed period for the high-pass filter. A shorter period will make the filter more responsive to price changes, while a longer period will smooth out more of the price data.
Envelope Period: This setting specifies the fixed period used for generating the envelopes in static mode. It directly influences how tightly or loosely the envelopes follow the price action.
TAE Smoothing: This controls the degree of smoothing applied during the TAE process in static mode. Higher smoothing values result in more gradual envelope curves, which can be useful in reducing noise but may also delay the envelope’s response to rapid price movements.
Visual Settings
Top Band Color: This setting allows you to choose the color for the upper band of the envelope. This band represents the resistance level in the price action.
Bottom Band Color: Similar to the top band color, this setting controls the color of the lower band, which represents the support level.
Center Line Color: This is the color of the central price line, often referred to as the carrier. It represents the detrended price around which the envelopes are constructed.
Line Width: This determines the thickness of the plotted lines for the top band, bottom band, and center line. Thicker lines can make the envelopes more visible, especially when overlaid on price data.
Fill Alpha: This controls the transparency level of the shaded area between the top and bottom bands. A lower alpha value will make the fill more transparent, while a higher value will make it more opaque, helping to highlight the envelope more clearly.
The envelopes generated by the True Envelopes indicator are designed to provide a more precise and responsive representation of price action compared to traditional methods like Bollinger Bands or Keltner Channels. The core idea behind this indicator is to create a price envelope that smoothly interpolates the significant peaks in price action, offering a more accurate depiction of support and resistance levels.
One of the critical aspects of this approach is the use of a high-pass filtered signal to identify these peaks. The high-pass filter serves as an effective method of detrending the price data, isolating the rapid fluctuations in price that are often lost in standard trend-following indicators. By filtering out the lower frequency components (i.e., the trend), the high-pass filter reveals the underlying oscillations in the price, which correspond to significant peaks and troughs. These oscillations are crucial for accurately constructing the envelope, as they represent the most responsive elements of the price movement.
The algorithm works by first applying the high-pass filter to the source price data, effectively detrending the series and isolating the high-frequency price changes. This filtered signal is then used to estimate the fundamental frequency of the price movement, which is essential for dynamically adjusting the envelope to current market conditions. By focusing on the peaks identified in the high-pass filtered signal, the algorithm generates an envelope that is both smooth and adaptive, closely following the most significant price changes without overfitting to transient noise.
Compared to traditional envelopes and bands, such as Bollinger Bands and Keltner Channels, the True Envelopes indicator offers several advantages. Bollinger Bands, which are based on standard deviations, and Keltner Channels, which use the average true range (ATR), both tend to react to price volatility but do not necessarily follow the peaks and troughs of the price with precision. As a result, these traditional methods can sometimes lag behind or fail to capture sudden shifts in price momentum, leading to either false signals or missed opportunities.
In contrast, the True Envelopes indicator, by using a high-pass filtered signal and a dynamic period estimation, adapts more quickly to changes in price behavior. The envelopes generated by this method are less prone to the lag that often affects standard deviation or ATR-based bands, and they provide a more accurate representation of the price's immediate oscillations. This can result in better predictive power and more reliable identification of support and resistance levels, making the True Envelopes indicator a valuable tool for traders looking for a more responsive and precise approach to market analysis.
In conclusion, the True Envelopes indicator is a powerful tool that blends advanced theoretical concepts with practical implementation, offering traders a precise and responsive way to analyze price dynamics. By adapting the True Amplitude Envelope (TAE) method through the use of a Kernel Density Estimator (KDE) and high-pass filtering, this indicator effectively captures the most significant price movements, providing a more accurate depiction of support and resistance levels compared to traditional methods like Bollinger Bands and Keltner Channels. The flexible settings allow for extensive customization, ensuring the indicator can be tailored to suit various trading strategies and market conditions.
Adaptive VWAP [QuantAlgo]Introducing the Adaptive VWAP by QuantAlgo 📈🧬
Enhance your trading and investing strategies with the Adaptive VWAP , a versatile tool designed to provide dynamic insights into market trends and price behavior. This indicator offers a flexible approach to VWAP calculations by allowing users to adapt it based on lookback periods or fixed timeframes, making it suitable for a wide range of market conditions.
🌟 Key Features:
🛠 Customizable VWAP Settings: Choose between an adaptive VWAP that adjusts based on a rolling lookback period, or switch to a fixed timeframe (e.g., daily, weekly, monthly) for a more structured approach. Adjust the VWAP to suit your trading or investing style.
💫 Dynamic Bands and ATR Filter: Configurable deviation bands with multipliers allow you to visualize price movement around VWAP, while an ATR-based noise filter helps reduce false signals during periods of market fluctuation.
🎨 Trend Visualization: Color-coded trend identification helps you easily spot uptrends and downtrends based on VWAP positioning. The indicator fills the areas between the bands for clearer visual representation of price volatility and trend strength.
🔔 Custom Alerts: Set up alerts for when price crosses above or below the VWAP, signaling potential uptrend or downtrend opportunities. Stay informed without needing to monitor the charts constantly.
✍️ How to Use:
✅ Add the Indicator: Add the Adaptive VWAP to your favourites and apply to your chart. Choose between adaptive or timeframe-based VWAP calculation, adjust the lookback period, and configure the deviation bands to your preferred settings.
👀 Monitor Bands and Trends: Watch for price interaction with the VWAP and its deviation bands. The color-coded signals and band fills help identify potential trend shifts or price extremes.
🔔 Set Alerts: Configure alerts for uptrend and downtrend signals based on price crossing the VWAP, so you’re always informed of significant market movements.
⚙️ How It Works:
The Adaptive VWAP adjusts its calculation based on the user’s chosen configuration, allowing for a flexible approach to market analysis. The adaptive setting uses a rolling lookback period to continuously adjust the VWAP, while the fixed timeframe option anchors VWAP to key timeframes like daily, weekly, or monthly periods. This flexibility enables traders and investors to use the tool in various market environments.
Deviation bands, calculated with customizable multipliers, provide a clear visual of how far the price has moved from the VWAP, helping you gauge potential overbought or oversold conditions. To reduce false signals, an ATR-based filter can be applied, ensuring that only significant price movements trigger trend confirmations.
The tool also includes a fast exponential smoothing function for the VWAP, helping smooth out price fluctuations without sacrificing responsiveness. Trend confirmation is reinforced by the number of bars that price stays above or below the VWAP, ensuring a more consistent trend identification process.
Disclaimer:
The Adaptive VWAP is designed to enhance your market analysis but should not be relied upon as the sole basis for trading or investing decisions. Always combine it with other analytical tools and practices. No statements or signals from this indicator constitute financial advice. Past performance is not indicative of future results.

Charan_Trading_IndicatorCharan_Trading_Indicator Overview:
The Charan_Trading_Indicator combines several technical analysis tools, including Bollinger Bands, RSI (Relative Strength Index), VWAP (Volume-Weighted Average Price), and ATR (Average True Range), to provide buy and sell signals. The script incorporates multiple strategies, such as crack snap setups, overbought/oversold levels, and trend continuation indicators, all tailored for precise market entry and exit points.
Key Components:
RSI (Relative Strength Index):
The indicator uses RSI to detect overbought (RSI > 70) and oversold (RSI < 30) market conditions.
Alerts are triggered when prices are within the specified buy/sell range and RSI crosses these thresholds.
Bollinger Bands:
Bollinger Bands are calculated based on a configurable moving average and standard deviation.
The script identifies potential buy signals when the price dips below the lower Bollinger Band and recovers, and sell signals when the price exceeds the upper Bollinger Band and retraces.
Crack Snap Strategies:
The indicator incorporates multiple variations of the crack snap strategy:
Buy Signals: Triggered when price opens below the lower Bollinger Band and closes above it, alongside certain conditions in previous candles.
Sell Signals: Triggered when price opens above the upper Bollinger Band and closes below it, with similar candle patterns.
Variations such as 3-candle (3C) and 4-candle (4C) versions refine the crack snap setups for more robust signals.
Isolated Candle Conditions:
The indicator tracks isolated candles, where the entire candle lies above or below the Bollinger Bands, to identify potential reversal points.
Trend Continuation Signals:
Conditions based on the candle range and previous highs/lows allow the indicator to generate signals for trend continuation:
Buy signals when price breaks above the previous two highs.
Sell signals when price breaks below the previous two lows.
VWAP (Volume-Weighted Average Price):
The indicator integrates VWAP to give additional support and resistance levels, ensuring signals align with volume trends.
ATR-Based Stop Loss:
For both buy and sell conditions, the script plots stop-loss levels based on the ATR (Average True Range), giving dynamic risk management levels.
Buy/Sell Ranges:
The user can set minimum and maximum price ranges for buy and sell signals, ensuring that the indicator only generates alerts within desired price ranges.
How It Works:
Buy Signals: The script generates buy signals based on multiple conditions, including the crack snap strategy, oversold RSI levels, and trend continuation setups. When these conditions are met, green triangles appear below the price bars, and an alert is triggered.
Sell Signals: Sell signals are triggered when the opposite conditions are met (overbought RSI, crack snap sell setups, trend breaks), and red triangles appear above the price bars.
Visual Indicators: The script plots upper and lower Bollinger Bands, stop loss levels, and VWAP on the chart, providing a comprehensive view of market conditions and support/resistance levels.
This indicator is versatile, combining multiple technical tools for robust decision-making in trading. It generates alerts, plots visual markers, and integrates risk management, making it a well-rounded tool for technical analysis.
This indicator is versatile, combining multiple technical tools for robust decision-making in trading. It generates alerts, plots visual markers, and integrates risk management, making it a well-rounded tool for technical analysis.

Adaptive Bollinger-RSI Trend Signal [CHE]Adaptive Bollinger-RSI Trend Signal
Indicator Overview:
The "Adaptive Bollinger-RSI Trend Signal " (ABRT Signal ) is a sophisticated trading tool designed to provide clear and actionable buy and sell signals by combining the power of Bollinger Bands and the Relative Strength Index (RSI). This indicator aims to help traders identify potential trend reversals and confirm entry and exit points with greater accuracy.
Key Features:
1. Bollinger Bands Integration:
- Utilizes Bollinger Bands to detect price volatility and identify overbought or oversold conditions.
- Configurable parameters: Length, Source, and Multiplier for precise adjustments based on trading preferences.
- Color customization: Change the colors of the basis line, upper band, lower band, and the fill color between bands.
2. RSI Integration:
- Incorporates the Relative Strength Index (RSI) to validate potential buy and sell signals.
- Configurable parameters: Length, Source, Upper Threshold, and Lower Threshold for customized signal generation.
3. Signal Generation:
- Buy Signal: Generated when the price crosses below the lower Bollinger Band and the RSI crosses above the lower threshold, indicating a potential upward trend.
- Sell Signal: Generated when the price crosses above the upper Bollinger Band and the RSI crosses below the upper threshold, indicating a potential downward trend.
- Color customization: Change the colors of the buy and sell signal labels.
4. State Tracking:
- Tracks and records crossover and crossunder states of the price and RSI to ensure signals are only generated under the right conditions.
- Monitors the basis trend (SMA of the Bollinger Bands) to provide context for signal validation.
5. Counters and Labels:
- Labels each buy and sell signal with a counter to indicate the number of consecutive signals.
- Counters reset upon the generation of an opposite signal, ensuring clarity and preventing signal clutter.
6. DCA (Dollar-Cost Averaging) Calculation:
- Stores the close price at each signal and calculates the average entry price (DCA) for both buy and sell signals.
- Displays the number of positions and DCA values in a label on the chart.
7. Customizable Inputs:
- Easily adjustable parameters for Bollinger Bands, RSI, and colors to suit various trading strategies and timeframes.
- Boolean input to show or hide the table label displaying position counts and DCA values.
- Intuitive and user-friendly configuration options for traders of all experience levels.
How to Use:
1. Setup:
- Add the "Adaptive Bollinger-RSI Trend Signal " to your TradingView chart.
- Customize the input parameters to match your trading style and preferred timeframe.
- Adjust the colors of the indicator elements to your preference for better visibility and clarity.
2. Interpreting Signals:
- Buy Signal: Look for a "Buy" label on the chart, indicating a potential entry point when the price is oversold and RSI signals upward momentum.
- Sell Signal: Look for a "Sell" label on the chart, indicating a potential exit point when the price is overbought and RSI signals downward momentum.
3. Trade Execution:
- Use the buy and sell signals to guide your trade entries and exits, aligning them with your overall trading strategy.
- Monitor the counter labels to understand the strength and frequency of signals, helping you make informed decisions.
4. Adjust and Optimize:
- Regularly review and adjust the indicator parameters based on market conditions and backtesting results.
- Combine this indicator with other technical analysis tools to enhance your trading accuracy and performance.
5. Monitor DCA Values:
- Enable the table label to display the number of positions and average entry prices (DCA) for both buy and sell signals.
- Use this information to assess the cost basis of your trades and make strategic adjustments as needed.
Conclusion:
The Adaptive Bollinger-RSI Trend Signal is a powerful and versatile trading tool designed to help traders identify and capitalize on trend reversals with confidence. By combining the strengths of Bollinger Bands and RSI, this indicator provides clear and reliable signals, making it an essential addition to any trader's toolkit. Customize the settings, interpret the signals, and execute your trades with precision using this comprehensive indicator.

WinningWave By Sercan V1Winningwave is a hurricane algorithm that works in all time frames and all transactions (stock exchange-coin), is too comprehensive to be explained in detail and includes many strategies.
To explain briefly; It is a layered oracle algorithm that gives signals by filtering the formations (Normal and Harmonic formations) created by multiple account movements containing many calculations and algorithms, based on the instantaneous momentum of the price and the overbought or oversold levels in a certain time period. Of course, formations refer to situations in which price movements occur in a certain order in financial markets. These patterns are specific patterns seen on the price chart and can often provide clues about future movements of prices. For example; Reverse Shoulder, Head and Shoulder, Symmetrical Triangle etc. Dozens of formation formation conditions and targets were filtered and made suitable for signaling. It also creates bands using YDK3 with the channel algorithm it contains. This band is usually calculated using the standard deviation method to measure price movements and indicate a specific deviation. The upper and lower bands obtained as a result of standard deviation calculations are drawn on the price chart. After a certain band is created, automatic expansion is carried out in order to predict possible movements of future prices. Additionally, Winningwave includes Ema calculations and has identified stop points after the main entry signal to help you in case you miss the main exit signal or choose a different strategy.
STRATEGY 1: As I mentioned in the general statement, the signals that emerged after many formations were filtered in 2 stages (SMI and CCI values served as filters for the formations) and the false signal rate was reduced to a minimum. You can combine signals into your own strategy using oscillators and tactics you trust.
It is important to remember that no indicator or tactic works 100% accurately. That's why filters and combinations are the right methods for you.
STRATEGY 2: Channel programs often create bands using the standard deviation method to indicate price movements and a specific deviation. Standard deviations are a measure of how far prices are generally from the mean. Channel programs draw price charts by creating upper and lower bands using these standard deviation values.
These bands can become very narrow depending on the playability of the price and the strength of the trends. In this way it can change the normal range of movement of prices and indicate potential overbought or oversold.
Once the channel is created, it is automatically expanded and gives us some clues about the direction of price movements. This expansion automatically signals the change according to the price movements of the bands. This feature becomes a predictive tool to predict price movements on the indicator.
Thus, using channel updates and standard deviation, the bands show the normal range of prices and these bands expand or contract dynamically, giving an idea about possible changes in prices. This can help investors gain insight into potential trend reversals or overbought or oversold prices.
In channel band strategy . It is a second strategy in which we calculate the profit rate with the most logical calculations when the prices touch the channel bottoms and channel tops and move up or down.
STRATEGY 3: We aimed to create a stop zone by blending the most appropriate ema values with buy signals. In some cases where you don't want to follow the signals or are confident in the transaction (written to filter out successive sell signals where price action generally rises without correction), it has created a more reliable stopping point for your trading strategy. It gives you a stopping point.
*** Calculations and mathematical settings will be in the menu. For healthy signals and filters, do not play with the numbers. For your personal use, color options or On-Off settings of each feature are available in the menu.

Smart Money [Sir_Castle]The Smart Money indicator, developed by Sir_Castle , is a sophisticated tool designed to empower traders with a comprehensive set of features for insightful market analysis. Here's an overview of its key functionalities:
Bollinger Bands and Price Action Signals:
The indicator incorporates a signal system that facilitates a detailed study of Bollinger Bands and price action dynamics.
Traders can leverage these signals to gain valuable insights into market trends and potential entry/exit points.
Multiple Indicator Integration:
The Smart Money indicator seamlessly integrates multiple indicators, allowing users to customize and enhance the interpretation of signals generated by Bollinger Bands and price action studies.
This flexibility empowers traders to fine-tune their analysis based on their unique preferences and strategies.
Configurable EMA and EMA Clouds:
The indicator provides configurable Exponential Moving Averages (EMA) and EMA Clouds, enabling users to adapt these moving averages to suit their trading objectives.
Traders can efficiently incorporate these customizable features to align with their specific market perspectives.
ATR-Based Stop Loss Calculation:
The Smart Money indicator calculates Stop Loss levels using the Average True Range (ATR), offering a dynamic risk management tool.
This ATR-based approach adds a layer of precision to risk control strategies, enhancing overall trade management.
Configurable Bollinger Bands:
Traders can tailor Bollinger Bands settings to match their preferences and market conditions, ensuring adaptability to different asset classes and timeframes.
This customization feature provides a versatile tool for technical analysis.
Note: The Smart Money indicator is for educational purposes only. Signals aid in price action analysis, and users are encouraged to combine insights with personal due diligence.
Thank you for considering the Smart Money indicator for your trading toolkit. Happy trading!"
Matrix Momentum Expansion [IkkeOmar]The indicator consists of several features:
Candlestick chart: The indicator plots a candlestick chart based on the input parameters of the user. The candlesticks are colored blue or orange depending on whether the closing price is above or below the upper and lower bands.
Support and Resistance levels: The indicator also plots support and resistance levels based on the CCI (Commodity Channel Index) of the asset's price. These levels are dynamic and change based on the user's input parameters.
Momentum: The indicator calculates the momentum of the market based on the smoothed and standard deviation of the asset's price. It uses this momentum to calculate upper and lower bands that are plotted on the chart.
Warning signals: The indicator can also be used to identify potential warning signals. When the closing price of the asset moves above the upper band, it could indicate that the market is overbought and a potential reversal could occur. Conversely, when the closing price moves below the lower band, it could indicate that the market is oversold and a potential reversal could occur.
Contractions and expansions in the bands can provide important information to traders about potential price movements.
When the bands contract, it indicates that the market is experiencing low volatility and the price is likely to move sideways. During these periods, traders may look for other signals, such as support and resistance levels or price patterns, to determine potential entry and exit points.
On the other hand, when the bands expand, it indicates that the market is experiencing high volatility and the price is likely to move in a particular direction. Traders can use this information to identify potential trend reversals or continuation patterns. When the upper and lower bands move further apart, it indicates that the trend is becoming stronger, while when they move closer together, it indicates that the trend may be weakening.
When the price moves outside of the bands, it can also provide important information to traders. If the price moves above the upper band, it could indicate that the market is overbought and a potential reversal could occur. Conversely, if the price moves below the lower band, it could indicate that the market is oversold and a potential reversal could occur.
Very important note!
When you see contractions, please understand that it's a wonderful opportunity to pivot into position to catch a good trade because we will see an expansion after!

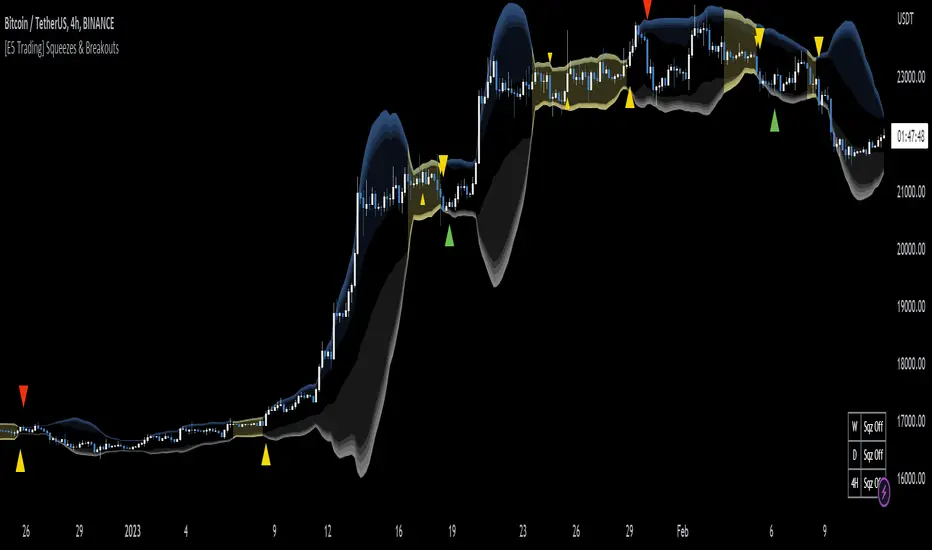
[E5 Trading] Squeezes & BreakoutsE5 Trading Squeezes & Breakouts is a powerful indicator that works well on all timeframes with proper risk management.
Squeezes occur when an asset's price volatility falls to statistically low levels.
Breakouts from the squeeze are typically violent and potentially highly profitable if the trader can get in the trade early and catch the breakout in the right direction.
E5 Trading Squeezes & Breakouts was built to help traders take advantage of these squeeze play opportunities.
Squeezes Visualization
This indicator lets traders know whenever price action is in a squeeze for any asset on any timeframe.
Volatility bands display on the chart along with colored squeeze bands and channel fills.
Toggle (Squeeze Bands) to display "the squeeze" when price action is in a low-volatility range. Default (On).
The color setting of the squeeze bands controls the color of the channel fill and the squeeze table in the lower-right corner of the chart.
Volatility Bands
Gradient shading represents reversal zones based on Bollinger Bands (BB).
The likelihood of price reversion towards the mean (i.e., basis) increases the further price action pushes into the darker shaded zones.
The middle area inside the shaded bands (i.e., same color as chart background) is the Keltner channel.
The Keltner channel is another volatility-based method used to identify breakouts and mean reversion trading opportunities.
Keltner channel boundaries calculate using the exponential moving average (EMA) and average true range (ATR).
Toggle (Volatility Basis) to display the basis line (i.e., mean) of the volatility bands. Default (Off).
Squeeze Table
The Squeeze Table appears in the lower right-hand corner of each chart when the indicator is turned on.
The squeeze table displays the squeeze status on the current timeframe plus the commonly used higher timeframes for each asset.
The squeeze table will indicate “Sqz On” next to the respective timeframe whenever a squeeze is occurring. The timeframes available in the squeeze table are 5m, 15m, 1H, 4H, D, and W.
Squeeze Early Entry & Breakout Signals
Squeeze Early Entry and Breakout Signals can only occur once price action has started a squeeze.
Pay attention to assets that are currently in a squeeze and be ready to take action because explosive price moves are coming soon!
Traders should use a stop-loss on every trade because squeeze fake-outs occur; however, the upside potential of squeeze breakouts that work out can be massive.
Preserve capital with good risk management and ride the winners.
Squeeze Early Entry
Toggle (Squeeze Early Entry) to display long and short trade entry signals that offer a clue about the potential squeeze breakout direction.
These early entry signals provide traders with an opportunity to start building a position while in a low-volatility squeeze in anticipation of a violent breakout.
Note: Squeeze Early Entry signals may not result from every squeeze.
Squeeze Breakout
These signals flag when the price breaks out of a statistically low-volatility period.
This is either the beginning of a potentially massive move or a nasty fake-out, which is why traders MUST use a stop-loss on every trade.
Toggle (Squeeze Breakout) to display long and short squeeze breakout trade entry signals. Default (On).
Note: Squeeze Breakout signals may not result from every squeeze.
Wave Strength Oscillator By CryptoScriptsThe Wave Strength Oscillator uses a combination of wave strength and momentum to help catch the best entries for reversals and does so using a few methods. I'm currently using the 1h timeframe for BTC but feel free to experiment on different timeframes to see what works best for you. In the description below, I'll go over each signal, how it's derived, and how to use them!
Oversold (Green shaded area) - The oversold indication appears whenever both oscillators are oversold and is usually a good indicator that a reversal to the upside is around the corner (at least for a short period). Be advised these are the weakest of the three signals so I recommend using this signal with other indicators.
Overbought (Red shaded area) - The overbought indication appears whenever both oscillators are overbought and is usually a good indicator that a reversal to the downside is around the corner (at least for a short period). Be advised these are the weakest of the three signals so I recommend using this signal with other indicators.
Green Diamond - The green diamonds indicate whenever one or both of the oscillators are oversold AND they are both outside of the bollinger bands which is great for catching reversals to the upside (as seen in the chart). These may come two or three at a time so it may be best to wait until they have all printed before entering.
Red Diamond - The red diamonds indicate whenever one or both of the oscillators are overbought AND they are both outside of the bollinger bands which is great for catching reversals to the downside (as seen in the chart). These may come two or three at a time so it may be best to wait until they have all printed before entering.
Rocket - The rocket symbol occurs whenever BOTH oscillators are oversold and BOTH oscillators are outside of the bollinger bands. This is great for catching reversals to the upside but may come two or three at a time so it may be best to wait until they have all printed before entering.
Red Alarm - The red alarm symbol occurs whenever BOTH oscillators are oversold and BOTH oscillators are outside of the bollinger bands. This is great for catching reversals to the downside but may come two or three at a time so it may be best to wait until they have all printed before entering.
Input Options
Show Histogram - I also included a Histogram in the indicator to help gauge the level of buys/sell strength but kept it hidden for the default levels (i.e a green diamond with a red histogram bar is usually a good sign a reversal is about to happen to the upside whereas a green diamond with a green histogram bar may indicate a false reversal and there's still more room to the downside until a red bar appears. Always backtest this!)
Show Overbought/Oversold Levels - This is if you want to ignore all of the green/red shaded areas and only focus on the diamonds and rocket/alarm signals
Wave Overbought/Oversold Levels - Free free to change to value of the overbought/oversold levels to change where the green/red shades areas print
Momentum Overbought/Oversold Levels - Free free to change to value of the overbought/oversold levels to change where the green/red shades areas print
Histogram Length - This will not change anything with the signals but I included it so you can change the visuals if it helps you
Momentum Length - This will change where the signals plot
Momentum Signal - This only changes the yellow signal line and nothing else. It's not incorporated into any equation
Average Length - This will change where the signals plot
Alerts
I've set alerts on this indicator for each icon (Oversold, Overbought, Green Diamond, Red Diamond, Rocket, Red Alarm). I HIGHLY recommend setting the alerts for Candle Close so that you can be sure the signal is confirmed.
You may notice that the indicator can give multiple signals back-to-back or be overbought/oversold for multiple candles. When this happens, it's best to look at other indicators such as the RSI , MFI Pro, etc to nail the best entry and have confluence with your decision. With that said, having multiple signals back-to-back can also be an indication that the move is close to happening. This indicator works with crypto and stocks as well.
If you have any questions or would like to purchase this indicator, please comment below or PM me. I also made a video tutorial for the indicator on my Youtube channel (link is next to my profile pic)
Be advised past performance is not indicative of future returns. Backtest EVERY timeframe and NEVER blindly take signals! Also, never invest more than you can afford to lose.
Enjoy :)

SPX Realized Volatility & Expected MoveRealized Volatility & Expected Move Dashboard
This indicator provides a sophisticated, multi-horizon view of an asset's historical volatility and projects the corresponding expected move (EM) in price points. Unlike indicators that rely on implied volatility (VIX), this tool uses the asset's own historical price action (Realized Volatility) to forecast future range potential.
Key Features & Calculations
Multi-Horizon Realized Volatility (RV): Calculates the annualized Realized Volatility based on log returns for three critical lookback periods:
30 Days (Long-Term): Measures structural volatility (default lookback).
9 Days (Short-Term): Captures recent market temperament.
1 Day (Immediate): Highly reactive to the previous day's movement.
Daily Timeframe Independence (Critical): The RV calculation is performed exclusively on Daily price data (via request.security), ensuring that the 30-day lookback is always 30 calendar days, regardless of whether you view the indicator on a 1-minute or 4-hour chart.
Expected Move Projection: Projects the calculated RV onto the price using the standard financial formula:
$$\text{EM}_{\text{H}} = \text{Price} \times \frac{\text{RV}_{\text{Annual}}}{100} \times \sqrt{\frac{\text{Horizon Days}}{252}}$$
Visual Bands: Plots the Upper and Lower Expected Move bands centered around the current price for all three horizons, providing clear targets for range expansion or contraction.
Comprehensive Table Output: A dashboard summarizes the key metrics, displaying:
Realized Vol (Annualized %): The raw volatility percentage.
Full Horizon Expected Move: The calculated price point move over the full 30-day, 9-day, or 1-day horizon.
Daily Equivalent Expected Move: The daily expected move derived from that RV, making it the most useful target for intraday trading (e.g., the $\pm 1\sigma$ move for today).
Interpretation & Usage
Identify Regime Changes: Compare the short-term RV (9D) against the long-term RV (30D). If 9D > 30D, volatility is accelerating; if 9D < 30D, volatility is contracting.
Set Intraday Targets: Use the 1 Day EM or the Daily Equivalent EM derived from the 9D/30D bands as dynamic support and resistance levels for the trading session.
Analyze Over-Extension: If the price trades outside the 30 Day EM bands, the move is historically extreme and may signal a sharp reversal or momentum exhaustion.

Multi-Timeframe Trend MA&BB Suite: 6x Moving Averages by Jenn.ioMulti-Timeframe Trend MA & BB Suite: 6x Moving Averages + 5x MTF View by Jenn.io
Indicator Overview
This indicator is a comprehensive, all-in-one trend and volatility tool designed for traders who rely on Moving Averages (MAs) and Bollinger Bands (BBs). It stands out by allowing users to plot up to six fully customized MAs on the current chart, while simultaneously projecting the values of those same MAs from up to five higher timeframes (MTF).
It's the essential tool for top-down analysis and identifying high-probability confluence zones.
Key Features and Customization
1. The Core: 6x MAs and Bollinger Bands: six Independent MAs: Plot up to six separate Moving Averages on your current chart. Each MA is fully customizable in terms of:
Type: Choose from SMA, EMA, SMMA (RMA), WMA, or VWMA.
Source and Length: Set the calculation source (Close, Open, etc.) and the lookback period.
Style: Customize color, thickness, and line style (Solid, Dashed, Dotted).
Integrated Bollinger Bands (BB): Includes standard Bollinger Bands with customization for length, standard deviation, MA type, and the option to enable or disable the band fill color.
2. Advanced: Multi-Timeframe (MTF) Projection
a. 5x MTF Timeframes: The user can enable and fully customize up to five distinct higher timeframes (e.g., Daily, Weekly, Monthly, 4H, 15m).
b. Dynamic MTF Visualization: The indicator fetches the value of the 6 MAs from these higher timeframes and displays them on the current chart using one of three customizable modes:
Extended Mode: Projects the MTF MA value as a continuous line extending to the right, simulating where the MA is moving on the higher chart.
Floating Segment: Draws a short, visible line segment near the current price action, showing the MA value without cluttering the whole chart.
Floating Label: Displays the MA value as a text label anchored to the right of the current bar, providing clean, non-obtrusive data.
Recommended Usage
1. MTF Confluence: Look for instances where the MTF MA lines align closely with the MAs or BBs of your current timeframe. These areas represent strong support/resistance zones.
2. Trend Filter: Use the Extended Mode MTF lines to quickly determine the higher-timeframe trend without changing your chart. For example, if the Daily 200 EMA is above the current price, the bias is bearish.
3. Precision Entries: Use the Floating Label Mode to see the precise MA value from a higher timeframe. This is useful for placing limit orders near key structural levels.

Yearly VWAP with Z-Score V2This script extends the traditional Volume Weighted Average Price (VWAP) by applying it to yearly sessions (with a customizable start month) and combining it with a Z-Score framework to standardize price deviations from VWAP.
Features
Yearly VWAP: Automatically resets at the selected month, making it possible to align VWAP with fiscal or seasonal cycles (e.g., June–May).
Volatility-Weighted Bands: Standard deviation is calculated using volume-weighted price variance, creating adaptive upper and lower bands around VWAP.
Z-Score Calculation: Converts price distance from VWAP into standardized scores, ranging from +2.5 to –2.5. This enables statistical interpretation of whether price is trading at fair value, extended, or oversold relative to VWAP.
Custom Session Control: Input allows users to change the yearly anchor month.
On-Chart Display: VWAP and bands are plotted, with a live Z-Score label shown on the latest bar.
How to Use
Fair Value Reference: VWAP reflects the average price weighted by volume over the yearly session — a natural equilibrium point.
Overbought / Oversold Detection: Extreme Z-Score readings (±2 or beyond) highlight when price is stretched relative to VWAP.
Cycle Analysis: Resetting VWAP by custom months allows studying market behavior over fiscal years, seasons, or custom trading cycles.
Part of a Broader Toolkit: This script is not a standalone trading system. It works best when aggregated with other indicators, confluence factors, or a structured strategy.
Originality
Unlike a standard VWAP, this version:
Uses yearly anchoring with custom start month instead of session/day anchoring.
Adds volume-weighted standard deviation bands for statistical context.
Translates distance into a Z-Score scale for objective overbought/oversold assessment.
Positive Z-Score values indicate zones where price is positioned favorably for accumulation or potential buys, while negative values highlight areas more suitable for distribution or profit-taking — always best used in confluence with other tools rather than as a standalone signal
RSI WMA VWMA Divergence Indicator//@version=6
indicator(title="RSI WMA VWMA Divergence Indicator", shorttitle="Osc Div", format=format.price, precision=2)
oscType = input.string("RSI", "Oscillator Type", options = , group="General Settings")
// RSI Settings
rsiGroup = "RSI Settings"
rsiLengthInput = input.int(14, minval=1, title="RSI Length", group=rsiGroup)
rsiSourceInput = input.source(close, "Source", group=rsiGroup)
// WMA VWMA
wma9 = ta.wma(close, 9)
vwma3 = ta.vwma(close, 3)
useVWMA = input.bool(true, "Use VWMA3 for Divergence (when WMA9 + VWMA3 mode)", group="WMA Settings")
// Oscillator selection
rsi = ta.rsi(rsiSourceInput, rsiLengthInput) // Calculate RSI always, but use conditionally
osc = oscType == "RSI" ? rsi : useVWMA ? vwma3 : wma9
// RSI plots (conditional)
isRSI = oscType == "RSI"
rsiPlot = plot(isRSI ? rsi : na, "RSI", color=isRSI ? #7E57C2 : na)
rsiUpperBand = hline(isRSI ? 70 : na, "RSI Upper Band", color=isRSI ? #787B86 : na)
midline = hline(isRSI ? 50 : na, "RSI Middle Band", color=isRSI ? color.new(#787B86, 50) : na)
rsiLowerBand = hline(isRSI ? 30 : na, "RSI Lower Band", color=isRSI ? #787B86 : na)
fill(rsiUpperBand, rsiLowerBand, color=isRSI ? color.rgb(126, 87, 194, 90) : na, title="RSI Background Fill")
midLinePlot = plot(isRSI ? 50 : na, color = na, editable = false, display = display.none)
fill(rsiPlot, midLinePlot, 100, 70, top_color = isRSI ? color.new(color.green, 0) : na, bottom_color = isRSI ? color.new(color.green, 100) : na, title = "Overbought Gradient Fill")
fill(rsiPlot, midLinePlot, 30, 0, top_color = isRSI ? color.new(color.red, 100) : na, bottom_color = isRSI ? color.new(color.red, 0) : na, title = "Oversold Gradient Fill")
// WMA VWMA plots
plot(oscType != "RSI" ? wma9 : na, "WMA9", color=oscType != "RSI" ? color.blue : na)
plot(oscType != "RSI" ? vwma3 : na, "VWMA3", color=oscType != "RSI" ? color.orange : na)
// Smoothing MA inputs (only for RSI)
GRP = "Smoothing (RSI only)"
TT_BB = "Only applies when 'SMA + Bollinger Bands' is selected. Determines the distance between the SMA and the bands."
maTypeInput = input.string("SMA", "Type", options = , group = GRP, display = display.data_window)
maLengthInput = input.int(14, "Length", group = GRP, display = display.data_window)
bbMultInput = input.float(2.0, "BB StdDev", minval = 0.001, maxval = 50, step = 0.5, tooltip = TT_BB, group = GRP, display = display.data_window)
enableMA = maTypeInput != "None" and oscType == "RSI"
isBB = maTypeInput == "SMA + Bollinger Bands" and oscType == "RSI"
// Smoothing MA Calculation
ma(source, length, MAtype) =>
switch MAtype
"SMA" => ta.sma(source, length)
"SMA + Bollinger Bands" => ta.sma(source, length)
"EMA" => ta.ema(source, length)
"SMMA (RMA)" => ta.rma(source, length)
"WMA" => ta.wma(source, length)
"VWMA" => ta.vwma(source, length)
// Smoothing MA plots
smoothingMA = enableMA ? ma(rsi, maLengthInput, maTypeInput) : na
smoothingStDev = isBB ? ta.stdev(rsi, maLengthInput) * bbMultInput : na
plot(smoothingMA, "RSI-based MA", color=enableMA ? color.yellow : na, display = enableMA ? display.all : display.none, editable = enableMA)
bbUpperBand = plot(isBB ? smoothingMA + smoothingStDev : na, title = "Upper Bollinger Band", color=isBB ? color.green : na, display = isBB ? display.all : display.none, editable = isBB)
bbLowerBand = plot(isBB ? smoothingMA - smoothingStDev : na, title = "Lower Bollinger Band", color=isBB ? color.green : na, display = isBB ? display.all : display.none, editable = isBB)
fill(bbUpperBand, bbLowerBand, color= isBB ? color.new(color.green, 90) : na, title="Bollinger Bands Background Fill", display = isBB ? display.all : display.none, editable = isBB)
// Divergence Settings
divGroup = "Divergence Settings"
calculateDivergence = input.bool(true, title="Calculate Divergence", group=divGroup, tooltip = "Calculating divergences is needed in order for divergence alerts to fire.")
lookbackLeft = input.int(5, "Pivot Lookback Left", minval=1, group=divGroup)
lookbackRight = input.int(5, "Pivot Lookback Right", minval=1, group=divGroup)
rangeLower = input.int(5, "Min Range for Divergence", minval=0, group=divGroup)
rangeUpper = input.int(60, "Max Range for Divergence", minval=1, group=divGroup)
showHidden = input.bool(true, "Show Hidden Divergences", group=divGroup)
bearColor = color.red
bullColor = color.green
textColor = color.white
noneColor = color.new(color.white, 100)
_inRange(cond) =>
bars = ta.barssince(cond)
rangeLower <= bars and bars <= rangeUpper
bool plFound = false
bool phFound = false
bool bullCond = false
bool bearCond = false
bool hiddenBullCond = false
bool hiddenBearCond = false
float oscLBR = na
float lowLBR = na
float highLBR = na
float prevPlOsc = na
float prevPlLow = na
float prevPhOsc = na
float prevPhHigh = na
if calculateDivergence
plFound := not na(ta.pivotlow(osc, lookbackLeft, lookbackRight))
phFound := not na(ta.pivothigh(osc, lookbackLeft, lookbackRight))
oscLBR := osc
lowLBR := low
highLBR := high
prevPlOsc := ta.valuewhen(plFound, oscLBR, 1)
prevPlLow := ta.valuewhen(plFound, lowLBR, 1)
prevPhOsc := ta.valuewhen(phFound, oscLBR, 1)
prevPhHigh := ta.valuewhen(phFound, highLBR, 1)
// Regular Bullish
oscHL = oscLBR > prevPlOsc and _inRange(plFound )
priceLL = lowLBR < prevPlLow
bullCond := priceLL and oscHL and plFound
// Regular Bearish
oscLL = oscLBR < prevPhOsc and _inRange(phFound )
priceHH = highLBR > prevPhHigh
bearCond := priceHH and oscLL and phFound
// Hidden Bullish
oscLL_hidden = oscLBR < prevPlOsc and _inRange(plFound )
priceHL = lowLBR > prevPlLow
hiddenBullCond := priceHL and oscLL_hidden and plFound and showHidden
// Hidden Bearish
oscHH_hidden = oscLBR > prevPhOsc and _inRange(phFound )
priceLH = highLBR < prevPhHigh
hiddenBearCond := priceLH and oscHH_hidden and phFound and showHidden
// Plot divergences (lines and labels on pane)
if bullCond
leftBar = ta.valuewhen(plFound, bar_index , 1)
line.new(leftBar, prevPlOsc, bar_index , oscLBR, xloc=xloc.bar_index, color=bullColor, width=2)
label.new(bar_index , oscLBR, "R Bull", style=label.style_label_up, color=noneColor, textcolor=textColor)
if bearCond
leftBar = ta.valuewhen(phFound, bar_index , 1)
line.new(leftBar, prevPhOsc, bar_index , oscLBR, xloc=xloc.bar_index, color=bearColor, width=2)
label.new(bar_index , oscLBR, "R Bear", style=label.style_label_down, color=noneColor, textcolor=textColor)
if hiddenBullCond
leftBar = ta.valuewhen(plFound, bar_index , 1)
line.new(leftBar, prevPlOsc, bar_index , oscLBR, xloc=xloc.bar_index, color=bullColor, width=2, style=line.style_dashed)
label.new(bar_index , oscLBR, "H Bull", style=label.style_label_up, color=noneColor, textcolor=textColor)
if hiddenBearCond
leftBar = ta.valuewhen(phFound, bar_index , 1)
line.new(leftBar, prevPhOsc, bar_index , oscLBR, xloc=xloc.bar_index, color=bearColor, width=2, style=line.style_dashed)
label.new(bar_index , oscLBR, "H Bear", style=label.style_label_down, color=noneColor, textcolor=textColor)
// Alert conditions
alertcondition(bullCond, title="Regular Bullish Divergence", message="Found a new Regular Bullish Divergence, Pivot Lookback Right number of bars to the left of the current bar.")
alertcondition(bearCond, title="Regular Bearish Divergence", message="Found a new Regular Bearish Divergence, Pivot Lookback Right number of bars to the left of the current bar.")
alertcondition(hiddenBullCond, title="Hidden Bullish Divergence", message="Found a new Hidden Bullish Divergence, Pivot Lookback Right number of bars to the left of the current bar.")
alertcondition(hiddenBearCond, title="Hidden Bearish Divergence", message="Found a new Hidden Bearish Divergence, Pivot Lookback Right number of bars to the left of the current bar.")

Weekly Standard Deviations (NQ1!/VXN / ES1!/VIX)Weekly Standard Deviations (NQ1!/VXN or ES1!/VIX) – Settlement-Based with Robust Volatility Calculation
This indicator displays weekly standard deviation bands for US index futures (NQ1!, ES1!, MNQ1!, MES1!) using a professional approach:
Weekly Settlement as Basis:
The center line ("Mid") is based on the official weekly settlement price of the selected future (using settlement feeds, not just the last traded price). This ensures high accuracy for institutional and systematic trading.
Volatility by VIX/VXN, Friday 5-Minute Close (CET):
The volatility input (σ) is dynamically derived from the VIX or VXN. Specifically, the indicator uses the last available 5-minute close on Friday after 22:00 CET (Central European Time) each week. If there is no data at exactly 22:10 or 22:05 (e.g. shortened sessions or holidays), it falls back to the latest available 5-minute close of that Friday, ensuring reliable calculation in all market conditions.
Standard Deviation Bands:
The ±1σ, ±2σ, and ±3σ bands are calculated from the weekly settlement price and the robust volatility value. These bands are widely used by professionals for mean reversion, volatility trading, and risk management.
Dynamic Holiday Logic:
Includes dynamic holiday calculation for major US market holidays (can be expanded for other regions). This helps to keep calculations consistent even in holiday weeks.
Labels & Visuals:
Each standard deviation level and the center are labeled for easy orientation. All lines are automatically updated at the start of each new week.
Recommended for:
Advanced traders, systematic/quant traders, and anyone who wants an institutional-grade approach to weekly volatility structure in US index futures.
How to Use:
Add to a chart of NQ1!, MNQ1!, ES1!, or MES1! (futures continuous contracts).
Choose your preferred symbol pair (NQ1!/VXN or ES1!/VIX) in the indicator settings.
All calculations and band updates are fully automatic.
This script is for educational and informational purposes only and should not be considered financial advice or a recommendation to buy or sell any security or derivative. Trading futures and derivatives involves substantial risk and is not suitable for every investor. The author of this script accepts no liability for any loss or damage arising from the use of this tool. Always do your own research and consult with a professional financial advisor before making investment decisions.
Consolidation Range with Signals (Zeiierman)█ Overview
Consolidation Range with Signals (Zeiierman) is a precision tool for identifying and trading market consolidation zones, where price contracts into tight ranges before significant movement. It provides dynamic range detection using either ADX-based trend strength or volatility compression metrics, and offers built-in take profit and stop loss signals based on breakout dynamics.
Whether you trade breakouts, range reversals, or trend continuation setups, this indicator visualizes the balance between supply and demand with clearly defined mid-bands, breakout zones, and momentum-sensitive TP/SL placements.
█ How It Works
⚪ Multi-Method Range Detection
ADX Mode
Uses the Average Directional Index (ADX) to detect low-trend-strength environments. When ADX is below your selected threshold, price is considered to be in consolidation.
Volatility Mode
This mode detects consolidation by identifying periods of volatility compression. It evaluates whether the following metrics are simultaneously below their respective historical rolling averages:
Standard Deviation
Variance
Average True Range (ATR)
⚪ Dynamic Range Band System
Once a range is confirmed, the system builds a dynamic band structure using a volatility-based filter and price-jump logic:
Middle Line (Trend Filter): Reacts to price imbalance using adaptive jump logic.
Upper & Lower Bands: Calculated by expanding from the middle line using a configurable multiplier.
This creates a clean, visual box that reflects current consolidation conditions and adapts as price fluctuates within or escapes the zone.
⚪ SL/TP Signal Engine
On detection of a breakout from the range, the indicator generates up to 3 Take Profit levels and one Stop Loss, based on the breakout direction:
All TP/SL levels are calculated using the filtered base range and multipliers.
Cooldown logic ensures signals are not spammed bar-to-bar.
Entries are visualized with colored lines and labeled levels.
This feature is ideal for traders who want automated risk and reward reference points for range breakout plays.
█ How to Use
⚪ Breakout Traders
Use the SL/TP signals when the price breaks above or below the range bands, especially after extended sideways movement. You can customize how far TP1, TP2, and TP3 sit from the entry using your own risk/reward profile.
⚪ Mean Reversion Traders
Use the bands to locate high-probability reversion zones. These serve as reference zones for scalping or fade entries within stable consolidation phases.
█ Settings
Range Detection Method – Choose between ADX or Volatility compression to define range criteria.
Range Period – Determines how many bars are used to compute trend/volatility.
Range Multiplier – Scales the width of the consolidation zone.
SL/TP System – Optional levels that project TP1/TP2/TP3 and SL from the base price using multipliers.
Cooldown – Prevents repeated SL/TP signals from triggering too frequently.
ADX Threshold & Smoothing – Adjusts sensitivity of trend strength detection.
StdDev / Variance / ATR Multipliers – Fine-tune compression detection logic.
-----------------
Disclaimer
The content provided in my scripts, indicators, ideas, algorithms, and systems is for educational and informational purposes only. It does not constitute financial advice, investment recommendations, or a solicitation to buy or sell any financial instruments. I will not accept liability for any loss or damage, including without limitation any loss of profit, which may arise directly or indirectly from the use of or reliance on such information.
All investments involve risk, and the past performance of a security, industry, sector, market, financial product, trading strategy, backtest, or individual's trading does not guarantee future results or returns. Investors are fully responsible for any investment decisions they make. Such decisions should be based solely on an evaluation of their financial circumstances, investment objectives, risk tolerance, and liquidity needs.

Moving Volume-Weighted Avg Price, % Channel, BBsThis script includes:
- Moving Volume-Weighted Average Price line.
- User-defined % band above and below, very useful for "breakout" signals, and mentally adjusting to the magnitude of price swings when viewing an automatic scale on the price axis.
- Volume-Weighted Bollinger Bands, which are more sensitive to volume.
More detail:
- This is like TV's basic VWAP in concept, except the major flaw in that is that it has reset periods that you can't override, and the volume is cumulative until the next hard reset. The 'reset' is OK for securities trading, that resets every day anyway. But not for crypto - and not if/when securities trading goes 24/7. Also, the denominator accumulating over the entire period is also *not* OK, because then what is shown means something different as the day progresses - which kind of makes it useless. In other words, it starts out very sensitive to volume, and gets progressively more numb to it as they day progresses, and starts flattening out.
- This fixes both problems, by using a user-definable moving window for the average. Essentially combining SMA with volume-weighting.
- You may also find an invaluable trading aid, in the % bands above and below.
- What can optionally be shown is standard deviation bands, aka Bollinger bands. The advantage over regular BB is that it's volume-weighted. Since it is already calculated on a moving average, the period for the standard deviation has been shortened by default, and the magnitude increased, to better approximate regular Bollinger Bands - but it's still more responsive to volume.

RSI+ (Satori)Short Title: RSI+ (Satori)
Overview
The RSI HistoAlert Strategy with Bands is an advanced RSI-based indicator designed to provide a visual representation of RSI movements, highlighting overbought and oversold conditions
Key Features
✅ RSI Histogram Representation – Converts RSI values i
✅ Dynamic Bands – Uses a Fibonacci-based multiplier to generate upper and lower bands, helping traders recognize extreme price movements.
✅ **CustomizableCustomizable Alerts – Traders can set buy and sell alert levels to receive visual cues for potential trade entries.
✅ Adaptive Bar Coloring – T
How It Works
The RSI calculation is modified using a customizable period and scaling factor.
Standard deviation bands are computed using an SMA (Simple Moving Average) to create u
The histogram color changes based on RSI crossing predefined alert levels:
🔴 Red bars indicate bearish conditions.
🟢 Green bars indicate bullish cond
🔵 Neutral bars represent indecision.
The bar color of the main chart also adapts to the RSI signal, helping traders spot potential trend shifts.
Customization Options
RSI Period – Adjust the RSI calculation length.
Band Length – Configure the period use
Deviation Multiplier – Set the sensitivity of the bands with a Fi
Buy & Sell Alert Levels – Define thresholds for oversold and overbought zones.
RSI Histogram Modifier – Adjust the scaling o
Use Cases
📊 Trend Confirmation – Use i
🚀 Reversal Detection – Identify potential reversals when RSI crosses extr
📉 Divergence Analysis – Spot divergence between price act
Final Notes
This indicator is ideal for traders looking for an enhanced RSI visualization tool with custom alerts and adaptive bands. It canscalping, swing trading, and long-term investing.

Adaptive Fourier Transform Supertrend [QuantAlgo]Discover a brand new way to analyze trend with Adaptive Fourier Transform Supertrend by QuantAlgo , an innovative technical indicator that combines the power of Fourier analysis with dynamic Supertrend methodology. In essence, it utilizes the frequency domain mathematics and the adaptive volatility control technique to transform complex wave patterns into clear and high probability signals—ideal for both sophisticated traders seeking mathematical precision and investors who appreciate robust trend confirmation!
🟢 Core Architecture
At its core, this indicator employs an adaptive Fourier Transform framework with dynamic volatility-controlled Supertrend bands. It utilizes multiple harmonic components that let you fine-tune how market frequencies influence trend detection. By combining wave analysis with adaptive volatility bands, the indicator creates a sophisticated yet clear framework for trend identification that dynamically adjusts to changing market conditions.
🟢 Technical Foundation
The indicator builds on three innovative components:
Fourier Wave Analysis: Decomposes price action into primary and harmonic components for precise trend detection
Adaptive Volatility Control: Dynamically adjusts Supertrend bands using combined ATR and standard deviation
Harmonic Integration: Merges multiple frequency components with decreasing weights for comprehensive trend analysis
🟢 Key Features & Signals
The Adaptive Fourier Transform Supertrend transforms complex wave calculations into clear visual signals with:
Dynamic trend bands that adapt to market volatility
Sophisticated cloud-fill visualization system
Strategic L/S markers at key trend reversals
Customizable bar coloring based on trend direction
Comprehensive alert system for trend shifts
🟢 Practical Usage Tips
Here's how you can get the most out of the Adaptive Fourier Transform Supertrend :
1/ Setup:
Add the indicator to your favorites, then apply it to your chart ⭐️
Start with close price as your base source
Use standard Fourier period (14) for balanced wave detection
Begin with default harmonic weight (0.5) for balanced sensitivity
Start with standard Supertrend multiplier (2.0) for reliable band width
2/ Signal Interpretation:
Monitor trend band crossovers for potential signals
Watch for convergence of price with Fourier trend
Use L/S markers for trade entry points
Monitor bar colors for trend confirmation
Configure alerts for significant trend reversals
🟢 Pro Tips
Fine-tune Fourier parameters for optimal sensitivity:
→ Lower Base Period (8-12) for more reactive analysis
→ Higher Base Period (15-30) to filter out noise
→ Adjust Harmonic Weight (0.3-0.7) to control shorter trend influence
Customize Supertrend settings:
→ Lower multiplier (1.5-2.0) for tighter bands
→ Higher multiplier (2.0-3.0) for wider bands
→ Adjust ATR length based on market volatility
Strategy Enhancement:
→ Compare signals across multiple timeframes
→ Combine with volume analysis
→ Use with support/resistance levels
→ Integrate with other momentum indicators

SufinBDThis TradingView script combines RSI, Stochastic RSI, MACD, and Bollinger Bands to generate Buy and Sell signals on two different timeframes: 4-hour (4H) and Daily (1D). The strategy aims to provide entry and exit points based on a multi-indicator confirmation approach, helping traders make more informed decisions.
Features:
RSI (Relative Strength Index):
Measures the speed and change of price movements.
The script looks for oversold conditions (RSI below 30) for buy signals and overbought conditions (RSI above 70) for sell signals.
Stochastic RSI:
Measures the level of RSI relative to its high-low range over a given period.
A Stochastic RSI below 0.2 indicates oversold conditions, and a value above 0.8 indicates overbought conditions.
It helps identify overbought and oversold conditions in a more precise manner than regular RSI.
MACD (Moving Average Convergence Divergence):
A trend-following momentum indicator that shows the relationship between two moving averages of a security's price.
The MACD line crossing above the Signal line generates bullish signals, and vice versa for bearish signals.
Bollinger Bands:
A volatility indicator that consists of a middle band (SMA of price), an upper band, and a lower band.
When the price is below the lower band, it signals potential buy opportunities, while prices above the upper band signal potential sell opportunities.
Timeframe Usage:
The script calculates indicators for both the 4-hour (4H) and Daily (1D) timeframes.
The combined signals from these two timeframes are used to generate Buy and Sell alerts.
Buy Signal:
A Buy signal is generated when all of the following conditions are met:
RSI on both 4H and 1D is below 30 (oversold conditions).
Stochastic RSI on both timeframes is below 0.2.
The MACD line is above the Signal line on both timeframes.
The price is below the lower Bollinger Band on both the 4H and 1D charts.
Sell Signal:
A Sell signal is generated when all of the following conditions are met:
RSI on both 4H and 1D is above 70 (overbought conditions).
Stochastic RSI on both timeframes is above 0.8.
The MACD line is below the Signal line on both timeframes.
The price is above the upper Bollinger Band on both the 4H and 1D charts.
Visuals:
Buy signals are marked with green labels below the bars.
Sell signals are marked with red labels above the bars.
Bollinger Bands are displayed on the chart with the upper and lower bands marked in blue (for 4H) and orange (for 1D).
Purpose:
This script aims to provide more reliable buy/sell signals by combining indicators across multiple timeframes. It is ideal for traders who want to use multiple confirmation points before entering or exiting a trade.
How to Use:
Apply the script to any chart on TradingView.
Look for Buy and Sell signals that meet the conditions above.
You can adjust the timeframe (e.g., 4H or 1D) based on your trading strategy.
This script can be used for intraday trading, swing trading, or position trading depending on your preferred timeframes.
Example of Signal Interpretation:
Buy Signal:
If all conditions are met (e.g., RSI is under 30, Stochastic RSI is under 0.2, MACD is bullish, and price is below the lower Bollinger Band on both the 4-hour and daily charts), the script will show a green "BUY" label below the price bar.
Sell Signal:
If all conditions are met (e.g., RSI is over 70, Stochastic RSI is over 0.8, MACD is bearish, and price is above the upper Bollinger Band on both timeframes), the script will show a red "SELL" label above the price bar.
This combination of indicators offers a multi-layered confirmation approach, which aims to reduce the risk of false signals and increase the reliability of your trading decisions.
