AI Adaptive Supertrend ChannelAI Supertrend Channel – The Adaptive Trend System
Beyond Basic Supertrend: An Intelligent Trading Framework
The AI Adaptive Supertrend Channel transcends traditional trend following indicators by delivering a self-optimizing trading system. Its core innovation is a triple-adaptive engine that automatically adjusts channel width based on real-time market conditions:
Market Efficiency Detection – Widens during clean trends, tightens in choppy ranges
Normalized Volatility – Scales appropriately to any asset's price level
Dynamic Momentum Response – Expands aggressively during powerful directional moves
The Result: A smarter tool that reduces false signals in consolidation while giving trends ample room to run—eliminating the constant parameter tweaking required by static indicators.
Visual Signal Framework & Strategic Applications
Channel Architecture:
Primary Trend Line (Thick Green/Red): Your dynamic trailing stop and core trend indicator. Green signals an uptrend (buying bias), Red signals a downtrend (selling bias).
Upper & Lower Bands: Form a dynamic support/resistance channel around the trend.
Mid-Line: A critical mean reversion level and the trigger for key early signals.
Trading Signals & Strategic Meaning:
Primary Signal: Momentum Diamonds (High Conviction)
💎 Green Diamond (Higher High): Price closes above the Upper Band after making a new high. Signals strong bullish momentum continuation. Ideal for adding to long positions or entering new longs in an established uptrend.
💎 Red Diamond (Lower Low): Price closes below the Lower Band after making a new low. Signals strong bearish momentum continuation. Ideal for adding to short positions or entering new shorts in a downtrend.
Secondary Signal: Mid-Line Crosses (Early Action)
🔼 Green Triangle (Bullish Mid-Line Cross - bullMidCross): Price crosses above the Mid-Line. This is an early bullish pullback signal within a larger uptrend or a potential early reversal sign in a downtrend. Use for early entries or to confirm the end of a bearish pullback.
🔽 Red Triangle (Bearish Mid-Line Cross - bearMidCross): Price crosses below the Mid-Line. This is an early bearish pullback signal within a larger downtrend or a potential early warning of weakness in an uptrend. Use for early short entries or to take profits on longs.
Practical Trading Strategies
Trend Following: Align trades with the Primary Trend Line color. Use the line itself as a dynamic stop-loss. The Momentum Diamonds confirm the trend's strength.
Pullback Trading: Use the Mid-Line Cross triangles (bullMidCross/bearMidCross) to identify high-probability entries during trend retracements. The channel bands provide natural profit targets.
Breakout Confirmation: A Momentum Diamond following a period of consolidation often confirms a genuine breakout, offering a signal to enter with the new momentum.
Optimal Settings Guide
Default (Universal)
For most markets, timeframes
ATR: 13 | ER: 144 | Channel Width: 0.7
Volatility Factor: 100 | Vol MA: HMA | Trend MA: EMA
Day Trading (Fast, Responsive)
*15M-1H charts, scalping*
ATR: 8 | ER: 89 | Channel Width: 0.6
Volatility Factor: 120 | Vol MA: EMA | Trend MA: WMA
*Swing Trading (Smooth, Conservative)*
*Daily-Weekly, position trading*
ATR: 21 | ER: 200 | Channel Width: 0.9
Volatility Factor: 80 | Vol MA: HMA | Trend MA: LINREG
Channel Width × Factor
0.5-0.7 → Tighter (more signals, less room)
0.8-1.2 → Wider (fewer signals, more room to run)
Volatility Regime Factor
50-80 → Less sensitive to volatility (stable markets)
100-150 → More sensitive (volatile markets like crypto)
Base ATR Length
8-13 → Faster signals (lower timeframes)
17-21 → Smoother signals (higher timeframes)
Quick Adjustments:
Whipsaws → Increase Channel Width × Factor
Lagging → Decrease ATR Length
Volatile markets → Increase Volatility Regime Factor
Start with Default, adjust one parameter at a time based on your market and trading style.
Search in scripts for "bands"

Trend Drawing + OB Signal (MTF) [ASCII]Script Description: Advanced Multi-Timeframe Trend Lines & OB/OS Signal
Overview
This advanced Pine Script indicator is designed to identify and project key support and resistance levels using pivot-based trend lines across multiple timeframes. It combines this powerful trend analysis with a sophisticated Overbought/Oversold (OB/OS) detection system using CCI and Bollinger Bands, providing clear trading signals with integrated alert functionality.
Key Features
1. Multi-Timeframe Trend Lines
Automated Pivot Detection: Automatically identifies significant swing highs and lows based on user-defined left/right bar parameters
Smart Timeframe Adaptation: Uses different sensitivity settings for each timeframe (15min to 1Week) for optimal pivot detection
Dynamic Line Projection: Draws trend lines connecting the two most recent pivots and extends them forward
Flexible Source Selection: Choose between Close price, Wick extremes, or Auto mode (Auto uses Wick for higher timeframes, Close for lower timeframes)
2. Advanced OB/OS Detection System
Dual Indicator Confirmation: Combines CCI momentum and Bollinger Band position for reliable signals
Customizable Parameters: Adjustable CCI length, OB/OS thresholds, and Bollinger Band settings
Bar Confirmation Option: Optional wait-for-close confirmation to avoid false signals
Visual Markers: Clear triangle markers above/below bars for quick signal identification
3. Timeframe Support
Available Timeframes: 15min, 30min, 1h, 2h, 4h, 8h, 12h, 1D, 1W
Independent Settings: Custom left/right bar parameters for each timeframe
Automatic Adaptation: Script automatically applies the correct settings for your current chart timeframe
Input Parameters
Trend Lines Configuration
Left/Right Bars: Defines the pivot detection sensitivity for each timeframe
Line Length: Controls how far trend lines extend into the future
Line Source: Choose between Close, Wick, or Auto selection
Colors: Customizable support/resistance line colors
OB/OS Signal Settings
CCI Parameters: Length and OB/OS thresholds
Bollinger Bands: Length and multiplier for band width
Plot Options: Toggle OB markers and bar confirmation
Signal Logic
OB UP Signal (Short Bias)
Conditions: CCI ≥ OB threshold AND Close ≥ Upper Bollinger Band
Marker: Red triangle down above bar
Alert Direction: SHORT
OB DOWN Signal (Long Bias)
Conditions: CCI ≤ OS threshold AND Close ≤ Lower Bollinger Band
Marker: Green triangle up below bar
Alert Direction: LONG
Alert System
The script includes pre-formatted JSON alerts for external integration:
Structured data format with symbol, timeframe, direction, and signal type
Secret key for authentication (replace "MY_SECRET" with your actual key)
Compatible with webhook services and custom alert handlers
Usage Tips
Timeframe Selection: Use higher timeframes (4H-Daily) for major levels, lower timeframes for precise entries
Parameter Tuning: Adjust left/right bars based on market volatility - increase for smoother trends, decrease for more reactive lines
Confirmation: Combine trend line breaks with OB/OS signals for high-probability setups
Risk Management: Always use proper stop losses - trend lines indicate potential areas, not guaranteed reversals
Technical Notes
Built with Pine Script v6
Maximum 200 lines/labels to maintain performance
Works on all asset types (forex, stocks, crypto)
Optimized for real-time and historical analysis
This script provides institutional-grade trend analysis with retail-friendly signals, making complex multi-timeframe analysis accessible to traders of all experience levels.
This description covers all the technical aspects while being accessible for users.

Ben's BTC Macro Fair Value OscillatorBen's BTC Macro Fair Value Oscillator
Overview
The **BTC Macro Fair Value Oscillator** is a non-crypto fair value framework that uses macro asset relationships (equities, dollar, gold) to estimate Bitcoin's "macro-driven fair value" and identify mean-reversion opportunities.
"Is BTC cheap or expensive right now?" on the 4 Hour Timeframe ONLY
### Key Features
✅ **Macro-driven**: Uses QQQ, DXY, XAUUSD instead of on-chain or crypto metrics
✅ **Dynamic weighting**: Assets weighted by rolling correlation strength
✅ **Mean-reversion signals**: Identifies when BTC is cheap/expensive vs macro
✅ **Validated parameters**: Optimized through 5-year backtest (Sharpe 6.7-9.9)
✅ **Visual transparency**: Live correlation panel, fair value bands, statistics
✅ **Non-repainting**: All calculations use confirmed historical data only
### What This Indicator Does
- Builds a **synthetic macro composite** from traditional assets
- Runs a **rolling regression** to predict BTC price from macro
- Calculates **deviation z-score** (how far BTC is from macro fair value)
- Generates **entry signals** when BTC is extremely cheap vs macro (dev < -2)
- Generates **exit signals** when BTC returns to fair value (dev > 0)
### What This Indicator Is NOT
❌ Not a high-frequency trading system (sparse signals by design)
❌ Not optimized for absolute returns (optimized for Sharpe ratio)
❌ Not suitable as standalone trading system (best as overlay/confirmation)
❌ Not predictive of short-term price movements (mean-reversion timeframe: days to weeks)
---
## Core Concept
### The Premise
Bitcoin doesn't trade in a vacuum. It's influenced by:
- **Risk appetite** (equities: QQQ, SPX)
- **Dollar strength** (DXY - inverse to risk assets)
- **Safe haven flows** (Gold: XAUUSD)
When macro conditions are "good for BTC" (risk-on, weak dollar, strong equities), BTC should trade higher. When macro conditions turn against it, BTC should trade lower.
### The Innovation
Instead of looking at BTC in isolation, this indicator:
1. **Measures how strongly** BTC currently correlates with each macro asset
2. **Builds a weighted composite** of those macro returns (the "D" driver)
3. **Regresses BTC price on D** to estimate "macro fair value"
4. **Tracks the deviation** between actual price and fair value
5. **Signals mean reversion** when deviation becomes extreme
### The Edge
The validated edge comes from:
- **Extreme deviations predict future returns** (dev < -2 → +1.67% over 12 bars)
- **Monotonic relationship** (more negative dev → higher forward returns)
- **Works out-of-sample** (test Sharpe +83-87% better than training)
- **Low correlation with buy & hold** (provides diversification value)
---
## Methodology
### Step 1: Macro Composite Driver D(t)
The indicator builds a weighted composite of macro asset returns:
**Process:**
1. Calculate **log returns** for BTC and each macro reference (QQQ, DXY, XAUUSD)
2. Compute **rolling correlation** between BTC and each reference over `corrLen` bars
3. **Weight each asset** by `|correlation|` if above `minCorrAbs` threshold, else 0
4. **Sign-adjust** weights (+1 for positive corr, -1 for negative) to handle inverse relationships
5. **Z-score normalize** each reference's returns over `fvWindow`
6. **Composite D(t)** = weighted sum of sign-adjusted z-scores
**Formula:**
```
For each reference i:
corr_i = correlation(BTC_returns, ref_i_returns, corrLen)
weight_i = |corr_i| if |corr_i| >= minCorrAbs else 0
sign_i = +1 if corr_i >= 0 else -1
z_i = (ref_i_returns - mean) / std
contrib_i = sign_i * z_i * weight_i
D(t) = sum(contrib_i) / sum(weight_i)
```
**Key Insight:** D(t) represents "how good macro conditions are for BTC right now" in a normalized, correlation-weighted way.
---
### Step 2: Fair Value Regression
Uses rolling linear regression to predict BTC price from D(t):
**Model:**
```
BTC_price(t) = α + β * D(t)
```
**Calculation (Pine Script approach):**
```
corr_CD = correlation(BTC_price, D, fvWindow)
sd_price = stdev(BTC_price, fvWindow)
sd_D = stdev(D, fvWindow)
cov = corr_CD * sd_price * sd_D
var_D = variance(D, fvWindow)
β = cov / var_D
α = mean(BTC_price) - β * mean(D)
fair_value(t) = α + β * D(t)
```
**Result:** A time-varying "macro fair value" line that adapts as correlations change.
---
### Step 3: Deviation Oscillator
Measures how far BTC price has deviated from fair value:
**Calculation:**
```
residual(t) = BTC_price(t) - fair_value(t)
residual_std = stdev(residual, normWindow)
deviation(t) = residual(t) / residual_std
```
**Interpretation:**
- `dev = 0` → BTC at fair value
- `dev = -2` → BTC is 2 standard deviations **cheap** vs macro
- `dev = +2` → BTC is 2 standard deviations **rich** vs macro
---
### Step 4: Signal Generation
**Long Entry:** `dev` crosses below `-2.0` (BTC extremely cheap vs macro)
**Long Exit:** `dev` crosses above `0.0` (BTC returns to fair value)
**No shorting** in default config (risk management choice - crypto volatility)
---
## How It Works
### Visual Components
#### 1. Price Chart (Main Panel)
**Fair Value Line (Orange):**
- The estimated "macro-driven fair value" for BTC
- Calculated from rolling regression on macro composite
**Fair Value Bands:**
- **±1σ** (light): 68% confidence zone
- **±2σ** (medium): 95% confidence zone
- **±3σ** (dark, dots): 99.7% confidence zone
**Entry/Exit Markers:**
- **Green "LONG" label** below bar: Entry signal (dev < -2)
- **Red "EXIT" label** above bar: Exit signal (dev > 0)
#### 2. Deviation Oscillator (Separate Pane)
**Line plot:**
- Shows current deviation z-score
- **Green** when dev < -2 (cheap)
- **Red** when dev > +2 (rich)
- **Gray** when neutral
**Histogram:**
- Visual representation of deviation magnitude
- Green bars = negative deviation (cheap)
- Red bars = positive deviation (rich)
**Threshold lines:**
- **Green dashed at -2.0**: Entry threshold
- **Red dashed at 0.0**: Exit threshold
- **Gray solid at 0**: Fair value line
#### 3. Correlation Panel (Top-Right)
Shows live correlation and weighting for each macro asset:
| Asset | Corr | Weight |
|-------|------|--------|
| QQQ | +0.45 | 0.45 |
| DXY | -0.32 | 0.32 |
| XAUUSD | +0.15 | 0.00 |
| Avg \|Corr\| | 0.31 | 0.77 |
**Reading:**
- **Corr**: Current rolling correlation with BTC (-1 to +1)
- **Weight**: How much this asset contributes to fair value (0 = excluded)
- **Avg |Corr|**: Average correlation strength (should be > 0.2 for reliable signals)
**Colors:**
- Green/Red corr = positive/negative correlation
- White weight = asset included, Gray = excluded (below minCorrAbs)
#### 4. Statistics Label (Bottom-Right)
```
━━━ BTC Macro FV ━━━
Dev: -2.34
Price: $103,192
FV: $110,500
Status: CHEAP ⬇
β: 103.52
```
**Fields:**
- **Dev**: Current deviation z-score
- **Price**: Current BTC close price
- **FV**: Current macro fair value estimate
- **Status**: CHEAP (< -2), RICH (> +2), or FAIR
- **β**: Current regression beta (sensitivity to macro)
---
## Installation & Setup
### TradingView Setup
1. Open TradingView and navigate to any **BTC chart** (BTCUSD, BTCUSDT, etc.)
2. Open **Pine Editor** (bottom panel)
3. Click **"+ New"** → **"Blank indicator"**
4. **Delete** all default code
5. **Copy** the entire Pine Script from `GHPT_optimized.pine`
6. **Paste** into the editor
7. Click **"Save"** and name it "BTC Macro Fair Value Oscillator"
8. Click **"Add to Chart"**
### Recommended Chart Settings
**Timeframe:** 4h (validated timeframe)
**Chart Type:** Candlestick or Heikin Ashi
**Overlay:** Yes (indicator plots on price chart + separate pane)
**Alternative Timeframes:**
- Daily: Works but slower signals
- 1h-2h: May work but not validated
- < 1h: Not recommended (too noisy)
### Symbol Requirements
**Primary:** BTC/USD or BTC/USDT on any exchange
**Macro References:** Automatically fetched
- QQQ (Nasdaq 100 ETF)
- DXY (US Dollar Index)
- XAUUSD (Gold spot)
**Data Requirements:**
- At least **90 bars** of history (warmup period)
- Premium TradingView recommended for full historical data
---
## Reading the Indicator
### Identifying Signals
#### Strong Long Signal (High Conviction)
- ✅ Deviation < -2.0 (extreme undervaluation)
- ✅ Avg |Corr| > 0.3 (strong macro relationships)
- ✅ Price touching or below -2σ band
- ✅ "LONG" label appears below bar
**Interpretation:** BTC is extremely cheap relative to macro conditions. Historical data shows +1.67% average return over next 12 bars (48 hours at 4h timeframe).
#### Moderate Long Signal (Lower Conviction)
- ⚠️ Deviation between -1.5 and -2.0
- ⚠️ Avg |Corr| between 0.2-0.3
- ⚠️ Price approaching -2σ band
**Interpretation:** BTC is cheap but not extreme. Consider as confirmation for other signals.
#### Exit Signal
- 🔴 Deviation crosses above 0 (returns to fair value)
- 🔴 "EXIT" label appears above bar
**Interpretation:** Mean reversion complete. Close long positions.
#### Strong Short/Avoid Signal
- 🔴 Deviation > +2.0 (extreme overvaluation)
- 🔴 Avg |Corr| > 0.3
- 🔴 Price touching or above +2σ band
**Interpretation:** BTC is expensive vs macro. Historical data shows -1.79% average return over next 12 bars. Consider exiting longs or reducing exposure.
### Regime Detection
**Strong Regime (Reliable Signals):**
- Avg |Corr| > 0.3
- Multiple assets weighted > 0
- Fair value line tracking price reasonably well
**Weak Regime (Unreliable Signals):**
- Avg |Corr| < 0.2
- Most weights = 0 (grayed out)
- Fair value line diverging wildly from price
- **Action:** Ignore signals until correlations strengthen

KAB 1.2 Beta🚀 KAB 1.2 Indicator by Lastkingkoby 📈
Unlock the power of smart trading with KAB 1 – your ultimate all-in-one tool for spotting 🔑 support/resistance levels and generating 💰 gold-standard buy/sell signals! Crafted by Koby A. Brown (@Lastkingkoby), this Pine Script v5 indicator overlays directly on your charts for seamless analysis. Perfect for traders hunting for high-probability setups in volatile markets! 🌟
🔰 Key Features:
Dynamic Support & Resistance Lines 🛡️⚔️:
Automatically draws robust S/R lines using a blend of RSI, CMO (based on HMA), and pivot calculations. Watch lines evolve in real-time – they break on breaches 🚧, count bounces 🔄, and even flip roles (e.g., support turns resistance) when conditions change! Customizable timeframe for multi-TF precision. Labels show "Support Line" or "Flipped Res" with color-coded vibes (green for support 💚, orange for resistance 🟠).
Gold Prediction & Signals 🔮💹:
Powered by a sophisticated range filter with smoothed averages and multipliers, it detects trends with upward/downward counters. Get clear bar colors: lime for strong buys 🟢, red for sells 🔴, and more! Signals include:
Buy/Long 💸: Bullish conditions with SL suggestions based on lower bands.
Sell/Short 🐻: Bearish triggers with SL from upper bands.
Warning Alerts ⚠️: Spots potential failed bounces (e.g., "Short Warn" or "Long Warn") to avoid traps – ideal for risk management!
Visuals & Alerts 📊🚨:
Enjoy colorful plots: filter line in green/red/orange 🎨, high/low bands in aqua/fuchsia with translucent fills 🌈. Bar colors highlight momentum shifts. Set up alerts for new S/R lines, buys, sells, and warnings – never miss a move!
📝 How to Use:
Add to your chart and tweak inputs like S/R Timeframe, Gold Period (default 100), or Range Coeff (default 5.0) for your style.
Look for confluences: Buy near flipped support 💪, sell at resistance breakdowns 📉.
Combine with your strategy for crypto, forex, or stocks – it's overlay-friendly!
Pro Tip: Use on higher timeframes for major levels, lower for intraday scalps. Trade smart, stay profitable! 🤑📉
© Koby "Lastkingkoby" Brown – Elevate your game today! 🚀

_mr_beach Sunday Entwicklung Version 1_mr_beach Sunday Development Version 1
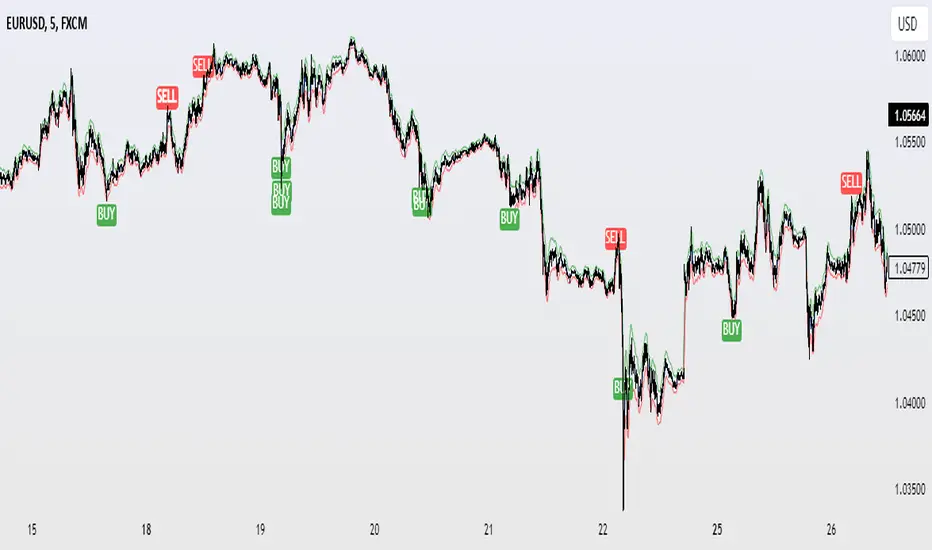
Short Description (for TradingView publication):
This indicator combines EMA crossovers, VWAP with standard deviation bands, gap detection, pivot-based support & resistance, and VWAP distance labels in a single overlay. Perfect for discretionary traders aiming to efficiently identify gap fills, trend reversals, and key price levels. All components can be toggled on/off via the settings menu.
Full Indicator Description:
🧠 Purpose of the Indicator:
This all-in-one tool merges several analytical features to visualize trend direction, market structure, key price levels (e.g., gaps, VWAP distance, pivot support), and entry signals at a glance.
🔧 Integrated Features:
EMA20 / EMA50: Trend detection via moving averages. Crossover signals indicate potential entries.
VWAP + Band: Volume-weighted average price with visual deviation bands.
GAP-Up / GAP-Down: Price gaps are highlighted in color (brown/yellow), optionally showing only open ones.
VWAP Distance Label: Displays the current price’s percentage deviation from the VWAP as a chart label.
Buy/Sell Signals: Triggered by EMA20 and EMA50 crossovers.
HH/LL SL-Marker: Identifies local highs/lows using pivots.
Support & Resistance: Automatically calculated pivot zones.
Customizable Visibility: All features can be toggled in the settings menu.
Dummy Plot: plot(na) ensures error-free compilation.
⚙️ Settings Menu Options:
Show VWAP: Displays VWAP and deviation bands.
Show EMA20 / EMA50: Shows the moving averages.
Show Gaps: Enables gap detection.
Show Only Open Gaps: Hides already filled gaps.
Show VWAP Distance: Activates VWAP deviation label.
Support & Resistance: Displays pivot-based zones as support/resistance.
🔔 Alerts:
‘Mads Morningstar Signal’: Buy/Sell alerts based on EMA crossover.
📈 Use Cases:
Trend-following setups using EMA crossover
Gap-fill trading strategies
VWAP reversion trades
SL/TP based on HH/LL or pivot levels
Visual chart preparation for scalping, intraday, or swing trading
🛠 Suggested Extensions:
Gap table showing open levels
Take-Profit/Stop-Loss strategy
Alerts for new gap formation
Strategy tester module with gap-based entries

Custom Strategy Builder Raad V1This indicator is an advanced trading strategy builder that combines multiple technical indicators and analysis tools into a single script. Below is a simplified breakdown of its key components and functionalities.
Key Features & Components
1. Core Indicators
Moving Averages (EMA, SMA, WMA, HMA, VWMA) – Multiple types with customizable lengths.
Range Filter – A volatility-based trend filter.
SuperTrend – A trend-following indicator using ATR.
Half Trend – Another trend-following indicator.
Ichimoku Cloud – A comprehensive trend and support/resistance system.
2. Trend Indicators
Bollinger Bands – Volatility-based price channels.
MACD – Moving Average Convergence Divergence for momentum.
Parabolic SAR – A trailing stop indicator for trend direction.
Donchian Channel – Identifies breakout levels based on recent highs/lows.
3. Momentum Indicators
RSI (Relative Strength Index) – Measures overbought/oversold conditions.
Stochastic Oscillator – Another momentum indicator for reversals.
CCI (Commodity Channel Index) – Detects cyclical trends.
Awesome Oscillator (AO) – A histogram-based momentum tool.
4. Additional Analysis Tools
Fibonacci Retracement – Key support/resistance levels based on Fibonacci ratios.
Pivot Points – Calculates intraday support/resistance levels.
Supply/Demand Zones – Highlights key accumulation/distribution areas.
Volume Analysis – Includes VWAP and volume-based signals.
5. Dashboard & Customization
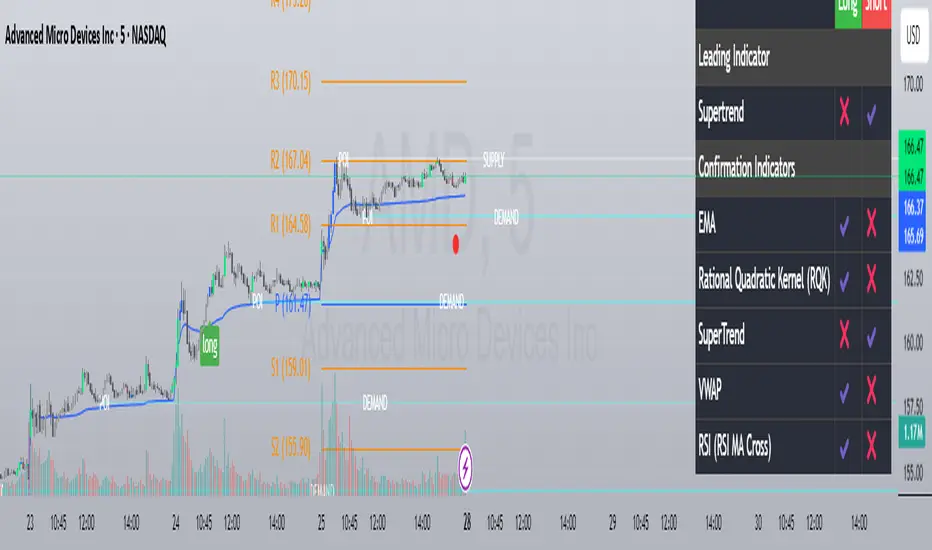
Switch Board – Enables/disables indicators on the chart.
Signal Filters – Adjusts confirmation rules for entries/exits.
Visual Customization – Change colors, line styles, and sizes.
How It Works
Leading Indicator – The primary signal generator (e.g., Range Filter, RSI, MACD).
Confirmation Indicators – Additional filters to validate signals (e.g., EMA cross, volume, trend strength).
Signal Expiry – Defines how long a signal remains valid before resetting.
Dashboard Display – Shows active signals and market conditions.
Best Use Cases
✅ Multi-Indicator Strategies – Combines multiple signals into one system.
✅ Trend & Momentum Trading – Works well for swing and intraday trading.
✅ Customizable Alerts – Can trigger buy/sell signals based on user-defined rules.
This indicator is ideal for traders who want a fully customizable and multi-strategy approach without manually overlaying multiple indicators.
هذا المؤشر هو أداة متقدمة لبناء استراتيجيات التداول تحتوي على مجموعة كبيرة من المؤشرات الفنية وأدوات التحليل. إليك شرح مبسط لمكوناته الرئيسية:
المكونات الرئيسية:
1. المؤشرات الأساسية:
المتوسطات المتحركة (EMA, SMA, WMA, HMA, VWMA): تسمح باختيار أنواع مختلفة من المتوسطات المتحركة بأطوال مختلفة.
Range Filter: مرشح يعتمد على مدى السعر لتحديد الاتجاه.
SuperTrend: مؤشر اتجاهي يعتمد على ATR.
Half Trend: مؤشر اتجاهي آخر.
Ichimoku Cloud: نظام إيشيموكو الكلاسيكي.
2. مؤشرات الاتجاه:
Bollinger Bands: نطاقات بولينجر.
MACD: مؤشر تقارب وتباعد المتوسطات المتحركة.
Parabolic SAR: مؤشر SAR القطعي المكافئ.
Donchian Channel: قناة دونشيان لتحديد القمم والقيعان.
3. مؤشرات الزخم:
RSI: مؤشر القوة النسبية.
Stochastic: مؤشر ستوكاستيك.
CCI: مؤشر قناة السلع.
Awesome Oscillator: مؤشر الزخم.
4. أدوات التحليل الأخرى:
Fibonacci Retracement: مستويات فيبوناتشي للتصحيح.
Pivot Points: نقاط محورية.
Supply/Demand Zones: مناطق العرض والطلب.
Volume Analysis: تحليل الحجم.
5. لوحة التحكم:
تسمح بتفعيل/تعطيل المؤشرات المختلفة.
تخصيص ألوان وعرض الخطوط.
ضبط معايير الإشارات.
طريقة العمل:
يحدد المؤشر إشارات شراء/بيع بناءً على تقاطعات المؤشرات المختلفة.
يمكن استخدام مؤشر رئيسي (Leading Indicator) مع مؤشرات تأكيد (Confirmation Indicators).
يوفر خيارات لتخصيص فترة انتهاء صلاحية الإشارة وطريقة العرض.
الاستخدام:
للمتداولين المتقدمين الذين يرغبون في بناء استراتيجيات معقدة.
يمكن استخدامه للتحليل الفني متعدد الأطر الزمنية.
يوفر مرونة كبيرة في تخصيص المؤشرات حسب احتياجات المستخدم.
Multi-Volatility Adjusted Moving Average🎯 Core Concept
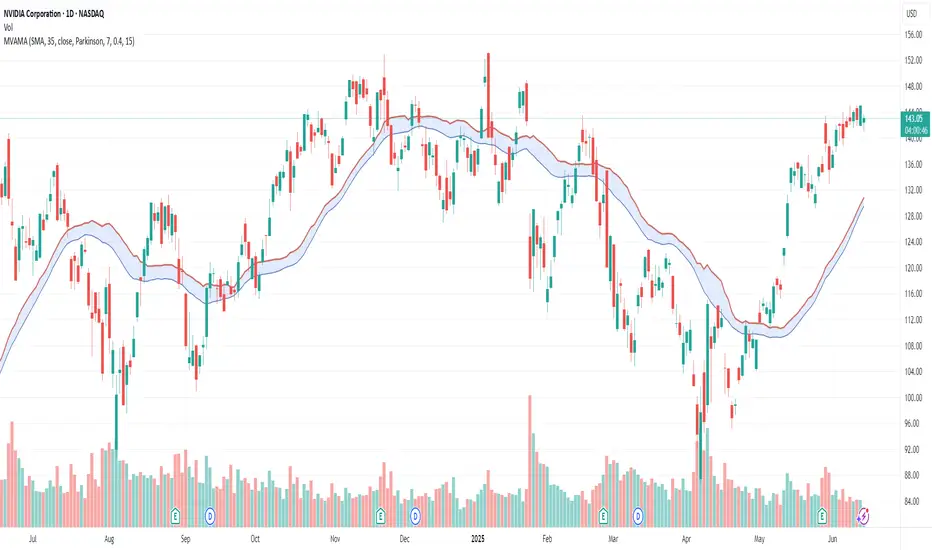
The Multi-Volatility Adjusted Moving Average (MVAMA) is an advanced technical indicator that creates an adaptive moving average with a built-in upward bias. Unlike traditional moving averages that simply follow price, this indicator adjusts upward based on market volatility, making it particularly useful for identifying dynamic resistance levels and trend strength.
🔧 How It Works
Key Principle: Upward Volatility Bias
Base Calculation: Starts with your chosen moving average (EMA, SMA, etc.)
Volatility Measurement: Calculates market volatility using one of 5 different methods
Upward Adjustment: Always adds volatility adjustment upward: Adaptive MA = Base MA + Volatility Adjustment
Dynamic Resistance: Creates a moving resistance level that adapts to market conditions
📊 5 Volatility Calculation Methods
1. Simple (High-Low Range)
Method: (High - Low) / Close × 100
Best For: Clean, straightforward volatility measurement
Use Case: General purpose, all market conditions
2. Parkinson (Range-Based Log Volatility)
Method: √(ln(High/Low)²) with safety bounds
Best For: Intraday volatility without using open/close gaps
Use Case: Choppy markets, day trading
3. ATR (Average True Range)
Method: Traditional ATR as percentage of price
Best For: Handling gaps and limit moves
Use Case: Swing trading, gap-prone markets
4. Standard Deviation (Statistical)
Method: Standard deviation of price returns
Best For: Academic/statistical approach
Use Case: Backtesting, quantitative analysis
5. Garman-Klass (OHLC Optimized)
Method: 0.5×ln(H/L)² - (2ln2-1)×ln(C/O)²
Best For: Most comprehensive volatility using all OHLC data
Use Case: Professional trading, maximum accuracy
🎛️ 12 Moving Average Types
Fast & Responsive:
HMA (Hull): Minimal lag, very responsive
DEMA/TEMA: Double/Triple exponential for speed
WMA: Weighted for recent price emphasis
Balanced:
EMA: Classic exponential (default)
ALMA: Arnaud Legoux for balanced response
LSMA: Linear regression trend following
Smooth & Stable:
SMA: Simple moving average
SMMA/RMA: Smoothed for noise reduction
TRIMA: Triangular for maximum smoothness
VWMA: Volume-weighted for market participation
💡 Practical Applications
Trading Uses:
Dynamic Resistance: Acts as adaptive resistance level
Trend Strength: Higher volatility = stronger adjustment = more significant level
Entry Timing: Price touching the adaptive MA can signal rejection points
Risk Management: Volatility bands show market uncertainty
Market Analysis:
Low Volatility: Adaptive MA stays close to base MA (consolidation)
High Volatility: Adaptive MA moves significantly above base MA (trending/breakout)
Trend Confirmation: Sustained distance between price and adaptive MA shows trend strength
⚙️ Key Features
Risk Management:
Volatility Capping: Prevents extreme adjustments (default 15% max)
Safety Bounds: All calculations protected against infinite/NaN values
Parameter Limits: Sensible ranges for all inputs
Visualization Options:
Base MA Display: Show underlying moving average
Volatility Bands: Visual representation of volatility adjustment
Custom Colors: Professional color schemes
Clean Interface: Organized input groups
Professional Features:
Multi-timeframe Support: Works on any timeframe
Alert Framework: Ready-to-enable price crossover alerts
🎯 Ideal For:
Traders Who Want:
Dynamic support/resistance levels
Volatility-aware trend analysis
Adaptive position sizing based on market conditions
Professional-grade technical analysis tools
Market Conditions:
Trending Markets: Volatility creates meaningful resistance levels
Volatile Markets: Adaptive adjustment handles changing conditions
All Timeframes: From scalping to position trading
🔍 Unique Advantages:
Always Upward Bias: Unlike oscillating indicators, always provides clear directional bias
Multi-Volatility Support: Choose the best volatility method for your market/style
Comprehensive MA Library: 12 different moving average types
Built-in Risk Management: Prevents extreme values that break other indicators
Professional Implementation: Publication-ready code with proper documentation
This script transforms traditional moving averages into intelligent, volatility-aware tools that adapt to market conditions while maintaining a consistent upward bias for clear directional guidance.
Q Momentum FlowQ Momentum Flow
A hybrid trend engine combining breakout-driven momentum shifts with adaptive volatility bands. Designed for traders who want clear entries, intelligent exits, and a balance between reactivity and noise control.
🔧 Core Features
1. Momentum Shift Detection
• Uses dynamic breakout levels (ATR-based) to identify impulse-driven price shifts.
• Filters weak moves by enforcing a cooldown period and direction alternation.
2. Adaptive Trend Framework
• Trend direction is derived from a dual-EMA anchor with dynamic volatility bands.
• Sensitivity automatically adjusts based on smoothed price deviation.
3. Entry & Exit System
• Buy and sell arrows appear on valid momentum + trend alignment.
• Exit markers signal early trend weakening before full reversal.
• Arrows and labels are visually separated to reduce chart clutter.
4. Alerts (Fully Integrated)
• Buy and Sell alerts on valid entry triggers.
• Separate alerts for early exits based on weakening trend conditions.
• Compatible with automation or notification setups.
⚙️ Configurable Inputs
• Trend Length — Controls how fast the adaptive bands react.
• Smoothing — Smooths volatility for more stable band generation.
• Sensitivity — Adjusts band width and breakout tolerance.
• Visual Settings — Customize background color, arrow styles, and label size.
• Exit Logic — Built-in reversal detection to signal when trend weakens.
📈 How to Use
• Follow Buy/Sell arrows for directional entries.
• Stay in trade until either:
— Opposite signal appears, or
— “Exit” label triggers based on adaptive trend weakening.
• Use background and bar colors for regime clarity.

Time Appliconic Macro | ForTF5m (Fixed)The Time Appliconic Macro (TAMcr) is a custom-built trading indicator designed for the 5-minute time frame (TF5m), providing traders with clear Buy and Sell signals based on precise technical conditions and specific time windows.
Key Features:
Dynamic Moving Average (MA):
The indicator utilizes a Simple Moving Average (SMA) to identify price trends.
Adjustable length for user customization.
Custom STARC Bands:
Upper and lower bands are calculated using the SMA and the Average True Range (ATR).
Includes a user-defined multiplier to adjust the band width for flexibility across different market conditions.
RSI Integration:
Signals are filtered using the Relative Strength Index (RSI), ensuring they align with overbought/oversold conditions.
Time-Based Signal Filtering:
Signals are generated only during specific time windows, allowing traders to focus on high-activity periods or times of personal preference.
Supports multiple custom time ranges with automatic adjustments for UTC-4 or UTC-5 offsets.
Clear Signal Visualization:
Buy Signals: Triggered when the price is below the lower band, RSI indicates oversold conditions, and the time is within the defined range.
Sell Signals: Triggered when the price is above the upper band, RSI indicates overbought conditions, and the time is within the defined range.
Signals are marked directly on the chart for easy identification.
Customizability:
Adjustable parameters for the Moving Average length, ATR length, and ATR multiplier.
Time zone selection and defined trading windows provide a tailored experience for global users.
Who is this Indicator For?
This indicator is perfect for intraday traders who operate in the 5-minute time frame and value clear, filtered signals based on price action, volatility, and momentum indicators. The time window functionality is ideal for traders focusing on specific market sessions or personal schedules.
How to Use:
Adjust the MA and ATR parameters to match your trading style or market conditions.
Set the desired time zone and time ranges to align with your preferred trading hours.
Monitor the chart for Buy (green) and Sell (red) signals, and use them as a guide for entering or exiting trades.
LRSI-TTM Squeeze - AynetThis Pine Script code creates an indicator called LRSI-TTM Squeeze , which combines two key concepts to analyze momentum, squeeze conditions, and price movements in the market:
Laguerre RSI (LaRSI): A modified version of RSI used to identify trend reversals in price movements.
TTM Squeeze: Identifies market compressions (low volatility) and potential breakouts from these squeezes.
Functionality and Workflow of the Code
1. Laguerre RSI (LaRSI)
Purpose:
Provides a smoother and less noisy version of RSI to track price movements.
Calculation:
The script uses a filtering coefficient (alpha) to process price data through four levels (L0, L1, L2, L3).
Movement differences between these levels calculate buying pressure (cu) and selling pressure (cd).
The ratio of these pressures forms the Laguerre RSI:
bash
Kodu kopyala
LaRSI = cu / (cu + cd)
The LaRSI value indicates:
Below 20: Oversold condition (potential buy signal).
Above 80: Overbought condition (potential sell signal).
2. TTM Squeeze
Purpose:
Analyzes the relationship between Bollinger Bands (BB) and Keltner Channels (KC) to determine whether the market is compressed (low volatility) or expanded (high volatility).
Calculation:
Bollinger Bands:
Calculated based on the moving average (SMA) of the price, with an upper and lower band.
Keltner Channels:
Created using the Average True Range (ATR) to calculate an upper and lower band.
Squeeze States:
Squeeze On: BB is within KC.
Squeeze Off: BB is outside KC.
Other States (No Squeeze): Neither of the above applies.
3. Momentum Calculation
Momentum is computed using the linear regression of the difference between the price and its SMA. This helps anticipate the direction and strength of price movements when the squeeze ends.
Visuals on the Chart
Laguerre RSI Line:
An RSI indicator scaled to 0-100 is plotted.
The line's color changes based on its movement:
Green line: RSI is rising.
Red line: RSI is falling.
Key levels:
20 level: Oversold condition (buy signal can be triggered).
80 level: Overbought condition (sell signal can be triggered).
Momentum Histogram:
Displays momentum as histogram bars with colors based on its direction and strength:
Lime (light green): Positive momentum increasing.
Green: Positive momentum decreasing.
Red: Negative momentum decreasing.
Maroon (dark red): Negative momentum increasing.
Squeeze Status Indicator:
A marker is plotted on the zero line to indicate the squeeze state:
Yellow: Squeeze On (compression active).
Blue: Squeeze Off (compression ended, movement expected).
Gray: No Squeeze.
Information Table
A table is displayed in the top-right corner of the chart, showing closing prices for different timeframes (e.g., 1 minute, 5 minutes, 1 hour, etc.). Each timeframe is color-coded.
Alerts
LaRSI Alerts:
Crosses above 20: Exiting oversold condition (buy signal).
Crosses below 80: Exiting overbought condition (sell signal).
Squeeze Alerts:
When the squeeze ends: Indicates a potential price move.
When the squeeze starts: Indicates volatility is decreasing.
Summary
This indicator is a powerful tool for determining market trends, momentum, and squeeze conditions. It helps users identify periods when the market is likely to move or remain stagnant, providing alerts based on these analyses to support trading strategies.

HTF Dynamic EMA Smoothing Indicator [CHE] with Kernel SelectionThe Dynamic EMA Smoothing Indicator with Kernel Selection is a powerful Pine Script indicator for TradingView designed to smooth moving averages and identify market trends more clearly. Here is a detailed description of its functionalities and settings:
Main Functions:
1. Time Period Display:
- Option to show or hide an info box displaying the current time period.
- Customizable info box: Users can adjust the size, position, and colors of the info box to suit their preferences.
2. Timeframe Type Selection:
- Auto Timeframe: Automatically calculates the best timeframe based on the current resolution.
- Multiplier: Allows using an alternate timeframe as a multiple of the current resolution.
- Manual Resolution: Users can manually set a specific timeframe.
3. Colors:
- Custom colors for various graphical elements, including EMA lines and signals.
4. Basic Settings:
- EMA and Signal Periods: Defines the periods for the exponential moving averages (EMA) and signal lines.
- Smoothing Length and Kernel Type: Allows selecting the smoothing length and the type of kernel used for weighting the EMAs.
- ATR Multiplier: Defines the multiplier for the ATR (Average True Range) to identify relevant price ranges.
5. EMA Calculations:
- The indicator calculates a weighted EMA using several methods like Linear, Exponential, Epanechnikov, Triangular, and Cosine kernels.
- Smoothing is achieved by adding and removing values in a float array that stores the EMA values.
6. Plotting EMA and Signal Lines:
- The indicator plots the smoothed EMA and signal lines on the chart. The line colors change according to the trend direction (green for uptrend, red for downtrend).
7. Trading Signals:
- Long Signals: An upward arrow is displayed when the smoothed EMA indicates an uptrend.
- Short Signals: A downward arrow is displayed when the smoothed EMA indicates a downtrend.
- Alert Conditions: Alerts are triggered when long or short signals are detected.
8. ATR Bands:
- The indicator shows upper and lower ATR bands to identify potential support and resistance zones.
9. Time Period Display on Chart:
- A table is used to display the selected time period on the chart when the corresponding option is enabled.
This indicator offers extensive customization and allows traders to conduct complex market analyses using smoothed EMAs and custom timeframes. The integration of various kernels for smoothing makes it a versatile tool adaptable to different trading strategies.

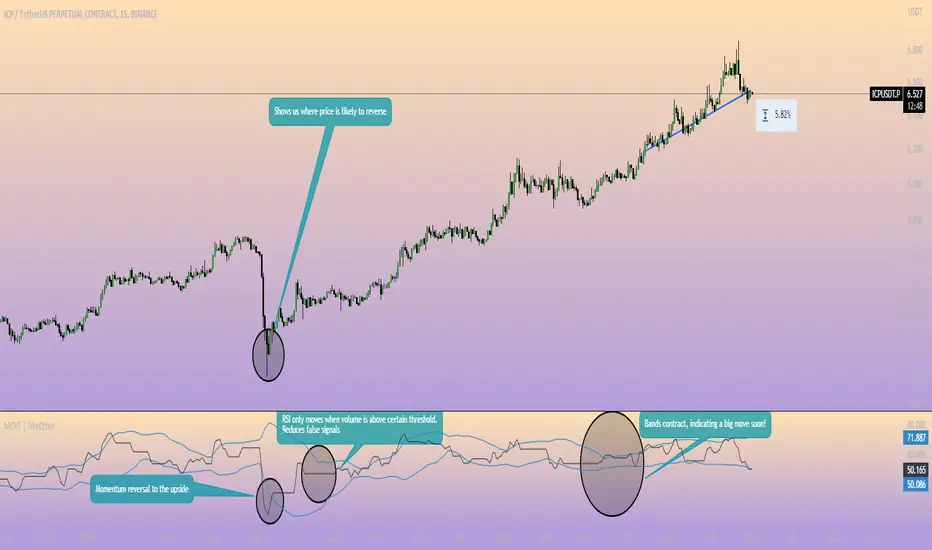
Momentum Channel - [Volume Filter]The indicator incorporates a volume filter to ensure that the RSI only moves when the volume is above the moving average of the volume.
The filtered RSI is then used to calculate the Bollinger Bands and moving averages, providing insights into the market dynamics.
It also gives you insight into the bigger timeframes so you can monitor momentum!
Volume Filter Length: Input parameter for the length of the volume filter moving average.
Overview of code:
rsiPeriod: Input parameter for the RSI period.
bandLength: Input parameter for the length of the Bollinger Bands.
lengthrsipl: Input parameter for the length of the fast moving average (MA) on the RSI.
volumeFilterLength: Input parameter for the length of the volume filter moving average.
volumeAvg: Calculates the moving average of the volume using the ta.sma() function with the specified volume filter length.
filteredRsi: Uses the ta.valuewhen() function to obtain the RSI value only when the volume is greater than or equal to the volume moving average. This creates a filtered RSI based on the volume filter.
offs: Calculates the offset value for the Bollinger Bands. It is derived by multiplying 1.6185 with the standard deviation of the filtered RSI using the ta.stdev() function.
Value TrailingValue Trailing is a variation of my "Dynamic Trailing" indicator, which had additional features including a band-system that tracks the highs and lows of the past X candles. Value Trailing, on the other hand, uses a default lookback window of 14, and a normal range of 68%, simulating a Fixed Range Volume Profile distribution of the past 14 candles, with bands at the upper and lower 68% range.
This lets the user clearly see the key levels, ignoring potential noise from varying and inconsistent highs and lows, while still allowing the user to trade this alongside basic strategies and concepts such as supply/demand and sideways trends.
This indicator comes with 2 customizable sets of "bands", as well as boxes that identify the range of the last candle that touched one side of the bands.

JWAT INDYHere’s a **professional, clear, and trader-friendly description** of your **Bollinger Band Mean Reversion Strategy**, written so you can use it in TradingView, a backtest report, or even in your trading plan document:
---
### 📊 **Bollinger Band Mean Reversion Strategy – Description**
This strategy is designed to exploit short-term overextensions in price relative to its statistical mean using **Bollinger Bands** as the primary volatility framework. It assumes that when price deviates significantly from the mean (the middle band), market conditions are temporarily stretched, creating a high-probability opportunity for **reversion to the mean**.
The system uses a standard **20-period Bollinger Band** with a **2.0 standard-deviation multiplier** to define overbought and oversold zones. When price closes below the **lower band**, it signals potential exhaustion of selling pressure and triggers a **long (buy)** setup. Conversely, when price closes above the **upper band**, it indicates overbought conditions and triggers a **short (sell)** setup.
To improve trade quality and avoid false reversals, the strategy integrates **ADX (Average Directional Index)** or another trend filter to confirm that volatility expansion is not part of a strong trending move. Trades are taken only when the market is in a **low-to-moderate trend environment**, where mean-reverting behavior is statistically favored.
Each trade aims for a modest **take-profit target near the middle Bollinger Band (the moving average)**, representing a return to equilibrium, with a predefined **stop loss** beyond recent highs or lows to control risk. Position sizing can be dynamic—based on account equity or fixed contract size—to allow compounding through consistent percentage-based risk.
This approach is particularly effective on **short intraday timeframes (e.g., 1-minute or 5-minute SPY charts)**, where frequent oscillations occur within tight volatility bands. The goal is to capture small, repeatable edges from market overreactions while maintaining a strict discipline in trade execution and risk management.
---
### 🧩 **Key Features**
* Core indicator: **Bollinger Bands (20, 2.0)**
* Confirmation filter: **ADX threshold (e.g., <25)** to identify ranging conditions
* Entry logic:
* Long when price closes below lower band
* Short when price closes above upper band
* Exit logic:
* Take profit at the mid-band
* Stop loss beyond prior swing or fixed % distance
* Optional filters: Time of day, session volatility, or multi-timeframe trend confirmation
* Ideal for: **Mean-reversion scalping** on liquid instruments like SPY, QQQ, or futures
---
Would you like me to write a **shorter version (2–3 sentences)** for your TradingView strategy description box — or keep this **full detailed version** for a trading plan document or presentation?
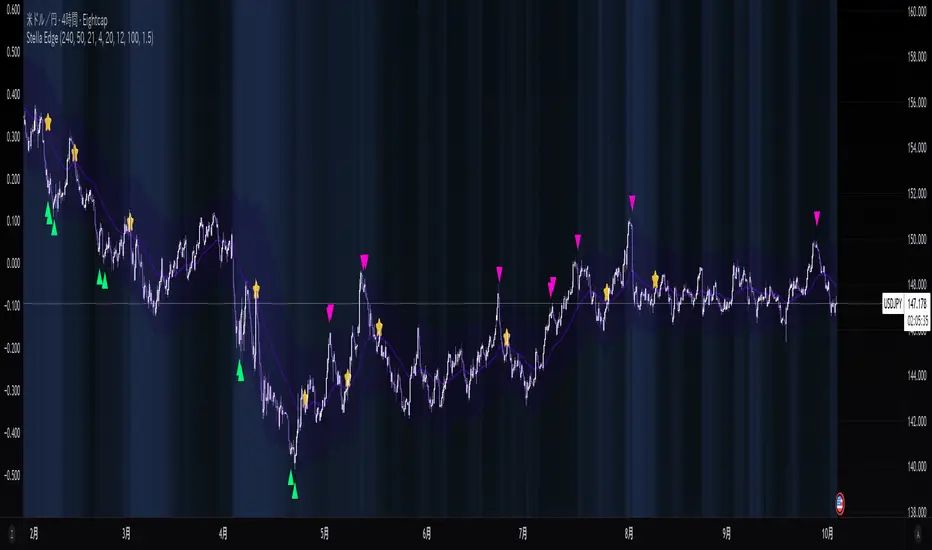
Stella Edge|SuperFundedStella Edge — Quick Guide
What it is
Stella Edge is a higher-timeframe (HTF) EMA + ATR channel with adaptive zones, a volatility hazard filter, and clean entry/exit cues. It projects an HTF EMA with ATR bands, paints a calm-to-active “aurora” background using normalized ATR, and marks:
・Long cue when price crosses up into/through the lower band (potential buy zone).
・Short cue when price crosses down into/through the upper band (potential sell zone).
・Take-profit star when price crosses back through the HTF EMA against your active direction.
・Skull marker on extreme volatility bars (ATR & Volume spikes) to warn of unstable conditions.
Why this is not a simple mashup
・HTF regime first: Instead of reacting to local noise, entries are contextualized by an HTF EMA±ATR envelope (request.security) that frames price with structural zones (upper = supply bias, lower = demand bias).
・Risk-aware gating: A dual-threshold volatility filter flags bars where true range and volume spike far above their baselines—conditions that often degrade signal quality.
・Signal hygiene: Cross checks use band values from the prior bar to reduce duplicate/ambiguous triggers when HTF data updates, yielding cleaner, fewer, higher-quality icons.
・Visual cognition: The aurora background blends two night tones by the percent-rank of HTF ATR, so your eye immediately senses regime intensity without reading numbers.
How it works (concise)
1. Pull HTF EMA(len) and HTF ATR(len) via request.security.
2. Compute upper/lower bands = EMA ± ATR×multiplier (projected continuously).
3. Aurora mode: Normalize HTF ATR by 200-bar percent-rank and map it to a calm→active gradient for background.
4. Signals
・Long when close crosses up the lowerBand .
・Short when close crosses down the upperBand .
・Track tradeDirection and print a ⭐️ when price crosses the HTF EMA against the current direction (TP cue).
5. Volatility hazard (optional): Flag bars where
・TR ≥ ATR(avg, N) × multiplier and
・Volume ≥ SMA(volume, M) × multiplier.
These get a 💀 label so you can avoid forced entries/exits during disorderly bursts.
Parameters (UI mapping)
Higher-Timeframe & Core
・Higher TF for EMA/ATR: HTF used by request.security (e.g., 60).
・EMA Length (HTF): HTF EMA period.
・ATR Length (HTF): HTF ATR period.
・ATR Multiplier: Band width.
・Aurora mode: Toggle dynamic background (ATR-based gradient).
Volatility Filter (Volatility Filter group)
・Enable Extreme Volatility Filter?: On/off.
・ATR Period / ATR Spike Multiplier: Bar is “extreme” if TR ≥ ATR×multiplier.
・Volume MA Period / Volume Spike Multiplier: “Extreme” also requires Volume ≥ SMA×multiplier.
Signal Settings
・Long Arrow Color / Short Arrow Color: Icon colors for long/short cues.
Practical usage
・Plan around the HTF envelope:
・Below lower band → price may be stretched into demand zone (look for long cue & reaction).
・Above upper band → stretched into supply zone (look for short cue & reaction).
・Confirmation: Treat arrows as triggers, not commands. Favor entry when you also see reaction candles (rejection wicks, engulfings) or micro-structure alignment.
・Exit discipline: The ⭐️ on EMA cross-back is a simple, mechanical TP. You can scale out earlier using fixed R-multiples or prior swing levels.
・Hazard bars: Avoid initiating on 💀 bars; widen stops or step aside until volatility normalizes.
・Clutter control: If zones feel too reactive, raise HTF (e.g., 120/240) or increase ATR Length/Multiplier for broader, slower bands.
Repainting & HTF notes
・HTF series from request.security are final only when the HTF bar closes. Using upperBand /lowerBand for crosses helps reduce duplicate/early prints, but intrabar behavior on the current HTF bar can still evolve. Evaluate on closed bars for strict confirmation.
Best markets & timeframes
・Pairs/indices/crypto where trend–pullback cycles are common.
・Start with entry TF = your usual trading TF (e.g., 5m–1h) and HTF = 3–12× that TF (e.g., 60/120/240).
・For BTC/Gold or newsy assets, prefer higher HTF and the volatility filter ON.
Disclaimer
This tool identifies zones and timing cues; it does not guarantee outcomes. News shocks and liquidity gaps can invalidate any setup. Always size positions prudently and trade at your own risk.
SuperFunded invite-only
To obtain access, please DM me on TradingView or use the link in my profile.
Stella Edge — クイックガイド(日本語)
概要
Stella Edgeは、上位足EMA±ATRバンドで相場をフレーミングし、アダプティブな買い/売りゾーン、極端なボラティリティ警告、そしてシンプルなエントリー/利確キューを提供するインジです。
・ロング:価格が Lower Bandを上抜けたタイミングで矢印。
・ショート:価格が Upper Bandを下抜けたタイミングで矢印。
・利確⭐️:建玉方向に対して価格が HTF EMA を逆行クロスしたら表示。
・💀警告:ATRと出来高が同時スパイクした「危険」バーを明示。
・背景はHTF ATRのパーセントランクで静→動にグラデーションする「オーロラ」表現。
独自性・新規性
・上位足の構造を先に定義(EMA±ATR)→そこへ戻る/抜ける動きだけを狙うため、ノイズを減らした文脈型の判断が可能。
・二重スパイク条件(TR×ATR基準+出来高×SMA基準)で、荒れ相場のエントリー回避を支援。
・シグナルの重複・不安定を抑制、見やすい最小限のアイコンに整理。
・視覚設計としてATRの相対的な強度を背景で可視化し、一目で局面認識。
使い方のヒント
・ゾーンは押し目/戻り目の候補。矢印はトリガーとして扱い、ローソクの反応(ピンバー/包み足など)で確認してから入る。
・⭐️は機械的TPの目安。スケールアウトやR倍数での利確も併用可。
・💀が出た足での新規は原則回避。HTFを上げるとゾーンはより鈍感=落ち着いた絵に。
・HTF更新の注意:上位足バー確定までは値が変化し得ます。確定足ベースで検証するのが安全。
免責
本ツールは反発や到達を保証しません。イベントや流動性によって機能しないことがあります。資金管理のもと自己責任でご利用ください。
SuperFunded 招待専用スクリプト
このスクリプトはSuperFundedの参加者専用です。アクセスをご希望の方は、SuperFundedにご登録のメールアドレスから partner@superfunded.com 宛に、TradingViewの登録名をご送信ください。
PCV (Darren.L-V2)Description:
This indicator combines Bollinger Bands, CCI, and RVI to help identify high-probability zones on M15 charts.
Features:
Bollinger Bands (BB) – displayed on the main chart in light gray. Helps visualize overbought and oversold price levels.
CCI ±100 levels + RVI – displayed in a separate sub-window:
CCI only shows the ±100 reference lines.
RVI displays a cyan main line and a red signal line.
Valid Zone Detection:
Candle closes outside the Bollinger Bands.
RVI crosses above +100 or below -100 (CCI level reference).
Candle closes back inside the BB, confirming a price rebound.
Requires two touches in the same direction to confirm the zone.
Only zones within 20–30 pips range are considered valid.
Usage:
Helps traders spot reversal or bounce zones with clear visual signals.
Suitable for all indices, Forex, and crypto on M15 timeframe.

WRAMA Channel (Weighted RSI ATR MA)OVERVIEW
The WRAMA Channel (Weighted RSI ATR MA) is an advanced technical analysis tool designed to react more quickly to price movements compared to indicators using conventional moving averages. It combines the Relative Strength Index (RSI), Average True Range (ATR), and a weighted moving average, resulting in the WRAMA. This indicator forms a dynamic price channel based on a weighted average that incorporates both trend strength (via RSI) and market volatility (via ATR). It helps traders identify trends, potential reversals, and breakout signals, while offering broad customization options.
Key Features
WRAMA Price Channel:
Generates a dynamic channel around the weighted moving average (WRAMA), adapting to market volatility and momentum, similar to Bollinger Bands. Users are encouraged to adjust channel width and length according to their strategy.
The upper and lower channel bands are calculated based on a percentage deviation from the baseline line.
The channel fill color changes depending on the price's position relative to the baseline (green above, red below), with an optional gradient for better visualization.
Weighted Moving Average (WRAMA):
WRAMA is a custom weighted moving average (MA1), where closing prices are weighted based on RSI and ATR, allowing it to dynamically adapt to market conditions.
Baseline: The WRAMA line calculated over a user-defined period.
WRAMA Calculation:
RSI Weight: Based on RSI value. When RSI is in extreme zones (below the lower threshold or above the upper threshold), an extreme weight is applied. Otherwise, the weight is based on the squared RSI value divided by 100, raised to a power defined by the rsi_weight_factor.
ATR Weight: Based on the ATR-to-average-ATR ratio. If ATR exceeds a threshold (atr_threshold × avg_atr), an extreme weight is applied. Otherwise, the weight is based on the squared ratio of ATR to average ATR, raised to the power of the atr_weight_factor.
Combined Weight: RSI and ATR weights are combined using a rsi_atr_balance parameter. Final weight = RSI weight × balance + ATR weight × (1 - balance).
WRAMA Calculation: The closing price is multiplied by the combined weight. The result is averaged over the ma_length period and divided by the average of the weights, forming the WRAMA line. For current WRAMA (ma_length = 1), the calculation simplifies to a single weighted price.
Additional Moving Averages:
For additional confirmations, the indicator supports up to five moving averages (MA1–MA5) with various types (SMA, EMA, WMA, HMA, ALMA) and customizable periods.
All additional MAs are calculated based on WRAMA or its baseline, ensuring consistency and enabling deeper analysis within a unified methodology. MA trend directions can be tracked in a built-in signal table.
Trading Signals:
Breakout Signals: Breakouts above/below the channel are optionally marked with triangle shapes (green for bullish, red for bearish).
MA Signals: Price position relative to MAs or their slope generates bullish/bearish signals. These are optionally visualized with default triangles (green up, red down).
A signal table in the top-right corner summarizes the status of each moving average – bullish, bearish, or neutral.
Customization Options
Channel Settings:
MA Period: Length of the WRAMA baseline (default: 100).
Channel Deviation : Percentage offset from the baseline for upper/lower bands (default: 1.5%).
RSI Settings:
RSI Period: Length of the RSI calculation (default: 14).
RSI Upper/Lower Threshold: Overbought/oversold levels (default: 70/30).
RSI Weight Factor: Influence of RSI on weighting (default: 2.0).
ATR Settings:
ATR Period: ATR calculation length (default: 14).
ATR Threshold: Volatility threshold as a multiple of average ATR (default: 1.5).
ATR Weight Factor: Influence of ATR on weighting (default: 2.0).
RSI & ATR Combined:
Extreme Weight: Weight applied in extreme RSI/ATR conditions (default: 3.0).
RSI/ATR Balance: Balance between RSI and ATR influence (default: 0.5).
Signal Settings:
Show Breakout Signals: Enable/disable breakout triangles.
Show MA Signals: Enable/disable MA-based signals.
MA Signal Source: Choose between current WRAMA or baseline.
MA Signal Analysis: Based on price position or slope.
Neutral Threshold : Minimum distance from MA for signal neutrality (default: 0.5%).
Minimum MA Slope : Minimum slope for trend direction signals (default: 0.01%).
Moving Averages (MA1–MA5):
Options to enable/disable, select type (SMA, EMA, WMA, HMA, ALMA), set period length, and choose color.
Style Settings:
Gradient Fill: Enable/disable gradient coloring within the channel.
Show Baseline: Enable/disable WRAMA baseline visibility.
Colors: Customize line, fill, and signal colors.
Use Cases
Trend Identification: The WRAMA channel highlights trend direction and potential reversal zones when price contacts the channel edges.
Breakout Signals: Channel breakouts may indicate trend shifts or momentum surges.
MA Analysis: The signal table provides a clear summary of market direction (bullish, bearish, or neutral) based on selected moving averages.
Trading Strategies: Suitable for trend-following, mean-reversion, and scalping strategies, depending on user preferences and settings.
Notes
The indicator offers a high degree of flexibility, making it adaptable to various trading styles, instruments, and timeframes.
It is recommended to adjust channel length and width to fit your trading strategy.
Backtesting settings on historical data is advised to optimize parameters for a specific strategy and market.

Vix_Fix Enhanced MTF [Cometreon]The VIX Fix Enhanced is designed to detect market bottoms and spikes in volatility, helping traders anticipate major reversals with precision. Unlike standard VIX Fix tools, this version allows you to control the standard deviation logic, switch between chart styles, customize visual outputs, and set up advanced alerts — all with no repainting.
🧠 Logic and Calculation
This indicator is based on Larry Williams' VIX Fix and integrates features derived from community requests/advice, such as inverse VIX logic.
It calculates volatility spikes using a customizable standard deviation of the lows and compares it to a moving high to identify potential reversal points.
All moving average logic is based on Cometreon's proprietary library, ensuring accurate and optimized calculations on all 15 moving average types.
🔷 New Features and Improvements
🟩 Custom Visual Styles
Choose how you want your VIX data displayed:
Line
Step Line
Histogram
Area
Column
You can also flip the orientation (bottom-up or top-down), change the source ticker, and tailor the display to match your charting preferences.
🟩 Multi-MA Standard Deviation Calculation
Customize the standard deviation formula by selecting from 15 different moving averages:
SMA (Simple Moving Average)
EMA (Exponential Moving Average)
WMA (Weighted Moving Average)
RMA (Smoothed Moving Average)
HMA (Hull Moving Average)
JMA (Jurik Moving Average)
DEMA (Double Exponential Moving Average)
TEMA (Triple Exponential Moving Average)
LSMA (Least Squares Moving Average)
VWMA (Volume-Weighted Moving Average)
SMMA (Smoothed Moving Average)
KAMA (Kaufman’s Adaptive Moving Average)
ALMA (Arnaud Legoux Moving Average)
FRAMA (Fractal Adaptive Moving Average)
VIDYA (Variable Index Dynamic Average)
This gives you fine control over how volatility is measured and allows tuning the sensitivity for different market conditions.
🟩 Full Control Over Percentile and Deviation Conditions
You can enable or disable lines for standard deviation and percentile conditions, and define whether you want to trigger on over or under levels — adapting the indicator to your exact logic and style.
🟩 Chart Type Selection
You're no longer limited to candlestick charts! Now you can use Vix_Fix with different chart formats, including:
Candlestick
Heikin Ashi
Renko
Kagi
Line Break
Point & Figure
🟩 Multi-Timeframe Compatibility Without Repainting
Use a different timeframe from your chart with confidence. Signals remain stable and do not repaint. Perfect for spotting long-term reversal setups on lower timeframes.
🟩 Alert System Ready
Configure alerts directly from the indicator’s panel when conditions for over/under signals are met. Stay informed without needing to monitor the chart constantly.
🔷 Technical Details and Customizable Inputs
This indicator includes full control over the logic and appearance:
1️⃣ Length Deviation High - Adjusts the lookback period used to calculate the high deviation level of the VIX logic. Shorter values make it more reactive; longer values smooth out the signal.
2️⃣ Ticker - Choose a different chart type for the calculation, including Heikin Ashi, Renko, Kagi, Line Break, and Point & Figure.
3️⃣ Style VIX - Change the visual style (Line, Histogram, Column, etc.), adjust line width, and optionally invert the display (bottom-to-top).
📌 Fill zones for deviation and percentile are active only in Line and Step Line modes
4️⃣ Use Standard Deviation Up / Down - Enable the overbought and oversold zone logic based on upper and lower standard deviation bands.
5️⃣ Different Type MA (for StdDev) - Choose from 15 different moving averages to define the calculation method for standard deviation (SMA, EMA, HMA, JMA, etc.), with dedicated parameters like Phase, Sigma, and Offset for optimized responsiveness.
6️⃣ BB Length & Multiplier - Adjust the period and multiplier for the standard deviation bands, similar to how Bollinger Bands work.
7️⃣ Show StdDev Up / Down Line - Enable or disable the visibility of upper and lower standard deviation boundaries.
8️⃣ Use Percentile & Length High - Activate the percentile-based logic to detect extreme values in historical volatility using a customizable lookback length.
9️⃣ Highest % / Lowest % - Set the high and low percentile thresholds (e.g., 85 for high, 99 for low) that will be used to trigger over/under signals.
🔟 Show High / Low Percentile Line - Toggle the visual display of the percentile boundaries directly on the chart for clearer signal reference.
1️⃣1️⃣ Ticker Settings – Customize parameters for special chart types such as Renko, Heikin Ashi, Kagi, Line Break, and Point & Figure, adjusting reversal, number of lines, ATR length, etc.
1️⃣2️⃣ Timeframe – Enables using SuperTrend on a higher timeframe.
1️⃣3️⃣ Wait for Timeframe Closes -
✅ Enabled – Displays Vix_Fix smoothly with interruptions.
❌ Disabled – Displays Vix_Fix smoothly without interruptions.
☄️ If you find this indicator useful, leave a Boost to support its development!
Every feedback helps to continuously improve the tool, offering an even more effective trading experience. Share your thoughts in the comments! 🚀🔥

Low Volatility Breakout Detector)This indicator is designed to visually identify potential breakouts from consolidation during periods of low volatility. It is based on classic Bollinger Bands and relative volume. Its primary purpose is not to generate buy or sell signals but to assist in spotting moments when the market exits a stagnation phase.
Arrows appear only when the price breaks above the upper or below the lower Bollinger Band, the band width is below a specified threshold (expressed in percentage), and volume is above its moving average multiplied by a chosen multiplier (default is 1). This combination may indicate the start of a new impulse following a period of low activity.
The chart background during low volatility is colored based on volume strength—the lower the volume during stagnation, the less transparent the background. This helps quickly spot unusual market behavior under seemingly calm conditions. The background opacity is dynamically scaled relative to the range of volumes over a selected period, which can be set manually (default is 50 bars).
The indicator works best in classic horizontal consolidations, where price moves within a narrow range and volatility and volume clearly decline. It is not intended to detect breakouts from formations such as triangles or wedges, which may not always exhibit low volatility relative to Bollinger Bands.
Settings allow you to adjust:
Bollinger Band length and multiplier,
Volatility threshold (in %),
Background and arrow colors,
Volume moving average length and multiplier,
Bar range used for background opacity scaling.
Note: For reliable results, it’s advisable to tailor the volatility threshold and volume/background ranges to the specific market and timeframe, as different instruments have distinct dynamics. If you want the background color to closely match the color of breakout arrows, you should set the same volume analysis period as the volume moving average length.
Additional note: To achieve a cleaner chart and focus solely on breakout signals, you can disable the background and Bollinger Bands display in the settings. This will leave only the breakout arrows visible on the chart, providing a clearer and more readable market picture.

Relative Wave: Volatility IncludedFor the setup shown, it is best used with the following scripts I have written:
1. Indicator: Volatility Candle Based
2. Multi-Period Charts (use 2 of them): @ 30m and 1H settings
3. Relative Wave: Volatility Included.
Indicator Description: Relative Wave: Volatility Included (RW: Vol)
Pine Script v6 – Technical Overview
🔍 Purpose
The Relative Wave: Volatility Included (RW: Vol) is a custom oscillator designed to measure price position relative to dynamic upper and lower bounds that are influenced by volatility. It incorporates trend filtering, momentum smoothing, and zone detection, providing a composite view of price waves and potential reversal signals.
🧠 How It Works
1. Core Concept: Relative Position within Volatility Bands
The indicator calculates a Relative Wave Index, which measures where the current price sits between recent upper and lower bands derived from standard deviation. These bounds are sorted over a historical window to filter for sensitivity.
2. Sensitivity & Smoothing
Trend Length (Historical_Bar_Count): Defines how many bars are used to build the volatility-adjusted trend range.
Sensitivity Control: Adjusts how reactive the index is to recent price changes.
EMA Smoothing: Custom exponential moving averages are used to smooth values for fast, slow, and overall momentum.
3. Components & Visuals
RW Short-Term Fast Line: Plotted as colored circles indicating quick changes in trend.
RW Short-Term Slow Line: A smoother trend line for signal filtering.
RW Overall Momentum Line: Step-style line measuring broader directional trend.
RW Wave Line: A smoothed average of recent crests and troughs, acting as a cyclical midline reference.
Zone Lines (5/20/50/80/95): Visual thresholds often used as overbought/oversold regions.
⚙️ Key Inputs & Their Effects
Trend Length: Longer = smoother but laggy trends; shorter = more responsive but volatile.
Sensitivity: Higher values = less sensitivity; lower = more reactive.
Signal Lengths (Fast/Slow/Overall): Control the degree of smoothing for each plotted line.
Crest/Trough Lookback: Determines how crests and troughs are calculated from past wave behavior.
✅ Trade Signal Logic
The script defines bullish and bearish conditions based on the interaction of:
RW Wave direction
Overall Momentum direction
Slow Line behavior
Relative positioning (e.g., below or above 50)
Bullish Example:
RW Wave and Momentum are both rising
Values are below 50 (potential upside room)
Slow Line may be falling or just crossed upward
Bearish Example:
RW Wave and Momentum are falling
Values are above 50 (potential downside room)
Slow Line rising or crossed downward
🎨 Visual Aids & Colors
Green: Bullish momentum
Red: Bearish momentum
Blue/Purple Circles: Transition points and fast line status
White/Midrange Lines: Reference zones (like RSI levels)
📈 Best Use Cases
Identifying shifts in market direction before price breakout
Confirming trend strength using wave/momentum alignment
Spotting oversold/overbought zones with volatility context
Combining with other indicators (e.g., price action or volume)
How the Relative Wave Indicator, Volatility-Based Candle Signals, and Multi-Time Period Charts Work Together
This strategy combines three core components—Relative Wave, Volatility Candle Signals, and Multi-Time Period Analysis—to build a layered, high-probability trading framework.
🔷 1. Relative Wave Indicator (used on 3-minute chart)
The Relative Wave Indicator is a momentum and volatility-based oscillator that tracks price movement within a defined range using historical highs and lows derived from standard deviation bands. It smooths price action using fast and slow custom EMAs to identify underlying trend strength and reversals.
Key Features:
Tracks short-term wave structure
Detects momentum shifts based on rising/falling conditions
Uses color-coded momentum signals to help spot turning points early
The wave line and overall momentum line help confirm the quality of trend setups
🔶 2. Volatility Candle-Based Indicator (used on 3-minute chart)
The Volatility Candle Signal highlights significant price action based on expanding or contracting volatility. This tool helps identify moments of potential breakout or reversal by evaluating candle size, wick structure, and deviation from recent ranges.
Key Purpose:
Pinpoints actionable moments when volatility is entering or exiting the market
Works in tandem with Relative Wave to validate whether a momentum shift is strong enough to act on
🕰 3. Multi-Time Period Chart Confirmation (30-minute & 2-hour)
To avoid false signals and ensure alignment with broader market context, two higher timeframes (30m and 2h) are used as confirmation filters.
How They Integrate:
The 30-minute chart provides mid-range trend direction—ideal for intraday bias
The 2-hour chart offers broader trend context and helps avoid trading against dominant macro trends
These are used as overlays or separate indicators that mirror Relative Wave or other trend-detection tools to show whether the short-term setup aligns with bigger picture momentum
✅ Optimal Setup
Execution Timeframe: 3-minute chart
Confirmation Timeframes: 30-minute and 2-hour charts
Ideal Conditions for Trade Entry:
Relative Wave shows bullish/bearish alignment (e.g., wave and momentum lines rising with value <50 for bulls, >50 for bears)
Volatility candles indicate a breakout or reversal
Both the 30m and 2h multi-timeframe indicators confirm the trend direction or support a momentum shift
This integrated approach minimizes noise and increases confidence in each trade setup by ensuring that short-term signals are supported by volatility behavior and broader market context.

SuperSmoothed Volume Zone Oscillator------------------------------------------------------------------------------------
SUPERSMOOTHED VOLUME ZONE OSCILLATOR (SSVZO)
TECHNICAL INDICATOR DOCUMENTATION
------------------------------------------------------------------------------------
Table of Contents:
1. Original VZO Background
2. SuperSmoother Technology
3. SSVZO Components
3.1. Main SSVZO Oscillator
3.2. Momentum Velocity Component
3.3. Adaptive Levels
3.4. Static Levels
3.5. Trend Shift Detection
3.6. Glow Effect Visualization
4. References & Further Reading
------------------------------------------------------------------------------------
1. ORIGINAL VOLUME ZONE OSCILLATOR (VZO) BACKGROUND
------------------------------------------------------------------------------------
Creator: Walid Khalil (November 2009, Technical Analysis of Stocks & Commodities)
History: Khalil designed the VZO to address limitations in other volume indicators
by focusing on the relative balance between buying and selling volume while filtering
out market noise. The indicator identifies accumulation and distribution patterns.
Traditional Usage: The classic VZO uses a 14-period calculation setting and is
interpreted on a scale from -60% to +60%:
- Readings above +40% indicate strong buying pressure (potential overbought)
- Readings below -40% indicate strong selling pressure (potential oversold)
- The zero line acts as a key reference for trend changes
- Divergences between VZO and price offer valuable trading signals
Difference from Other Volume Indicators: Unlike simple volume indicators that only
track total volume, the VZO tracks the relative difference between up-volume and
down-volume, more effectively identifying buying/selling pressure imbalances and
potential reversal points.
------------------------------------------------------------------------------------
2. SUPERSMOOTHER FILTER TECHNOLOGY
------------------------------------------------------------------------------------
Creator: John F. Ehlers, an engineer specializing in digital signal processing for
trading systems.
Origins: Introduced in "Rocket Science for Traders" (2001) and refined in "Cybernetic
Analysis for Stocks and Futures" (2004). Represents the application of digital signal
processing techniques to financial markets.
Technical Foundation: The SuperSmoother is a two-pole low-pass filter specifically
designed to eliminate noise while preserving the underlying signal. It combines
principles of Butterworth and Gaussian filters to minimize both phase shift and
passband ripple.
Mathematical Implementation:
a1 = exp(-π * sqrt(2) / period)
b1 = 2 * a1 * cos(sqrt(2) * π / period)
c2 = b1
c3 = -a1²
c1 = 1 - c2 - c3
Advantages Over Traditional Filters:
- Reduces lag compared to simple moving averages
- Eliminates high-frequency market noise more effectively
- Minimizes unwanted ripples in the output signal
- Preserves important turning points in the data
- Superior handling of sudden market movements
According to Ehlers: "Conventional moving averages are plagued by excessive lag and/or
rippling in their passband. The SuperSmoother eliminates virtually all of this ripple
and has excellent transient response characteristics." (TASC Magazine, 2014)
------------------------------------------------------------------------------------
3. SSVZO COMPONENTS
------------------------------------------------------------------------------------
3.1. MAIN SSVZO OSCILLATOR
------------------------------------------------------------------------------------
Description: The core component measuring buying vs. selling volume pressure using
the SuperSmoother filter for enhanced noise reduction.
Calculation: SSVZO analyzes the relationship between up-volume (volume on rising
prices) and down-volume (volume on falling prices), applying exponential moving
averages to both components, then calculating their relative strength. The
SuperSmoother filter reduces market noise while preserving the underlying trend signal.
Implementation Advantage: By applying the SuperSmoother filter to the VZO calculation,
the SSVZO provides significantly cleaner signals with fewer false crossovers and more
accurate identification of true trend changes.
Interpretation:
- Values above zero indicate bullish volume dominance
- Values below zero indicate bearish volume dominance
- Readings above +60 suggest overbought conditions
- Readings below -60 suggest oversold conditions
- Crossovers of the zero line signal potential trend changes
Trading Application: Use SSVZO as a primary volume-based momentum indicator to
confirm price trends, identify divergences, and spot potential reversal zones.
------------------------------------------------------------------------------------
3.2. MOMENTUM VELOCITY COMPONENT
------------------------------------------------------------------------------------
Description: A histogram displaying the rate of change of momentum, showing how
quickly buying or selling pressure is accelerating or decelerating.
Calculation: Derived from price momentum over a user-defined period, with optional
adaptive filtering that adjusts sensitivity based on market volatility. The velocity
component shows the first derivative of momentum – essentially the "acceleration" of
market movement.
Technical Origin: Inspired by Ehlers' work on Hilbert Transforms and research on
cyclic components in financial markets, as detailed in "Cycle Analytics for Traders"
(2013).
Interpretation:
- Positive readings (teal bars) indicate accelerating upward momentum
- Negative readings (orange bars) suggest accelerating downward momentum
- Larger bars indicate stronger momentum acceleration
- Shrinking bars signal momentum deceleration
Trading Application: Use as an early warning system for potential trend exhaustion
or confirmation of a new trending move. When momentum velocity diverges from price,
it often precedes a reversal.
------------------------------------------------------------------------------------
3.3. ADAPTIVE LEVELS
------------------------------------------------------------------------------------
Description: Dynamic overbought and oversold boundaries that adjust to market
conditions, providing context-aware trading signals.
Calculation: Uses statistical methods based on the standard deviation of the SSVZO
values over a longer period. These levels automatically widen during higher volatility
periods and narrow during consolidation.
Research Base: Draws from Perry Kaufman's work on Adaptive Moving Averages (AMA) and
Bollinger's research on dynamic volatility bands, as published in "Trading Systems
and Methods" (2013).
Interpretation:
- Adaptive Overbought (dotted circles above): Dynamic ceiling that expands/contracts
based on market volatility
- Adaptive Oversold (dotted circles below): Dynamic floor that expands/contracts based
on market volatility
Trading Application: More reliable for identifying extremes than static levels,
particularly in changing market conditions or different instruments. Touching these
levels often provides higher-probability reversal signals.
------------------------------------------------------------------------------------
3.4. STATIC LEVELS
------------------------------------------------------------------------------------
Description: Fixed overbought and oversold horizontal lines that provide consistent
reference points for excess market conditions.
Calculation: Preset at +60 (overbought) and -60 (oversold) based on historical
analysis of volume behavior across multiple markets, extending the classic VZO range.
Interpretation:
- Readings above +60 suggest potential buying exhaustion
- Readings below -60 indicate potential selling exhaustion
- Duration spent beyond these levels correlates with reversal probability
Trading Application: Use as baseline reference points for extreme conditions. Most
effective when combined with other confirmation signals like divergences or
candlestick patterns.
------------------------------------------------------------------------------------
3.5. TREND SHIFT DETECTION
------------------------------------------------------------------------------------
Description: Visual markers and optional background shading highlighting potential
trend changes when the SSVZO crosses the zero line.
Calculation: Based on mathematical crossovers of the SSVZO value above or below the
zero line, with pattern recognition to reduce false signals.
Research Foundation: Incorporates concepts from Dr. Alexander Elder's "triple screen
trading system" and Mark Chaikin's volume-based trend identification research.
Interpretation:
- Upward triangles indicate bullish trend shifts (SSVZO crossing above zero)
- Downward triangles indicate bearish trend shifts (SSVZO crossing below zero)
- Background shading emphasizes the new trend direction
Trading Application: These signals often precede price trend changes and can serve
as entry triggers when aligned with the higher timeframe trend.
------------------------------------------------------------------------------------
3.6. GLOW EFFECT VISUALIZATION
------------------------------------------------------------------------------------
Description: An aesthetic enhancement creating a gradient "glow" around the main SSVZO
line, improving visual clarity and emphasizing signal strength.
Calculation: Generated using percentage-based bands around the main SSVZO value, with
multiple translucent layers to create a subtle illumination effect.
Design Inspiration: Inspired by modern UI/UX design principles for financial
dashboards and the MATS (Moving Average Trend Sniper) indicator's visual presentation,
enhancing perception of signal strength through visual intensity.
Interpretation:
- Teal glow indicates positive SSVZO values (bullish)
- Orange glow indicates negative SSVZO values (bearish)
- Glow intensity correlates with the strength of the signal
Trading Application: Beyond aesthetics, the glow creates visual emphasis that makes
trend direction, strength, and changes more immediately apparent, particularly useful
during fast-moving market conditions.
------------------------------------------------------------------------------------
4. REFERENCES & FURTHER READING
------------------------------------------------------------------------------------
1. Ehlers, J. F. (2001). "Rocket Science for Traders: Digital Signal Processing
Applications." John Wiley & Sons.
2. Ehlers, J. F. (2004). "Cybernetic Analysis for Stocks and Futures: Cutting-Edge
DSP Technology to Improve Your Trading." John Wiley & Sons.
3. Ehlers, J. F. (2013). "Cycle Analytics for Traders: Advanced Technical Trading
Concepts." John Wiley & Sons.
4. Khalil, W. (2009). "The Volume Zone Oscillator." Technical Analysis of Stocks &
Commodities, November 2009.
5. Kaufman, P. J. (2013). "Trading Systems and Methods." 5th Edition, Wiley Trading.
6. Elder, A. (2002). "Come Into My Trading Room: A Complete Guide to Trading."
John Wiley & Sons.
7. Bollinger, J. (2002). "Bollinger on Bollinger Bands." McGraw-Hill Education.
------------------------------------------------------------------------------------
END OF DOCUMENTATION
------------------------------------------------------------------------------------

LGMM (flat buffers) — multivariate poly + latent statesLGMM POLYNOMIAL BANDS — DISCOVER THE MARKET’S HIDDEN STATES
Overview
Latent-Gaussian-Mixture-Models (LGMMs) view price action as a mix of several invisible regimes: trending up, drifting sideways, sudden volatility spikes, and so on.
A Gaussian Mixture learns these states directly from data and outputs, for every bar, the probability that the market is in each state.
This indicator feeds those probabilities into a rolling polynomial regression that draws a fair-value line, then builds adaptive upper and lower bands.
Band width expands when recent residuals are large *and* when the state mix is uncertain, and contracts when price is calm or one regime clearly dominates.
Crossing back into the band from below generates a buy flag; crossing back into the band from above generates a sell flag (or take-profit for longs).
Key Inputs
Price source – default is Close; you can choose HL2, OHLC4, etc.
Training window (bars) – look-back length for every retrain. 252 bars (one trading year) is a balanced default for US stocks on daily timeframe. Use fewer bars for intraday charts (say 7*24=168 for 1H bars on crypto), more for weekly periods.
Polynomial degree – 1 for a straight trend line, 2 for a curved fit. Curved fits are better when the symbol shows persistent drift.
Hidden states K – number of regimes the mixture tracks (1 to 3). Three states often map well to up-trend, chop, down-trend.
Band width ×σ – multiplier on the entropy-weighted standard deviation. Smaller values (1.5-2) give more trades; larger values (2.5-3) give fewer, higher-conviction trades.
Offline μ,σ pairs (optional) – paste component means and sigmas from an offline LGMM (format: mu1,sigma1;mu2,sigma2;…). Leave blank to let the script use its built-in approximation.
Quick Start
Add the indicator to a chart and wait until the initial Training window has filled.
Watch for green BUY triangles when price closes back above the lower band and red SELL triangles when price closes back below the upper band.
Fine-tune:
– Increase Training window to reduce noise.
– Decrease Band width ×σ for more frequent signals.
– Experiment with Hidden states K; more states capture richer behaviour but need longer windows to stay reliable.
Tips
Bands widen automatically in chaotic periods and tighten when one regime dominates.
Combine with a volume filter or a higher-time-frame trend to reduce whipsaws.
If you already run an LGMM in Python or Matlab, paste its component parameters for a perfect match between your back-test and the TradingView plot.
Works on all markets and time-frames, provided you have at least five times the Training window’s bars in history.
Happy trading!

UM-Optimized Linear Regression ChannelDESCRIPTION
This indicator was inspired by Dr. Stoxx at drstoxx.com. Shout out to him and his services for introducing me to this idea. This indicator is a slightly different take on the standard linear regression indicator.
It uses two standard deviations to draw bands and dynamically attempts to best-fit the data lookback period using an R-squared statistical measure. The R-squared value ranges between zero and one with zero being no fit to the data at all and 1 being a 100% match of the data to linear regression line. The R-squared calculation is weighted exponentially to give more weight to the most recent data.
The label provides the number of periods identified as the optimal best-fit period, the type of loopback period determination (Manual or Auto) and the R-squared value (0-100, 100% being a perfect fit). >=90% is a great fit of the data to the regression line. <50% is a difficult fit and more or less considered random data.
The lookback mode can also be set manually and defaults to a value of 100 periods.
DEFAULTS
The defaults are 1.5 and 2.0 for standard deviation. This creates 2 bands above and below the regression line. The default mode for best-fit determination with "Auto" selected in the dropdown. When manual mode is selected, the default is 100. The modes, manual lookback periods, colors, and standard deviations are user-configurable.
HOW TO USE
Overlay this indicator on any chart of any timeframe. Look for turning points at extremes in the upper and lower bands. Look for crossovers of the centerline. Look at the Auto-determination for best fit. Compare this to your favorite Manual mode setting (Manual Mode is set to 100 by default lookback periods.)
When price is at an extreme, look for turnarounds or reversals. Use your favorite indicators, in addition to this indicator, to determine reversals. Try this indicator against your favorite securities and timeframes.
CHART EXAMPLE
The chart I used for an example is the daily chart of IWM. I illustrated the extremes with white text. This is where I consider proactively exiting an existing position and/or begin looking for a reversal.
