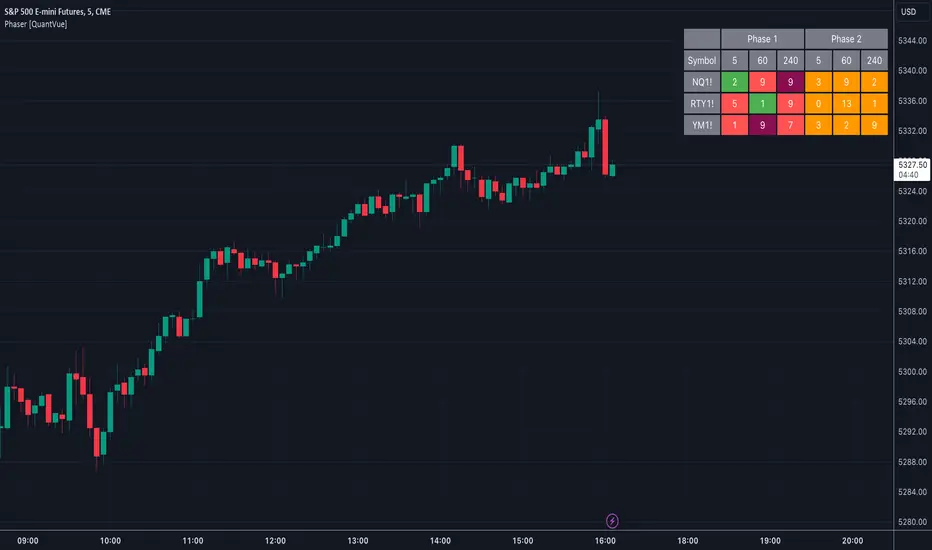
Phaser [QuantVue]The Phaser indicator is a tool to help identify inflection points by looking at price relative to past prices across multiple timeframes and assets.
Phase 1 looks for the price to be higher or lower than the closing price of the bar 4 bars earlier and is complete when 9 consecutive bars meet this criterion.
A completed Phase 1 is considered perfect when the highs (bearish) or lows (bullish) have been exceeded from bars 6 and 7 of the phase.
A bullish setup requires 9 consecutive closes less than the close 4 bars earlier.
A bearish setup requires 9 consecutive closes greater than the close 4 bars earlier.
Phase 2 begins once Phase 1 has been completed. Phase 2 compares the current price to the high or low of two bars earlier.
Unlike Phase 1, Phase 2 does not require the count to be consecutive.
Phase 2 is considered complete when 13 candles have met the criteria.
An important aspect to Phase 2 is the relationship between bar 13 and bar 8.
To ensure the end of Phase 2 is in line with the existing trend, the high or low of bar 13 is compared to the close of bar 8.
A bullish imperfect 13 occurs when the current price is less than the low of 2 bars earlier, but the current low is greater than the close of bar 8 in Phase 2.
A bearish imperfect 13 occurs when the current price is greater than the high of 2 bars earlier, but the current high is less than the close of bar 8 in Phase 2.
Phase 2 does not need to go until it is complete. A Phase 2 can be canceled if the price closes above or below the highest or lowest price from Phase 1.
Settings
3 Tickers
3 Timeframes
Show Phase 1
Show Phase 2
User-selected colors
Search in scripts for "bar"
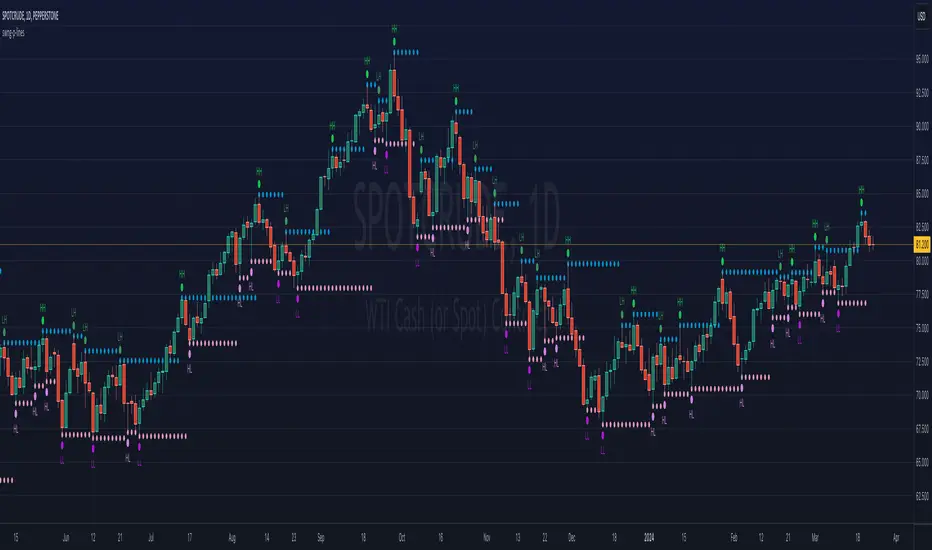
ka66: Swing/Pivot Point LinesThis indicator draws swing-highs and swing-lows, also called pivot highs and lows.
A swing high is a bar which has a higher-high than its surrounding bars (to the left and the right).
A swing low is a bar which has a lower-low than its surrounding bars (to the left and the right).
A common example of a pivot is Bill Williams' Fractal, which specifies that the centre bar must have a higher high than 2 bars to its left, and 2 bars to its right for a swing high, taking into account 5 bars at a time. Similarly, for a swing low, the centre bar must have a lower low than the 2 bars to its left and right.
This indicator allows configurable adjacent bars as input. Entering 2, means it essentially picks out a Williams Fractal. But you can select 1 (say for higher timeframes), using one 1 bar to the left and right of the centre bar.
The indicator will draw Swing/Pivot High/Low as circles at the same price level as the centre bar, till the next one shows up. Drawing is offset so it starts at the centre bar (the swing bar), showing exactly where the pivot bar is.
There are 2 main uses of pivot points, in various strategies:
Market Structure: to objectively define higher-highs/lows and lower-highs/lows in Trend Analysis.
More generally, to then determine if a trend might reverse, or continue as pivot levels are broken.
Messy pivot structures easily point out ranging markets.
There are a few of these, some closed source, which I don't like, since I think people should generally know what they are trading with, and I want to make sure I understand the logic exactly.
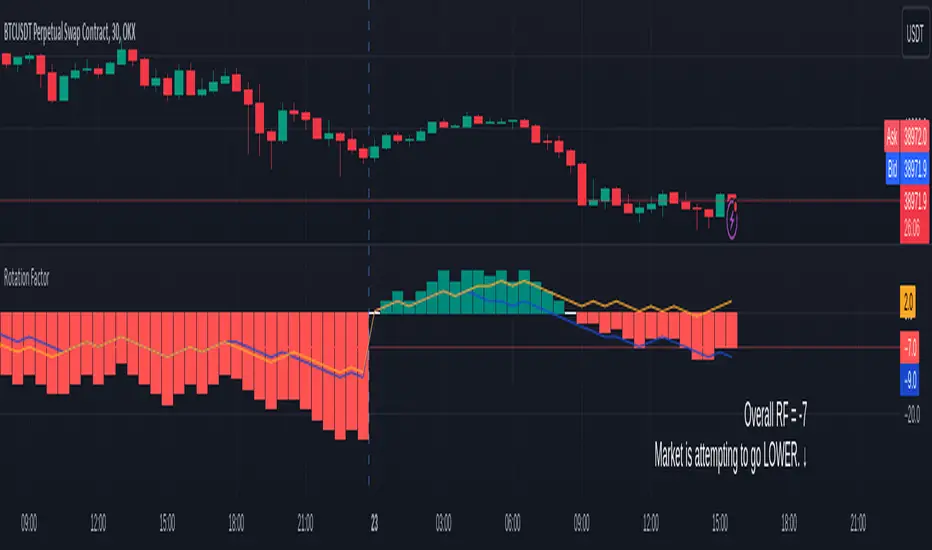
Rotation Factor for TPO and OHLC (Plot)The Rotation Factor objectively measures attempted market direction(or market sentiment) for a given period. It records the cumulative directional attempts of auction rotations within a given period, thus, helping traders determine which way the market is trying to go and which market participant is exerting greater control or influence.
Theory
The premise is that a greater number of bars auctioning higher contrasted to bars auctioning lower indicates that buyers are exerting greater control over price within the given period(usually daily). In this case, the market is attempting to go higher (Market is Bullish). The same is true for a greater number of bars auctioning lower than higher, which, in this case, indicates that the sellers are exerting greater control over price within the given period and that the market is attempting to go lower (Market is Bearish).
Calculation
Each bar is individually measured in relation to the immediate previous bar, and calculations are reset at the beginning of each period.
For every bar, two variables are utilised: One for the highs and another for the lows. During bar start, these variables are initiated at 0.
As the period progresses, these variables are set accordingly: If the high of the current bar is higher than that of the previous bar, then the bar's highs variable is assigned a "+1". If the opposite is true, it is given a "-1". Finally, if both bar highs are equal, it is, instead, assigned a "0". The same is true for the lows: if the low of the current bar is higher than that of the previous low, then the bar's lows variable is assigned a "+1". Similarly, the opposite is given a "-1", while equal lows causes it to be assigned a "0". All highs and lows are then summed together resulting to a total, which becomes the Rotational Factor.
Presentation
Furthermore, this Rotation Factor Indicator is presented as a plot, which, unlike its classic variation, shows you how the rotation factor is developing. It also includes lines indicating the Top Rotation Factor and the Bottom Rotation Factor individually, the better to observe the developing auction.
Link to the Classic Variation:
Features
1. Customisable Tick Size/Granularity : The calculation tick size/ granularity is customisable which can be accessed through the indicator settings.
2. Customisable Labels and Lines : The colour and sizes used by the labels and lines are customisable the better for accessibility.
3. Period Separator : A separator is rendered to represent period borders (start and end). If separators are already present on your chart, you can remove them from the indicator settings.
4. Individual Top Rotation Factor and Bottom Rotation Factor plots : These two parts which becomes of the Rotation Factor are also presented individually, on their own plots, the better to observe the developing auction.
Works for both split Market Profile(TPO) charts and regular OHLC bars/candle charts
The Rotation Factor is usually used with a Split Market Profile (TPO). However, if no such tool is available, you will still be able to benefit from the Rotation Factor as the price ranges of Split Market Profiles and OHLC bars/candles are one and the same. In such cases, it is recommended that you set your chart to use a 30 minute timeframe and the indicator's period to "daily" to simulate a Split Market Profile.
Note :
The Rotation Factor is, to quote, "by no means not an all-conclusive indication of future market direction.". It only helps determine which way the market is trying to go by objectively measuring the market's directional attempts.
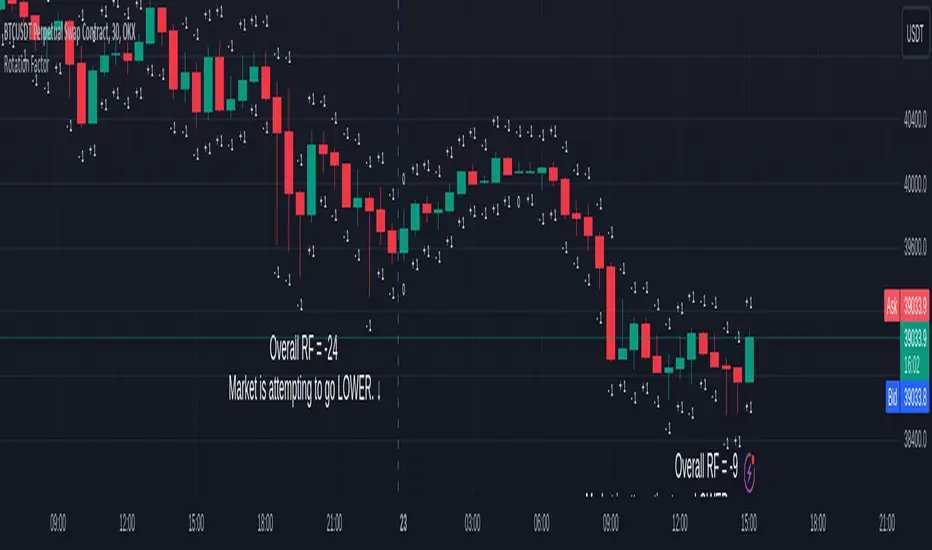
Rotation Factor for TPO and OHLC (Classic)The Rotation Factor objectively measures attempted market direction(or market sentiment) for a given period. It records the cumulative directional attempts of auction rotations within a given period, thus, helping traders determine which way the market is trying to go and which market participant is exerting greater control or influence.
Theory
The premise is that a greater number of bars auctioning higher contrasted to bars auctioning lower indicates that buyers are exerting greater control over price within the given period(usually daily). In this case, the market is attempting to go higher (Market is Bullish). The same is true for a greater number of bars auctioning lower than higher, which, in this case, indicates that the sellers are exerting greater control over price within the given period and that the market is attempting to go lower (Market is Bearish).
Calculation
Each bar is individually measured in relation to the immediate previous bar, and calculations are reset at the beginning of each period.
For every bar, two variables are utilised: One for the highs and another for the lows. During bar start, these variables are initiated at 0.
As the period progresses, these variables are set accordingly: If the high of the current bar is higher than that of the previous bar, then the bar's highs variable is assigned a "+1". If the opposite is true, it is given a "-1". Finally, if both bar highs are equal, it is, instead, assigned a "0". The same is true for the lows: if the low of the current bar is higher than that of the previous low, then the bar's lows variable is assigned a "+1". Similarly, the opposite is given a "-1", while equal lows causes it to be assigned a "0". All highs and lows are then summed together resulting to a total, which becomes the Rotational Factor.
Presentation
Furthermore, this Rotation Factor Indicator is presented as it is calculated, which is the presentation utilised by classic sources (hence the name classic).
Features
1. Customisable Tick Size/Granularity : The calculation tick size/ granularity is customisable which can be accessed through the indicator settings.
2. Customisable Labels : The colour and sizes used by the labels are customisable the better for accessibility.
3. Period Separator : A separator is rendered to represent period borders (start and end). If separators are already present on your chart, you can remove them from the indicator settings.
Works for both split Market Profile(TPO) charts and regular OHLC bars/candle charts
The Rotation Factor is usually used with a Split Market Profile (TPO). However, if no such tool is available, you will still be able to benefit from the Rotation Factor as the price ranges of Split Market Profiles and OHLC bars/candles are one and the same. In such cases, it is recommended that you set your chart to use a 30 minute timeframe and the indicator's period to "daily" to simulate a Split Market Profile.
Note :
The Rotation Factor is, to quote, "by no means not an all-conclusive indication of future market direction.". It only helps determine which way the market is trying to go by objectively measuring the market's directional attempts.
Volume and Price Z-Score [Multi-Asset] - By LeviathanThis script offers in-depth Z-Score analytics on price and volume for 200 symbols. Utilizing visualizations such as scatter plots, histograms, and heatmaps, it enables traders to uncover potential trade opportunities, discern market dynamics, pinpoint outliers, delve into the relationship between price and volume, and much more.
A Z-Score is a statistical measurement indicating the number of standard deviations a data point deviates from the dataset's mean. Essentially, it provides insight into a value's relative position within a group of values (mean).
- A Z-Score of zero means the data point is exactly at the mean.
- A positive Z-Score indicates the data point is above the mean.
- A negative Z-Score indicates the data point is below the mean.
For instance, a Z-Score of 1 indicates that the data point is 1 standard deviation above the mean, while a Z-Score of -1 indicates that the data point is 1 standard deviation below the mean. In simple terms, the more extreme the Z-Score of a data point, the more “unusual” it is within a larger context.
If data is normally distributed, the following properties can be observed:
- About 68% of the data will lie within ±1 standard deviation (z-score between -1 and 1).
- About 95% will lie within ±2 standard deviations (z-score between -2 and 2).
- About 99.7% will lie within ±3 standard deviations (z-score between -3 and 3).
Datasets like price and volume (in this context) are most often not normally distributed. While the interpretation in terms of percentage of data lying within certain ranges of z-scores (like the ones mentioned above) won't hold, the z-score can still be a useful measure of how "unusual" a data point is relative to the mean.
The aim of this indicator is to offer a unique way of screening the market for trading opportunities by conveniently visualizing where current volume and price activity stands in relation to the average. It also offers features to observe the convergent/divergent relationships between asset’s price movement and volume, observe a single symbol’s activity compared to the wider market activity and much more.
Here is an overview of a few important settings.
Z-SCORE TYPE
◽️ Z-Score Type: Current Z-Score
Calculates the z-score by comparing current bar’s price and volume data to the mean (moving average with any custom length, default is 20 bars). This indicates how much the current bar’s price and volume data deviates from the average over the specified period. A positive z-score suggests that the current bar's price or volume is above the mean of the last 20 bars (or the custom length set by the user), while a negative z-score means it's below that mean.
Example: Consider an asset whose current price and volume both show deviations from their 20-bar averages. If the price's Z-Score is +1.5 and the volume's Z-Score is +2.0, it means the asset's price is 1.5 standard deviations above its average, and its trading volume is 2 standard deviations above its average. This might suggest a significant upward move with strong trading activity.
◽️ Z-Score Type: Average Z-Score
Calculates the custom-length average of symbol's z-score. Think of it as a smoothed version of the Current Z-Score. Instead of just looking at the z-score calculated on the latest bar, it considers the average behavior over the last few bars. By doing this, it helps reduce sudden jumps and gives a clearer, steadier view of the market.
Example: Instead of a single bar, imagine the average price and volume of an asset over the last 5 bars. If the price's 5-bar average Z-Score is +1.0 and the volume's is +1.5, it tells us that, over these recent bars, both the price and volume have been consistently above their longer-term averages, indicating sustained increase.
◽️ Z-Score Type: Relative Z-Score
Calculates a relative z-score by comparing symbol’s current bar z-score to the mean (average z-score of all symbols in the group). This is essentially a z-score of a z-score, and it helps in understanding how a particular symbol's activity stands out not just in its own historical context, but also in relation to the broader set of symbols being analyzed. In other words, while the primary z-score tells you how unusual a bar's activity is for that specific symbol, the relative z-score informs you how that "unusualness" ranks when compared to the entire group's deviations. This can be particularly useful in identifying symbols that are outliers even among outliers, indicating exceptionally unique behaviors or opportunities.
Example: If one asset's price Z-Score is +2.5 and volume Z-Score is +3.0, but the group's average Z-Scores are +0.5 for price and +1.0 for volume, this asset’s Relative Z-Score would be high and therefore stand out. This means that asset's price and volume activities are notably high, not just by its own standards, but also when compared to other symbols in the group.
DISPLAY TYPE
◽️ Display Type: Scatter Plot
The Scatter Plot is a visual tool designed to represent values for two variables, in this case the Z-Scores of price and volume for multiple symbols. Each symbol has it's own dot with x and y coordinates:
X-Axis: Represents the Z-Score of price. A symbol further to the right indicates a higher positive deviation in its price from its average, while a symbol to the left indicates a negative deviation.
Y-Axis: Represents the Z-Score of volume. A symbol positioned higher up on the plot suggests a higher positive deviation in its trading volume from its average, while one lower down indicates a negative deviation.
Here are some guideline insights of plot positioning:
- Top-Right Quadrant (High Volume-High Price): Symbols in this quadrant indicate a scenario where both the trading volume and price are higher than their respective mean.
- Top-Left Quadrant (High Volume-Low Price): Symbols here reflect high trading volumes but prices lower than the mean.
- Bottom-Left Quadrant (Low Volume-Low Price): Assets in this quadrant have both low trading volume and price compared to their mean.
- Bottom-Right Quadrant (Low Volume-High Price): Symbols positioned here have prices that are higher than their mean, but the trading volume is low compared to the mean.
The plot also integrates a set of concentric squares which serve as visual guides:
- 1st Square (1SD): Encapsulates symbols that have Z-Scores within ±1 standard deviation for both price and volume. Symbols within this square are typically considered to be displaying normal behavior or within expected range.
- 2nd Square (2SD): Encapsulates those with Z-Scores within ±2 standard deviations. Symbols within this boundary, but outside the 1 SD square, indicate a moderate deviation from the norm.
- 3rd Square (3SD): Represents symbols with Z-Scores within ±3 standard deviations. Any symbol outside this square is deemed to be a significant outlier, exhibiting extreme behavior in terms of either its price, its volume, or both.
By assessing the position of symbols relative to these squares, traders can swiftly identify which assets are behaving typically and which are showing unusual activity. This visualization simplifies the process of spotting potential outliers or unique trading opportunities within the market. The farther a symbol is from the center, the more it deviates from its typical behavior.
◽️ Display Type: Columns
In this visualization, z-scores are represented using columns, where each symbol is presented horizontally. Each symbol has two distinct nodes:
- Left Node: Represents the z-score of volume.
- Right Node: Represents the z-score of price.
The height of these nodes can vary along the y-axis between -4 and 4, based on the z-score value:
- Large Positive Columns: Signify a high or positive z-score, indicating that the price or volume is significantly above its average.
- Large Negative Columns: Represent a low or negative z-score, suggesting that the price or volume is considerably below its average.
- Short Columns Near 0: Indicate that the price or volume is close to its mean, showcasing minimal deviation.
This columnar representation provides a clear, intuitive view of how each symbol's price and volume deviate from their respective averages.
◽️ Display Type: Circles
In this visualization style, z-scores are depicted using circles. Each symbol is horizontally aligned and represented by:
- Solid Circle: Represents the z-score of price.
- Transparent Circle: Represents the z-score of volume.
The vertical position of these circles on the y-axis ranges between -4 and 4, reflecting the z-score value:
- Circles Near the Top: Indicate a high or positive z-score, suggesting the price or volume is well above its average.
- Circles Near the Bottom: Represent a low or negative z-score, pointing to the price or volume being notably below its average.
- Circles Around the Midline (0): Highlight that the price or volume is close to its mean, with minimal deviation.
◽️ Display Type: Delta Columns
There's also an option to utilize Z-Score Delta Columns. For each symbol, a single column is presented, depicting the difference between the z-score of price and the z-score of volume.
The z-score delta essentially captures the disparity between how much the price and volume deviate from their respective mean:
- Positive Delta: Indicates that the z-score of price is greater than the z-score of volume. This suggests that the price has deviated more from its average than the volume has from its own average. Such a scenario could point to price movements being more significant or pronounced compared to the changes in volume.
- Negative Delta: Represents that the z-score of volume is higher than the z-score of price. This might mean that there are substantial volume changes, yet the price hasn't moved as dramatically. This can be indicative of potential build-up in trading interest without an equivalent impact on price.
- Delta Close to 0: Means that the z-scores for price and volume are almost equal, indicating their deviations from the average are in sync.
◽️ Display Type: Z-Volume/Z-Price Heatmap
This visualization offers a heatmap either for volume z-scores or price z-scores across all symbols. Here's how it's presented:
Each symbol is allocated its own horizontal row. Within this row, bar-by-bar data is displayed using a color gradient to represent the z-score values. The heatmap employs a user-defined gradient scale, where a chosen "cold" color represents low z-scores and a chosen "hot" color signifies high z-scores. As the z-score increases or decreases, the colors transition smoothly along this gradient, providing an intuitive visual indication of the z-score's magnitude.
- Cold Colors: Indicate values significantly below the mean (negative z-score)
- Mild Colors: Represent values close to the mean, suggesting minimal deviation.
- Hot Colors: Indicate values significantly above the mean (positive z-score)
This heatmap format provides a rapid, visually impactful means to discern how each symbol's price or volume is behaving relative to its average. The color-coded rows allow you to quickly spot outliers.
VOLUME TYPE
The "Volume Type" input allows you to choose the nature of volume data that will be factored into the volume z-score calculation. The interpretation of indicator’s data changes based on this input. You can opt between:
- Volume (Regular Volume): This is the classic measure of trading volume, which represents the volume traded in a given time period - bar.
- OBV (On-Balance Volume): OBV is a momentum indicator that accumulates volume on up bars and subtracts it on down bars, making it a cumulative indicator that sort of measures buying and selling pressure.
Interpretation Implications:
- For Volume Type: Regular Volume:
Positive Z-Score: Indicates that the trading volume is above its average, meaning there's unusually high trading activity .
Negative Z-Score: Suggests that the trading volume is below its average, signifying unusually low trading activity.
- For Volume Type: OBV:
Positive Z-Score: Signifies that “buying pressure” is above its average.
Negative Z-Score: Signifies that “selling pressure” is above its average.
When comparing Z-Score of OBV to Z-Score of price, we can observe several scenarios. If Z-Price and Z-Volume are convergent (have similar z-scores), we can say that the directional price movement is supported by volume. If Z-Price and Z-Volume are divergent (have very different z-scores or one of them being zero), it suggests a potential misalignment between price movement and volume support, which might hint at possible reversals or weakness.

lib_logLibrary "lib_log"
library for logging and debugging pine scripts
method init(this)
Namespace types: Logger
Parameters:
this (Logger)
method debug(this, message, condition)
Namespace types: Logger
Parameters:
this (Logger) : Logger to add the entry to
message (string) : The Message to add
condition (bool) : optional flag to enable disable logging of this entry dynamically (default: true)
method info(this, message, condition)
Namespace types: Logger
Parameters:
this (Logger) : Logger to add the entry to
message (string) : The Message to add
condition (bool) : optional flag to enable disable logging of this entry dynamically (default: true)
method success(this, message, condition)
Namespace types: Logger
Parameters:
this (Logger) : Logger to add the entry to
message (string) : The Message to add
condition (bool) : optional flag to enable disable logging of this entry dynamically (default: true)
method warning(this, message, condition)
Namespace types: Logger
Parameters:
this (Logger) : Logger to add the entry to
message (string) : The Message to add
condition (bool) : optional flag to enable disable logging of this entry dynamically (default: true)
method error(this, message, condition)
Namespace types: Logger
Parameters:
this (Logger) : Logger to add the entry to
message (string) : The Message to add
condition (bool) : optional flag to enable disable logging of this entry dynamically (default: true)
method debug_bar(this, message, bar, y, y_offset, last_only, condition)
Namespace types: Logger
Parameters:
this (Logger) : Logger object to check global min level condition
message (string) : The string to print
bar (int) : The bar to print the label at (default: bar_index)
y (float) : The price value to print at (default: high)
y_offset (float) : A price offset from y if you want to print multiple labels at the same spot
last_only (bool)
condition (bool)
method info_bar(this, message, bar, y, y_offset, last_only, condition)
Namespace types: Logger
Parameters:
this (Logger) : Logger object to check global min level condition
message (string) : The string to print
bar (int) : The bar to print the label at (default: bar_index)
y (float) : The price value to print at (default: high)
y_offset (float) : A price offset from y if you want to print multiple labels at the same spot
last_only (bool)
condition (bool)
method success_bar(this, message, bar, y, y_offset, last_only, condition)
Namespace types: Logger
Parameters:
this (Logger) : Logger object to check global min level condition
message (string) : The string to print
bar (int) : The bar to print the label at (default: bar_index)
y (float) : The price value to print at (default: high)
y_offset (float) : A price offset from y if you want to print multiple labels at the same spot
last_only (bool)
condition (bool)
method warning_bar(this, message, bar, y, y_offset, last_only, condition)
Namespace types: Logger
Parameters:
this (Logger) : Logger object to check global min level condition
message (string) : The string to print
bar (int) : The bar to print the label at (default: bar_index)
y (float) : The price value to print at (default: high)
y_offset (float) : A price offset from y if you want to print multiple labels at the same spot
last_only (bool)
condition (bool)
method error_bar(this, message, bar, y, y_offset, last_only, condition)
Namespace types: Logger
Parameters:
this (Logger) : Logger object to check global min level condition
message (string) : The string to print
bar (int) : The bar to print the label at (default: bar_index)
y (float) : The price value to print at (default: high)
y_offset (float) : A price offset from y if you want to print multiple labels at the same spot
last_only (bool)
condition (bool)
LogEntry
Fields:
timestamp (series__integer)
bar (series__integer)
level (series__integer)
message (series__string)
Logger
Fields:
min_level (series__integer)
color_logs (series__bool)
max_lines (series__integer)
line_idx (series__integer)
table_pos (series__string)
display (series__table)
log (array__|LogEntry|#OBJ)
High Volume Candles Detector - Open Source CodeGreetings, fellow traders!
Throughout my trading career, I've been intrigued by the dynamic interplay between candlestick patterns and trading volume. This fascination led me to develop an open-source indicator to help illuminate these patterns for the broader trading community.
Upon researching the Public Library, I found that many indicators relating to candlestick/volume analysis are proprietary and not open-source. This discovery further fueled my commitment to contribute a free, accessible tool that traders of all levels can utilize in their technical analysis.
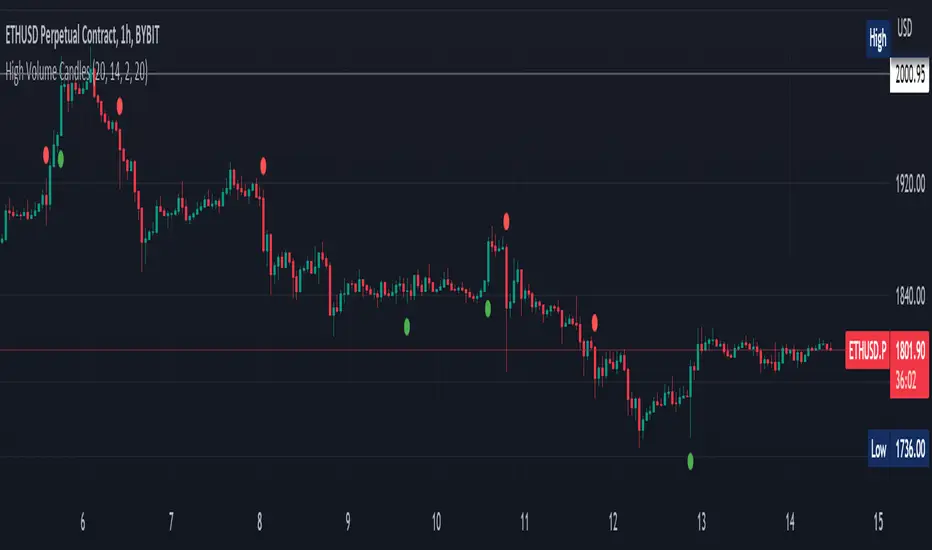
Thus, I am excited to present to you our High Volume Bars Indicator. A unique tool that I believe fills a gap in the Public Library. I truly hope you find it beneficial in your trading journey and that it empowers you to make more informed decisions.
Description:
The High Volume Bars Detector is designed to help traders identify bars with significantly higher volume than the average. Users can filter in the settings menu:
1) The length of the Simple Moving Average (SMA) for volume, allowing you to define the average volume over a specific number of bars.
2) The Volume Multiplier, a factor that determines how much greater the volume of a bar should be compared to the SMA to qualify as a high-volume bar.
3) The Lookback Period, a specified number of candles used as a comparative benchmark for identifying the highest volume.
4) If the Volume bar is green or red, so if the candle price is --> close > open or open > close
Examples to better understand the logic of the indicator:
1) Length of the Simple Moving Average (SMA) for Volume: This setting allows you to define the average volume over a specific number of bars. For instance, if you set the SMA length to 20, the indicator will calculate the average volume of the past 20 bars and use it as a baseline to identify high volume bars.
2) Volume Multiplier: This is a critical factor that determines the threshold for what constitutes a high-volume bar. If you set the volume multiplier to 2.0, for example, the indicator will flag any bar where the volume is twice the value of the SMA volume as a high-volume bar.
3) Lookback Period: This setting lets you specify the number of candles that the indicator should consider when determining the highest volume. For instance, if the lookback period is set to 14, the indicator will compare the volume of the current bar with the volumes of the previous 14 bars. If the current bar's volume is the highest, it will be flagged.
4) Volume Bar Color: This filter helps you identify whether a high-volume bar is bullish or bearish. If the bar is green (close > open), it suggests buyers were dominant during that period. If the bar is red (open > close), it suggests sellers had the upper hand. By setting this filter, you can choose to focus on high volume bars that are either bullish (green) or bearish (red) or both, depending on your trading strategy.
Remember, these filters offer a level of customization that allows you to tailor the High Volume Bars Detector to your unique trading style and requirements. Always remember to adapt these settings to align with your overall trading plan and risk tolerance.
Keep attention!
It is important to note that no trading indicator or strategy is foolproof, and there is always a risk of losses in trading. While this indicator may provide useful information for making conclusions, it should not be used as the sole basis for making trading decisions. Traders should always use proper risk management techniques and consider multiple factors when making trading decisions.
Support me:)
If you find this new indicator helpful in your trading analysis, I would greatly appreciate your support! Please consider giving it a like, leaving feedback, or sharing it with your trading network. Your engagement will not only help me improve this tool but will also help other traders discover it and benefit from its features. Thank you for your support!
Paradigm Trades_VPA Swing IndicatorThe indicator is designed to identify specific patterns in price and volume movements that can signal potential trading opportunities. It does this by calculating several conditions based on the current bar's price and volume movements.
The code defines five conditions: Narrow Spread Up Bar, Wide Spread Down Bar, No Demand Bar, No Selling Bar, and Churning. These conditions are then plotted on the chart using specific shapes and colors. The code also includes alert conditions for each of the signals, which can be used to generate alerts for traders when a particular pattern is identified.
The VPA Swing Indicator can be used as part of a swing trading strategy to identify potential buy or sell signals. For example, a Narrow Spread Up Bar may indicate bullish momentum, while a Wide Spread Down Bar may indicate bearish momentum. Traders can use these signals to make informed trading decisions and manage their risk accordingly.
Legend:
Spread Up Bar: This is a bullish bar with a small spread, indicating a lack of selling pressure and strong buying activity.
Wide Spread Down Bar: This is a bearish bar with a large spread, indicating strong selling pressure and weak buying activity.
No Demand Bar: This is a bearish bar with a small spread and low volume, indicating a lack of buying interest and the smart money selling off their positions.
No Selling Bar: This is a bullish bar with a small spread and low volume, indicating a lack of selling interest and the smart money buying up positions.
Churning: This is a sideways market with narrow spread bars and low volume, indicating the smart money is distributing shares to the retail traders.

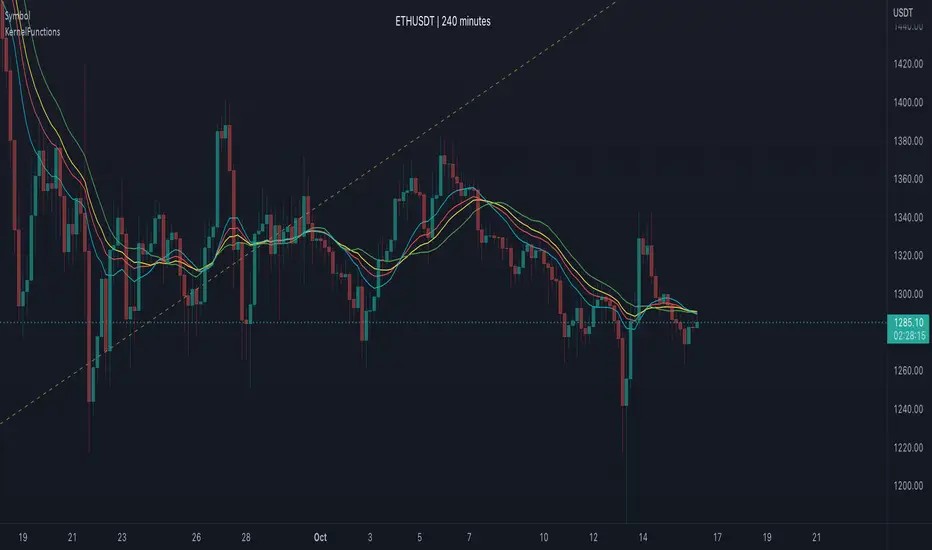
KernelFunctionsLibrary "KernelFunctions"
This library provides non-repainting kernel functions for Nadaraya-Watson estimator implementations. This allows for easy substitution/comparison of different kernel functions for one another in indicators. Furthermore, kernels can easily be combined with other kernels to create newer, more customized kernels. Compared to Moving Averages (which are really just simple kernels themselves), these kernel functions are more adaptive and afford the user an unprecedented degree of customization and flexibility.
rationalQuadratic(_src, _lookback, _relativeWeight, _startAtBar)
Rational Quadratic Kernel - An infinite sum of Gaussian Kernels of different length scales.
Parameters:
_src : The source series.
_lookback : The number of bars used for the estimation. This is a sliding value that represents the most recent historical bars.
_relativeWeight : Relative weighting of time frames. Smaller values result in a more stretched-out curve, and larger values will result in a more wiggly curve. As this value approaches zero, the longer time frames will exert more influence on the estimation. As this value approaches infinity, the behavior of the Rational Quadratic Kernel will become identical to the Gaussian kernel.
_startAtBar : Bar index on which to start regression. The first bars of a chart are often highly volatile, and omitting these initial bars often leads to a better overall fit.
Returns: yhat The estimated values according to the Rational Quadratic Kernel.
gaussian(_src, _lookback, _startAtBar)
Gaussian Kernel - A weighted average of the source series. The weights are determined by the Radial Basis Function (RBF).
Parameters:
_src : The source series.
_lookback : The number of bars used for the estimation. This is a sliding value that represents the most recent historical bars.
_startAtBar : Bar index on which to start regression. The first bars of a chart are often highly volatile, and omitting these initial bars often leads to a better overall fit.
Returns: yhat The estimated values according to the Gaussian Kernel.
periodic(_src, _lookback, _period, _startAtBar)
Periodic Kernel - The periodic kernel (derived by David Mackay) allows one to model functions that repeat themselves exactly.
Parameters:
_src : The source series.
_lookback : The number of bars used for the estimation. This is a sliding value that represents the most recent historical bars.
_period : The distance between repititions of the function.
_startAtBar : Bar index on which to start regression. The first bars of a chart are often highly volatile, and omitting these initial bars often leads to a better overall fit.
Returns: yhat The estimated values according to the Periodic Kernel.
locallyPeriodic(_src, _lookback, _period, _startAtBar)
Locally Periodic Kernel - The locally periodic kernel is a periodic function that slowly varies with time. It is the product of the Periodic Kernel and the Gaussian Kernel.
Parameters:
_src : The source series.
_lookback : The number of bars used for the estimation. This is a sliding value that represents the most recent historical bars.
_period : The distance between repititions of the function.
_startAtBar : Bar index on which to start regression. The first bars of a chart are often highly volatile, and omitting these initial bars often leads to a better overall fit.
Returns: yhat The estimated values according to the Locally Periodic Kernel.
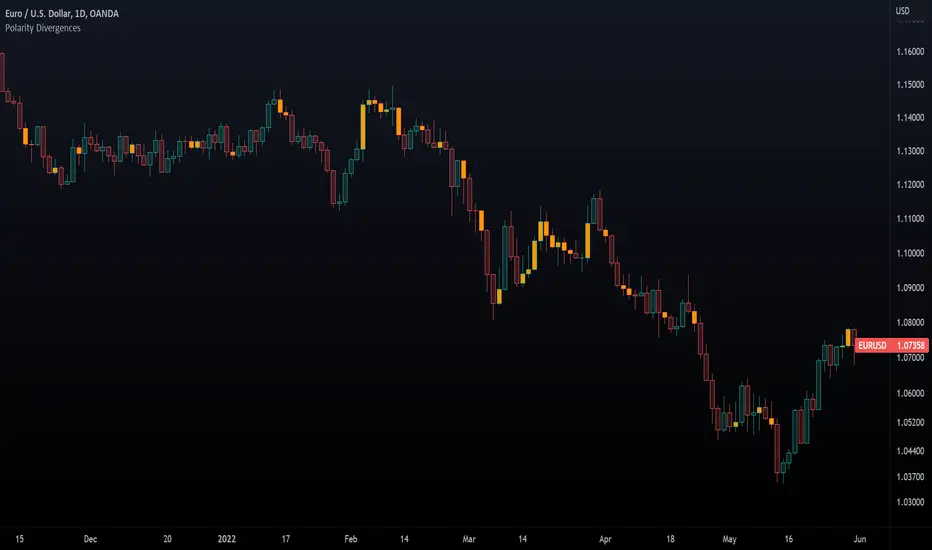
Polarity Divergences█ OVERVIEW
This indicator looks at the polarity of the intrabars composing a chart bar and fills chart candles orange when a majority of intrabars does not have the same polarity as that of the chart bar.
█ CONCEPTS
Bar polarity
By bar polarity , we mean the direction of a bar, which is determined by looking at the bar's close vs its open .
Intrabars
Intrabars are chart bars at a lower timeframe than the chart's. Each 1H chart bar of a 24x7 market will, for example, usually contain 60 bars at the lower timeframe of 1min, provided there was market activity during each minute of the hour. Mining information from intrabars can be useful in that it offers traders visibility on the activity inside a chart bar.
Lower timeframes (LTFs)
A lower timeframe is a timeframe that is smaller than the chart's timeframe. This script determines which LTF to use by examining the chart's timeframe. The LTF determines how many intrabars are examined for each chart bar; the lower the timeframe, the more intrabars are analyzed. This table shows which LTF is used for each range of chart timeframes:
Chart TF LTF
< 1D 1min
< 1W 30min
>= 1W 1D
█ HOW TO USE IT
The idea underlying this indicator is that if the polarity of a chart bar is up or down, the majority of its constituent intrabars should also be up or down. If that is not the case, then we can consider the bar to be abnormal, and so worthy of our attention. You will notice that such anomalies often occur before reversals, but irregularities do not necessarily announce reversals, as they also occur on pauses in trends or in trend-less conditions.
The indicator will update in real time, as intrabars composing the realtime chart bar are gradually built. The closer the realtime bar is to being closed, the more reliable the result will be, as that is when the indicator can analyze the most intrabars.
█ NOTES FOR Pine Script™ CODERS
This script uses the recently released request.security_lower_tf() Pine Script™ function discussed in this blog post . It works differently from the usual request.security() in that it can only be used at LTFs, and it returns an array containing one value per intrabar. This makes it much easier for programmers to access intrabar information.
A script can access a maximum of 100K intrabars; that is the reason we step the LTF by taking into account the chart's timeframe. By progressively increasing the LTF as the chart's timeframe increases, we provide users with optimal coverage of the chart bars. Always using a 1min LTF would, for example, limit the chart coverage to the last 69 bars on a 1D chart of a 24x7 market because each chart bar will usually contain 1440 intrabars (100K / 1440 = 69.4). By using a 30min LTF for 1D charts, we cover 100K / 48 = 2083 bars.
Look first. Then leap.
Realtime FootprintThe purpose of this script is to gain a better understanding of the order flow by the footprint. To that end, i have added unusual features in addition to the standard features.
I use "Real Time 5D Profile by LucF" main engine to create basic footprint(profile type) and added some popular features and my favorites.
This script can only be used in realtime, because tradingview doesn't provide historical Bid/Ask date.
Bid/Ask date used this script are up/down ticks.
This script can only be used by time based chart (1m, 5m , 60m and daily etc)
This script use many labels and these are limited max 500, so you can't display many bars.
If you want to display foot print bars longer, turn off the unused sub-display function.
Default setting is footprint is 25 labels, IB count is 1, COT high and Ratio high is 1, COT low and Ratio low is 1 and Delta Box Ratio Volume is 1 , total 29.
plus UA , IB stripes , ladder fading mark use several labels.
///////// General Setting ///////////
Resets on Volume / Range bar
: If you want to use simple time based Resets on, please set Total Volume is 0.
Your timeframe is always the first condition. So if you set Total Volume is 1000, both conditions(Volume >= 1000 and your timeframe start next bar) must be met. (that is, new footprint bar doesn't start at when total volume = exactly 1000).
Ticks per row and Maximum row of Bar
: 1 is minimum size(tick). "Maximum row of Bar" decide the number of rows used in one footprint. 1 row is created from 1 label, so you need to reduce this number to display many footprints (Max label is 500).
Volume Filter and For Calculation and Display
: "Volume Filter" decide minimum size of using volume for this script.
"For Calculation and Display" is used to convert volume to an integer.
This script only use integer to make profile look better (I contained Bid number and Ask number in one row( one label) to saving labels. This require to make no difference in width by the number of digits and this script corresponds integers from 0 to 3 digits).
ex) Symbol average volume size is from 0.0001 to 0.001. You decide only use Volume >= 0.0005 by "Volume Filter".
Next, you convert volume to integer, by setting "For Calculation and Display" is 1000 (0.0005 * 1000 = 5).
If 0.00052 → 5.2 → 5, 0.00058 → 5.8 → 6 (Decimal numbers are rounded off)
This integer is used to all calculation in this script.
//////// Main Display ///////
Footprint, Total, Row Delta, Diagonal Delta and Profile
: "Footprint" display Ask and Bid per row. "Total" display Ask + Bid per row.
"Row Delta" display Ask - Bid per row. "Diagonal Delta" display Ask(row N) - Bid(row N -1) per row.
Profile display Total Volume(Ask + Bid) per row by using Block. Profile Block coloring are decided by Row Delta value(default: positive Row Delta (Ask > Bid) is greenish colors and negative Row Delta (Ask < Bid) is reddish colors.)
Volume per Profile Block, Row Imbalance Ratio and Delta Bull/Bear/Neutral Colors
: "Volume per Profile Block" decide one block contain how many total volume.
ex) When you set 20, Total volume 70 display 3 block.
The maximum number of blocks that can be used per low is 20.
So if you set 20, Total volume 400 is 20 blocks. total volume 800 is 20 blocks too.
"Row Imbalance Ratio" decide block coloring. The row imbalance is that the difference between Ask and Bid (row delta) is large.
default is x3, x2 and x1. The larger the difference, the brighter the color.
ex) Ask 30 Bid 10 is light green. Ask 20 Bid 10 is green. Ask 11 Bid 10 is dark green.
Ask 0 Bid 1 is light red. Ask 1 Bid 2 is red. ask 30 Bid 59 is dark green.
Ask 10 Bid 10 is neutral color(gray)
profile coloring is reflected same row's other elements(Ask, Bid, Total and Delta) too.
It's because one label can only use one text color.
/////// Sub Display ///////
Delta, total and Commitment of Traders
: "Delta" is total Ask - total Bid in one footprint bar. Total is total Ask + total Bid in one footprint bar.
"Commitment of traders" is variation of "Delta". COT High is reset to 0 when current highest is touched. COT Low is opposite.
Basic concept of Delta is to compare price with Delta. Ordinary, when price move up, delta is positive. Price move down is negative delta.
This is because market orders move price and market orders are counted by Delta (although this description is not exactly correct).
But, sometimes prices do not move even though many market orders are putting pressure on price , or conversely, price move strongly without many market orders.
This is key point. Big player absorb market orders by iceberg order(Subdivide large orders and pretend to be small limit orders.
Small limit orders look weak in the order book, but they are added each time you fill, so they are more powerful than they look.), so price don't move.
On the other hand, when the price is moving easily, smart players may be aiming to attract and counterattack to a better price for them.
It's more of a sport than science, and there's always no right response. Pay attention to the relationship between price, volume and delta.
ex) If COT Low is large negative value, it means many sell market orders is coming, but iceberg order is absorbing their attack at limit order.
you should not do buy entry, only this clue. but this is one of the hints.
"Delta, Box Ratio and Total texts is contained same label and its color are "Delta" coloring. Positive Delta is Delta Bull color(green),Negative Delta is Delta Bear Color
and Delta = 0 is Neutral Color(gray). When Delta direction and price direction are opposite is Delta Divergence Color(yellow).
I didn't add the cumulative volume delta because I prefer to display the CVD line on the price chart rather than the number.
Box Ratio , Box Ratio Divisor and Heavy Box Ratio Ratio
: This is not ordinary footprint features, but I like this concept so I added.
Box Ratio by Richard W. Arms is simple but useful tool. calculation is "total volume (one bar) divided by Bar range (highest - lowest)."
When Bull and bear are fighting fiercely this number become large, and then important price move happen.
I made average BR from something like 5 SMA and if current BR exceeds average BR x (Heavy Box Ratio Ratio), BR box mark will be filled.
Box Ratio Divisor is used to good looking display(BR multiplied by Box Ratio Divisor is rounded off and displayed as an integer)
Diagonal Imbalance Count , D IB Mark and D IB Stripes
: Diagonal Imbalance is defined by "Diagonal Imbalance Ratio".
ex) You set 2. When Ask(row N) 30 Bid(row N -1)10, it's 30 > 10*2, so positive Diagonal Imbalance.
When Ask(row N) 4 Bid(row N -1)9, it's 4*2 < 9, so negative Diagonal Imbalance.
This calculation does not use equals to avoid Ask(row N) 0 Bid(row N -1)0 became Diagonal Imbalance.
Ask(row N) 0 Bid(row N -1)0, it's 0 = 0*2, not Diagonal Imbalance. Ask(row N) 10 Bid(row N -1)5, it's 10 = 5*2, not Diagonal Imbalance.
"D IB Mark" emphasize Ask or Bid number which is dominant side(Winner of Diagonal Imbalance calculation), by under line.
"Diagonal Imbalance Count" compare Ask side D IB Mark to Bid side D IB Mark in one footprint.
Coloring depend on which is more aggressive side (it has many IB Mark) and When Aggressive direction and price direction are opposite is Delta Divergence Color(yellow).
"D IB Stripes" is a function that further emphasizes with an arrow Mark, when a DIB mark is added on the same side for three consecutive row. Three consecutive arrow is added at third row.
Unfinished Auction, Ratio Bounds and Ladder fading Mark
: "Unfinished Auction" emphasize highest or lowest row which has both Ask and Bid, by Delta Divergence Color(yellow) XXXXXX mark.
Unfinished Auction sometimes has magnet effect, price may touch and breakout at UA side in the future.
This concept is famous as profit taking target than entry decision.
But, I'm interested in the case that Big player make fake breakout at UA side and trapped retail traders, and then do reversal with retail traders stop-loss hunt.
Anyway, it's not stand alone signal.
"Ratio Bounds" gauge decrease of pressure at extreme price. Ratio Bounds High is number which second highest ask is divided by highest ask.
Ratio Bounds Low is number which second lowest bid is divided by lowest bid. The larger the number, the less momentum the price has.
ex)first footprint bar has Ratio Bounds Low 2, second footprint bar has RBL 4, third footprint bar has RBL 20.
This indicates that the bear's power is gradually diminishing.
"Ladder fading mark" emphasizes the decrease of the value in 3 consecutive row at extreme price. I added two type Marks.
Ask/Bid type(triangle Mark) is Ask/Bid values are decreasing of three consecutive row at extreme price.
Row Imbalance type(Diamond Mark) are row Imbalance values are decreasing of three consecutive row at extreme price.
ex)Third lowest Bid 40, second lowest Bid 10 and lowest Bid 5 have triangle up Mark. That is bear's power is gradually diminishing.
(This Mark only check Bid value at lowest price and Ask value at highest price).
Third highest row delta + 60, second highest row delta + 5, highest delta - 20 have diamond Mark. That is Bull's power is gradually diminishing.
Sub display use Delta colors at bottom of Sub display section.
////// Candle & POC /////////
candle and POC
: Ordinary, "POC" Point of Control is row of largest total volume, but this script'POC is volume weighted average.
This is because the regular POC was visually displayed by the profile ,and I was influenced LucF's ideas.
POC coloring is decided in relation to the previous POC. When current POC is higher than previous POC, color is UP Bar Color(green).
In the opposite case, Down Bar color is used.
POC Divergence Color is used when Current POC is up but current bar close is lower than open (Down price Bar),or in the opposite case.
POC coloring has option also highlight background by Delta Divergence Color(yellow). but bg color is displayed at your time frame current price bar not current footprint bar.
The basic explanation is over.
I add some image to promote understanding basic ideas.

Entanglement Penscript name: Entanglement Pen
For left traders, how to accurately find the bottom and top is very important, and there are various methods. I have shared the bottom type script composed of three bars before, but this type of bottom type is effective in a small range. So, this script is sharing " Entanglement Pen ", which can help us determine bottoms and tops on a global scale.
However, this script uses an approximate reduction method rather than the orthodox solution of entanglement.
After roughly finding the bottom and top, how to determine that these are the bottom and top that meet the definition of entanglement theory?
The main 2 methods of "approximate reduction" are:
(1) The price difference between the top and the bottom is large enough, that is: the lowest price at the top > the highest price at the bottom.
(2) The stock price before the top has continued to rise, that is: both the highest point and the lowest point are rising. In the same way, the stock price before the bottom has a continuous decline, that is: both the high and the low point are falling.
A big disadvantage of this script is that it needs to use future data. This is because:
When multiple bars meet the top definition in a short period of time, only the last bar is used, which is defined as a big top. So, when you see a top appear, you don't know it's not a real top, because it might be followed by a bar that also matches the definition of the top.
When displayed on the graph, bars that meet the top definition have a gray label, which is the small top. Each small top is a big top (with a blue label) at the beginning, and when another small top appears after it, it becomes a gray small top.
Regarding the limit on the number of bars by TradingView:
The logic of calculating the small top and the small bottom is relatively simple, it does not need to use future data, and the amount of calculation is small, so it is the default TradingView limit. (The limit is 2000 in the script, but in practice TradingView won't let us use such many bars)
The calculation logic of the big top and the big bottom is more complicated, and it needs to use future data. The calculation amount is very large, and only the most recent 150 bars can be calculated. The user can try to enter a larger value, but TradingView may report an error. If an error occurs, please enter a lower value. When loading for the first time, it takes a long time, which is indeed not common in general TradingView scripts, but please be patient.
The next version may add the alert function, that is: when the top and bottom appear, the alert function is called. But this only applies to small tops and bottoms, because when the alert is sent,, none of us know what data will be in the future.
Introduction in Chinese:
脚本名称:缠论笔
对于左侧交易者来说,如何准确地找到底部和顶部是非常重要的,方法也是多样的,之前已经分享了三根bar组成的底分型脚本,但这种底分型生效的范围较小,缺乏全局视野。所以,这次的脚本分享的是“缠论笔”,它能帮我们在全局尺度内确定底部和顶部。
不过,此脚本使用的是近似还原的方法,而非缠论的正统解法。
粗略找到底和顶之后,如何确定这就是符合缠论定义的底和顶呢?
“近似还原”的主要2个方法是:
(1)顶部与底部的价差足够大,即:顶部的最低价>底部的最高价。
(2)顶部之前的股价有持续的上涨,即:最高点和最低点都在上涨。同理,底部之前的股价有持续的下跌,即:最高点和最低点都在下跌。
这个脚本的一大缺点是:需要使用将来的数据。这是因为:
当短期内有多个bar都符合顶部定义时,只使用最后一个bar,定义为大顶。所以,当你看到一个顶部出现时,你不知道这不是真的顶部,因为它之后可能还会出现符合顶部定义的bar。
在图上显示时,符合顶部定义的bar有灰色的label,这是小顶。每一个小顶,刚开始时都是大顶(有蓝色的label),直到它之后又有小顶出现时,它就变成了灰色的小顶。
关于TradingView对bar数的限制:
计算小顶和小底的逻辑比较简单,不需要使用将来的数据,计算量较小,所以是默认的TradingView限制。(脚本中限制为2000,但实际上TradingView不会让我们使用那么多bar)
大顶和大底的计算逻辑比较复杂,需要使用将来的数据,计算量非常大,大约只能计算最近150根bar。用户可以尝试输入更大的数值,但TradingView可能会报错。若遇报错,则请输入更低的数值。初次加载时,需要等待较长时间,这确实在一般的TradingView脚本中并不常见,但还是请多些耐心。
下一版可能会增加alert功能,即:当顶部和底部出现时,调用alert函数。但这只适用于小顶和小底,因为警报发出时,我们谁也不知道将来的数据。

Trading Made Easy ATR BandsAs always, this is not financial advice and use at your own risk. Trading is risky and can cost you significant sums of money if you are not careful. Make sure you always have a proper entry and exit plan that includes defining your risk before you enter a trade.
Background:
This is my take on two relatively famous indicators that paint the colour of your candles in order to help identify trend direction and smooth out market noise. The Elder Impulse System was designed by Dr . Alexander Elder in his book Come Into My Trading Room and attempts to identify the change of trends and when these trends speed up and slow down (school.stockcharts.com). The system used a 13 period EMA and a MACD histogram, and compared each of these indicators to the previous period. In short, when both the histogram and the EMA were rising, the trend was accelerating to the upside and when both were falling, accelerating to the downside. Conversely, when the indicators were not in alignment, say the MACD falling but the EMA rising, it signaled a slowing down of momentum. The downside of this indicator is that it be can rather jumpy, focusing on a short period EMA for 50% of its calculation, leaving a trader to potentially sit on the sidelines during opportune pull backs to enter winning positions, or exit early when there is still a lot of gas left in the tank.
A similar concept has been employed by John Carter and his organization, SimplerTrading, with the 10X bars indicator. However, here they use the famous Directional Movement Index (DMI) created by J. Welles Wilder as the basis for their bars (www.simplertrading.com). John Carter states that the use of this indicator can lead to getting in earlier on more, bigger, and faster setups. The downside of this indicator is the reliance on the ADX calculations to keep you out of rangebound trades. Anyone who is familiar with the DMI system understands it has unparalleled ability to identify longer term trends, but it is also quite slow, leaving the trader to miss a good portion of the initial runup due to this ADX portion that is very slow to get moving and also slow to signal exits.
In short, both of these systems are designed with one thing in mind: keeping the trader on the right side of the move --- but both suffer from the same issue but on opposite sides of the spectrum. One is too fast and the other is too slow. Ultimately, leaving profits on the table for the trader when such a situation could be avoided.
Here I present my own take on these and have made the “Trading Made Easy ATR Bands”. I name it this because trading is much easier when you trade with the prevailing trend, and this system identifies these periods quite effectively while doing a better job of handling the speed flux of most markets. The base formula uses the DMI as its main calculation and the relationship between the DMI+ and DMI- lines, respectively, like the 10X bars. While the trader can investigate these on their own to understand these more intimately, essentially the DMI+ and DMI- lines are calculating the highs and lows respectively of each bar compared to a period in the past and smoothed with the true range, a measurement of volatility . What this ultimately presents is a picture of uptrends and downtrends, where price is making consistently more highs or more lows over a period of time. Where I have modified this relative to the 10X bars is I have ignored the ADX calculations. Further, values over 25 have been discussed as “strong” momentum, in my calculations, I have sped this up to 20 to get a trader into the move earlier. Second, I have added an additional calculation based around the 21-period exponential moving average calculated against its previous output. This then, like the Elder Impulse System, has two forms of market momentum as its calculation to smooth out noise, but has the benefit of being less jumpy, like the original 10X bar system. I have added a series of exponential moving averages following the Fibonacci sequence from 8-144 as a system of dynamic support and resistance showing the sentiment of both the shorter and longer term market participants. Last, I have added a series of Keltner Channels , from 1X-4X, that encompass the 21 period EMA as a base line. The 21 EMA is a stable in all of John Carter’s work and I do believe he is correct that the market is mostly structured around this line, since it roughly approximates one month of trading data. It is not uncommon to see price expand and contract back to this line over and over again.
Trade Signals:
Strong Bullish Momentum – The system will generate a green bar when the DMI+ line is over the DMI- line, the DMI+ line is equal or greater than 20 and the 21 EMA has increased relative to its last close.
Weak Bullish Momentum – The system will generate a blue bar in several scenarios. First, when the DMI+ line is over the DMI- line but the DMI+ line is not over 20 and the EMA is equal or less than the previous close. It will also print a blue bar if either the DMI or the EMA are not aligned, such as the DMI+ is over the DMI- but not over 20 but the EMA has risen compared to the last bar. Last, it will also print a blue bar if the DMI- is over the DMI+ but the EMA is rising.
Strong Bearish Momentum – The system will generate a red bar when the DMI- line is over the DMI+ line, the DMI- line is equal or greater than 20, and the 21 EMA has fallen relative to its last close.
Weak Bearish Momentum – The system will generate an orange bar in several scenarios. First when the DMI- line is over the DMI+ line but the DMI- line is not over 20 and the EMA is equal or greater than the last bar. It will also print an orange bar if either the DMI or the EMA are not aligned, such as the DMI- is over the DMI+ but not over 20 but the EMA has fallen. Lastly, it will also print an orange bar if the DMI+ line is over the DMI- and the EMA has fallen relative to the last bar.
Uses:
1) Like the Elder Impulse System and 10X Bar systems, these should be used as trade filters only.. It is in the trader’s best interest to trade with the trends and these bars identify these periods but may not always generate the most opportune time to enter a market. For instance, trying to short a market when the market is in a phase of Strong Bullish Momentum would not be wise, and vice versa with trying to open long positions when the market is exhibiting Strong Bearish Momentum. Use multiple forms of evidence to confirm the signals shown before entering any trade and to not take these signals on their without confluence of ideas. A viable system could use the Elder Triple Screen System (for reference, see this decent write up --- www.dailyforex.com) with the Trading Made Easy Bands as your “Tide” or longer term filter, and a further trading plan to establish an entry on a short time frame pull back.
2) Interim Trend Exhaustion – Keltner channels work as moving standard deviations from the 21 EMA . 3X multipliers will encompass 99.7% of price and 4X will encompass 99.9% of price away from the 21 EMA . During a trend it would be a good idea to lock in partial profits when price reaches these outer extrema as it is very highly probable that a retracement back to the mean is approaching. While not part of the system, and not recommended to be used by this system, a mean reversion trader could in theory look for reversals at these extrema points and trade a mean reversion strategy back to the 21EMA, but is a much riskier trade with lower probability of success. A trend trader should look to enter trades when a signal is given within the 1ATR or 2ATR zone as this is when price has not really started accelerating yet and is likely to see continued momentum in that direction.

Smoothed Waddah ATR~~~All Credit to LAZY BEAR for posting the original Script which is an old MT4 indicator.~~~~
No this system does not repaint... if it does let me know. Either the code is wrong or you are using a repainting chart such as renko candles.
*PURPOSE*
This Is an "Enhanced or Smoothed" version of the script that captures the heiken-ashi closing price as its main calculation variable. While using normal bar or line charts. Enhancements integrate trade filters to reduce false signals.
*WHAT TYPE OF TRADING STRATEGY IS THIS?*
This is a Long Only, Trend Trading System. Is intended to be applied to Charts/Timeframes that produce sustainable trends for which ever asset you are trading.
*NOTE OF ADVICE REGARDING SETTINGS*
Settings can be tweaked but I have found that best results come with the given settings. If a chart is too choppy to trade this indicator successfully, it is advised not to change the settings but either find a different timeframe or different asset to apply this strategy to.
TLDR
Indicator measures the change of the MacD (difference between MAC D of given EMA's) and compares it to the difference between the Upper and Lower Bollinger bands. Green bar over trigger line= entry. Red bar over trigger line = close.
*SETTINGS AND INPUTS*
-MacD of HeikenAshi chart (will always be of the Heikenashi chart even when applied to different chart type)
sensitivity = input(150, title='Sensitivity') =range should be (125-175)multiplier so that MacD can be compared to BB
fastLength = input(20, title='MacD FastEMA Length')
slowLength = input(40, title='MacD SlowEMA Length')
-Bollinger Band of currently used price chart type
channelLength = input(20, title='BB Channel Length')
mult = input(1.5, title='BB Stdev Multiplier')
-14 Period RSI Trade Filter (set to 0 to Disable)
RSI14filter = input(40, title='RSI Value trade filter') =only gives entry when RSI is higher than given value
*ABSTRACT & CONCEPT*
TLDR - Indicator measures the change of the MacD (difference between MAC D of given EMA's) and compares it to the difference between the Upper and Lower Bollinger bands. Green bar over trigger line= entry. Red bar over trigger line = close.
Indicator plots -
Bars are the change in the MAC D and the indicator line is the difference in the BB.
When Bars are higher than the indicator line then it is considered a trend "Explosion"
Green Bars are Trend Explosion to the upside, Red Bars are Trend explosion to the downside.
GENERAL DETAIL-
the core calculation is measuring the change in MacD of current candle compared to the MacD of two previous candles.
This value is multiplied by the sensitivy so it can be compared to the change in Bollinger Band Width.
if the MACD change is positive then you get a green/lime bar for that value. If the MacDchange is negative you get a red/orange bar for that value.
and are determined by whether the actual change is increasing in that direction or decreasing. (bars getting taller or bars getting shorter)
Entry signal for long is A positive change in MACD difference (Green bar) that is greater than the change of the bollinger band (orange signal line) AND if the RSI value is above your filter.
Close signal or Trend Stop Warning Signal is given when a Negative MacD Difference (red bar) is greater than the change of the bollinger band (orange Line)
*CONSIDERATIONS AND THOUGHTS*
I have over 150 iterations of this indicator and this is the most consistent and best version of settings and filters I was able to generate. I built this indicator specifically for 3 charts. SPY monthly, QQQ monthly, BTC 3 Day. However this indicator works well on any long term bullish chart. (tech stocks are great) .
Trend trading systems are intended to be homerun hitting, plunge protecting indicators that allow for long legs and expanding volatility. This indicator does this as the trigger line is Dynamic with the expansion and contraction of the bollinger band.
I do not take every signal specifically not the close signals. Instead they more like warnings in ultra bullish environments.
If i had to pair this indicator with any other filter than the RSI, it would be a long term moving average i.e. the 50 week or equivalent for your chart. signals above rising moving averages means that you are trading with an upward trending market.
Hope this helps. Happy trades.
-SnarkyPuppy

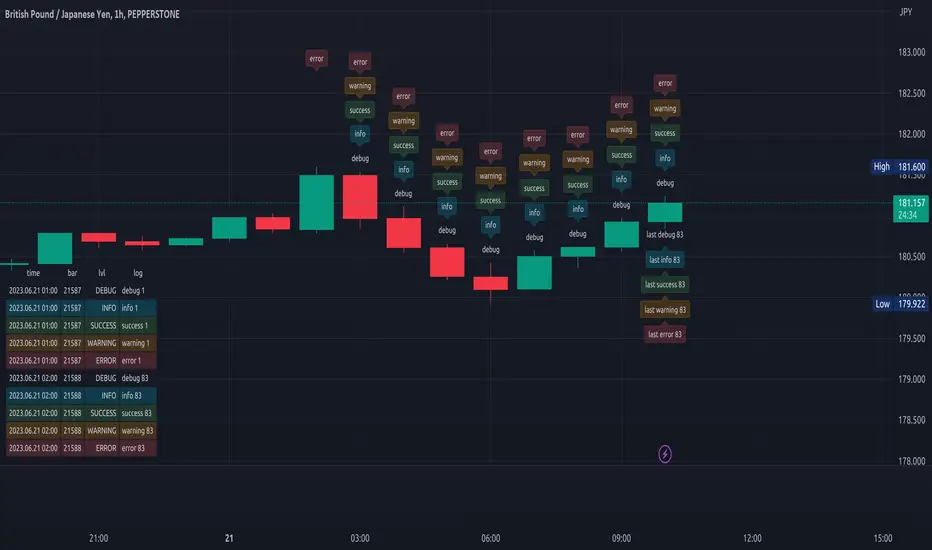
logLibrary "log"
A Library to log and display messages in a table, with different colours.
The log consists of 3 columns:
Bar Index / Message / Log
Credits
QuantNomad - for his idea on logging messages as Error/Warnings and displaying the color based on the type of the message
setHeader(_t, _location, _header1, _header2, _header3, _halign, _valign, _size) Sets the header for the table to be used for displaying the logs.
Parameters:
_t : table, table to be used for printing
_location : string, Location of the table.
_header1 : string, the name to put into the Index Queue Header. Default is 'Bar #'
_header2 : string, the name to put into the Message Queue Header. Default is 'Message'
_header3 : string, the name to put into the Log Queue Header. Default is 'Log'
_halign : string, the horizontal alignment of header. Options - Left/Right/Center
_valign : string, the vertical alignment of header. Options - Top/Bottom/Center
_size : string, the size of text of header. Options - Tiny/Small/Normal/Large/Huge/Auto
Returns: Void
initHeader(_location, _rows, _header1, _header2, _header3, _halign, _valign, _size, _frameBorder, _cellBorder) Creates the table for logging.
3 columns will be displayed.
Bar Index Q / Message Q / Log Q
Parameters:
_location : string, Location of the table.
_rows : int, table size, excluding the header. Default value is 40.
_header1 : string, the name to put into the Index Queue Header. Default is 'Bar #'
_header2 : string, the name to put into the Message Queue Header. Default is 'Message'
_header3 : string, the name to put into the Log Queue Header. Default is 'Log'
_halign : string, the horizontal alignment of header. Options - Left/Right/Center
_valign : string, the vertical alignment of header. Options - Top/Bottom/Center
_size : string, the size of text of header. Options - Tiny/Small/Normal/Large/Huge/Auto
_frameBorder : int, table Frame BorderWidth. Default value is 1.
_cellBorder : int, table Cell Borders Width, Default value is 2.
Returns: table
init(_rows) Initiate array variables for logging.
Parameters:
_rows : int, table size, excluding the header. Default value is 40.
Returns: tuple, arrays - > error code Q, bar_index Q, Message Q, Log Q
log(_ec, _idx, _1, _2, _m1, _m2, _code, _prefix, _suffix) logs a message to logging queue.
Parameters:
_ec : int , Error/Codes (1-7) for colouring.
Default Colour Code is 1 - Gray, 2 - Orange, 3 - Red, 4 - Blue, 5 - Green, 6 - Cream, 7 - Offwhite
_idx : int , bar index Q. The index of current bar is logged automatically
you can add before and after this index value, whatever you choose to, via the _prefix and _suffix variables.
_1 : string , Message Q.
_2 : string , Log Q
_m1 : string, message needed to be logged to Message Q
_m2 : string, detailed log needed to be logged to Log Q
_code : int, Error/Code to be assigned. Default code is 1.
_prefix : string, prefix to Bar State Q message
_suffix : string, suffix to Bar State Q message
Order of logging would be Bar Index Q / Message Q / Log Q
Returns: void
resize(_ec, _idx, _1, _2, _rows) Resizes the all messaging queues.
a resize will delete the existing table, so a new header/table has to be initiated after the resize.
This is because pine doesnt allow changing the table dimensions once they have been recreated.
If size is decreased then removes the oldest messages
Parameters:
_ec : int , Error/Codes (1-7) for colouring.
_idx : int , bar index Q.
_1 : string , Message Q.
_2 : string , Log Q
_rows : int, the new size needed for the queue. Default value is 40.
Returns: void
print(_t, _ec, _idx, _1, _2, halign, halign, _size) Prints Bar Index Q / Message Q / Log Q
Parameters:
_t : table, table to be used for printing
_ec : int , Error/Codes (1-7) for colouring.
Default Colour Code is 1 - Gray, 2 - Orange, 3 - Red, 4 - Blue, 5 - Green, 6 - Cream, 7 - Offwhite
_idx : int , for bar index Q.
_1 : string , Message Q.
_2 : string , Log Q
halign : string, the horizontal alignment of all message column. Options - Left/Right/Center
halign : string, the vertical alignment of all message column. Options - Top/Bottom/Center
_size : string, the size of text across the table, excepr the headers. Options - Tiny/Small/Normal/Large/Huge/Auto
Returns: void
printx(_t, _idx, _1, _2, _ec, _fg, _bg, _halign, _valign, _size) Prints Bar Index Q / Message Q / Log Q, but with custom options to format the table and colours
Parameters:
_t : table, table to be used for printing
_idx : int , for bar index Q.
_1 : string , Message Q.
_2 : string , Log Q
_ec : int , Error/Codes (1-7) for colouring.
_fg : color , Color array specifying colours for foreground. Maximum length is seven. Need not provide all seven, but atleast one. If not enough provided then last colour in the array is used for missing codes
_bg : color , Same as fg.
_halign : string, the horizontal alignment of all message column. Options - Left/Right/Center
_valign : string, the vertical alignment of all message column. Options - Top/Bottom/Center
_size : string, the size of text across the table, excepr the headers. Options - Tiny/Small/Normal/Large/Huge/Auto
Returns: void
flush(_t, _idx, _1, _2, _ec) Clears queues of existing messages, filling with blanks and 0
Parameters:
_t : table, table to be flushed
_idx : int , for bar index Q.
_1 : string , Message Q.
_2 : string , Log Q
_ec : int , Error/Codes (1-7) for colouring.
Returns: void.
erase(_idx, _1, _2, _ec) Deletes message queue and the table used for displaying the queue
Parameters:
_idx : int , for bar index Q.
_1 : string , Message Q.
_2 : string , Log Q
_ec : int , Error/Codes (1-7) for colouring.
Returns: void

Elder Impulse System + ATR BandsDisregard the above chart, I am not sure why it isn't showing the one I want, which is linked below:
This is as far as I can tell the closest representation to Dr. Alexander Elder's updated "Elder Impulse System" that has added ATR-volatility bands up to 3x deviations from price. I got the idea from watching this recent video (www.youtube.com) of Dr. Elder reviewing some recent trades and noticed he had updated his system from his original books. The Impulse System colour coding was inspired by AstralLoverFlow and LazyBear. ATR Bands are pre-programmed Keltner Channels with some modifications such as filing in the ATR Zones with user-selected colour bands and modifying the ATR value to better suit the volatility of the market being traded.
The script has several components, which I will detail below:
Exponential Moving Averages:
1) A 13-period EMA that is used as a staple in all of Dr. Elder's technical analysis. He uses this EMA as the basis for all of his indicators and why it is included here.
2) A 26-period EMA which can be used as a base-line of sorts to filter when to go long or when to go short. For instance, price over the 26-EMA, price is strong and the rally upwards is likely to continue, underneath it, price is weak and likely to continue downwards for a time.
Volatility Bands:
By definition these are nothing more than 3 separate Keltner Channels of a 13-period EMA each set to one additional multiplier from the moving average. This gives us a 1x, 2x, and 3x multiplier of average volatility from the 13-period EMA based on a 14-period Average True Range (ATR) reading. The ATR was chosen as it accommodates price gaps and also is the standard formula calculation in TradingView. The values of the bands cannot be adjusted but the colour coding of them can be.
Elder Impulse System:
These colour-coded bars show you the strength and direction of the current chart resolution, calculated by the slope of a 13-period EMA and the slope of a MACD histogram. These are used not as a buying or selling recommendation alone but as trend filters, as per Dr. Elder's own description of them.
Green Bars = The 13-period EMA is sloping positively and the MACD histogram is rising compared to previous bars. The trader should only consider buying/long opportunities when a green bar is most recent.
Red Bars = The 13-period EMA is sloping negatively and the MACD histogram is falling compared to previous bars. The trader should only consider selling/short opportunities when a red bar is most recent.
Blue Bars = The 13-period EMA and the MACD histogram are not aligned. One of the indicators is sloping opposite to the other indicator. These are known as indecision bars and are typically seen near the end of a previously established trend. The trader can choose to wait for either a green or red bar to shape their trading bias if they are more risk-averse while a counter-trend trader may decide to try opening a position against the currently-established trend.
How To Trade the System:
This system is unique in that it is so versatile and will fit the styles of many traders, be it trend following traders (generally the original Elder Impulse System design) or mean-reversion/counter-trend trading (the original Keltner Channel design). None of the examples below or in the chart above are financial advice and are just there for demonstration purposes only.
1) The most basic signal given would be the moving average cross up or down. A cross of the 13-EMA over the 26-EMA signals upward trend strength and the trader could look for buying opportunities. Conversely, the 13-EMA under the 26-EMA shows downward trend strength and the trader could look for selling opportunities.
2) Following the Elder Impulse system in conjunction with the EMAs. Look for long opportunities when a green bar is printed and price is over both of the 13- and 26-period EMAs. Look for short opportunities when a red bar is printed and price is below both of the 13- and 26-period EMAs. Keep in mind this does not necessarily need a moving average cross to be viable, a green or red bar over both EMAs is a valid signal in this system, usually. Examine price more closely for better entry signals when a blue bar is printed and price is either above or below both EMAs if you are a trend trader. This is how Dr. Elder originally intended the system to be used in conjunction with his famous Triple Screen Trading System. I am not going into detail here as it is a deep subject but I would suggest an interested trader to examine this Triple Screen System further as it is widely accepted as a strong strategy.
3) Mean Reversion and Counter-Trend Trading. Dr. Elder mentions that the zone between the two EMAs is called the Value Zone. A mean reversion trader could look for buying opportunities if price has generally been in an uptrend and falls back to value, conversely, they could look for shorting opportunities if price has generally been in a downtrend and rises back to value. These are your very basic pull backs found in trends that create your higher lows in an uptrend or your lower highs in a downtrend. A mean reversion/scalper trader may also look to use the upper and lower most ATR bands as an indication of price being overbought or oversold and could look to enter a counter-trend trade here once a blue indecision bar is printed and to ride that move back down to the Value Zone.
Taking Profits and Risk Management
This system again is very versatile and will fit a wide range of trading styles. It has built in take profit levels and risk management depending on your style of trading.
1a) In original Triple Screen Trading (and the original Elder Impulse system), a trader was to place a buy order one tick above a newly printed green bar with a stop loss one tick below the most recent 2-day low, and vice-versa for red bars on short selling. as long as other criteria were met, that I will not go into. It is all over YouTube and in his books and on Investopedia if you want more information. The general idea is to continue the trend in the direction if price is strong and you are bought into that move with a close stop, or if price falls back a little bit, you can get in at a better price. This would be a system typically better suited to a scalper.
1b) The updated risk management according to the above video is to place a stop loss at least 2ATR away from price. These bands already have calculated these values so a trader can place a stop one tick below the 2 or even 3ATR zones depending on their risk appetite. This is assuming you have already received a strong buy signal based on the system you follow. This would be a system typically better suited to a trend-trader.
2a) Taking profits if you are a trend trader has several possibilities. The first, as Dr. Elder suggests, is to place a price target 2ATR values away from your entry giving you approximately a 1:1 risk-reward ratio.
2b) The second possibility if the trade is successful is to ride the trend upwards until a blue bar is printed, suggesting indecision in the market. A modified version of this that could let a winning trade run longer is to wait for the price to close under the 13-EMA in fast markets, or close under the 26-EMA in slightly slower markets to maximize potential winnings.
2c) A scalper trader may wish to have a target at either the value zone if they are playing an extended buy/short back to the mean, or if they are being at the mean, to sell or cover when price extends back out to the 2x or 3x zone.
3) Trend traders can additionally use the ATR zones as a sort of safety guidelines for entering a trade. Anything within the 1ATR zone is typically a safer entry as the market is less volatile at this time. Entering when price has gone into the 2ATR zone is signaled as a strong momentum move and can signal a stronger move in the direction of the current closing bar. While not always the case, it is suggested by Dr. Elder to not enter trend trades at the 3ATR zone as this is where you will be likely looking for a counter-trend retracement back to value and a trader entering here in the direction of the trade has a higher chance of being stopped out or not getting in at the best possible price.
