Engulfing Scanner v1This indicator helps you to quickly identify bullish and bearish engulfing patterns.
Works on currencies only (pips required).
Search in scripts for "bear"

Differential Price Counter for Bullish/Bearish BarsThis script can show the cumulative differential price of both bullish/bearish bars with the 0.1pip precision for the currencies having five decimal precision. However, can be useful for all markets.

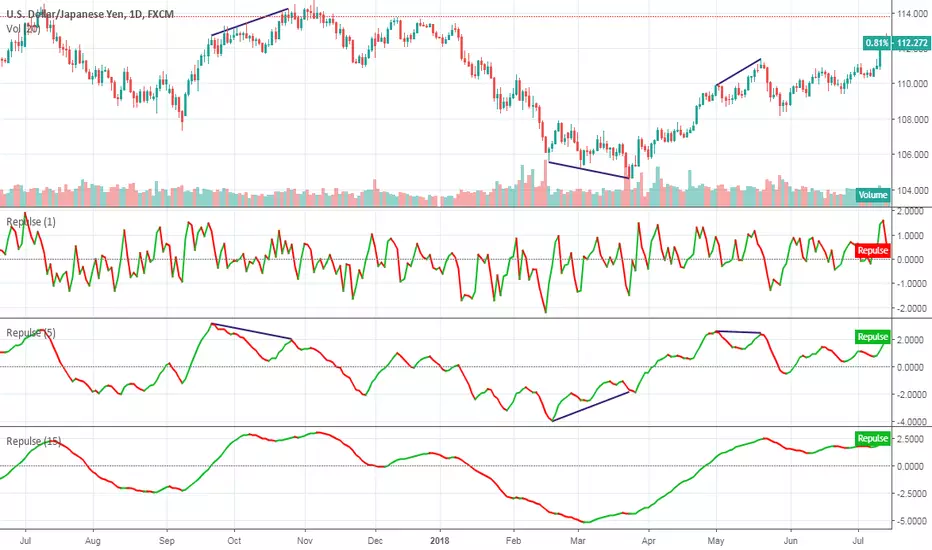
RepulseThis indicator was originally developed by Eric Lefort, a professional trader and author from France.
It gauges and displays the bullish or bearish pressure.
Like and follow for more open source indicators!
Happy Trading!
RSI Divergence AlertRSI Divergence Alert
Input: range
Bullish RSI Divergence
yellow
Bearish RSI Divergence
red

08-2018 Stochastic 5m [ALERT SETUP] [INDICATOR]This is an accumulation of small buy orders and a complete sell order strategy, that can be used for manual trading or for a trading bot. The strategy is based on stockastic divergences ( an indicator that I made myself and is published on my profile earlier ), and I added my personnal touch of course. Note that the bullish and bearish stochastic divergences are calculated separately and can be configured in the inputs.
To be used with a 5m timeframe, and on a flat or bullish pair.
Everyone can favorite the script, apply it to the chart, but only I can see or modify the code. If you need anything, leave a comment, thanks :D
More info about the script, such as inputs description, how to configure the script, strategy explanation, alert configuration can be found here : blockchainfiesta.com
--------------------------------------------------------------------------------------------------------------
I do commission work: TradingView Pine Script development & Reverse Engineering.
contact@blockchainfiesta.com.
You can also send me a message in TradingView or Discord (discord.gg)
Bitcoin address: 19sVQvCDmVfEACq7BiMnWSMqFPZ8qfSQ2K
ETH address: 0xc8a5d3a63a05db0c2363ea1c08b37a01cce9ebfb

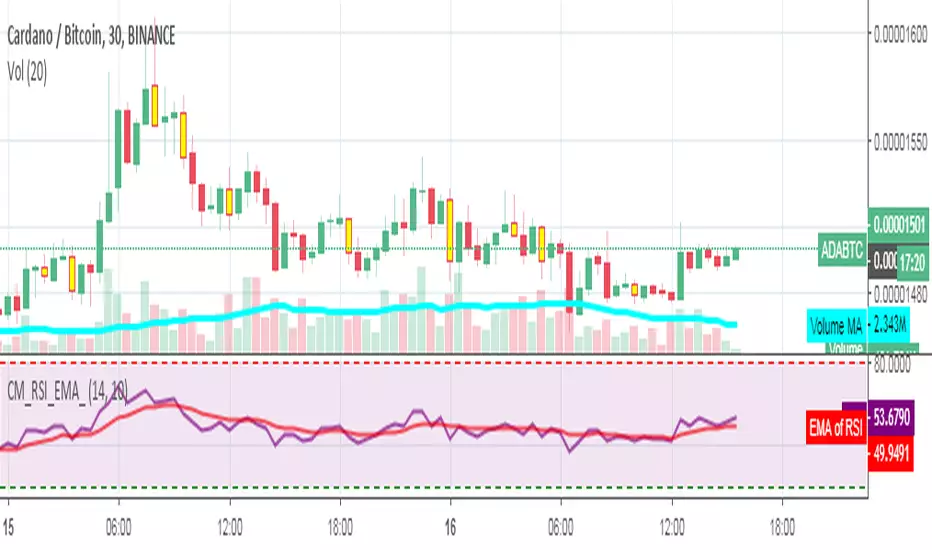
RSI_EMA & Bearish EngulfingThis is a RSI-RSI of EMA and bearish candlestick reversal pattern formed by two candlesticks. Following an uptrend, the first candlestick is a up candlestick which is followed by a down candlestick which has a long real body that engulfs or contains the real body of the prior bar. following an uptrend, if RSI and EMA line cross then Sell and for downtrend if RSI and EMA line cross then Buy.
Spicytrader [BUY and SELL signals + Breakouts + Trendline]
BUY and SELL signals (with alerts)
Support and resistant breakout (with alerts)
Auto trendlines : Bullish and bearish market (with alerts)
100% Compatible with Autoview bot (Buy, Sell, Takeprofit, Stop loss)
TRY IT FOR FREE : spicytrader.com

Stochastique Divergences IndicatorHello,
I made a custom indicator.
Divergences with stochastique and price are really strong signals.
About the indicator
A bullish divergence happens when the stoch K makes a higher low and is depicted by a green triangle up.
A bearish divergence happens when the stoch K makes a lower high and is depicted by a red triangle down.
This script is the base for my next strategy that I should upload soon.
I will grant access (to this script and my others) to people willing to make a small donation.
Here is my BTC address : 19sVQvCDmVfEACq7BiMnWSMqFPZ8qfSQ2K
If you prefer ETH : 0xc8a5d3a63a05db0c2363ea1c08b37a01cce9ebfb
Send me a Private Message with the ID of the transaction
If you want to do some forward testing first, send me a message.
Also check blockchainfiesta.com

wTF50This is a customized trend filter that has several uses:
It helps identify trend direction, either bullish or bearish
It distinguishes between a pullback and a trend reversal
It helps identify areas where traders should stand aside
It highlights areas of consolidation
dTF50This is a customized trend filter that has several uses:
It helps identify trend direction, either bullish or bearish
It distinguishes between a pullback and a trend reversal
It helps identify areas where traders should stand aside
It highlights areas of consolidation
OBV divergence hidden and regular on both bearish and bullish.OBV (on balance volume) divergence indicator with hidden and regular signal on both bearish and bullish.

CMYK VRMI◊ Introduction
This script indicates the relative movement of price x volume.
◊ Origin
Based on 'The Relative Momentum Index' by Roger Altman : February, 1993 issue of Technical Analysis of Stocks & Commodities magazine.
While RSI counts up and down days from close to close, the Relative Momentum Index counts up and down days from the close relative to a close x number of days ago.
This results in an RSI that is smoother. The input has been changed to the change of a smoothed close multiplied by a smoothed volume.
The polarity of VRMI indicates bearish/bullish movement.
◊ Adjustments
CMYK color theme applied.
◊ Usage
VRMI indicates the force the market moves with.
◊ Future Prospects
-
◊ ◊ ◊ ◊ ◊ ◊ ◊ ◊ ◊ ◊ ◊ ◊ ◊ ◊ ◊ ◊ ◊ ◊ ◊ ◊ ◊ ◊ ◊ ◊ ◊ ◊ ◊ ◊ ◊ ◊ ◊ ◊ ◊ ◊ ◊ ◊ ◊ ◊ ◊ ◊ ◊ ◊ ◊ ◊ ◊ ◊ ◊ ◊ ◊ ◊ ◊ ◊ ◊ ◊ ◊ ◊ ◊ ◊ ◊ ◊ ◊ ◊ ◊ ◊ ◊ ◊ ◊ ◊ ◊ ◊ ◊ ◊ ◊ ◊ ◊ ◊ ◊ ◊ ◊ ◊ ◊ ◊ ◊ ◊ ◊ ◊ ◊ ◊ ◊ ◊ ◊ ◊ ◊ ◊ ◊ ◊ ◊ ◊ ◊ ◊ ◊ ◊ ◊ ◊ ◊ ◊

CMYK VRMI RAYS ◊ Introduction
Introducing VRMI in this script, an RMI based on price movement and volume, to indicate bullish and bearish trends.
This script marks the background depending on RMI <> VRMI , VRMI polarity and large buy/sell sprees.
◊ Origin
Based on 'The Relative Momentum Index' by Roger Altman : February, 1993 issue of Technical Analysis of Stocks & Commodities magazine.
While RSI counts up and down days from close to close, the Relative Momentum Index counts up and down days from the close relative to a close x number of days ago.
This results in an RSI that is smoother.
In addition VRMI reacts quick, it is used to cut off latency from RMI, and it's polarity indicates the beginning and end of a trend.
Large buy sell sprees and detected in their proportion with an sma on the volume
◊ Adjustments
CMYK color theme applied.
◊ Usage
This indicator can be used to detect trends and mark reversals.
◊ Prospects
◊ ◊ ◊ ◊ ◊ ◊ ◊ ◊ ◊ ◊ ◊ ◊ ◊ ◊ ◊ ◊ ◊ ◊ ◊ ◊ ◊ ◊ ◊ ◊ ◊ ◊ ◊ ◊ ◊ ◊ ◊ ◊ ◊ ◊ ◊ ◊ ◊ ◊ ◊ ◊ ◊ ◊ ◊ ◊ ◊ ◊ ◊ ◊ ◊ ◊ ◊ ◊ ◊ ◊ ◊ ◊ ◊ ◊ ◊ ◊ ◊ ◊ ◊ ◊ ◊ ◊ ◊ ◊ ◊ ◊ ◊ ◊ ◊ ◊ ◊ ◊ ◊ ◊ ◊ ◊ ◊ ◊ ◊ ◊ ◊ ◊ ◊ ◊ ◊ ◊ ◊ ◊ ◊ ◊ ◊ ◊ ◊ ◊ ◊ ◊ ◊ ◊ ◊ ◊ ◊ ◊


Bullish and Bearish Engulfing Patterns auto detectionThis simple indicator detects automatically most important bullish and bearish candlestick patterns formations. Used to locate potential supply and demand imbalances.
Copyright 2017 Alfonso Moreno www.set-and-forget.com


Super Envolvente (Bullish y Bearish)Identificador de Super-envolventes (SE), se encarga de darle un color verde a la SE alzista (Bullish) verde y rojo a la bajista (Bearish).

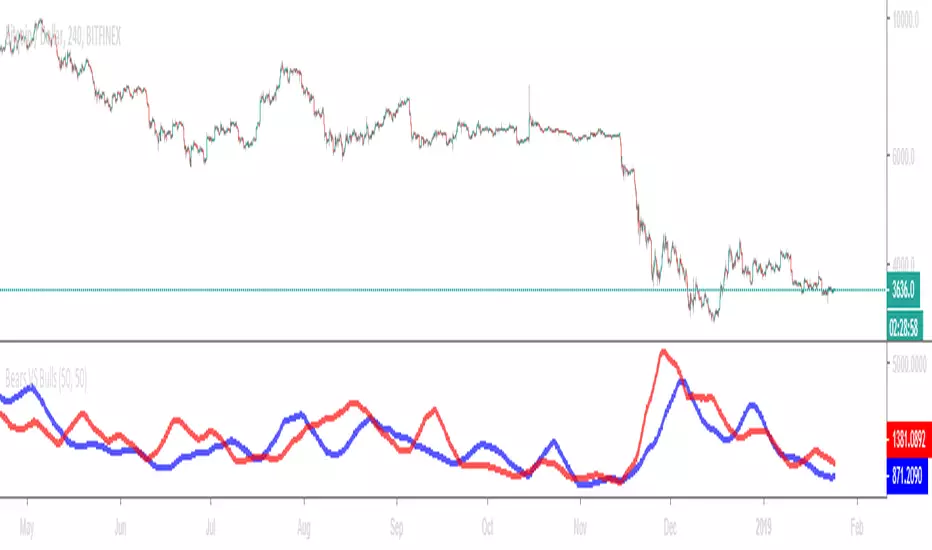
Bears VS BullsThis indicator will work on ANY instrument.
The red line is a moving average of ONLY sellers in the market.
The blue line is a moving average of ONLY buyers in the market.
The period or "length" of the individual moving averages can be adjusted in the indicator settings.
The default, it is set to 50.
Buying and selling trends often provide indications of market moves such as the most recent bottom in Cryptocurrencies.
Feel free to comment and share any indicator concepts or ideas for content you would like to see added to the Technical Indicator Bundle on www.kenzing.com
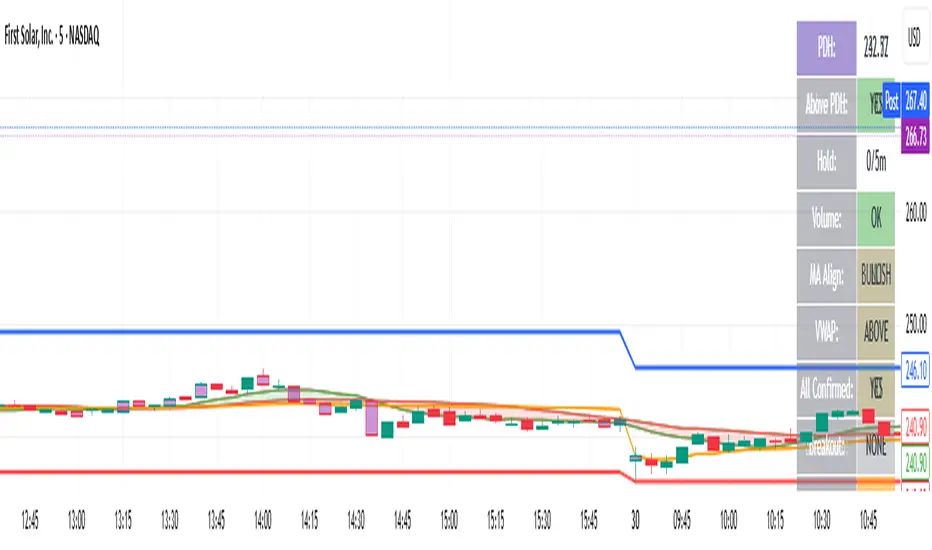
bearish Price Below PDL - Complete Multi-Confirmation Alert🎯 KEY IMPROVEMENTS:
1. Enhanced Alert Visibility:$jmoskyhigh
✅ HUGE triangle down marker with "SELL" text
✅ Alert title: "SELL SIGNAL - PDL BREAKDOWN CONFIRMED"
✅ Prominent info panel with red theme
✅ Clear "SELL ALERT: TRIGGERED" status
2. Better Visual Feedback:
Red frame around info panel
Larger shapes and markers
Color-coded confirmations (green = OK, red = FAIL)
Progress percentage displayed
Breakdown price label
3. Complete Alert System:
Main Alert: "SELL SIGNAL - PDL BREAKDOWN CONFIRMED"
Early Warning: "PDL Breakdown Started - Monitoring"
Reset Alert: "Confirmation Lost - Breakdown Reset"

Bearish signal using Point of Control (POC) with PAC by guruThis indicator code helps traders identify potential sell opportunities using several important technical indicators:
Point of Control (POC) – This is the price level where the most volume was traded over the past several days.
Previous Day's Low – This shows the lowest price reached during the previous day.
PAC (Price Action Channel) EMA – These are two moving averages (one based on the low price and one based on the close price) that help determine if the price is trending within a certain range.
Volume SMA – This is a 3-day simple moving average (SMA) of volume, which helps filter out signals based on market activity.
What the Script Does:
Point of Control (POC):
The script looks at the last 50 days (configurable) and calculates which price level had the highest trading volume.
It then plots a red line on the chart at the POC level. This is important because it helps identify areas where there was strong market interest in the past.
Volume Moving Average:
The script calculates a 3-day SMA of volume, but it excludes the current day to avoid premature signals based on today’s trading.
The volume SMA is used to ensure there’s enough market activity (with a threshold set to 25 units) before triggering a sell signal.
Price Action Channel (PAC) EMA:
The PAC consists of two exponential moving averages (EMAs):
The PAC Low EMA: This is based on the low prices over the last 34 periods (configurable).
The PAC Close EMA: This is based on the closing prices over the last 34 periods.
These EMAs help determine if the price is trending above or below certain price levels.
Sell Signal Logic: The script checks three conditions before displaying a "Sell" signal:
Price Below POC and Previous Day’s Low:
The close price must be below both the Point of Control (POC) and the previous day's low.
Volume SMA Above 25:
The 3-day volume SMA must be greater than 25. This ensures the signal only triggers when there’s enough trading volume in the market.
Today’s Low is Above PAC EMAs:
Today's low price must be above both the PAC low EMA and the PAC close EMA. This prevents sell signals when prices are already significantly below the PAC, indicating possible exhaustion in the downtrend.
If all three conditions are met, the script will display a red "Sell" label on the chart, signaling a potential selling opportunity.
No Sell Signal if Price Reverses:
If the price crosses back above the POC or the previous day's low, the script will remove the sell signal and reset for a new opportunity.
Summary of Conditions:
For the script to display a "Sell" label:
The close price must be below the Point of Control (POC) and the previous day’s low.
The 3-day volume SMA (excluding today) must be greater than 25 units.
The low price of the current day must be above both the PAC low EMA and the PAC close EMA.
If these conditions are met, a red sell label appears on the chart as a potential signal for a short (sell) trade.

Guneet-ScalperBearish trend candle color change to red with sell print
Bullish trend candle color change to green with buy print
thanks
jas toor

AI Market Weather Forecast ProAI Market Weather Forecast Pro - Advanced Trading Indicator
Overview
AI Market Weather Forecast Pro is an innovative multi-timeframe trading system that uses global meteorological metaphors to visualize market conditions. By analyzing dimensional latitude regions, it transforms complex market data into intuitive global weather forecasts and temperature readings, helping traders quickly assess market sentiment and trend strength.
Core Features
🌍 Global Weather System
- Temperature Scale: -51°C to +51°C market temperature readings
- Weather Classifications: 9 distinct weather conditions from Freezing Cold to Scorching Heat
- Multi-Latitude Analysis: 5 climate zones representing different regional AI parameters
- Dynamic Temperature Engine: AI-powered algorithm calculates market "temperature" in real-time
- Trend Direction Indicator: Clear bullish/bearish/neutral classification
🌡️ Temperature-Based Signals
Hot Weather (Bullish Conditions):
- 🌡️ Scorching (35°C+): Strong Bull - Extreme bullish conditions
- ☀️ Hot (25°C-35°C): Bullish - Strong upward momentum
- 🌤️ Sunny (15°C-25°C): Mild Bull - Moderate bullish trend
- ⛅ Partly Cloudy (5°C-15°C): Weak Bull - Light bullish bias
Neutral Weather:
- ☁️ Overcast (-5°C to 5°C): Neutral - Consolidation/ranging market
Cold Weather (Bearish Conditions):
- 🌧️ Light Rain (-15°C to -5°C): Weak Bear - Light bearish bias
- 🌨️ Sleet (-25°C to -15°C): Mild Bear - Moderate bearish trend
- ❄️ Blizzard (-35°C to -25°C): Bearish - Strong downward momentum
- 🧊 Freezing Cold (-35°C-): Strong Bear - Extreme bearish conditions
📊 Five Latitude Climate Zones
Detects market conditions across 5 distinct "latitude zones", each representing progressively longer timeframes:
Each zone displays real-time weather status: ☀️ Clear (bullish), ❄️ Snow (bearish), or ☁️ Cloudy (neutral)
🎨 Advanced Visualization
Color-Coded Background:
- Orange/Yellow spectrum for bullish temperatures
- Gray for neutral conditions
- Blue spectrum for bearish temperatures
- Intensity increases with temperature extremes
Smart Weather Labels:
- Emoji-based weather icons for instant recognition
- Temperature readings in degrees
- Auto-positioned to avoid chart clutter
- Updates dynamically with trend changes
Comprehensive Weather Panel:
- Current weather condition
- Market temperature (°C)
- Trend direction classification
- Real-time status of all 5 latitude zones
- Current price and percentage change
Configuration Options
Display Settings
- Panel Position: 9 position options (corners, edges, center)
- Show Weather Panel: Toggle weather information panel on/off
- Show Background Color: Toggle background coloring on/off
- Show Weather Labels: Toggle weather labels on/off
- Background Display Days: Control how many days of coloring to display (1-30 days)
Alert System
Pre-configured alerts include:
- Weather Warming: Alert when temperature rises above 15°C
- Weather Cooling: Alert when temperature falls below -15°C
- Strong Trend Change: Alert when trend shifts to "Strong Bull" or "Strong Bear"
Information Panel Metrics
Real-time display includes:
- Current Weather: Visual weather condition with emoji
- Market Temperature: Numerical temperature reading (°C)
- Trend Direction: Clear classification (Strong Bull/Bullish/Mild Bull/Weak Bull/Neutral/Weak Bear/Mild Bear/Bearish/Strong Bear)
- Latitude Status: Weather conditions across all 5 climate zones
- Price & Change: Current price and percentage change
How to Interpret
Temperature Readings
- Above +25°C: Strong bullish conditions, consider long positions
- +15°C to +25°C*: Moderate bullish, good for trend following
- +5°C to +15°C: Mild bullish, cautious long bias
- -5°C to +5°C*: Neutral range, wait for clarity or range trade
- -15°C to -5°C: Mild bearish, cautious short bias
- -25°C to -15°C: Moderate bearish, good for short positions
- Below -25°C: Strong bearish conditions, consider short positions
Best Practices
1. Temperature Extremes: Focus on temperatures above +25°C or below -25°C for clear signals
2. Temperature Trend: Watch for rising/falling temperature trends, not just absolute values
3. Combine with Barometer*: Use alongside AI Market Barometer Pro for comprehensive analysis
4. Background Color: Quick visual assessment of overall market climate
Recommended Timeframes
- Scalping: 1-minute charts
- *Day Trading: 5-minute, 15-minute charts
Technical Requirements
- TradingView Pro, Pro+, or Premium account (required for multi-timeframe functionality)
- Compatible with all markets: Forex, Crypto, Stocks, Indices, Commodities
- Works on all timeframes from 1-minute to Monthly
Disclaimer
This indicator is a tool to assist with trading decisions. Past performance does not guarantee future results. Trading involves substantial risk of loss. Always use proper risk management and never risk more than you can afford to lose. The AI algorithms and temperature calculations are based on historical price patterns and technical analysis, not predictive guarantees.
What Makes This Different?
Unlike traditional indicators, AI Market Weather Forecast Pro:
- ✅ Uses intuitive meteorological metaphors for instant comprehension
- ✅ Analyzes multiple timeframe combinations simultaneously
- ✅ Calculates dynamic market "temperature" readings
- ✅ Provides 5-zone latitude system for confirmation
- ✅ Offers clear visual weather classifications
- ✅ Features unique temperature-based trend strength measurement
- ✅ Complements AI Market Barometer Pro for complete market analysis
Transform complex multi-timeframe analysis into simple weather forecasts. Know the market climate before you trade.
Perfect Companion to AI Market Barometer Pro
When used together with AI Market Barometer Pro:
- Barometer provides directional signals with AI confidence scores
- Weather provides overall market climate and temperature readings
- Combined gives you both precise entry signals AND broader market context
- Result: More informed trading decisions with better timing
© 2024 AI Market Weather Forecast Pro. All rights reserved. Proprietary algorithms and methodologies protected.
