cd_respect2_EQ_Cx🔹 Overview:
Many traders form a bias or look for trade setups by analyzing the high (H) and low (L) of previous higher timeframe candles. For example: a close above the previous daily high, a failure to close after breaking the high, or approaching the level without making a new high. As we’ve been taught to focus on these key levels, I wanted to draw attention to what's happening at the mid-levels (Equilibrium) of the current and higher timeframe candles.
We’ve all heard the phrase “Strong price reacts from equilibrium,” yet most of us wait at the extremes.
While working on equilibrium levels of both higher timeframes and the current timeframe, I noticed that when a current candle closes above/below the previous HTF candle's high/low, price often respects the part of the candle that caused the break — which I refer to as the Last Block. When respected, price tends to continue with momentum; when lost, a pullback or reversal often follows.
________________________________________
🔹 About the Indicator:
This tool analyzes four different higher timeframes and shows:
• Current candle equilibrium levels
• Previous candle equilibrium levels (2 display options):
1. On Box – classic display
2. On Candle – equilibrium is linked to the last candle that includes the level, making those candles more meaningful or "strengthened"
• Alerts (standard) and on-screen warnings when price approaches previous equilibrium levels
• High/Low levels of previous HTF candles
• High/Low levels of live HTF candles
• Last Block: the upper or lower part of the candle that caused the breakout when price closes above/below the previous HTF high/low
• Countdown timer until the close of selected HTFs
________________________________________
🔹 Menus & Usage:
🔸 Show/Hide Tab:
• Toggle Previous Equilibrium display (On Candle / On Box)
• Toggle Live Equilibrium levels, color selection, and left extension
• Toggle Current Candle Equilibrium and colors
• Alert on Chart: flashing on-screen visual alert
• Approach Limit: sets how close price must be to trigger alert
• Remaining Time (RT): toggle countdown display for selected timeframes
________________________________________
🔸 HTF H/L Levels Tab:
• Show previous and live HTF candle highs/lows
• Customize colors, starting points, and left extension options
________________________________________
🔸 Timeframes & Options Tab:
• Select which timeframes to display
• Choose level colors
• Enable price alerts
• Control visibility in the time chart
• Toggle Last Block display (close-to-high/low)
________________________________________
🔸 Look Back HTF Candles Tab:
• Delete filled levels: removes invalidated zones; only unmitigated remain
• Back Control: set how many candles to look back per timeframe (unlimited if not set)
________________________________________
🔸 HTF Boxes Tab:
• Display HTF candles in boxes
• Set colors (single color or per timeframe)
• Adjust font sizes across the chart
________________________________________
🔹 Usage & Last Blocks:
The core idea behind both equilibrium levels and last blocks is:
Price should “gain” and respect them to validate continuation.
Viewing multiple timeframes together strengthens bias.
Each level is treated as part of the candle it's associated with — defining the “area to be gained.”
“Did price respect the level because of that candle, or did the candle gain significance because it aligned with the level? That’s open for debate.”
(In my opinion, the candle gains significance because it aligns with the level.)
When respected, these levels/blocks act as support; when lost, they act as resistance.
In suitable timeframes, reclaiming previous equilibrium levels may be interpreted as CHoCH / CISD / IDM depending on the context.
________________________________________
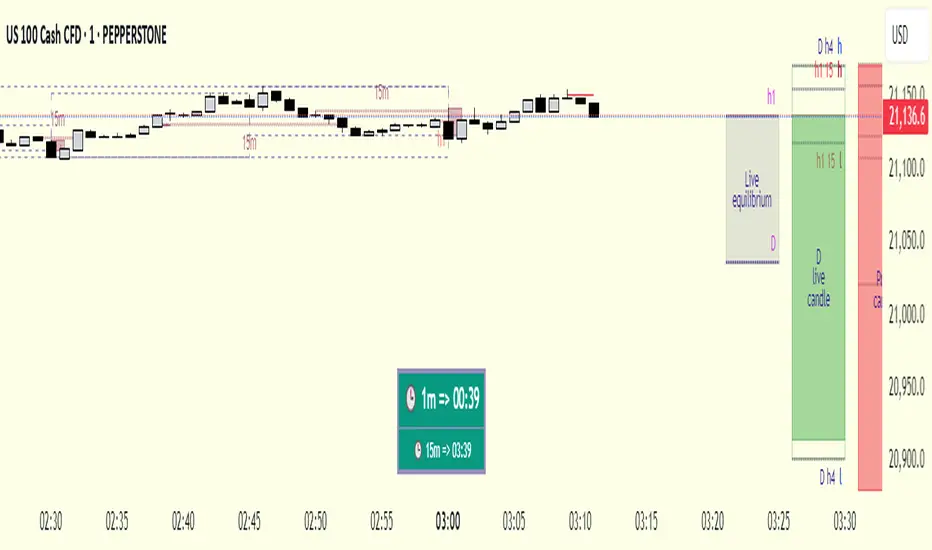
🔹 Usage Example – Last Blocks:
I personally trade on 1-minute and use Daily / H4 / H1 / 15m as selected timeframes.
For example, if price reclaims the previous 15m level, I view it as a Change of Character. I then expect the next candle to show respect in that direction.
Choose timeframes based on your trading style.
Sometimes, HTF levels (past and live) cluster tightly — these areas are key watch zones for me.
That’s the reason I decided to share this indicator.
________________________________________
🔹 Chart Examples:
🔸 Example 1:
Price closes above both the 12:45 15m candle and the 12:00 H1 equilibrium levels.
Last Block forms. After retracing, price mitigates the block and respects live equilibrium levels (H4/H1/15m).
🔸 Example 2:
Explained on chart – Levels that pushed price down in the bearish trend later acted as support.
🔸 Example 3 – CHoCH/CISD/IDM Alternative:
Explained on chart – Replacing structural signals with equilibrium levels.
I see this pattern often — very effective.
🔸 Example 4:
Many levels are clustered in a narrow range; price shows respect across the board.
________________________________________
🔹 Final Note:
Hope you like the tool. I’d love to hear your thoughts and suggestions.
"Keep in mind, strong price reverses from equilibrium."
Happy trading!
Search in scripts for "bias"
LANZ Strategy 3.0 [Backtest]🔷 LANZ Strategy 3.0 — Asian Range Fibonacci Scalping Strategy
LANZ Strategy 3.0 is a precision-engineered backtesting tool tailored for intraday traders who rely on the Asian session range to determine directional bias. This strategy implements dynamic Fibonacci projections and strict time-window validation to simulate a clean and disciplined trading environment.
🧠 Core Components:
Asian Range Bias Definition: Direction is established between 01:15–02:15 a.m. NY time based on the candle’s close in relation to the midpoint of the Asian session range (18:00–01:15 NY).
Limit Order Execution: Only one trade is placed daily, using a limit order at the Asian range high (for sells) or low (for buys), between 01:15–08:00 a.m. NY.
Fibonacci-Based TP/SL:
Original Mode: TP = 2.25x range, SL = 0.75x range.
Optimized Mode: TP = 1.95x range, SL = 0.65x range.
No Trade After 08:00 NY: If the limit order is not executed before 08:00 a.m. NY, it is canceled.
Fallback Logic at 02:15 NY: If the market direction misaligns with the setup at 02:15 a.m., the system re-evaluates and can re-issue the order.
End-of-Day Closure: All positions are closed at 15:45 NY if still open.
📊 Backtest-Ready Design:
Entries and exits are executed using strategy.entry() and strategy.exit() functions.
Position size is fixed via capital risk allocation ($100 per trade by default).
Only one position can be active at a time, ensuring controlled risk.
📝 Notes:
This strategy is ideal for assets sensitive to the Asian/London session overlap, such as Forex pairs and indices.
Easily switch between Fibonacci versions using a single dropdown input.
Fully deterministic: all entries are based on pre-defined conditions and time constraints.
👤 Credits:
Strategy developed by rau_u_lanz using Pine Script v6. Built for traders who favor clean sessions, directional clarity, and consistent execution using time-based logic and Fibonacci projections.

Lyapunov Market Instability (LMI)Lyapunov Market Instability (LMI)
What is Lyapunov Market Instability?
Lyapunov Market Instability (LMI) is a revolutionary indicator that brings chaos theory from theoretical physics into practical trading. By calculating Lyapunov exponents—a measure of how rapidly nearby trajectories diverge in phase space—LMI quantifies market sensitivity to initial conditions. This isn't another oscillator or trend indicator; it's a mathematical lens that reveals whether markets are in chaotic (trending) or stable (ranging) regimes.
Inspired by the meditative color field paintings of Mark Rothko, this indicator transforms complex chaos mathematics into an intuitive visual experience. The elegant simplicity of the visualization belies the sophisticated theory underneath—just as Rothko's seemingly simple color blocks contain profound depth.
Theoretical Foundation (Chaos Theory & Lyapunov Exponents)
In dynamical systems, the Lyapunov exponent (λ) measures the rate of separation of infinitesimally close trajectories:
λ > 0: System is chaotic—small changes lead to dramatically different outcomes (butterfly effect)
λ < 0: System is stable—trajectories converge, perturbations die out
λ ≈ 0: Edge of chaos—transition between regimes
Phase Space Reconstruction
Using Takens' embedding theorem , we reconstruct market dynamics in higher dimensions:
Time-delay embedding: Create vectors from price at different lags
Nearest neighbor search: Find historically similar market states
Trajectory evolution: Track how these similar states diverged over time
Divergence rate: Calculate average exponential separation
Market Application
Chaotic markets (λ > threshold): Strong trends emerge, momentum dominates, use breakout strategies
Stable markets (λ < threshold): Mean reversion dominates, fade extremes, range-bound strategies work
Transition zones: Market regime about to change, reduce position size, wait for confirmation
How LMI Works
1. Phase Space Construction
Each point in time is embedded as a vector using historical prices at specific delays (τ). This reveals the market's hidden attractor structure.
2. Lyapunov Calculation
For each current state, we:
- Find similar historical states within epsilon (ε) distance
- Track how these initially similar states evolved
- Measure exponential divergence rate
- Average across multiple trajectories for robustness
3. Signal Generation
Chaos signals: When λ crosses above threshold, market enters trending regime
Stability signals: When λ crosses below threshold, market enters ranging regime
Divergence detection: Price/Lyapunov divergences signal potential reversals
4. Rothko Visualization
Color fields: Background zones represent market states with Rothko-inspired palettes
Glowing line: Lyapunov exponent with intensity reflecting market state
Minimalist design: Focus on essential information without clutter
Inputs:
📐 Lyapunov Parameters
Embedding Dimension (default: 3)
Dimensions for phase space reconstruction
2-3: Simple dynamics (crypto/forex) - captures basic momentum patterns
4-5: Complex dynamics (stocks/indices) - captures intricate market structures
Higher dimensions need exponentially more data but reveal deeper patterns
Time Delay τ (default: 1)
Lag between phase space coordinates
1: High-frequency (1m-15m charts) - captures rapid market shifts
2-3: Medium frequency (1H-4H) - balances noise and signal
4-5: Low frequency (Daily+) - focuses on major regime changes
Match to your timeframe's natural cycle
Initial Separation ε (default: 0.001)
Neighborhood size for finding similar states
0.0001-0.0005: Highly liquid markets (major forex pairs)
0.0005-0.002: Normal markets (large-cap stocks)
0.002-0.01: Volatile markets (crypto, small-caps)
Smaller = more sensitive to chaos onset
Evolution Steps (default: 10)
How far to track trajectory divergence
5-10: Fast signals for scalping - quick regime detection
10-20: Balanced for day trading - reliable signals
20-30: Slow signals for swing trading - major regime shifts only
Nearest Neighbors (default: 5)
Phase space points for averaging
3-4: Noisy/fast markets - adapts quickly
5-6: Balanced (recommended) - smooth yet responsive
7-10: Smooth/slow markets - very stable signals
📊 Signal Parameters
Chaos Threshold (default: 0.05)
Lyapunov value above which market is chaotic
0.01-0.03: Sensitive - more chaos signals, earlier detection
0.05: Balanced - optimal for most markets
0.1-0.2: Conservative - only strong trends trigger
Stability Threshold (default: -0.05)
Lyapunov value below which market is stable
-0.01 to -0.03: Sensitive - quick stability detection
-0.05: Balanced - reliable ranging signals
-0.1 to -0.2: Conservative - only deep stability
Signal Smoothing (default: 3)
EMA period for noise reduction
1-2: Raw signals for experienced traders
3-5: Balanced - recommended for most
6-10: Very smooth for position traders
🎨 Rothko Visualization
Rothko Classic: Deep reds for chaos, midnight blues for stability
Orange/Red: Warm sunset tones throughout
Blue/Black: Cool, meditative ocean depths
Purple/Grey: Subtle, sophisticated palette
Visual Options:
Market Zones : Background fields showing regime areas
Transitions: Arrows marking regime changes
Divergences: Labels for price/Lyapunov divergences
Dashboard: Real-time state and trading signals
Guide: Educational panel explaining the theory
Visual Logic & Interpretation
Main Elements
Lyapunov Line: The heart of the indicator
Above chaos threshold: Market is trending, follow momentum
Below stability threshold: Market is ranging, fade extremes
Between thresholds: Transition zone, reduce risk
Background Zones: Rothko-inspired color fields
Red zone: Chaotic regime (trending)
Gray zone: Transition (uncertain)
Blue zone: Stable regime (ranging)
Transition Markers:
Up triangle: Entering chaos - start trend following
Down triangle: Entering stability - start mean reversion
Divergence Signals:
Bullish: Price makes low but Lyapunov rising (stability breaking down)
Bearish: Price makes high but Lyapunov falling (chaos dissipating)
Dashboard Information
Market State: Current regime (Chaotic/Stable/Transitioning)
Trading Bias: Specific strategy recommendation
Lyapunov λ: Raw value for precision
Signal Strength: Confidence in current regime
Last Change: Bars since last regime shift
Action: Clear trading directive
Trading Strategies
In Chaotic Regime (λ > threshold)
Follow trends aggressively: Breakouts have high success rate
Use momentum strategies: Moving average crossovers work well
Wider stops: Expect larger swings
Pyramid into winners: Trends tend to persist
In Stable Regime (λ < threshold)
Fade extremes: Mean reversion dominates
Use oscillators: RSI, Stochastic work well
Tighter stops: Smaller expected moves
Scale out at targets: Trends don't persist
In Transition Zone
Reduce position size: Uncertainty is high
Wait for confirmation: Let regime establish
Use options: Volatility strategies may work
Monitor closely: Quick changes possible
Advanced Techniques
- Multi-Timeframe Analysis
- Higher timeframe LMI for regime context
- Lower timeframe for entry timing
- Alignment = highest probability trades
- Divergence Trading
- Most powerful at regime boundaries
- Combine with support/resistance
- Use for early reversal detection
- Volatility Correlation
- Chaos often precedes volatility expansion
- Stability often precedes volatility contraction
- Use for options strategies
Originality & Innovation
LMI represents a genuine breakthrough in applying chaos theory to markets:
True Lyapunov Calculation: Not a simplified proxy but actual phase space reconstruction and divergence measurement
Rothko Aesthetic: Transforms complex math into meditative visual experience
Regime Detection: Identifies market state changes before price makes them obvious
Practical Application: Clear, actionable signals from theoretical physics
This is not a combination of existing indicators or a visual makeover of standard tools. It's a fundamental rethinking of how we measure and visualize market dynamics.
Best Practices
Start with defaults: Parameters are optimized for broad market conditions
Match to your timeframe: Adjust tau and evolution steps
Confirm with price action: LMI shows regime, not direction
Use appropriate strategies: Chaos = trend, Stability = reversion
Respect transitions: Reduce risk during regime changes
Alerts Available
Chaos Entry: Market entering chaotic regime - prepare for trends
Stability Entry: Market entering stable regime - prepare for ranges
Bullish Divergence: Potential bottom forming
Bearish Divergence: Potential top forming
Chart Information
Script Name: Lyapunov Market Instability (LMI) Recommended Use: All markets, all timeframes Best Performance: Liquid markets with clear regimes
Academic References
Takens, F. (1981). "Detecting strange attractors in turbulence"
Wolf, A. et al. (1985). "Determining Lyapunov exponents from a time series"
Rosenstein, M. et al. (1993). "A practical method for calculating largest Lyapunov exponents"
Note: After completing this indicator, I discovered @loxx's 2022 "Lyapunov Hodrick-Prescott Oscillator w/ DSL". While both explore Lyapunov exponents, they represent independent implementations with different methodologies and applications. This indicator uses phase space reconstruction for regime detection, while his combines Lyapunov concepts with HP filtering.
Disclaimer
This indicator is for research and educational purposes only. It does not constitute financial advice or provide direct buy/sell signals. Chaos theory reveals market character, not future prices. Always use proper risk management and combine with your own analysis. Past performance does not guarantee future results.
See markets through the lens of chaos. Trade the regime, not the noise.
Bringing theoretical physics to practical trading through the meditative aesthetics of Mark Rothko
Trade with insight. Trade with anticipation.
— Dskyz , for DAFE Trading Systems

Information Asymmetry Gradient (IAG) What is the Information Asymmetry Gradient (IAG)?
The Information Asymmetry Gradient (IAG) is a unique market regime and imbalance detector that quantifies the subtle, directional “information flow” in price and volume. Inspired by information theory and market microstructure, IAG is designed to help traders spot the early buildup of conviction or surprise—the kind of hidden imbalance that often precedes major price moves.
Unlike traditional volume or momentum indicators, IAG focuses on the efficiency and directionality of information transfer: how much “informational energy” is being revealed by up-moves versus down-moves, normalized by price movement. It’s not just about net flow, but about the quality and asymmetry of that flow.
Theoretical Foundation
Information Asymmetry: Markets move when new information is revealed. If one side (buyers or sellers) is consistently more “informationally efficient” per unit of price change, an imbalance is building—even if price hasn’t moved much yet.
Gradient: By tracking the rate of change (gradient) between fast and slow information flows, IAG highlights when a subtle imbalance is accelerating.
Volatility of Asymmetry: Sudden spikes in the volatility of information asymmetry often signal regime uncertainty or the approach of a “surprise” move.
How IAG Works
Directional Information Content: For each bar, IAG estimates the “information per unit of price change” for both up-moves and down-moves, using volume and price action.
Asymmetry Calculation: Computes the difference (or ratio) between up and down information content, revealing directional bias.
Gradient Detection: Calculates both a fast and slow EMA of the asymmetry, then measures their difference (the “gradient”), normalized as a Z-score.
Volatility of Asymmetry: Tracks the standard deviation of asymmetry over a rolling window, with Z-score normalization to spot “information shocks.”
Flow Strength: Quantifies the conviction of the current information flow on a 0–100 scale.
Regime Detection: Flags “extreme” asymmetry, “building” flow, and “high volatility” states.
Inputs:
🌌 Core Asymmetry Parameters
Fast Information Period (short_len, default 8): EMA period for detecting immediate information flow changes.
5–8: Scalping (1–5min)
8–12: Day trading (15min–1hr)
12–20: Swing trading (4hr+)
Slow Information Period (long_len, default 34): EMA period for baseline information context. Should be 3–5x fast period.
Default (34): Fibonacci number, stable for most assets.
Gradient Smoothing (gradient_smooth, default 3): Smooths the gradient calculation.
1–2: Raw, responsive
3–5: Balanced
6–10: Very smooth
📊 Asymmetry Method
Calculation Mode (calc_mode, default "Weighted"):
“Simple”: Basic volume split by direction
“Weighted”: Volume × price movement (default, most robust)
“Logarithmic”: Log-scaled for large moves
Use Ratio (show_ratio, default false):
“Difference”: UpInfo – DownInfo (additive)
“Ratio”: UpInfo / DownInfo (multiplicative, better for comparing volatility regimes)
🌊 Volatility Analysis
Volatility Window (stdev_len, default 21): Lookback for measuring asymmetry volatility.
Volatility Alert Level (vol_threshold, default 1.5): Z-score threshold for volatility alerts.
🎨 Visual Settings
Color Theme (color_theme, default "Starry Night"):
Van Gogh-inspired palettes:
“Starry Night”: Deep blues and yellows
“Sunflowers”: Warm yellows and browns
“Café Terrace”: Night blues and warm lights
“Wheat Field”: Golden and sky blue
Show Swirl Effects (show_swirls, default true): Adds swirling background to visualize information turbulence.
Show Signal Stars (show_stars, default true): Star markers at significant asymmetry points.
Show Info Dashboard (show_dashboard, default true): Top-right panel with current metrics and market state.
Show Flow Visualization (show_flow, default true): Main gradient line with artistic effects.
Color Schemes
Dynamic color gradients adapt to both the direction and intensity of the information gradient, using Van Gogh-inspired palettes for visual clarity and artistic flair.
Glow and aura effects: The main line is layered with glows for depth and to highlight strong signals.
Swirl background: Visualizes the “turbulence” of information flow, darker and more intense as flow strength and volatility rise.
Visual Logic
Main Gradient Line: Plots the normalized information gradient (Z-score), color-coded by direction and intensity.
Glow/Aura: Multiple layers for visual depth and to highlight strong signals.
Threshold Zones: Dotted lines and filled areas mark “Building” and “Extreme” asymmetry zones.
Volatility Ribbon: Area plot of volatility Z-score, highlighting information shocks.
Signal Stars: Circular markers at each “Extreme” event, color-coded for bullish/bearish; cross markers for volatility spikes.
Dashboard: Top-right panel shows current status (Extreme, Building, High Volatility, Balanced), gradient value, flow strength, information balance, and volatility status.
Trading Guide: Bottom-left panel explains all states and how to interpret them.
How to Use IAG
🌟 EXTREME: Major information imbalance—potential for explosive move or reversal.
🌙 BUILDING: Asymmetry is forming—watch for a breakout or trend acceleration.
🌪️ HIGH VOLATILITY: Information flow is unstable—expect regime uncertainty or “surprise” moves.
☁️ BALANCED: No clear bias—market is in equilibrium.
Positive Gradient: Bullish information flow (buyers have the edge).
Negative Gradient: Bearish information flow (sellers have the edge).
Flow >66%: Strong conviction—crowd is acting in unison.
Volatility Spike: Regime uncertainty—be alert for sudden moves.
Tips:
- Use lower periods for scalping, higher for swing trading.
- “Weighted” mode is most robust for most assets.
- Combine with price action or your own system for confirmation.
- Works on all assets and timeframes—tune to your style.
Alerts
IAG Extreme Asymmetry: Extreme information asymmetry detected.
IAG Building Flow: Information flow building.
IAG High Volatility: Information volatility spike.
IAG Bullish/Bearish Extreme: Directional extreme detected.
Originality & Usefulness
IAG is not a mashup of existing indicators. It is a novel approach to quantifying the “surprise” or “conviction” element in market moves, focusing on the efficiency and directionality of information transfer per unit of price change. The multi-layered color logic, artistic visual effects, and regime dashboard are unique to this script. IAG is designed for anticipation, not confirmation—helping you see subtle imbalances before they become obvious in price.
Chart Info
Script Name: Information Asymmetry Gradient (IAG) – Starry Night
Recommended Use: Any asset, any timeframe. Tune parameters to your style.
Disclaimer
This script is for research and educational purposes only. It does not provide financial advice or direct buy/sell signals. Always use proper risk management and combine with your own strategy. Past performance is not indicative of future results.
Trade with insight. Trade with anticipation.
— Dskyz , for DAFE Trading Systems

LANZ Strategy 2.0 [Backtest]🔷 LANZ Strategy 2.0 — Structural Breakout Logic with Dynamic Swing Protection
LANZ Strategy 2.0 is a precision-focused backtesting system built for intraday traders who rely on structural confirmations before the London session to guide directional bias. This tool uses smart swing detection, risk-defined position sizing, and strict time-based execution to simulate real trading conditions with clarity and control.
🧠 Core Components:
Structural Confirmation (Trend & BoS): Detects trend direction and break of structure (BoS) using a three-swing logic, aligning trade entries with valid structural movement.
Time-Based Execution: Trades are triggered exclusively at 02:00 a.m. New York time, ensuring disciplined and repeatable intraday testing.
Swing-Based SL Models: Traders can select between three stop-loss protection types:
First Swing: Most recent structural level
Second Swing: Prior level
Full Coverage: All recent swing levels + configurable pip buffer
Dynamic TP Calculation: Take-Profit is projected as a risk-based multiple (RR), fully adjustable via input.
Capital-Based Risk Management: Risk is defined as a percentage of a fixed account size (e.g., $100 per trade from $10,000), and lot size is automatically calculated based on SL distance.
Fallback Entry Logic: If structural breakout is present but trend is not confirmed, a secondary entry is triggered.
End-of-Session Management: Any open trades are automatically closed at 11:45 a.m. NY time, with optional manual labeling or review.
📊 Visual Features (Optional in Indicator Version):
(Note: Visuals apply to the indicator version of LANZ 2.0, not this backtest script)
Swing level labels (1st, 2nd) and dynamic SL/TP lines.
Real-time session coloring for clarity: Pre-London, Entry Window, and NY Close.
Outcome labels: +RR, -RR, or net % at close.
Auto-cleanup of previous drawings for a clean chart per session.
⚙️ How It Works:
Detects last trend and BoS using swing logic before 02:00 a.m. NY.
At 02:00 a.m., evaluates directional bias and executes BUY or SELL if confirmed.
Applies selected SL logic (1st, 2nd, or full swing protection).
Sets TP based on the RR multiplier.
Closes the trade either on SL, TP, or at 11:45 a.m. NY manually.
🔔 Alerts:
Time-of-day alert at 02:00 a.m. NY to monitor execution.
Can be extended to cover SL/TP triggers or new BoS events.
📝 Notes:
Designed for backtesting precision and discretionary decision-making.
Ideal for Forex pairs, indices, or assets active during the London session.
Fully customizable: session timing, swing logic, SL buffer, and RR.
👤 Credits:
Strategy built by @rau_u_lanz using Pine Script v6, combining structural logic, capital-based risk control, and London-session timing in a backtest-ready framework for traders who demand accuracy and structure.

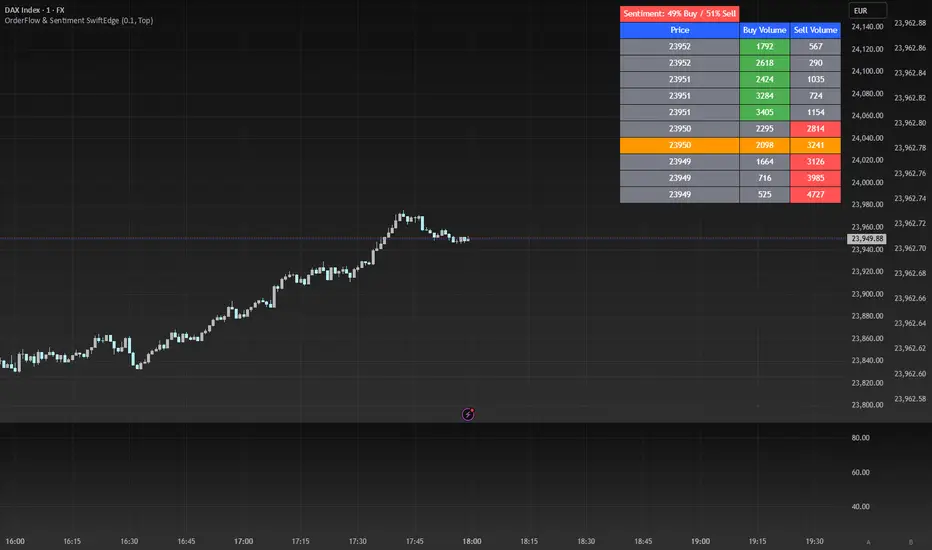
OrderFlow Sentiment SwiftEdgeOrderFlow Sentiment SwiftEdge
Overview
OrderFlow Sentiment SwiftEdge is a visual indicator designed to help traders analyze market dynamics through a simulated orderbook and market sentiment display. It breaks down the current candlestick into 10 price bins, estimating buy and sell volumes, and presents this data in an orderbook table alongside a sentiment row showing the buy vs. sell bias. This tool provides a quick and intuitive way to assess orderflow activity and market sentiment directly on your chart.
How It Works
The indicator consists of two main components: an Orderbook Table and a Market Sentiment Row.
Orderbook Table:
Simulates buy and sell volumes for the current candlestick by distributing total volume into 10 price bins based on price movement and proximity to open/close levels.
Displays the price bins in a table with columns for Price, Buy Volume, and Sell Volume, sorted from highest to lowest price.
Highlights the current price level in orange for easy identification, while buy and sell dominance is indicated with green (buy) or red (sell) backgrounds.
Market Sentiment Row:
Calculates the overall buy and sell sentiment (as a percentage) for the current candlestick based on the simulated orderflow data.
Displays the sentiment above the orderbook table, with the background colored green if buyers dominate or red if sellers dominate.
Features
Customizable Colors: Choose colors for buy (default: green), sell (default: red), and current price (default: orange) levels.
Lot Scaling Factor: Adjust the volume scaling factor (default: 0.1 lots per volume unit) to simulate realistic lot sizes.
Table Position: Select the table position on the chart (Top, Middle, or Bottom; default: Middle).
Default Properties
Positive Color: Green
Negative Color: Red
Current Price Color: Orange
Lot Scaling Factor: 0.1
Table Position: Middle
Usage
This indicator is ideal for traders who want to visualize orderflow dynamics and market sentiment in real-time. The orderbook table provides a snapshot of buy and sell activity at different price levels within the current candlestick, helping you identify areas of high buying or selling pressure. The sentiment row offers a quick overview of market bias, allowing you to gauge whether buyers or sellers are currently dominating. Use this information to complement your trading decisions, such as identifying potential breakout levels or confirming trend direction.
Limitations
This indicator simulates orderflow data based on candlestick price movement and volume, as TradingView does not provide tick-by-tick data. The volume distribution is an approximation and should be used as a visual aid rather than a definitive measure of market activity.
The indicator operates on the chart's current timeframe and does not incorporate higher timeframe data.
The simulated volumes are scaled using a user-defined lot scaling factor, which may not reflect actual market lot sizes.
Disclaimer
This indicator is for informational purposes only and does not guarantee trading results. Always conduct your own analysis and manage risk appropriately. The simulated orderflow data is an estimation and may not reflect real market conditions.
The ICT Ultimate Grid | MarketMaverisk GroupThe ICT Ultimate Grid | MarketMaverisk Group
This script is a fully customizable checklist based on ICT (Inner Circle Trader) concepts. It helps traders validate entry conditions across three timeframes:
LTP (Long-Term), ITP (Intermediate-Term), and STP (Short-Term).
⸻
✅ Purpose & Utility:
Instead of generating simple buy/sell signals, this tool assists traders in making structured, confirmation-based decisions. It presents a visual checklist with 11 customizable columns—each can be individually toggled for each timeframe and displays ✅ or ❌ confirmation status.
⸻
🧠 Confirmation Structure:
The checklist covers the following core elements from the ICT methodology:
• ERL⇔IRL and IRL⇔ERL (presented as special confirmations below the table)
• DOL – Drow On liqudity Level
• PD – permium or discuant
• SMT – Smart Money Trap / Inter-market Divergence
• CSD – Change in State of dlivery
• MSS – Market Structure Shift
• MMXM – Market maker (buy or sell) model
• FVG – Fair Value Gap
• OB – Order Block
• BRK.B – breker Block
Each item can be enabled or disabled for LTP, ITP, and STP individually.
⸻
📊 Visual Design:
• Clean, compact table displayed in the top-right corner of the chart.
• Clear color scheme (✅ Green = Confirmed, ❌ Red = Not Confirmed, Grey = Hidden/Disabled).
• Timeframes are stacked row-wise (LTP, ITP, STP).
• Inputs allow fine-grained control over what elements are shown in each timeframe.
• Additional rows are used to confirm:
• HTF Key Level
• Direction: Reversal ↩️ or Continuation 🔂
• Bias: Bullish 🔼 or Bearish 🔽
⸻
📈 Use Case:
This tool is ideal for traders who follow:
• ICT-based trading approaches
• Market structure + Liquidity analysis
• Day trading, scalping, or swing setups
• Confirmation-based entries after higher-timeframe alignment
⸻
⚙️ Recommended Timeframe Settings:
• LTP = D1 or 4H
• ITP = 1H or 15min
• STP = 5min or 3min or 1min
• Session time: Best used between 02:00 and 05:00 on london killzone & 08:00 and 12:00 on New york killzone in New York timezone (UTC -5)
(you can customize this in strategy version)
⸻
🛠 Technical Note:
This version is an indicator and does not generate signals or alerts by itself. For full automation, a strategy version is also available upon request.
⸻
Let me know if you’d like me to also write a “strategy description” or help you prepare the public chart layout 📊 to make your publish clean and attractivE

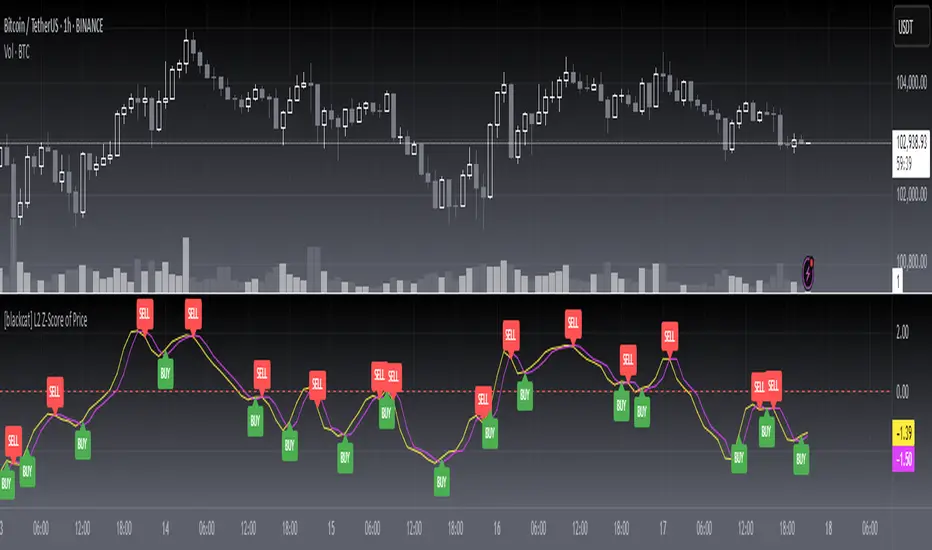
[blackcat] L2 Z-Score of PriceOVERVIEW
The L2 Z-Score of Price indicator offers traders an insightful perspective into how current prices diverge from their historical norms through advanced statistical measures. By leveraging Z-scores, it provides a robust framework for identifying potential reversals in financial markets. The Z-score quantifies the number of standard deviations that a data point lies away from the mean, thus serving as a critical metric for recognizing overbought or oversold conditions. 🎯
Key benefits encompass:
• Precise calculation of Z-scores reflecting true price deviations.
• Interactive plotting features enhancing visual clarity.
• Real-time generation of buy/sell signals based on crossover events.
STATISTICAL ANALYSIS COMPONENTS
📉 Mean Calculation:
Utilizes Simple Moving Averages (SMAs) to establish baseline price references.
Provides smooth representations filtering short-term noise preserving long-term trends.
Fundamental for deriving subsequent deviation metrics accurately.
📈 Standard Deviation Measurement:
Quantifies dispersion around established means revealing underlying variability.
Crucial for assessing potential volatility levels dynamically adapting strategies accordingly.
Facilitates precise Z-score derivations ensuring statistical rigor.
🕵️♂️ Z-SCORE DETECTION:
Measures standardized distances indicating relative positions within distributions.
Helps pinpoint extreme conditions signaling impending reversals proactively.
Enables early identification of trend exhaustion phases prompting timely actions.
INDICATOR FUNCTIONALITY
🔢 Core Algorithms:
Integrates SMAs along with standardized deviation formulas generating precise Z-scores.
Employs Arithmetic Mean Line Algorithm (AMLA) smoothing techniques improving interpretability.
Ensures consistent adherence to predefined statistical protocols maintaining accuracy.
🖱️ User Interface Elements:
Dedicated plots displaying real-time Z-score markers facilitating swift decision-making.
Context-sensitive color coding distinguishing positive/negative deviations intuitively.
Background shading highlighting proximity to key threshold activations enhancing visibility.
STRATEGY IMPLEMENTATION
✅ Entry Conditions:
Confirm bullish/bearish setups validated through multiple confirmatory signals.
Validate entry decisions considering concurrent market sentiment factors.
Assess alignment between Z-score readings and broader trend directions ensuring coherence.
🚫 Exit Mechanisms:
Trigger exits upon hitting predetermined thresholds derived from historical analyses.
Monitor continuous breaches signifying potential trend reversals promptly executing closures.
Execute partial/total closes contingent upon cumulative loss limits preserving capital efficiently.
PARAMETER CONFIGURATIONS
🎯 Optimization Guidelines:
Length: Governs responsiveness versus smoothing trade-offs balancing sensitivity/stability.
Price Source: Dictates primary data series driving Z-score computations selecting relevant inputs accurately.
💬 Customization Recommendations:
Commence with baseline defaults; iteratively refine parameters isolating individual impacts.
Evaluate adjustments independently prior to combined modifications minimizing disruptions.
Prioritize minimizing erroneous trigger occurrences first optimizing signal fidelity.
Sustain balanced risk-reward profiles irrespective of chosen settings upholding disciplined approaches.
ADVANCED RISK MANAGEMENT
🛡️ Proactive Risk Mitigation Techniques:
Enforce strict compliance with pre-defined maximum leverage constraints adhering strictly to guidelines.
Mandatorily apply trailing stop-loss orders conforming to script outputs reinforcing discipline.
Allocate positions proportionately relative to available capital reserves managing exposures prudently.
Conduct periodic reviews gauging strategy effectiveness rigorously identifying areas needing refinement.
⚠️ Potential Pitfalls & Solutions:
Address frequent violations arising during heightened volatility phases necessitating manual interventions judiciously.
Manage false alerts warranting immediate attention avoiding adverse consequences systematically.
Prepare contingency plans mitigating margin call possibilities preparing proactive responses effectively.
Continuously assess automated system reliability amidst fluctuating conditions ensuring seamless functionality.
PERFORMANCE AUDITS & REFINEMENTS
🔍 Critical Evaluation Metrics:
Assess win percentages consistently across diverse trading instruments gauging reliability.
Calculate average profit ratios per successful execution measuring profitability efficiency accurately.
Measure peak drawdown durations alongside associated magnitudes evaluating downside risks comprehensively.
Analyze signal generation frequencies revealing hidden patterns potentially skewing outcomes uncovering systematic biases.
📈 Historical Data Analysis Tools:
Maintain comprehensive records capturing every triggered event meticulously documenting results.
Compare realized profits/losses against backtested simulations benchmarking actual vs expected performances accurately.
Identify recurrent systematic errors demanding corrective actions implementing iterative refinements steadily.
Document evolving performance metrics tracking progress dynamically addressing identified shortcomings proactively.
PROBLEM SOLVING ADVICE
🔧 Frequent Encountered Challenges:
Unpredictable behaviors emerging within thinly traded markets requiring filtration processes.
Latency issues manifesting during abrupt price fluctuations causing missed opportunities.
Overfitted models yielding suboptimal results post-extensive tuning demanding recalibrations.
Inaccuracies stemming from incomplete/inaccurate data feeds necessitating verification procedures.
💡 Effective Resolution Pathways:
Exclude low-liquidity assets prone to erratic movements enhancing signal integrity.
Introduce buffer intervals safeguarding major news/event impacts mitigating distortions effectively.
Limit ongoing optimization attempts preventing model degradation maintaining optimal performance levels consistently.
Verify reliable connections ensuring uninterrupted data flows guaranteeing accurate interpretations reliably.
USER ENGAGEMENT SEGMENT
🤝 Community Contributions Welcome
Highly encourage active participation sharing experiences & recommendations!
RSI with HMA & Momentum ZonesRSI with HMA & Momentum Zones — Indicator Description
This indicator combines Relative Strength Index (RSI) analysis with Hull Moving Averages (HMA) and Momentum Zone detection to provide a multi-layered view of market strength, trend shifts, and divergence signals.
It includes:
Main Features:
RSI Core:
Standard RSI calculated from a customizable source (close, open, etc.) with adjustable length.
A dynamic RSI Signal Line is plotted with selectable smoothing types (SMA, EMA, SMMA, WMA, VWMA) to enhance trend-following signals.
RSI crossovers of its signal line change color (green for bullish crossovers, red for bearish crossunders).
Hull Moving Averages (HMA):
Two HMA lines are plotted based on the RSI:
Short HMA (fast) and Long HMA (slow).
Color shifts indicate crossovers between RSI and Short HMA (short-term trend change) and Short HMA vs Long HMA (longer-term trend shifts).
Momentum Zones:
When the gap between the RSI and the Long HMA exceeds a user-defined threshold:
A green background highlights strong bullish momentum.
A red background highlights strong bearish momentum.
Helps visualize when momentum becomes extended.
Divergence Detection (Optional):
Regular and hidden bullish and bearish divergences are automatically detected between price and RSI.
Divergences are plotted on the RSI pane with labels ("Bull", "H Bull", "Bear", "H Bear").
Adjustable lookback settings for fine-tuning sensitivity.
Alerts are available for all divergence events.
Visual Enhancements:
A shaded cloud fills between RSI and its signal line, green for bullish bias and red for bearish bias.
Horizontal bands at 70, 50, and 30 levels to mark traditional RSI zones (overbought, neutral, oversold).
Customization Options:
All major components — RSI settings, Signal Line type, HMA lengths, Momentum Zone threshold, and Divergence controls — are fully adjustable.

TDO & Hit Rates by Weekday (5 min)Purpose
Tracks how often the next NY session “hits” the previous day’s True Day Open (TDO) level, separately for sessions that open above vs. below TDO, and breaks the statistics down by weekday (Mon–Fri) plus an overall summary.
Key Features
True Day Open (TDO) Plot
Captures the prior day’s 23:00 CT close price as the TDO.
Plots it as a continuous yellow line across your chart.
Session Labeling
At the end of each NY session (08:30–15:00 CT), places a small “TDO” label at the TDO price to confirm visually where it lay during that day.
Hit‑Count Logic
For each 5 min bar in the NY session, checks if the bar’s high ≥ TDO ≥ low (i.e. the TDO level was “hit”).
Classifies each session by whether its opening price (first 5 min bar) was above or below the TDO.
Weekday Statistics Table
Displays in the bottom‑left of your main chart window.
Rows: Header, Mon, Tue, Wed, Thu, Fri, All.
Columns:
% Hit Above: % of “above‑TDO” sessions that saw at least one hit
% Hit Below: % of “below‑TDO” sessions that saw at least one hit
Automatically updates in real time as new sessions complete.
Inputs & Settings
Data Resolution: Default = 5 min; use any intraday timeframe you like (1, 3, 15 min, etc.).
Extended Hours: Make sure your chart’s Extended Session (overnight) is enabled so the 23:00 CT bar exists.
Overlay: Draws directly on your price chart (no separate pane).
How to Use
Add to Chart: Paste the Pine v5 code into TradingView’s editor and apply to your ES (or other) futures chart.
Enable Overnight Bars: In Chart Settings → Symbol/Session → include Extended Hours.
Select Timeframe: Set the chart (or the indicator’s “Data Resolution” input) to 5 min (or your preferred intraday).
Read the Table:
Each weekday row shows how reliable TDO touches have been historically, separately for “above” and “below” opens.
The bottom “All” row summarizes combined performance.
What You Learn
Edge Analysis: Do sessions opening above TDO tend to test that level more often than those opening below (or vice versa)?
Day‑of‑Week Bias: Are certain weekdays more prone to TDO retests?
Overall Confidence: The “All” row lets you see your full-sample hit‑rate on both sides.

Open - CSC Bars - 33 CSC Bars – Early Session Price Action Filter
This script detects when the first three bars of the RTH (Regular Trading Hours) session all move in the same direction — either all bullish or all bearish.
It’s a tool for price action traders who want to develop structured opening strategies by observing clean directional agreement at the session start. The indicator highlights the third bar when the sequence confirms directional bias.
🔍 How It Works:
Monitors the first three bars after the RTH session begins.
If all three bars are bullish, it highlights the third bar (same for bearish sequences).
No projections, signals, or entries—purely a visual tool to observe and study opening behavior.
🎯 Use Case:
This script is designed to help traders build and test opening-based frameworks by identifying potential trend bias early in the day.
Note: This is an open-source utility script with a simple function. It does not generate signals or predictions and is intended to assist with observation and discretionary strategy building.

Rolling ATR Momentum - EnhancedATR Rolling Momentum Indicator – User Manual
---
🔍 Overview
The ATR Rolling Momentum Indicator is a dynamic volatility tool built on the Average True Range (ATR). It not only tracks increasing or decreasing momentum but also provides early warnings and confirmation signals for potential breakout moves. It’s especially powerful for futures and options traders looking to align with expanding price action.
---
📊 Core Components
✅ ATR Delta (Rolling ATR)
- Definition: Difference between current ATR and past ATR (user-defined lookback).
- Use: Tells whether volatility is expanding (positive delta) or contracting (negative delta).
- Visual: Green line for rising momentum, red for declining.
🟣 ATR Delta Slope
- Definition: Measures acceleration in momentum.
- Use: Helps identify early signs of breakout buildup.
- Visual: Purple line. Watch for slope turning up from below.
🟡 Volatility Squeeze (Yellow Dot)
- Definition: Current ATR is significantly lower than its 20-period average.
- Use: Indicates the market is coiling—possible breakout ahead.
🔼 Momentum Start (Green Triangle)
- Definition: ATR Delta slope turns from negative to positive.
- Use: Early warning to prepare for volatility expansion.
🔷 Breakout Confirmation (Blue Label Up)
- Definition: ATR Delta exceeds its high of the last 10 candles.
- Use: Confirms volatility breakout—trade opportunity if direction aligns.
🟩/🟥 Background Color
- Green Background: Momentum rising (positive ATR delta)
- Red Background: Momentum falling (negative ATR delta)
- Yellow Tint: Active squeeze zone
---
✅ How to Use It (Futures/Options Focus)
Step-by-Step:
1. Squeeze Detected (Yellow Dot) → Stay alert. Market is coiling.
2. Green Triangle Appears → Momentum is starting to rise.
3. Background Turns Green → Confirmed rising momentum.
4. Blue Label Appears → Confirmed breakout (enter trade if trend aligns).
Directional Bias:
- Use your main chart setup (price action, EMAs, trendlines, etc.) to decide direction (Call or Put, Long or Short).
- ATR Momentum only tells you how strong the move is—not which way.
---
⚙️ Inputs & Settings
- ATR Period: Default 14 (core volatility measure)
- Rolling Lookback: Used to calculate delta (default 5)
- Slope Length: Used to measure acceleration (default 3)
- Squeeze Factor: Default 0.8 — lower = more sensitive squeeze detection
- Breakout Lookback: Checks ATR delta against last X bars (default 10)
---
🧠 Pro Tips
- Works great when paired with EMA stacks, price structure, or breakout patterns.
- Avoid taking trades based only on squeeze or momentum—combine with chart confirmation.
- If background turns red after a breakout, it may be losing momentum—book partials or tighten stops.
---
🧭 Ideal For:
- Nifty/BankNifty Futures
- Option directional trades (call/put buying)
- Index scalping and momentum swing setups
---
Use this tool as your volatility compass—it won't tell you where to go, but it'll tell you when the wind is strong enough to move fast.
End of Manual

Uptrick: Z-Score FlowOverview
Uptrick: Z-Score Flow is a technical indicator that integrates trend-sensitive momentum analysi s with mean-reversion logic derived from Z-Score calculations. Its primary objective is to identify market conditions where price has either stretched too far from its mean (overbought or oversold) or sits at a statistically “normal” range, and then cross-reference this observation with trend direction and RSI-based momentum signals. The result is a more contextual approach to trade entry and exit, emphasizing precision, clarity, and adaptability across varying market regimes.
Introduction
Financial instruments frequently transition between trending modes, where price extends strongly in one direction, and ranging modes, where price oscillates around a central value. A simple statistical measure like Z-Score can highlight price extremes by comparing the current price against its historical mean and standard deviation. However, such extremes alone can be misleading if the broader market structure is trending forcefully. Uptrick: Z-Score Flow aims to solve this gap by combining Z-Score with an exponential moving average (EMA) trend filter and a smoothed RSI momentum check, thus filtering out signals that contradict the prevailing market environment.
Purpose
The purpose of this script is to help traders pinpoint both mean-reversion opportunities and trend-based pullbacks in a way that is statistically grounded yet still mindful of overarching price action. By pairing Z-Score thresholds with supportive conditions, the script reduces the likelihood of acting on random price spikes or dips and instead focuses on movements that are significant within both historical and current contextual frameworks.
Originality and Uniquness
Layered Signal Verification: Signals require the fulfillment of multiple layers (Z-Score extreme, EMA trend bias, and RSI momentum posture) rather than merely breaching a statistical threshold.
RSI Zone Lockout: Once RSI enters an overbought/oversold zone and triggers a signal, the script locks out subsequent signals until RSI recovers above or below those zones, limiting back-to-back triggers.
Controlled Cooldown: A dedicated cooldown mechanic ensures that the script waits a specified number of bars before issuing a new signal in the opposite direction.
Gradient-Based Visualization: Distinct gradient fills between price and the Z-Mean line enhance readability, showing at a glance whether price is trading above or below its statistical average.
Comprehensive Metrics Panel: An optional on-chart table summarizes the Z-Score’s key metrics, streamlining the process of verifying current statistical extremes, mean levels, and momentum directions.
Why these indicators were merged
Z-Score measurements excel at identifying when price deviates from its mean, but they do not intrinsically reveal whether the market’s trajectory supports a reversion or if price might continue along its trend. The EMA, commonly used for spotting trend directions, offers valuable insight into whether price is predominantly ascending or descending. However, relying solely on a trend filter overlooks the intensity of price moves. RSI then adds a dedicated measure of momentum, helping confirm if the market’s energy aligns with a potential reversal (for example, price is statistically low but RSI suggests looming upward momentum). By uniting these three lenses—Z-Score for statistical context, EMA for trend direction, and RSI for momentum force—the script offers a more comprehensive and adaptable system, aiming to avoid false positives caused by focusing on just one aspect of price behavior.
Calculations
The core calculation begins with a simple moving average (SMA) of price over zLen bars, referred to as the basis. Next, the script computes the standard deviation of price over the same window. Dividing the difference between the current price and the basis by this standard deviation produces the Z-Score, indicating how many standard deviations the price is from its mean. A positive Z-Score reveals price is above its average; a negative reading indicates the opposite.
To detect overall market direction, the script calculates an exponential moving average (emaTrend) over emaTrendLen bars. If price is above this EMA, the script deems the market bullish; if below, it’s considered bearish. For momentum confirmation, the script computes a standard RSI over rsiLen bars, then applies a smoothing EMA over rsiEmaLen bars. This smoothed RSI (rsiEma) is monitored for both its absolute level (oversold or overbought) and its slope (the difference between the current and previous value). Finally, slopeIndex determines how many bars back the script compares the basis to check whether the Z-Mean line is generally rising, falling, or flat, which then informs the coloring scheme on the chart.
Calculations and Rational
Simple Moving Average for Baseline: An SMA is used for the core mean because it places equal weight on each bar in the lookback period. This helps maintain a straightforward interpretation of overbought or oversold conditions in the context of a uniform historical average.
Standard Deviation for Volatility: Standard deviation measures the variability of the data around the mean. By dividing price’s difference from the mean by this value, the Z-Score can highlight whether price is unusually stretched given typical volatility.
Exponential Moving Average for Trend: Unlike an SMA, an EMA places more emphasis on recent data, reacting quicker to new price developments. This quicker response helps the script promptly identify trend shifts, which can be crucial for filtering out signals that go against a strong directional move.
RSI for Momentum Confirmation: RSI is an oscillator that gauges price movement strength by comparing average gains to average losses over a set period. By further smoothing this RSI with another EMA, short-lived oscillations become less influential, making signals more robust.
SlopeIndex for Slope-Based Coloring: To clarify whether the market’s central tendency is rising or falling, the script compares the basis now to its level slopeIndex bars ago. A higher current reading indicates an upward slope; a lower reading, a downward slope; and similar readings, a flat slope. This is visually represented on the chart, providing an immediate sense of the directionality.
Inputs
zLen (Z-Score Period)
Specifies how many bars to include for computing the SMA and standard deviation that form the basis of the Z-Score calculation. Larger values produce smoother but slower signals; smaller values catch quick changes but may generate noise.
emaTrendLen (EMA Trend Filter)
Sets the length of the EMA used to detect the market’s primary direction. This is pivotal for distinguishing whether signals should be considered (price aligning with an uptrend or downtrend) or filtered out.
rsiLen (RSI Length)
Defines the window for the initial RSI calculation. This RSI, when combined with the subsequent smoothing EMA, forms the foundation for momentum-based signal confirmations.
rsiEmaLen (EMA of RSI Period)
Applies an exponential moving average over the RSI readings for additional smoothing. This step helps mitigate rapid RSI fluctuations that might otherwise produce whipsaw signals.
zBuyLevel (Z-Score Buy Threshold)
Determines how negative the Z-Score must be for the script to consider a potential oversold signal. If the Z-Score dives below this threshold (and other criteria are met), a buy signal is generated.
zSellLevel (Z-Score Sell Threshold)
Determines how positive the Z-Score must be for a potential overbought signal. If the Z-Score surpasses this threshold (and other checks are satisfied), a sell signal is generated.
cooldownBars (Cooldown (Bars))
Enforces a bar-based delay between opposite signals. Once a buy signal has fired, the script must wait the specified number of bars before registering a new sell signal, and vice versa.
slopeIndex (Slope Sensitivity (Bars))
Specifies how many bars back the script compares the current basis for slope coloration. A bigger slopeIndex highlights larger directional trends, while a smaller number emphasizes shorter-term shifts.
showMeanLine (Show Z-Score Mean Line)
Enables or disables the plotting of the Z-Mean and its slope-based coloring. Traders who prefer minimal chart clutter may turn this off while still retaining signals.
Features
Statistical Core (Z-Score Detection):
This feature computes the Z-Score by taking the difference between the current price and the basis (SMA) and dividing by the standard deviation. In effect, it translates price fluctuations into a standardized measure that reveals how significant a move is relative to the typical variation seen over the lookback. When the Z-Score crosses predefined thresholds (zBuyLevel for oversold and zSellLevel for overbought), it signals that price could be at an extreme.
How It Works: On each bar, the script updates the SMA and standard deviation. The Z-Score is then refreshed accordingly. Traders can interpret particularly large negative or positive Z-Score values as scenarios where price is abnormally low or high.
EMA Trend Filter:
An EMA over emaTrendLen bars is used to classify the market as bullish if the price is above it and bearish if the price is below it. This classification is applied to the Z-Score signals, accepting them only when they align with the broader price direction.
How It Works: If the script detects a Z-Score below zBuyLevel, it further checks if price is actually in a downtrend (below EMA) before issuing a buy signal. This might seem counterintuitive, but a “downtrend” environment plus an oversold reading often signals a potential bounce or a mean-reversion play. Conversely, for sell signals, the script checks if the market is in an uptrend first. If it is, an overbought reading aligns with potential profit-taking.
RSI Momentum Confirmation with Oversold/Overbought Lockout:
RSI is calculated over rsiLen, then smoothed by an EMA over rsiEmaLen. If this smoothed RSI dips below a certain threshold (for example, 30) and then begins to slope upward, the indicator treats it as a potential sign of recovering momentum. Similarly, if RSI climbs above a certain threshold (for instance, 70) and starts to slope downward, that suggests dwindling momentum. Additionally, once RSI is in these zones, the indicator locks out repetitive signals until RSI fully exits and re-enters those extreme territories.
How It Works: Each bar, the script measures whether RSI has dropped below the oversold threshold (like 30) and has a positive slope. If it does, the buy side is considered “unlocked.” For sell signals, RSI must exceed an overbought threshold (70) and slope downward. The combination of threshold and slope helps confirm that a reversal is genuinely in progress instead of issuing signals while momentum remains weak or stuck in extremes.
Cooldown Mechanism:
The script features a custom bar-based cooldown that prevents issuing new signals in the opposite direction immediately after one is triggered. This helps avoid whipsaw situations where the market quickly flips from oversold to overbought or vice versa.
How It Works: When a buy signal fires, the indicator notes the bar index. If the Z-Score and RSI conditions later suggest a sell, the script compares the current bar index to the last buy signal’s bar index. If the difference is within cooldownBars, the signal is disallowed. This ensures a predefined “quiet period” before switching signals.
Slope-Based Coloring (Z-Mean Line and Shadow):
The script compares the current basis value to its value slopeIndex bars ago. A higher reading now indicates a generally upward slope, while a lower reading indicates a downward slope. The script then shades the Z-Mean line in a corresponding bullish or bearish color, or remains neutral if little change is detected.
How It Works: This slope calculation is refreshingly straightforward: basis – basis . If the result is positive, the line is colored bullish; if negative, it is colored bearish; if approximately zero, it remains neutral. This provides a quick visual cue of the medium-term directional bias.
Gradient Overlays:
With gradient fills, the script highlights where price stands in relation to the Z-Mean. When price is above the basis, a purple-shaded region is painted, visually indicating a “bearish zone” for potential overbought conditions. When price is below, a teal-like overlay is used, suggesting a “bullish zone” for potential oversold conditions.
How It Works: Each bar, the script checks if price is above or below the basis. It then applies a fill between close and basis, using distinct colors to show whether the market is trading above or below its mean. This creates an immediate sense of how extended the market might be.
Buy and Sell Labels (with Alerts):
When a legitimate buy or sell condition passes every check (Z-Score threshold, EMA trend alignment, RSI gating, and cooldown clearance), the script plots a corresponding label directly on the chart. It also fires an alert (if alerts are set up), making it convenient for traders who want timely notifications.
How It Works: If rawBuy or rawSell conditions are met (refined by RSI, EMA trend, and cooldown constraints), the script calls the respective plot function to paint an arrow label on the chart. Alerts are triggered simultaneously, carrying easily recognizable messages.
Metrics Table:
The optional on-chart table (activated by showMetrics) presents real-time Z-Score data, including the current Z-Score, its rolling mean, the maximum and minimum Z-Score values observed over the last zLen bars, a percentile position, and a short-term directional note (rising, falling, or flat).
Current – The present Z-Score reading
Mean – Average Z-Score over the zLen period
Min/Max – Lowest and highest Z-Score values within zLen
Position – Where the current Z-Score sits between the min and max (as a percentile)
Trend – Whether the Z-Score is increasing, decreasing, or flat
Conclusion
Uptrick: Z-Score Flow offers a versatile solution for traders who need a statistically informed perspective on price extremes combined with practical checks for overall trend and momentum. By leveraging a well-defined combination of Z-Score, EMA trend classification, RSI-based momentum gating, slope-based visualization, and a cooldown mechanic, the script reduces the occurrence of false or premature signals. Its gradient fills and optional metrics table contribute further clarity, ensuring that users can quickly assess market posture and make more confident trading decisions in real time.
Disclaimer
This script is intended solely for informational and educational purposes. Trading in any financial market comes with substantial risk, and there is no guarantee of success or the avoidance of loss. Historical performance does not ensure future results. Always conduct thorough research and consider professional guidance prior to making any investment or trading decisions.

Recency-Weighted Market Memory w/ Quantile-Based DriftRecency-Weighted Market Memory w/ Quantile-Based Drift
This indicator combines market memory, recency-weighted drift, quantile-based volatility analysis, momentum (RoC) filtering, and historical correlation checks to generate dynamic forecasts of possible future price levels. It calculates bullish and bearish forecast lines at each horizon, reflecting how the price might behave based on historical similarities.
Trading Concepts & Mathematical Foundations Explained
1) Market Memory
Concept:
Markets tend to repeat past behaviors under similar conditions. By identifying historical market states that closely match current conditions, we predict future price movements based on what happened historically.
Calculation Steps:
We select a historical lookback window (for example, 210 bars).
Each historical bar within this window is evaluated to see if its conditions match the current market. Conditions include:
Correlation between price change and bullish/bearish volume changes (over a user-defined correlation lookback period).
Momentum (Rate of Change, RoC) measured over a separate lookback period.
Only bars closely matching current conditions (within user-defined tolerance percentages) are included.
2) Recency-Weighted Drift
Concept:
Recent market movements often influence future direction. We assign more importance to recent bars to capture the current market bias effectively.
Calculation Steps:
Consider recent price changes between opens and closes for a user-defined drift lookback (for example, last 20 bars).
Give higher weight to recent bars (the most recent bar gets the highest weight, and weights decrease progressively for older bars).
Average these weighted changes separately for upward and downward movements, then combine these averages to calculate a final drift percentage relative to the current price.
3) Correlation Filtering
Concept:
Price changes often correlate strongly with bullish or bearish volume activity. By using historical correlation comparisons, we focus only on past market states with similar volume-price dynamics.
Calculation Steps:
Compute current correlations between price changes and bullish/bearish volume over the user-defined correlation lookback.
Evaluate each historical bar to see if its correlation closely matches the current correlation (within a user-specified percentage tolerance).
Only historical bars meeting this correlation criterion are selected.
4) Momentum (RoC) Filtering
Concept:
Two market periods may exhibit similar correlation structures but differ in how fast prices move (momentum). To ensure true similarity, momentum is checked as an additional filter.
Calculation Steps:
Compute the current Rate of Change (RoC) over the specified RoC lookback.
For each candidate historical bar, calculate its historical RoC.
Only include historical bars whose RoC closely matches the current RoC (within the RoC percentage tolerance).
5) Quantile-Based Volatility and Drift Amplification
Concept:
Quantiles (such as the 95th, 50th, and 5th percentiles) help gauge if current prices are near historical extremes or the median. Quantile bands measure volatility expansions and contractions.
Calculation Steps:
Calculate the 95%, 50%, and 5% quantiles of price over the quantile lookback period.
Add and subtract multiples of the standard deviation to these quantiles, creating upper and lower bands.
Measure the bands' widths relative to the current price as volatility indicators.
Determine the active quantile (95%, 50%, or 5%) based on proximity to the current price (within a percentage tolerance).
Compute the rate of change (RoC) of the active quantile to detect directional bias.
Combine volatility and quantile RoC into a scaling factor that amplifies or dampens expected price moves.
6) Expected Value (EV) Computation & Forecast Lines
Concept:
We forecast future prices based on how similarly-conditioned historical periods performed. We average historical moves to estimate the expected future price.
Calculation Steps:
For each forecast horizon (e.g., 1 to 27 bars ahead), collect all historical price moves that passed correlation and RoC filters.
Calculate average historical moves for bullish and bearish cases separately.
Adjust these averages by applying recency-weighted drift and quantile-based scaling.
Translate adjusted percentages into absolute future price forecasts.
Draw bullish and bearish forecast lines accordingly.
Indicator Inputs & Their Roles
Correlation Tolerance (%)
Adjusts how strictly the indicator matches historical correlation. Higher tolerance includes more matches, lower tolerance selects fewer but closer matches.
Price RoC Lookback and Price RoC Tolerance (%)
Controls how momentum (speed of price moves) is matched historically. Increasing tolerance broadens historical matches.
Drift Lookback (bars)
Determines the number of recent bars influencing current drift estimation.
Quantile Lookback Period and Std Dev Multipliers
Defines quantile calculation and the size of the volatility bands.
Quantile Contact Tolerance (%)
Sets how close the current price must be to a quantile for it to be considered "active."
Forecast Horizons
Specifies how many future bars to forecast.
Continuous Forecast Lines
Toggles between drawing continuous lines or separate horizontal segments for each forecast horizon.
Practical Trading Applications
Bullish & Bearish EV Lines
These forecast lines indicate expected price levels based on historical similarity. Green indicates positive expectations; red indicates negative.
Momentum vs. Mean Reversion
Wide quantile bands and high drift suggest momentum, while extremes may signal possible reversals.
Volatility Sensitivity
Forecasts adapt dynamically to market volatility. Broader bands increase forecasted price movements.
Filtering Non-Relevant Historical Data
By using both correlation and RoC filtering, irrelevant past periods are excluded, enhancing forecast reliability.
Multi-Timeframe Suitability
Adaptable parameters make this indicator suitable for different trading styles and timeframes.
Complementary Tool
This indicator provides probabilistic projections rather than direct buy or sell signals. Combine it with other trading signals and analyses for optimal results.
Important Considerations
While historically-informed forecasts are valuable, market behavior can evolve unpredictably. Always manage risks and use supplementary analysis.
Experiment extensively with input settings for your specific market and timeframe to optimize forecasting performance.
Summary
The Recency-Weighted Market Memory w/ Quantile-Based Drift indicator uniquely merges multiple sophisticated concepts, delivering dynamic, historically-informed price forecasts. By combining historical similarity, adaptive drift, momentum filtering, and quantile-driven volatility scaling, traders gain an insightful perspective on future price possibilities.
Feel free to experiment, explore, and enjoy this powerful addition to your trading toolkit!

EMA Ribbon with 100 MA BY TIJUThe EMA Ribbon with 100 MA is a powerful and visually intuitive indicator designed to help traders identify trends, momentum, and potential support/resistance levels using multiple Exponential Moving Averages (EMAs). By plotting a series of EMAs with varying periods, the script creates a "ribbon" effect on the chart, making it easier to spot trend direction and strength at a glance.
Key Features:
Multiple EMAs for Trend Analysis:
The script plots 8 EMAs with periods ranging from 20 to 55, creating a gradient ribbon effect.
The 100-period EMA is added as a thick blue line, acting as a key level for long-term trend analysis.
Customizable Periods:
Each EMA period is fully customizable, allowing traders to tailor the indicator to their preferred trading style and timeframe.
Visual Clarity:
The EMAs are color-coded, making it easy to distinguish between different periods and identify the overall trend direction.
Dynamic Support/Resistance:
The EMAs act as dynamic support and resistance levels, helping traders identify potential entry and exit points.
Drop Candles Feature:
The script includes an option to drop the first N candles, ensuring cleaner calculations and avoiding false signals during the initial periods.
How to Use:
Trend Identification:
Uptrend: When the shorter-period EMAs are stacked above the longer-period EMAs, it indicates a strong uptrend.
Downtrend: When the longer-period EMAs are stacked above the shorter-period EMAs, it indicates a strong downtrend.
Consolidation: When the EMAs are intertwined, it suggests a sideways or weak trend.
Support/Resistance Levels:
Use the EMAs as dynamic support/resistance levels. For example, in an uptrend, the price may bounce off the lower EMAs.
100-Period EMA:
The 100-period EMA (thick blue line) acts as a key level for long-term trend analysis. A price above this line suggests a bullish bias, while a price below suggests a bearish bias.
Customization:
Adjust the EMA periods and colors to suit your trading strategy.
Use the Drop first N candles option to avoid false signals during the initial periods.
Example Use Cases:
Trend Following:
Enter long positions when the price is above the EMA ribbon and the EMAs are stacked in an uptrend.
Enter short positions when the price is below the EMA ribbon and the EMAs are stacked in a downtrend.
Dynamic Support/Resistance:
Use the EMAs as dynamic support/resistance levels for setting stop-loss or take-profit targets.
Confirmation Tool:
Combine the EMA Ribbon with other indicators (e.g., RSI, MACD) to confirm trade signals.
Settings:
MA-1 to MA-8 Periods: Adjust the periods for the 8 EMAs (default: 20, 25, 30, 35, 40, 45, 50, 55).
MA-100 Period: Adjust the period for the 100 EMA (default: 100).
Source: Choose the price source for the EMAs (default: Close).
Drop First N Candles: Drop the first N candles to avoid false signals (default: 1).
Why Use EMA Ribbon ?
Versatility: Suitable for all trading styles (scalping, day trading, swing trading) and timeframes.
Visual Appeal: The color-coded ribbon makes it easy to interpret the trend at a glance.
Customizable: Tailor the indicator to your specific trading strategy.
Dynamic Levels: Use the EMAs as dynamic support/resistance levels for better risk management.

3x Supertrend + EMA200 Signal Buy/Sell [nsen]The indicator uses signals from three Supertrend lines to determine whether to trade Buy or Sell, with the assistance of a moving average for bias.
Buy/Sell signals are generated when the conditions are met:
A Buy signal is triggered when all three Supertrend lines indicate a bullish trend and are above the EMA.
A Sell signal is triggered when all three Supertrend lines indicate a bearish trend and are below the EMA.
Indicator ใช้สัญญาณจาก Supertrend ทั้งหมด 3 เส้น โดยใช้ในการกำหนดว่าจะเลือกเทรด Buy หรือ Sell โดยการใช้ moveing average เข้ามาช่วยในการ bias
แสดงสัญญาณ Buy/Sell เมื่อเข้าเงื่อนไข
- Supertrend ทั้ง 3 เส้นเป็นสัญญาณ Bullish และอยู่เหนือเส้น EMA จะเปิดสัญญาณ Buy
- Supertrend ทั้ง 3 เส้นเป็นสัญญาณ Bearish และอยู่ใต้เส้น EMA จะเปิดสัญญาณ Sell

EBL - Enigma BOS Logic: A Comprehensive Multi-Timeframe Trend anThe EBL (Enigma BOS Logic) script is designed for traders seeking an advanced and versatile tool for identifying market trends, breakouts, and critical price levels. This indicator leverages multi-timeframe analysis, trend filtering, and customizable guidance line settings to provide an all-in-one solution for informed trading decisions.
What Does EBL Do?
EBL identifies critical breakout levels (BOS - Break of Structure) on up to three selected timeframes and dynamically plots them as horizontal guidance lines. It combines these levels with trend analysis and user-defined filters to show only the most relevant data. The script offers flexibility to adapt to different trading styles, whether you're a scalper, day trader, or swing trader.
Key Features:
Multi-Timeframe Analysis:
Users can select three distinct timeframes (e.g., 4H, 30m, 15m).
Execution timeframe (e.g., 1m or 5m) overlays the lines from the selected higher timeframes for real-time precision.
Customizable Guidance Lines:
Define line length (horizontal bars) and choose whether lines extend to the current price.
Individual color settings for bullish and bearish lines.
Trend Detection Filter:
Automatically determines the overall market trend based on the 50-period SMA on each selected timeframe.
Displays only bullish lines during uptrends and bearish lines during downtrends.
Time-Limited Display:
Option to show only lines from the last three days, reducing clutter and focusing on recent price action.
Alerts:
Trigger alerts when price breaks above or below critical levels on any selected timeframe.
Users can choose to receive alerts only for specific timeframes.
How Does It Work?
Break of Structure (BOS):
The script captures key high and low levels on each selected timeframe.
Levels are dynamically updated as the market evolves.
Trend Filtering:
Trend direction is determined for each timeframe based on whether the close is above or below its 50-period SMA.
The overall trend combines signals from all three timeframes, providing a balanced and holistic view of the market.
User Control:
Customize everything: timeframes, colors, line behavior, and alert conditions.
Adjust filters to focus on your preferred time horizon (e.g., last 3 days).
How to Use:
Select up to three timeframes based on your trading strategy (e.g., 4H for macro view, 30m for intermediate trends, and 15m for precision).
Enable or disable the trend filter to control whether lines reflect the market's directional bias.
Configure alerts for breakout levels that align with your strategy.
Use the execution timeframe to see how higher timeframe levels interact with real-time price action.
Who Is It For?
This indicator is ideal for:
Trend Traders who want a clear view of directional bias across multiple timeframes.
Breakout Traders who need to identify key resistance and support levels dynamically.
Scalpers and Day Traders who require real-time precision by overlaying higher timeframe levels on lower execution timeframes.
Underlying Concepts:
Break of Structure (BOS): Highlights significant market pivot points, essential for identifying breakout opportunities.
Multi-Timeframe Confluence: Combines insights from various timeframes to create a balanced understanding of price behavior.
Trend Filtering: Ensures clarity by only displaying levels that align with the overall market direction.
EBL - Enigma BOS Logic is not just another breakout indicator. It is a comprehensive tool that combines multi-timeframe analysis, trend detection, and user-centric customization to empower traders with actionable insights. Whether you're analyzing macro trends or executing precision trades, EBL adapts to your strategy and provides clarity in the chaos of the market.

RSI OB/OS Strategy Analyzer█ OVERVIEW
The RSI OB/OS Strategy Analyzer is a comprehensive trading tool designed to help traders identify and evaluate overbought/oversold reversal opportunities using the Relative Strength Index (RSI). It provides visual signals, performance metrics, and a detailed table to analyze the effectiveness of RSI-based strategies over a user-defined lookback period.
█ KEY FEATURES
RSI Calculation
Calculates RSI with customizable period (default 14)
Plots dynamic overbought (70) and oversold (30) levels
Adds background coloring for OB/OS regions
Reversal Signals
Identifies signals based on RSI crossing OB/OS levels
Two entry strategies available:
Revert Cross: Triggers when RSI exits OB/OS zone
Cross Threshold: Triggers when RSI enters OB/OS zone
Trade Direction
Users can select a trade bias:
Long: Focuses on oversold reversals (bullish signals)
Short: Focuses on overbought reversals (bearish signals)
Performance Metrics
Calculates three key statistics for each lookback period:
Win Rate: Percentage of profitable trades
Mean Return: Average return across all trades
Median Return: Median return across all trades
Metrics calculated as percentage changes from entry price
Visual Signals
Dual-layer signal display:
BUY: Green triangles + text labels below price
SELL: Red triangles + text labels above price
Semi-transparent background highlighting in OB/OS zones
Performance Table
Interactive table showing metrics for each lookback period
Color-coded visualization:
Win Rate: Gradient from red (low) to green (high)
Returns: Green for positive, red for negative
Time Filtering
Users can define a specific time window for the indicator to analyze trades, ensuring that performance metrics are calculated only for the desired period.
Customizable Display
Adjustable table font sizes: Auto/Small/Normal/Large
Toggle option for table visibility
█ PURPOSE
The RSI OB/OS Strategy Analyzer helps traders:
Identify mean-reversion opportunities through RSI extremes
Backtest entry strategy effectiveness across multiple time horizons
Optimize trade timing through visual historical performance data
Quickly assess strategy robustness with color-coded metrics
█ IDEAL USERS
Counter-Trend Traders: Looking to capitalize on RSI extremes
Systematic Traders: Needing quantitative strategy validation
Educational Users: Studying RSI behavior in different market conditions
Multi-Timeframe Analysts: Interested in forward returns analysis

Bollinger Bands Reversal Strategy Analyzer█ OVERVIEW
The Bollinger Bands Reversal Overlay is a versatile trading tool designed to help traders identify potential reversal opportunities using Bollinger Bands. It provides visual signals, performance metrics, and a detailed table to analyze the effectiveness of reversal-based strategies over a user-defined lookback period.
█ KEY FEATURES
Bollinger Bands Calculation
The indicator calculates the standard Bollinger Bands, consisting of:
A middle band (basis) as the Simple Moving Average (SMA) of the closing price.
An upper band as the basis plus a multiple of the standard deviation.
A lower band as the basis minus a multiple of the standard deviation.
Users can customize the length of the Bollinger Bands and the multiplier for the standard deviation.
Reversal Signals
The indicator identifies potential reversal signals based on the interaction between the price and the Bollinger Bands.
Two entry strategies are available:
Revert Cross: Waits for the price to close back above the lower band (for longs) or below the upper band (for shorts) after crossing it.
Cross Threshold: Triggers a signal as soon as the price crosses the lower band (for longs) or the upper band (for shorts).
Trade Direction
Users can select a trade bias:
Long: Focuses on bullish reversal signals.
Short: Focuses on bearish reversal signals.
Performance Metrics
The indicator calculates and displays the performance of trades over a user-defined lookback period ( barLookback ).
Metrics include:
Win Rate: The percentage of trades that were profitable.
Mean Return: The average return across all trades.
Median Return: The median return across all trades.
These metrics are calculated for each bar in the lookback period, providing insights into the strategy's performance over time.
Visual Signals
The indicator plots buy and sell signals on the chart:
Buy Signals: Displayed as green triangles below the price bars.
Sell Signals: Displayed as red triangles above the price bars.
Performance Table
A customizable table is displayed on the chart, showing the performance metrics for each bar in the lookback period.
The table includes:
Win Rate: Highlighted with gradient colors (green for high win rates, red for low win rates).
Mean Return: Colored based on profitability (green for positive returns, red for negative returns).
Median Return: Colored similarly to the mean return.
Time Filtering
Users can define a specific time window for the indicator to analyze trades, ensuring that performance metrics are calculated only for the desired period.
Customizable Display
The table's font size can be adjusted to suit the user's preference, with options for "Auto," "Small," "Normal," and "Large."
█ PURPOSE
The Bollinger Bands Reversal Overlay is designed to:
Help traders identify high-probability reversal opportunities using Bollinger Bands.
Provide actionable insights into the performance of reversal-based strategies.
Enable users to backtest and optimize their trading strategies by analyzing historical performance metrics.
█ IDEAL USERS
Swing Traders: Looking for reversal opportunities within a trend.
Mean Reversion Traders: Interested in trading price reversals to the mean.
Strategy Developers: Seeking to backtest and refine Bollinger Bands-based strategies.
Performance Analysts: Wanting to evaluate the effectiveness of reversal signals over time.

TearRepresentative's Rule-Based Dip Buying Strategy Rule-Based Dip Buying Strategy Indicator
This TradingView indicator, inspired by TearRepresentative [ , is a refined tool designed to assist traders in implementing a rule-based dip buying strategy. The indicator automates the identification of optimal buy and sell points, helping traders stay disciplined and minimize emotional biases. It is tailored to index trading, specifically leveraged ETFs like SPXL, to capture opportunities in market pullbacks and recoveries.
Key Features
Dynamic Buy Levels:
Tracks the local high over a customizable lookback period and calculates three buy levels based on percentage drops from the high:
Buy Level 1: First entry point (e.g., 15% drop).
Buy Level 2: Second entry point (e.g., additional 10% drop).
Buy Level 3: Third entry point (e.g., additional 7% drop).
Average Price Tracking:
Dynamically calculates the average price for entered positions when multiple buy levels are triggered.
Sell Level:
Computes a take-profit level (e.g., 20% above the average price) to automate profit-taking when the market rebounds.
Signal Visualization:
Buy Signals: Displayed as green triangles at each buy level.
Sell Signals: Displayed as red triangles at the sell level.
Alerts:
Configurable alerts notify traders when buy or sell signals are triggered, ensuring no opportunity is missed.
Visual Aids:
Semi-transparent and dynamic lines represent buy and sell levels for clear visualization.
Labels provide additional clarity for active levels, helping traders quickly identify actionable signals.
How It Works
The indicator analyzes market movements to identify dips based on predefined thresholds.
Buy signals are triggered when the market price reaches specified levels below the local high.
Once a position is taken, the indicator dynamically adjusts the average entry price and calculates the corresponding sell level.
A sell signal is generated when the market price rises above the calculated take-profit level.
Why Use This Indicator?
Discipline: Automates decision-making, removing emotional factors from trading.
Clarity: Provides clear entry and exit points to simplify complex market dynamics.
Versatility: Suitable for all market conditions, especially during pullbacks and rebounds.
Customization: Allows traders to tailor parameters to their preferred trading style and risk tolerance.
Acknowledgment
This indicator is based on the strategy and insights provided by TearRepresentative, whose expertise in rule-based trading has inspired countless traders. TearRepresentative's approach emphasizes simplicity, reliability, and consistency, offering a robust framework for long-term success.

300-Candle Weighted Average Zones w/50 EMA SignalsThis indicator is designed to deliver a more nuanced view of price dynamics by combining a custom, weighted price average with a volatility-based zone and a trend filter (in this case, a 50-period exponential moving average). The core concept revolves around capturing the overall price level over a relatively large lookback window (300 candles) but with an intentional bias toward recent market activity (the most recent 20 candles), thereby offering a balance between long-term context and short-term responsiveness. By smoothing this weighted average and establishing a “zone” of standard deviation bands around it, the indicator provides a refined visualization of both average price and its recent volatility envelope. Traders can then look for confluence with a standard trend filter, such as the 50 EMA, to identify meaningful crossover signals that may represent trend shifts or opportunities for entry and exit.
What the Indicator Does:
Weighted Price Average:
Instead of using a simple or exponential moving average, this indicator calculates a custom weighted average price over the past 300 candles. Most historical candles receive a base weight of 1.0, but the most recent 20 candles are assigned a higher weight (for example, a weight of 2.0). This weighting scheme ensures that the calculation is not simply a static lookback average; it actively emphasizes current market conditions. The effect is to generate an average line that is more sensitive to the most recent price swings while still maintaining the historical context of the previous 280 candles.
Smoothing of the Weighted Average:
Once the raw weighted average is computed, an exponential smoothing function (EMA) is applied to reduce noise and produce a cleaner, more stable average line. This smoothing helps traders avoid reacting prematurely to minor price fluctuations. By stabilizing the average line, traders can more confidently identify actual shifts in market direction.
Volatility Zone via Standard Deviation Bands:
To contextualize how far price can deviate from this weighted average, the indicator uses standard deviation. Standard deviation is a statistical measure of volatility—how spread out the price values are around the mean. By adding and subtracting one standard deviation from the smoothed weighted average, the indicator plots an upper band and a lower band, creating a zone or channel. The area between these bands is filled, often with a semi-transparent color, highlighting a volatility corridor within which price and the EMA might oscillate.
This zone is invaluable in visualizing “normal” price behavior. When the 50 EMA line and the weighted average line are both within this volatility zone, it indicates that the market’s short- to mid-term trend and its average pricing are aligned well within typical volatility bounds.
Incorporation of a 50-Period EMA:
The inclusion of a commonly used trend filter, the 50 EMA, adds another layer of context to the analysis. The 50 EMA, being a widely recognized moving average length, is often considered a baseline for intermediate trend bias. It reacts faster than a long-term average (like a 200 EMA) but is still stable enough to filter out the market “chop” seen in very short-term averages.
By overlaying the 50 EMA on this custom weighted average and the surrounding volatility zone, the trader gains a dual-dimensional perspective:
Trend Direction: If the 50 EMA is generally above the weighted average, the short-term trend is gaining bullish momentum; if it’s below, the short-term trend has a bearish tilt.
Volatility Normalization: The bands, constructed from standard deviations, provide a sense of whether the price and the 50 EMA are operating within a statistically “normal” range. If the EMA crosses the weighted average within this zone, it signals a potential trend initiation or meaningful shift, as opposed to a random price spike outside normal volatility boundaries.
Why a Trader Would Want to Use This Indicator:
Contextualized Price Level:
Standard MAs may not fully incorporate the most recent price dynamics in a large lookback window. By weighting the most recent candles more heavily, this indicator ensures that the trader is always anchored to what the market is currently doing, not just what it did 100 or 200 candles ago.
Reduced Whipsaw with Smoothing:
The smoothed weighted average line reduces noise, helping traders filter out inconsequential price movements. This makes it easier to spot genuine changes in trend or sentiment.
Visual Volatility Gauge:
The standard deviation bands create a visual representation of “normal” price movement. Traders can quickly assess if a breakout or breakdown is statistically significant or just another oscillation within the expected volatility range.
Clear Trade Signals with Confirmation:
By integrating the 50 EMA and designing signals that trigger only when the 50 EMA crosses above or below the weighted average while inside the zone, the indicator provides a refined entry/exit criterion. This avoids chasing breakouts that occur in abnormal volatility conditions and focuses on those crossovers likely to have staying power.
How to Use It in an Example Strategy:
Imagine you are a swing trader looking to identify medium-term trend changes. You apply this indicator to a chart of a popular currency pair or a leading tech stock. Over the past few days, the 50 EMA has been meandering around the weighted average line, both confined within the standard deviation zone.
Bullish Example:
Suddenly, the 50 EMA crosses decisively above the weighted average line while both are still hovering within the volatility zone. This might be your cue: you interpret this crossover as the 50 EMA acknowledging the recent upward shift in price dynamics that the weighted average has highlighted. Since it occurred inside the normal volatility range, it’s less likely to be a head-fake. You place a long position, setting an initial stop just below the lower band to protect against volatility.
If the price continues to rise and the EMA stays above the average, you have confirmation to hold the trade. As the price moves higher, the weighted average may follow, reinforcing your bullish stance.
Bearish Example:
On the flip side, if the 50 EMA crosses below the weighted average line within the zone, it suggests a subtle but meaningful change in trend direction to the downside. You might short the asset, placing your protective stop just above the upper band, expecting that the statistically “normal” level of volatility will contain the price action. If the price does break above those bands later, it’s a sign your trade may not work out as planned.
Other Indicators for Confluence:
To strengthen the reliability of the signals generated by this weighted average zone approach, traders may want to combine it with other technical studies:
Volume Indicators (e.g., Volume Profile, OBV):
Confirm that the trend crossover inside the volatility zone is supported by volume. For instance, an uptrend crossover combined with increasing On-Balance Volume (OBV) or volume spikes on up candles signals stronger buying pressure behind the price action.
Momentum Oscillators (e.g., RSI, Stochastics):
Before taking a crossover signal, check if the RSI is above 50 and rising for bullish entries, or if the Stochastics have turned down from overbought levels for bearish entries. Momentum confirmation can help ensure that the trend change is not just an isolated random event.
Market Structure Tools (e.g., Pivot Points, Swing High/Low Analysis):
Identify if the crossover event coincides with a break of a previous pivot high or low. A bullish crossover inside the zone aligned with a break above a recent swing high adds further strength to your conviction. Conversely, a bearish crossover confirmed by a breakdown below a previous swing low can make a short trade setup more compelling.
Volume-Weighted Average Price (VWAP):
Comparing where the weighted average zone lies relative to VWAP can provide institutional insight. If the bullish crossover happens while the price is also holding above VWAP, it can mean that the average participant in the market is in profit and that the trend is likely supported by strong hands.
This indicator serves as a tool to balance long-term perspective, short-term adaptability, and volatility normalization. It can be a valuable addition to a trader’s toolkit, offering enhanced clarity and precision in detecting meaningful shifts in trend, especially when combined with other technical indicators and robust risk management principles.

Trend Speed Analyzer (Zeiierman)█ Overview
The Trend Speed Analyzer by Zeiierman is designed to measure the strength and speed of market trends, providing traders with actionable insights into momentum dynamics. By combining a dynamic moving average with wave and speed analysis, it visually highlights shifts in trend direction, market strength, and potential reversals. This tool is ideal for identifying breakout opportunities, gauging trend consistency, and understanding the dominance of bullish or bearish forces over various timeframes.
█ How It Works
The indicator employs a Dynamic Moving Average (DMA) enhanced with an Accelerator Factor, allowing it to adapt dynamically to market conditions. The DMA is responsive to price changes, making it suitable for both long-term trends and short-term momentum analysis.
Key components include:
Trend Speed Analysis: Measures the speed of market movements, highlighting momentum shifts with visual cues.
Wave Analysis: Tracks bullish and bearish wave sizes to determine market strength and bias.
Normalized Speed Values: Ensures consistency across different market conditions by adjusting for volatility.
⚪ Average Wave and Max Wave
These metrics analyze the size of bullish and bearish waves over a specified Lookback Period:
Average Wave: This represents the mean size of bullish and bearish movements, helping traders gauge overall market strength.
Max Wave: Highlights the largest movements within the period, identifying peak momentum during trend surges.
⚪ Current Wave Ratio
This feature compares the current wave's size against historical data:
Average Wave Ratio: Indicates if the current momentum exceeds historical averages. A value above 1 suggests the trend is gaining strength.
Max Wave Ratio: Shows whether the current wave surpasses previous peak movements, signaling potential breakouts or trend accelerations.
⚪ Dominance
Dominance metrics reveal whether bulls or bears have controlled the market during the Lookback Period:
Average Dominance: Compares the net difference between average bullish and bearish wave sizes.
Max Dominance: Highlights which side had the stronger individual waves, indicating key power shifts in market dynamics.
Positive values suggest bullish dominance, while negative values point to bearish control. This helps traders confirm trend direction or anticipate reversals.
█ How to Use
Identify Trends: Leverage the color-coded candlesticks and dynamic trend line to assess the overall market direction with clarity.
Monitor Momentum: Use the Trend Speed histogram to track changes in momentum, identifying periods of acceleration or deceleration.
Analyze Waves: Compare the sizes of bullish and bearish waves to identify the prevailing market bias and detect potential shifts in sentiment. Additionally, fluctuations in Current Wave ratio values should be monitored as early indicators of possible trend reversals.
Evaluate Dominance: Utilize dominance metrics to confirm the strength and direction of the current trend.
█ Settings
Maximum Length: Sets the smoothing of the trend line.
Accelerator Multiplier: Adjusts sensitivity to price changes.
Lookback Period: Defines the range for wave calculations.
Enable Table: Displays statistical metrics for in-depth analysis.
Enable Candles: Activates color-coded candlesticks.
Collection Period: Normalizes trend speed values for better accuracy.
Start Date: Limits calculations to a specific timeframe.
Timer Option: Choose between using all available data or starting from a custom date.
-----------------
Disclaimer
The information contained in my Scripts/Indicators/Ideas/Algos/Systems does not constitute financial advice or a solicitation to buy or sell any securities of any type. I will not accept liability for any loss or damage, including without limitation any loss of profit, which may arise directly or indirectly from the use of or reliance on such information.
All investments involve risk, and the past performance of a security, industry, sector, market, financial product, trading strategy, backtest, or individual's trading does not guarantee future results or returns. Investors are fully responsible for any investment decisions they make. Such decisions should be based solely on an evaluation of their financial circumstances, investment objectives, risk tolerance, and liquidity needs.
My Scripts/Indicators/Ideas/Algos/Systems are only for educational purposes!

LiquidFusion SignalPro [CHE] LiquidFusion SignalPro – Indicator Overview
The LiquidFusion SignalPro is a powerful and sophisticated TradingView indicator designed to identify high-quality trade entries and exits. By combining seven unique sub-indicators, it provides comprehensive market analysis, ensuring traders can make informed decisions. This tool is suitable for all market conditions and supports customization to fit individual trading strategies.
Key Components (Sub-Indicators):
1. RPM (Relative Price Momentum):
- Measures cumulative price momentum over a specified period.
- Provides insights into price strength and directional bias.
- Input Customization:
- Source: Data for momentum calculation.
- Period: Length for momentum measurement.
- Resolution: Timeframe for data fetching.
2. BBO (Bull-Bear Oscillator):
- Calculates the strength of bullish or bearish momentum based on price movement and RSI conditions.
- Uses a super-smoothing technique for reliable signals.
- Customizable parameters include the oscillator's period and repainting options.
3. MACD (Moving Average Convergence Divergence):
- A classic momentum indicator for trend direction and strength.
- Provides buy/sell signals based on the crossover of the MACD line and signal line.
- Input Customization:
- Fast/Slow EMA Periods.
- Signal Line Period.
- Resolution and Source Data.
4. RSI (Relative Strength Index):
- Tracks overbought and oversold conditions.
- A key tool to validate trend continuation or reversals.
- Customizable period, resolution, and source.
5. CCI (Commodity Channel Index):
- Measures the deviation of price from its average.
- Useful for identifying cyclical trends.
- Input Customization includes period, resolution, and source.
6. Stochastic Oscillator:
- Indicates momentum by comparing closing prices to a range of highs and lows.
- Includes smoothing factors for %K and %D lines.
- Customizable parameters:
- %K Length and Smoothing.
- Resolution and Repainting Options.
7. Supertrend:
- A trailing stop-and-reverse system for trend-following strategies.
- Excellent for identifying strong trends and potential reversals.
- Inputs include the multiplier factor and period for ATR-like calculations.
Inputs Overview:
The indicator supports extensive customization for each sub-indicator, grouped under intuitive categories:
- Color Settings: Define bullish and bearish plot colors.
- RPM, BBO, MACD, RSI, CCI, Stochastic, and Supertrend Settings: Tailor each sub-indicator's behavior with adjustable parameters.
- UI Options: Toggle features such as bar coloring, indicator names, and plotted candles.
Trade Signals:
- Long Signal:
- All indicators align in a bullish state:
- RPM > 0, MACD > 0, RSI > 50, Stochastic > 50, CCI > 0, BBO > 0, Supertrend below price.
- Plot: Green triangle below the candle.
- Alert: Notifies the trader of a potential long entry.
- Short Signal:
- All indicators align in a bearish state:
- RPM < 0, MACD < 0, RSI < 50, Stochastic < 50, CCI < 0, BBO < 0, Supertrend above price.
- Plot: Red triangle above the candle.
- Alert: Notifies the trader of a potential short entry.
Features:
- Enhanced Visuals: Plots sub-indicator statuses using labels and color-coded shapes for clarity.
- Alerts: Integrated alert conditions for both long and short trades.
- Bar Coloring: Provides overall trend bias with green (bullish), red (bearish), or gray (neutral) bars.
- Customizable Table: Displays the indicator's status in the chart’s top-right corner.
Trading Benefits:
The LiquidFusion SignalPro excels in generating high-quality entries and exits by:
- Reducing noise through multiple indicator alignment.
- Supporting multiple timeframes and resolutions for flexibility.
- Offering customizable inputs for personalized trading strategies.
Use this tool to enhance your market analysis and improve your trading performance.
Disclaimer:
The content provided, including all code and materials, is strictly for educational and informational purposes only. It is not intended as, and should not be interpreted as, financial advice, a recommendation to buy or sell any financial instrument, or an offer of any financial product or service. All strategies, tools, and examples discussed are provided for illustrative purposes to demonstrate coding techniques and the functionality of Pine Script within a trading context.
Any results from strategies or tools provided are hypothetical, and past performance is not indicative of future results. Trading and investing involve high risk, including the potential loss of principal, and may not be suitable for all individuals. Before making any trading decisions, please consult with a qualified financial professional to understand the risks involved.
By using this script, you acknowledge and agree that any trading decisions are made solely at your discretion and risk.
This indicator is inspired by the Super 6x Indicators: RSI, MACD, Stochastic, Loxxer, CCI, and Velocity . A special thanks to Loxx for their relentless effort, creativity, and contributions to the TradingView community, which served as a foundation for this work.
Happy trading and best regards
Chervolino
