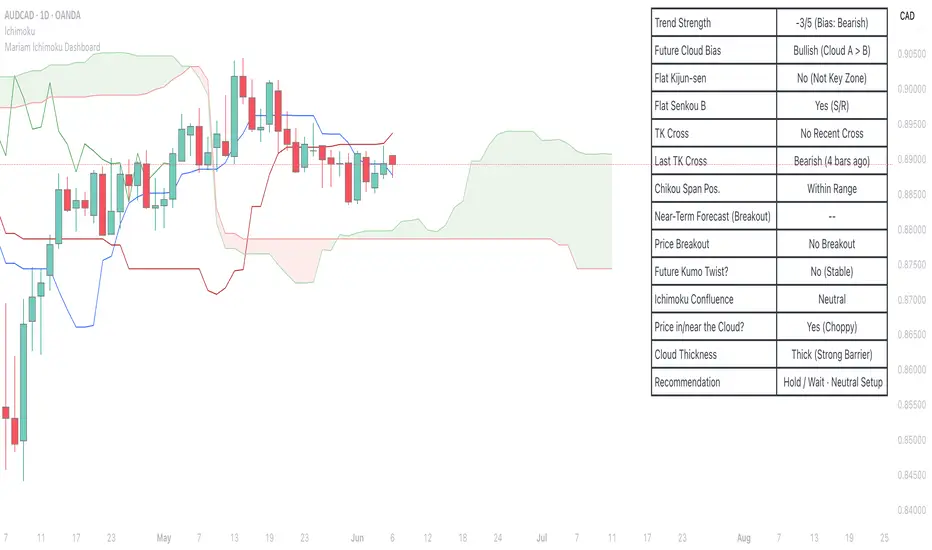
Mariam Ichimoku DashboardPurpose
The Mariam Ichimoku Dashboard is designed to simplify the Ichimoku trading system for both beginners and experienced traders. It provides a complete view of trend direction, strength, momentum, and key signals all in one compact dashboard on your chart. This tool helps traders make faster and more confident decisions without having to interpret every Ichimoku element manually.
How It Works
1. Trend Strength Score
Calculates a score from -5 to +5 based on Ichimoku components.
A high positive score means strong bullish momentum.
A low negative score shows strong bearish conditions.
A near-zero score indicates a sideways or unclear market.
2. Future Cloud Bias
Looks 26 candles ahead to determine if the future cloud is bullish or bearish.
This helps identify the longer-term directional bias of the market.
3. Flat Kijun / Flat Senkou B
Detects flat zones in the Kijun or Senkou B lines.
These flat areas act as strong support or resistance and can attract price.
4. TK Cross
Identifies Tenkan-Kijun crosses:
Bullish Cross means Tenkan crosses above Kijun
Bearish Cross means Tenkan crosses below Kijun
5. Last TK Cross Info
Shows whether the last TK cross was bullish or bearish and how many candles ago it happened.
Helps track trend development and timing.
6. Chikou Span Position
Checks if the Chikou Span is above, below, or inside past price.
Above means bullish momentum
Below means bearish momentum
Inside means mixed or indecisive
7. Near-Term Forecast (Breakout)
Warns when price is near the edge of the cloud, preparing for a potential breakout.
Useful for anticipating price moves.
8. Price Breakout
Shows if price has recently broken above or below the cloud.
This can confirm the start of a new trend.
9. Future Kumo Twist
Detects upcoming twists in the cloud, which often signal potential trend reversals.
10. Ichimoku Confluence
Measures how many key Ichimoku signals are in agreement.
The more signals align, the stronger the trend confirmation.
11. Price in or Near the Cloud
Displays if the price is inside the cloud, which often indicates low clarity or a choppy market.
12. Cloud Thickness
Shows whether the cloud is thin or thick.
Thick clouds provide stronger support or resistance.
Thin clouds may allow easier breakouts.
13. Recommendation
Gives a simple trading suggestion based on all major signals.
Strong Buy, Strong Sell, or Hold.
Helps simplify decision-making at a glance.
Features
All major Ichimoku signals summarized in one panel
Real-time trend strength scoring
Detects flat zones, crosses, cloud twists, and breakouts
Visual alerts for trend alignment and signal confluence
Compact, clean design
Built with simplicity in mind for beginner traders
Tips
Best used on 15-minute to 1-hour charts for short-term trading
Avoid entering trades when price is inside the cloud because the market is often indecisive
Wait for alignment between trend score, TK cross, cloud bias, and confluence
Use the dashboard to support your trading strategy, not replace it
Enable alerts for major confluence or upcoming Kumo twists
Search in scripts for "bias"
Commodity Trend Reactor [BigBeluga]
🔵 OVERVIEW
A dynamic trend-following oscillator built around the classic CCI, enhanced with intelligent price tracking and reversal signals.
Commodity Trend Reactor extends the traditional Commodity Channel Index (CCI) by integrating trend-trailing logic and reactive reversal markers. It visualizes trend direction using a trailing stop system and highlights potential exhaustion zones when CCI exceeds extreme thresholds. This dual-level system makes it ideal for both trend confirmation and mean-reversion alerts.
🔵 CONCEPTS
Based on the CCI (Commodity Channel Index) oscillator, which measures deviation from the average price.
Trend bias is determined by whether CCI is above or below user-defined thresholds.
Trailing price bands are used to lock in trend direction visually on the main chart.
Extreme values beyond ±200 are treated as potential reversal zones.
🔵 FEATURES\
CCI-Based Trend Shifts:
Triggers a bullish bias when CCI crosses above the upper threshold, and bearish when it crosses below the lower threshold.
Adaptive Trailing Stops:
In bullish mode, a trailing stop tracks the lowest price; in bearish mode, it tracks the highest.
Top & Bottom Markers:
When CCI surpasses +200 or drops below -200, it plots colored squares both on the oscillator and on price, marking potential reversal zones.
Background Highlights:
Each time a trend shift occurs, the background is softly colored (lime for bullish, orange for bearish) to highlight the change.
🔵 HOW TO USE
Use the oscillator to monitor when CCI crosses above or below threshold values to detect trend activation.
Enter trades in the direction of the trailing band once the trend bias is confirmed.
Watch for +200 and -200 square markers as warnings of potential mean reversals.
Use trailing stop areas as dynamic support/resistance to manage stop loss and exit strategies.
The background color changes offer clean confirmation of trend transitions on chart.
🔵 CONCLUSION
Commodity Trend Reactor transforms the simple CCI into a complete trend-reactive framework. With real-time trailing logic and clear reversal alerts, it serves both momentum traders and contrarian scalpers alike. Whether you’re trading breakouts or anticipating mean reversions, this indicator provides clarity and structure to your decision-making.

Enhanced Volume Trend Indicator with BB SqueezeEnhanced Volume Trend Indicator with BB Squeeze: Comprehensive Explanation
The visualization system allows traders to quickly scan multiple securities to identify high-probability setups without detailed analysis of each chart. The progression from squeeze to breakout, supported by volume trend confirmation, offers a systematic approach to identifying trading opportunities.
The script combines multiple technical analysis approaches into a comprehensive dashboard that helps traders make informed decisions by identifying high-probability setups while filtering out noise through its sophisticated confirmation requirements. It combines multiple technical analysis approaches into an integrated visual system that helps traders identify potential trading opportunities while filtering out false signals.
Core Features
1. Volume Analysis Dashboard
The indicator displays various volume-related metrics in customizable tables:
AVOL (After Hours + Pre-Market Volume): Shows extended hours volume as a percentage of the 21-day average volume with color coding for buying/selling pressure. Green indicates buying pressure and red indicates selling pressure.
Volume Metrics: Includes regular volume (VOL), dollar volume ($VOL), relative volume compared to 21-day average (RVOL), and relative volume compared to 90-day average (RVOL90D).
Pre-Market Data: Optional display of pre-market volume (PVOL), pre-market dollar volume (P$VOL), pre-market relative volume (PRVOL), and pre-market price change percentage (PCHG%).
2. Enhanced Volume Trend (VTR) Analysis
The Volume Trend indicator uses adaptive analysis to evaluate buying and selling pressure, combining multiple factors:
MACD (Moving Average Convergence Divergence) components
Volume-to-SMA (Simple Moving Average) ratio
Price direction and market conditions
Volume change rates and momentum
EMA (Exponential Moving Average) alignment and crossovers
Volatility filtering
VTR Visual Indicators
The VTR score ranges from 0-100, with values above 50 indicating bullish conditions and below 50 indicating bearish conditions. This is visually represented by colored circles:
"●" (Filled Circle):
Green: Strong bullish trend (VTR ≥ 80)
Red: Strong bearish trend (VTR ≤ 20)
"◯" (Hollow Circle):
Green: Moderate bullish trend (VTR 65-79)
Red: Moderate bearish trend (VTR 21-35)
"·" (Small Dot):
Green: Weak bullish trend (VTR 55-64)
Red: Weak bearish trend (VTR 36-45)
"○" (Medium Hollow Circle): Neutral conditions (VTR 46-54), shown in gray
In "Both" display mode, the VTR shows both the numerical score (0-100) alongside the appropriate circle symbol.
Enhanced VTR Settings
The Enhanced Volume Trend component offers several advanced customization options:
Adaptive Volume Analysis (volTrendAdaptive):
When enabled, dynamically adjusts volume thresholds based on recent market volatility
Higher volatility periods require proportionally higher volume to generate significant signals
Helps prevent false signals during highly volatile markets
Keep enabled for most trading conditions, especially in volatile markets
Speed of Change Weight (volTrendSpeedWeight, range 0-1):
Controls emphasis on volume acceleration/deceleration rather than absolute levels
Higher values (0.7-1.0): More responsive to new volume trends, better for momentum trading
Lower values (0.2-0.5): Less responsive, better for trend following
Helps identify early volume trends before they fully develop
Momentum Period (volTrendMomentumPeriod, range 2-10):
Defines lookback period for volume change rate calculations
Lower values (2-3): More responsive to recent changes, better for short timeframes
Higher values (7-10): Smoother, better for daily/weekly charts
Directly affects how quickly the indicator responds to new volume patterns
Volatility Filter (volTrendVolatilityFilter):
Adjusts significance of volume by factoring in current price volatility
High volume during high volatility receives less weight
High volume during low volatility receives more weight
Helps distinguish between genuine volume-driven moves and volatility-driven moves
EMA Alignment Weight (volTrendEmaWeight, range 0-1):
Controls importance of EMA alignments in final VTR calculation
Analyzes multiple EMA relationships (5, 10, 21 period)
Higher values (0.7-1.0): Greater emphasis on trend structure
Lower values (0.2-0.5): More focus on pure volume patterns
Display Mode (volTrendDisplayMode):
"Value": Shows only numerical score (0-100)
"Strength": Shows only symbolic representation
"Both": Shows numerical score and symbol together
3. Bollinger Band Squeeze Detection (SQZ)
The BB Squeeze indicator identifies periods of low volatility when Bollinger Bands contract inside Keltner Channels, often preceding significant price movements.
SQZ Visual Indicators
"●" (Filled Circle): Strong squeeze - high probability setup for an impending breakout
Green: Strong squeeze with bullish bias (likely upward breakout)
Red: Strong squeeze with bearish bias (likely downward breakout)
Orange: Strong squeeze with unclear direction
"◯" (Hollow Circle): Moderate squeeze - medium probability setup
Green: With bullish EMA alignment
Red: With bearish EMA alignment
Orange: Without clear directional bias
"-" (Dash): Gray dash indicates no squeeze condition (normal volatility)
The script identifies squeeze conditions through multiple methods:
Bollinger Bands contracting inside Keltner Channels
BB width falling to bottom 20% of recent range (BB width percentile)
Very narrow Keltner Channel (less than 5% of basis price)
Tracking squeeze duration in consecutive bars
Different squeeze strengths are detected:
Strong Squeeze: BB inside KC with tight BB width and narrow KC
Moderate Squeeze: BB inside KC with either tight BB width or narrow KC
No Squeeze: Normal market conditions
4. Breakout Detection System
The script includes two breakout indicators working in sequence:
4.1 Pre-Breakout (PBK) Indicator
Detects potential upcoming breakouts by analyzing multiple factors:
Squeeze conditions lasting 2-3 bars or more
Significant price ranges
Strong volume confirmation
EMA/MACD crossovers
Consistent price direction
PBK Visual Indicators
"●" (Filled Circle): Detected pre-breakout condition
Green: Likely upward breakout (bullish)
Red: Likely downward breakout (bearish)
Orange: Direction not yet clear, but breakout likely
"-" (Dash): Gray dash indicates no pre-breakout condition
The PBK uses sophisticated conditions to reduce false signals including minimum squeeze length, significant price movement, and technical confirmations.
4.2 Breakout (BK) Indicator
Confirms actual breakouts in progress by identifying:
End of squeeze or strong expansion of Bollinger Bands
Volume expansion
Price moving outside Bollinger Bands
EMA crossovers with volume confirmation
MACD crossovers with significant price range
BK Visual Indicators
"●" (Filled Circle): Confirmed breakout in progress
Green: Upward breakout (bullish)
Red: Downward breakout (bearish)
Orange: Unusual breakout pattern without clear direction
"◆" (Diamond): Special breakout conditions (meets some but not all criteria)
"-" (Dash): Gray dash indicates no breakout detected
The BK indicator uses advanced filters for confirmation:
Requires consecutive breakout signals to reduce false positives
Strong volume confirmation requirements (40% above average)
Significant price movement thresholds
Consistency checks between price action and indicators
5. Market Metrics and Analysis
Price Change Percentage (CHG%)
Displays the current percentage change relative to the previous day's close, color-coded green for positive changes and red for negative changes.
Average Daily Range (ADR%)
Calculates the average daily percentage range over a specified period (default 20 days), helping traders gauge volatility and set appropriate price targets.
Average True Range (ATR)
Shows the Average True Range value, a volatility indicator developed by J. Welles Wilder that measures market volatility by decomposing the entire range of an asset price for that period.
Relative Strength Index (RSI)
Displays the standard 14-period RSI, a momentum oscillator that measures the speed and change of price movements on a scale from 0 to 100.
6. External Market Indicators
QQQ Change
Shows the percentage change in the Invesco QQQ Trust (tracking the Nasdaq-100 Index), useful for understanding broader tech market trends.
UVIX Change
Displays the percentage change in UVIX, a volatility index, providing insight into market fear and potential hedging activity.
BTC-USD
Shows the current Bitcoin price from Coinbase, useful for traders monitoring crypto correlation with equities.
Market Breadth (BRD)
Calculates the percentage difference between ATHI.US and ATLO.US (high vs. low securities), indicating overall market direction and strength.
7. Session Analysis and Volume Direction
Session Detection
The script accurately identifies different market sessions:
Pre-market: 4:00 AM to 9:30 AM
Regular market: 9:30 AM to 4:00 PM
After-hours: 4:00 PM to 8:00 PM
Closed: Outside trading hours
This detection works on any timeframe through careful calculation of current time in seconds.
Buy/Sell Volume Direction
The script analyzes buying and selling pressure by:
Counting up volume when close > open
Counting down volume when close < open
Tracking accumulated volume within the day
Calculating intraday pressure (up volume minus down volume)
Enhanced AVOL Calculation
The improved AVOL calculation works in all timeframes by:
Estimating typical pre-market and after-hours volume percentages
Combining yesterday's after-hours with today's pre-market volume
Calculating this as a percentage of the 21-day average volume
Determining buying/selling pressure by analyzing after-hours and pre-market price changes
Color-coding results: green for buying pressure, red for selling pressure
This calculation is particularly valuable because it works consistently across any timeframe.
Customization Options
Display Settings
The dashboard has two customizable tables: Volume Table and Metrics Table, with positions selectable as bottom_left or bottom_right.
All metrics can be individually toggled on/off:
Pre-market data (PVOL, P$VOL, PRVOL, PCHG%)
Volume data (AVOL, RVOL Day, RVOL 90D, Volume, SEED_YASHALGO_NSE_BREADTH:VOLUME )
Price metrics (ADR%, ATR, RSI, Price Change%)
Market indicators (QQQ, UVIX, Breadth, BTC-USD)
Analysis indicators (Volume Trend, BB Squeeze, Pre-Breakout, Breakout)
These toggle options allow traders to customize the dashboard to show only the metrics they find most valuable for their trading style.
Table and Text Customization
The dashboard's appearance can be customized:
Table background color via tableBgColor
Text color (White or Black) via textColorOption
The indicator uses smart formatting for volume and price values, automatically adding appropriate suffixes (K, M, B) for readability.
MACD Configuration for VTR
The Volume Trend calculation incorporates MACD with customizable parameters:
Fast Length: Controls the period for the fast EMA (default 3)
Slow Length: Controls the period for the slow EMA (default 9)
Signal Length: Controls the period for the signal line EMA (default 5)
MACD Weight: Controls how much influence MACD has on the volume trend score (default 0.3)
These settings allow traders to fine-tune how momentum is factored into the volume trend analysis.
Bollinger Bands and Keltner Channel Settings
The Bollinger Bands and Keltner Channels used for squeeze detection have preset (hidden) parameters:
BB Length: 20 periods
BB Multiplier: 2.0 standard deviations
Keltner Length: 20 periods
Keltner Multiplier: 1.5 ATR
These settings follow standard practice for squeeze detection while maintaining simplicity in the user interface.
Practical Trading Applications
Complete Trading Strategies
1. Squeeze Breakout Strategy
This strategy combines multiple components of the indicator:
Wait for a strong squeeze (SQZ showing ●)
Look for pre-breakout confirmation (PBK showing ● in green or red)
Enter when breakout is confirmed (BK showing ● in same direction)
Use VTR to confirm volume supports the move (VTR ≥ 65 for bullish or ≤ 35 for bearish)
Set profit targets based on ADR (Average Daily Range)
Exit when VTR begins to weaken or changes direction
2. Volume Divergence Strategy
This strategy focuses on the volume trend relative to price:
Identify when price makes a new high but VTR fails to confirm (divergence)
Look for VTR to show weakening trend (● changing to ◯ or ·)
Prepare for potential reversal when SQZ begins to form
Enter counter-trend position when PBK confirms reversal direction
Use external indicators (QQQ, BTC, Breadth) to confirm broader market support
3. Pre-Market Edge Strategy
This strategy leverages pre-market data:
Monitor AVOL for unusual pre-market activity (significantly above 100%)
Check pre-market price change direction (PCHG%)
Enter position at market open if VTR confirms direction
Use SQZ to determine if volatility is likely to expand
Exit based on RVOL declining or price reaching +/- ADR for the day
Market Context Integration
The indicator provides valuable context for trading decisions:
QQQ change shows tech market direction
BTC price shows crypto market correlation
UVIX change indicates volatility expectations
Breadth measurement shows market internals
This context helps traders avoid fighting the broader market and align trades with overall market direction.
Timeframe Optimization
The indicator is designed to work across different timeframes:
For day trading: Focus on AVOL, VTR, PBK/BK, and use shorter momentum periods
For swing trading: Focus on SQZ duration, VTR strength, and broader market indicators
For position trading: Focus on larger VTR trends and use EMA alignment weight
Advanced Analytical Components
Enhanced Volume Trend Score Calculation
The VTR score calculation is sophisticated, with the base score starting at 50 and adjusting for:
Price direction (up/down)
Volume relative to average (high/normal/low)
Volume acceleration/deceleration
Market conditions (bull/bear)
Additional factors are then applied, including:
MACD influence weighted by strength and direction
Volume change rate influence (speed)
Price/volume divergence effects
EMA alignment scores
Volatility adjustments
Breakout strength factors
Price action confirmations
The final score is clamped between 0-100, with values above 50 indicating bullish conditions and below 50 indicating bearish conditions.
Anti-False Signal Filters
The indicator employs multiple techniques to reduce false signals:
Requiring significant price range (minimum percentage movement)
Demanding strong volume confirmation (significantly above average)
Checking for consistent direction across multiple indicators
Requiring prior bar consistency (consecutive bars moving in same direction)
Counting consecutive signals to filter out noise
These filters help eliminate noise and focus on high-probability setups.
MACD Enhancement and Integration
The indicator enhances standard MACD analysis:
Calculating MACD relative strength compared to recent history
Normalizing MACD slope relative to volatility
Detecting MACD acceleration for stronger signals
Integrating MACD crossovers with other confirmation factors
EMA Analysis System
The indicator uses a comprehensive EMA analysis system:
Calculating multiple EMAs (5, 10, 21 periods)
Detecting golden cross (10 EMA crosses above 21 EMA)
Detecting death cross (10 EMA crosses below 21 EMA)
Assessing price position relative to EMAs
Measuring EMA separation percentage
Recent Enhancements and Evolution
Version 5.2 includes several improvements:
Enhanced AVOL to show buying/selling direction through color coding
Improved VTR with adaptive analysis based on market conditions
AVOL display now works in all timeframes through sophisticated estimation
Removed animal symbols and streamlined code with bright colors for better visibility
Improved anti-false signal filters throughout the system
Optimizing Indicator Settings
For Different Market Types
Range-Bound Markets:
Lower EMA Alignment Weight (0.2-0.4)
Higher Speed of Change Weight (0.8-1.0)
Focus on SQZ and PBK signals for breakout potential
Trending Markets:
Higher EMA Alignment Weight (0.7-1.0)
Moderate Speed of Change Weight (0.4-0.6)
Focus on VTR strength and BK confirmations
Volatile Markets:
Enable Volatility Filter
Enable Adaptive Volume Analysis
Lower Momentum Period (2-3)
Focus on strong volume confirmation (VTR ≥ 80 or ≤ 20)
For Different Asset Classes
Equities:
Standard settings work well
Pay attention to AVOL for gap potential
Monitor QQQ correlation
Futures:
Consider higher Volume/RVOL weight
Reduce MACD weight slightly
Pay close attention to SQZ duration
Crypto:
Higher volatility thresholds may be needed
Monitor BTC price for correlation
Focus on stronger confirmation signals
Integrated Visual System for Trading Decisions
The colored circle indicators create an intuitive visual system for quick market assessment:
Progression Sequence: SQZ (Squeeze) → PBK (Pre-Breakout) → BK (Breakout)
This sequence often occurs in order, with the squeeze leading to pre-breakout conditions, followed by an actual breakout.
VTR (Volume Trend): Provides context about the volume supporting these movements.
Color Coding: Green for bullish conditions, red for bearish conditions, and orange/gray for neutral or undefined conditions.

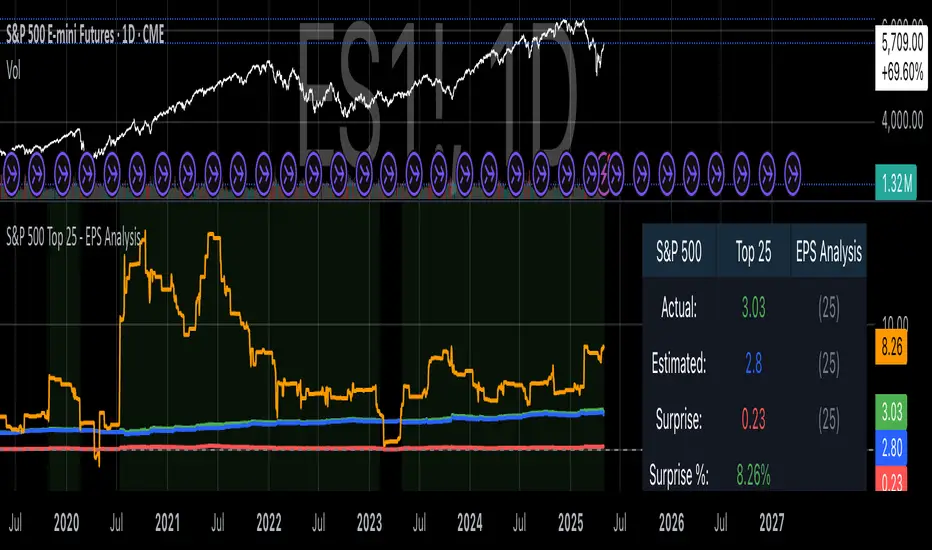
S&P 500 Top 25 - EPS AnalysisEarnings Surprise Analysis Framework for S&P 500 Components: A Technical Implementation
The "S&P 500 Top 25 - EPS Analysis" indicator represents a sophisticated technical implementation designed to analyze earnings surprises among major market constituents. Earnings surprises, defined as the deviation between actual reported earnings per share (EPS) and analyst estimates, have been consistently documented as significant market-moving events with substantial implications for price discovery and asset valuation (Ball and Brown, 1968; Livnat and Mendenhall, 2006). This implementation provides a comprehensive framework for quantifying and visualizing these deviations across multiple timeframes.
The methodology employs a parameterized approach that allows for dynamic analysis of up to 25 top market capitalization components of the S&P 500 index. As noted by Bartov et al. (2002), large-cap stocks typically demonstrate different earnings response coefficients compared to their smaller counterparts, justifying the focus on market leaders.
The technical infrastructure leverages the TradingView Pine Script language (version 6) to construct a real-time analytical framework that processes both actual and estimated EPS data through the platform's request.earnings() function, consistent with approaches described by Pine (2022) in financial indicator development documentation.
At its core, the indicator calculates three primary metrics: actual EPS, estimated EPS, and earnings surprise (both absolute and percentage values). This calculation methodology aligns with standardized approaches in financial literature (Skinner and Sloan, 2002; Ke and Yu, 2006), where percentage surprise is computed as: (Actual EPS - Estimated EPS) / |Estimated EPS| × 100. The implementation rigorously handles potential division-by-zero scenarios and missing data points through conditional logic gates, ensuring robust performance across varying market conditions.
The visual representation system employs a multi-layered approach consistent with best practices in financial data visualization (Few, 2009; Tufte, 2001).
The indicator presents time-series plots of the four key metrics (actual EPS, estimated EPS, absolute surprise, and percentage surprise) with customizable color-coding that defaults to industry-standard conventions: green for actual figures, blue for estimates, red for absolute surprises, and orange for percentage deviations. As demonstrated by Padilla et al. (2018), appropriate color mapping significantly enhances the interpretability of financial data visualizations, particularly for identifying anomalies and trends.
The implementation includes an advanced background coloring system that highlights periods of significant earnings surprises (exceeding ±3%), a threshold identified by Kinney et al. (2002) as statistically significant for market reactions.
Additionally, the indicator features a dynamic information panel displaying current values, historical maximums and minimums, and sample counts, providing important context for statistical validity assessment.
From an architectural perspective, the implementation employs a modular design that separates data acquisition, processing, and visualization components. This separation of concerns facilitates maintenance and extensibility, aligning with software engineering best practices for financial applications (Johnson et al., 2020).
The indicator processes individual ticker data independently before aggregating results, mitigating potential issues with missing or irregular data reports.
Applications of this indicator extend beyond merely observational analysis. As demonstrated by Chan et al. (1996) and more recently by Chordia and Shivakumar (2006), earnings surprises can be successfully incorporated into systematic trading strategies. The indicator's ability to track surprise percentages across multiple companies simultaneously provides a foundation for sector-wide analysis and potentially improves portfolio management during earnings seasons, when market volatility typically increases (Patell and Wolfson, 1984).
References:
Ball, R., & Brown, P. (1968). An empirical evaluation of accounting income numbers. Journal of Accounting Research, 6(2), 159-178.
Bartov, E., Givoly, D., & Hayn, C. (2002). The rewards to meeting or beating earnings expectations. Journal of Accounting and Economics, 33(2), 173-204.
Bernard, V. L., & Thomas, J. K. (1989). Post-earnings-announcement drift: Delayed price response or risk premium? Journal of Accounting Research, 27, 1-36.
Chan, L. K., Jegadeesh, N., & Lakonishok, J. (1996). Momentum strategies. The Journal of Finance, 51(5), 1681-1713.
Chordia, T., & Shivakumar, L. (2006). Earnings and price momentum. Journal of Financial Economics, 80(3), 627-656.
Few, S. (2009). Now you see it: Simple visualization techniques for quantitative analysis. Analytics Press.
Gu, S., Kelly, B., & Xiu, D. (2020). Empirical asset pricing via machine learning. The Review of Financial Studies, 33(5), 2223-2273.
Johnson, J. A., Scharfstein, B. S., & Cook, R. G. (2020). Financial software development: Best practices and architectures. Wiley Finance.
Ke, B., & Yu, Y. (2006). The effect of issuing biased earnings forecasts on analysts' access to management and survival. Journal of Accounting Research, 44(5), 965-999.
Kinney, W., Burgstahler, D., & Martin, R. (2002). Earnings surprise "materiality" as measured by stock returns. Journal of Accounting Research, 40(5), 1297-1329.
Livnat, J., & Mendenhall, R. R. (2006). Comparing the post-earnings announcement drift for surprises calculated from analyst and time series forecasts. Journal of Accounting Research, 44(1), 177-205.
Padilla, L., Kay, M., & Hullman, J. (2018). Uncertainty visualization. Handbook of Human-Computer Interaction.
Patell, J. M., & Wolfson, M. A. (1984). The intraday speed of adjustment of stock prices to earnings and dividend announcements. Journal of Financial Economics, 13(2), 223-252.
Skinner, D. J., & Sloan, R. G. (2002). Earnings surprises, growth expectations, and stock returns or don't let an earnings torpedo sink your portfolio. Review of Accounting Studies, 7(2-3), 289-312.
Tufte, E. R. (2001). The visual display of quantitative information (Vol. 2). Graphics Press.
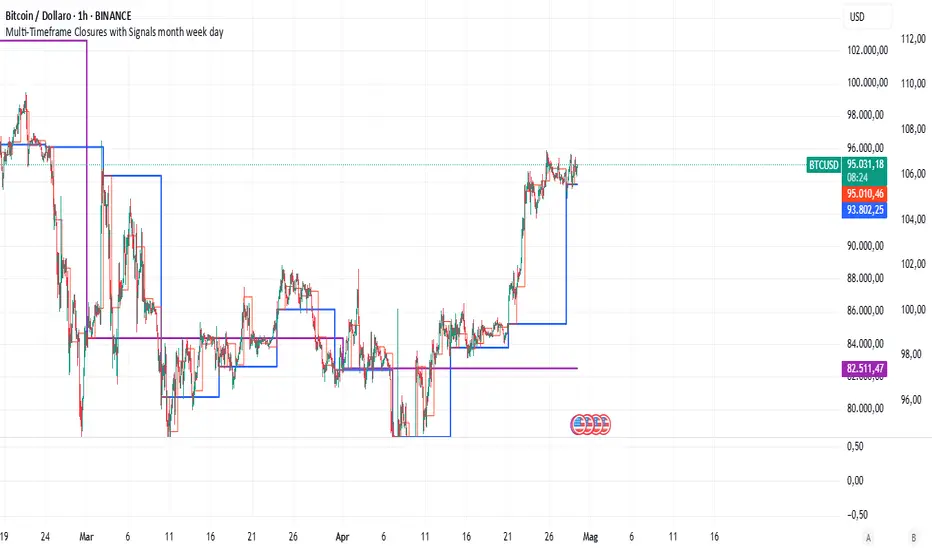
Multi-Timeframe Closures with Signals month week dayMulti-Timeframe Price Anchoring Indicator (Monthly, Weekly, Daily)
This indicator provides a powerful visual framework for analyzing price action across three major timeframes: monthly, weekly, and daily. It plots the closing prices of each timeframe directly on the chart to help traders assess where current price stands in relation to significant historical levels.
🔍 Core Features:
Monthly, Weekly, and Daily Close Lines: Automatically updated at the start of each new period.
Color-coded Price Anchors: Each timeframe is visually distinct for fast interpretation.
Multi-timeframe Awareness: Helps you identify trend alignment or divergence across different time horizons.
Long & Short Bias Signals: The script can optionally display long or short suggestions based on where the current price stands relative to the anchored closing prices.
📈 How to Use:
Trend Confirmation: If price is consistently above all three levels, it signals a strong bullish trend (potential long bias). If it’s below, the opposite applies (short bias).
Reversal or Pullback Zones: When price becomes extended far above/below the monthly and weekly closes, it may suggest overbought/oversold conditions and the possibility of a reversal or retracement.
Intraday Alignment: Useful for traders who want to enter positions on lower timeframes while being aware of higher timeframe trends.
This indicator is ideal for swing traders, day traders, and position traders who want to anchor their decisions to meaningful multi-timeframe reference points.
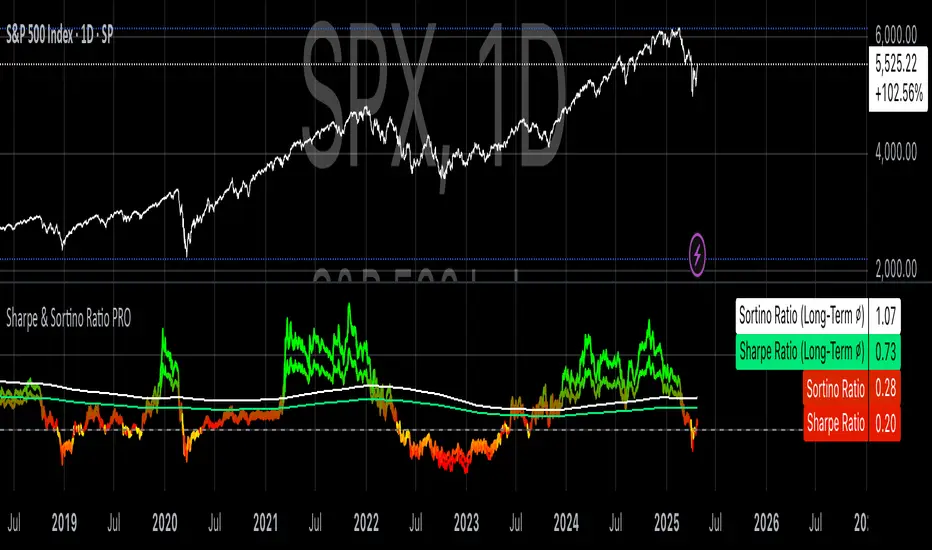
Sharpe & Sortino Ratio PROSharpe & Sortino Ratio PRO offers an advanced and more precise way to calculate and visualize the Sharpe and Sortino Ratios for financial assets on TradingView. Its main goal is to provide a scientifically accurate method for assessing the risk-adjusted performance of assets, both in the short and long term. Unlike TradingView’s built-in metrics, this script correctly handles periodic returns, uses optional logarithmic returns, properly annualizes both returns and volatility, and adjusts for the risk-free rate — all critical factors for truly meaningful Sharpe and Sortino calculations.
Users can customize the rolling analysis window (e.g., 252 periods for one year on daily data) and the long-term smoothing period (e.g., 1260 periods for five years). There’s also an option to select between linear and logarithmic returns and to manually input a risk-free rate if real-time data from FRED (the 3-Month T-Bill Rate via FRED:DGS3MO) is unavailable. Based on the chart’s timeframe (daily, weekly, or monthly), the script automatically adjusts the risk-free rate to a per-period basis.
The Sharpe Ratio is calculated by first determining the asset’s excess returns (returns after subtracting the risk-free return per period), then computing the average and standard deviation of those excess returns over the specified window, and finally annualizing these figures separately — in line with best scientific practices (Sharpe, 1994). The Sortino Ratio follows a similar approach but only considers negative returns, focusing specifically on downside risk (Sortino & Van der Meer, 1991).
To enhance readability, the script visualizes the ratios using a color gradient: strong negative values are shown in red, neutral values in yellow, and strong positive values in green. Additionally, the long-term averages for both Sharpe and Sortino are plotted with steady colors (teal and orange, respectively), making it easier to spot enduring performance trends.
Why calculating Sharpe and Sortino Ratios manually on TradingView is necessary?
While TradingView provides basic Sharpe and Sortino Ratios, they come with significant methodological flaws that can lead to misleading conclusions about an asset’s true risk-adjusted performance.
First, TradingView often computes volatility based on the standard deviation of price levels rather than returns (TradingView, 2023). This method is problematic because it causes the volatility measure to be directly dependent on the asset’s absolute price. For instance, a stock priced at $1,000 will naturally show larger absolute daily price moves than a $10 stock, even if their percentage changes are similar. This artificially inflates the measured standard deviation and, as a result, depresses the calculated Sharpe Ratio.
Second, TradingView frequently neglects to adjust for the risk-free rate. By treating all returns as risky returns, the computed Sharpe Ratio may significantly underestimate risk-adjusted performance, especially when interest rates are high (Sharpe, 1994).
Third, and perhaps most critically, TradingView doesn’t properly annualize the mean excess return and the standard deviation separately. In correct financial math, the mean excess return should be multiplied by the number of periods per year, while the standard deviation should be multiplied by the square root of the number of periods per year (Cont, 2001; Fabozzi et al., 2007). Incorrect annualization skews the Sharpe and Sortino Ratios and can lead to under- or overestimating investment risk.
These flaws lead to three major issues:
• Overstated volatility for high-priced assets.
• Incorrect scaling between returns and risk.
• Sharpe Ratios that are systematically biased downward, especially in high-price or high-interest environments.
How to properly calculate Sharpe and Sortino Ratios in Pine Script?
To get accurate results, the Sharpe and Sortino Ratios must be calculated using the correct methodology:
1. Use returns, not price levels, to calculate volatility. Ideally, use logarithmic returns for better mathematical properties like time additivity (Cont, 2001).
2. Adjust returns by subtracting the risk-free rate on a per-period basis to obtain true excess returns.
3. Annualize separately:
• Multiply the mean excess return by the number of periods per year (e.g., 252 for daily data).
• Multiply the standard deviation by the square root of the number of periods per year.
4. Finally, divide the annualized mean excess return by the annualized standard deviation to calculate the Sharpe Ratio.
The Sortino Ratio follows the same structure but uses downside deviations instead of standard deviations.
By following this scientifically sound method, you ensure that your Sharpe and Sortino Ratios truly reflect the asset’s real-world risk and return characteristics.
References
• Cont, R. (2001). Empirical properties of asset returns: stylized facts and statistical issues. Quantitative Finance, 1(2), pp. 223–236.
• Fabozzi, F.J., Gupta, F. and Markowitz, H.M. (2007). The Legacy of Modern Portfolio Theory. Journal of Investing, 16(3), pp. 7–22.
• Sharpe, W.F. (1994). The Sharpe Ratio. Journal of Portfolio Management, 21(1), pp. 49–58.
• Sortino, F.A. and Van der Meer, R. (1991). Downside Risk: Capturing What’s at Stake in Investment Situations. Journal of Portfolio Management, 17(4), pp. 27–31.
• TradingView (2023). Help Center - Understanding Sharpe and Sortino Ratios. Available at: www.tradingview.com (Accessed: 25 April 2025).
Fibonacci Levels with MACD ConfirmationHow to Understand and Use the Fibonacci Levels with MACD Confirmation Script
This custom Pine Script is designed to give traders a clear visual framework by combining dynamic Fibonacci retracement levels, MACD histogram confirmation, and volatility-based swing zones. It aims to simplify trend analysis, improve entry timing, and adapt to various market conditions.
How to Interpret the 23.6% & 61.8% Labels
These Fibonacci levels represent key retracement zones where price often reacts during trend pullbacks or reversals.
The 23.6% level indicates a shallow retracement, useful in strong trends where price resumes early.
The 61.8% level is a deeper retracement, often a "last line of defense" before trend invalidation.
The script labels these zones with "CC 23.6" and "CC 61.8" when the price crosses them with MACD histogram confirmation:
Green label (CC) = bullish confirmation
Red label (CC) = bearish confirmation
How to Modify Inputs (Manual Adjustments)
Input Purpose Default How to Use
ATR Period Measures volatility 14 Increase for smoother, slower reactions; reduce for faster swings
Min Lookback Minimum bars for swing zone 20 Avoids short-term noise
Max Lookback Cap for swing zone scan 100 Avoids excessively wide retracement levels
Inverse Candle Chart Flips high/low logic false Enable for inverted analysis or backtesting "opposite logic"
How to Use the Inverse Candle Chart Option
Activating inverse mode flips candle logic:
Highs become negative lows, and vice versa.
Useful for:
Contrarian analysis
Inverse ETFs or short-biased views
Backtesting reverse-pattern behavior
How to Adjust the Style
You can manually personalize the script’s visual appearance:
Change line width in plot(..., linewidth=2) for bolder or thinner Fib levels.
Change colors from color.green, color.red, etc., to suit your theme.
Modify label.size, label.style, and label.color for different labeling visuals.
Customize MACD histogram style from plot.style_columns to other styles like style_histogram.
How the MACD is Set and Displayed
The MACD uses non-standard values:
Fast Length = 24
Slow Length = 52
Signal Smoothing = 18
These values slow down the indicator, reducing noise and aligning better with medium- to long-term trends.
MACD histogram is plotted directly on the main chart for faster, on-screen decision making.
Color-coded histogram:
Green/Lime = Bullish momentum increasing or steady
Red/Maroon = Bearish momentum increasing or steady
How to Use the Indicator in Real-World Trading
This indicator is most effective when used to:
✅ 1. Spot High-Probability Trend Continuation Zones
In a strong trend, price will often retrace to 23.6% or 61.8%, then resume.
Wait for:
Price to cross 23.6 or 61.8
MACD histogram rising (bullish) or falling (bearish)
"CC 23.6" or "CC 61.8" label to appear
🟢 Entry Example: Price retraces to Fib 61.8%, crosses up with green MACD histogram → take long position
✅ 2. Validate Reversal or Breakout Zones
These Fib levels also act as support/resistance.
If price crosses a Fib level but MACD fails to confirm, it may be a fake breakout.
Use confirmation labels only when MACD aligns.
✅ 3. Add Volatility Context (ATR) for Risk Management
The ATR label shows both value and %.
Use ATR to:
Set dynamic stop-losses (e.g., 1.5x ATR below entry)
Decide trade size based on volatility
How to Combine the Indicator With Other Tools
You can combine this script with other technical tools for a powerful trading framework:
🔁 With Moving Averages
Use 50/200 MA for overall trend direction
Take signals only in the direction of MA slope
🔄 With Price Action Patterns
Use the Fib/MACD signals at confluence points:
Support/resistance zones
Breakout retests
Candlestick patterns (pin bars, engulfing)
🔺 With Volume or Order Flow
Combine with volume spikes or order book signals
Confirm that Fib/MACD signals align with strong volume for conviction
✅ Trade Setup Summary
Criteria Long Setup Short Setup
Price at Fib Level At or crossing Fib 23.6 / 61.8 Same
MACD Histogram Rising and above previous bar Falling and below previous bar
Label Appears Green "CC 23.6" or "CC 61.8" Red "CC 23.6" or "CC 61.8"
Optional Filters Trend direction, ATR range, volume, price pattern Same

Accumulation-Distribution CandlesThis structural visualization tool maps each candle through the lens of Effort vs. Result, blending Volume, Range, and closing bias into a normalized pressure score. Candle bodies are dynamically color-coded using a five-tier system—from heavy accumulation to heavy distribution—revealing where energy is building, dispersing, or neutral. This helps to visually isolate Markup, Markdown, Re-accumulation, and Distribution at a glance.
The indicator calculates a strength score by multiplying price result (close minus open) by effort (volume or price range), smoothing this raw value using a Fibonacci-based EMA. (34 for standard, 55 for crypto; the higher crypto value acknowledges that 24/7 trading offers more hours per week or month than trad markets.) The result is standardized against its rolling deviation and clamped to a range. This score determines the visual tier:
• 💙 Dark Blue = heavy Accumulation (strong upward result on strong effort)
• 🩵 Pale Blue = mild Accumulation
• 🌚 Gray = neutral (low conviction or balance)
• 💛 Pale Yellow = mild Distribution
• 🧡 Deep Yellow = heavy Distribution (strong downward result on strong effort)
The tool is optimized for the 1D chart, where Wyckoff phases are most clearly expressed. However, it adapts well to lower timeframes when used selectively. Traders may hide the body coloring and enable only zone highlighting to preserve other candle overlays such as SUPeR TReND 2.718, which offers directional clarity and trend duration. This combination is especially useful on intraday charts (15m–1H) where microstructure matters but visual clutter must be avoided.
When used alongside other Volume overlays (such as the OBVX Conviction Bias) or Volatility indicators (such as the Asymmetric Turbulence Ribbon (ATR)), this indicator adds confluence to directional setups by contextualizing pressure with Volatility. For example: compression zones marked by ATR may align with persistent pale blue candles—indicating quiet Accumulation before expansion.
Optional Overlays:
Normally ON -
• 📌 Pin Bars , filtered by volume, to isolate wick-dominant reversals from key zones
• 💪🏻 Strong-Body Candles — fuchsia candles w/ high body-to-range ratio reflect conviction
• 🧯 Wick Absorption Candles — red candles w/ long wicks and low closing strength indicate failed pushes or absorbed breakouts
• 🟦/🟧 Zone Highlighting for candles above a defined Accumulation/Distribution threshold
Normally OFF -
• 🔺 Fractals (5-bar) to map swing pivots by underlying pressure tier (normally OFF)
• 🟥/🟩 Engulfing patterns, filtered by directional conviction (normally OFF)
The Pin Bar strategy benefits most from the zone logic—when a bullish pin bar appears in an Accumulation zone (esp. pale or dark blue), and Volume exceeds its rolling average, it may mark a spring or failed breakdown. Conversely, bearish pins in Distribution zones can mark rejection or resistance.
This is not a signal engine—it’s a narrative filter designed to slot cleanly into a multi-layered workflow of visual structure and informed execution. Use it to identify bias and phase. Then deploy trade triggers from tools like SUPeR TReND 2.718, or the liquidity flows shown the The Silver Lining or the AltSeasonality - MTF indicators, for example. The candle colors tell you who’s in control—the other tools tell you when to act.
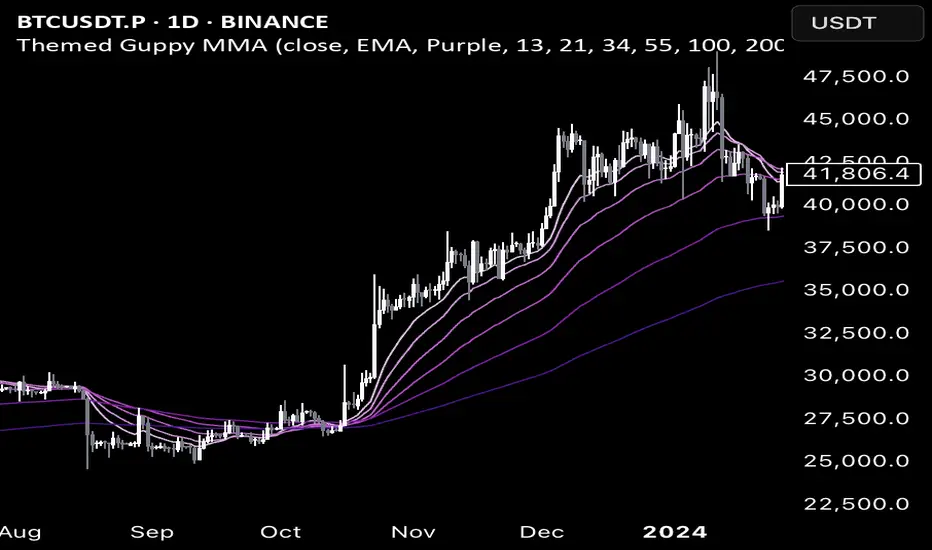
Color Themed Guppy Multiple Moving Average
========== TLDR ==========
The "Color Themed Guppy Multiple Moving Average" plots a group of 6 Moving Averages on your chart with a selection of color themes to automatically style the different length Moving Average lines. As someone who struggles with screens and colors on a busy chart, this indicator has helped me a lot in quickly identifying which Moving Average price is respecting the most - giving me better signals for trade entries and trend loss.
========== Key Features and Advantages ==========
- Show different length Moving Averages with a single indicator
- quickly make your chart more readable with 12 different color themes
- The themes will color the Moving Averages with a gradient (light - dark), with a lighter color indicating a shorter length or 'faster' Moving Average
- Select the type of Moving Average you would like to use
========== Use Cases ==========
Identify Specific Length Moving Averages That are Acting as Support or Resistance:
Having each Moving Average coloured by a theme makes it easier to track each individual line with your eyes, making it easier to quickly find the Moving Averages that price is respecting the most for a given asset and/or trend.
Get Bias Quickly:
When all 6 of the Moving Averages are 'stacked' on top of each other in order, and all are angled either up or down, it can provide a useful bias for the market on your timeframe.
For example, If the fastest (smallest length) Moving Averages are angled up and sitting above the slower (largest length) Moving Averages, it may indicate that a 'long' bias would be preferable for any trades.
Having a color gradient from the themes makes it much easier to see when the Moving Average lines are "stacked" in order.
Identify Turning Points:
When the faster (smallest length) Moving Averages start to cross over the slower (largest length) Moving Averages, it may indicate a potential price/trend reversal.
Again, having a color gradient from the themes makes it much easier to spot this
========== Theme Options ==========
- Red
- Orange
- Yellow
- Green
- Teal
- Light Blue
- Blue
- Violet
- Purple
- Pink
- Rainbow - Solid
- Rainbow - Light
If you'd like other themes added feel free to request them in the comments and I can try to add more.
TCTDailyBiasLibraryLibrary "TCTDailyBiasLibrary"
Provides a simple function to return a daily bias based on the break of the morning range
getDailyBias()
Returns the daily bias based on the break of the morning range
Returns: bias

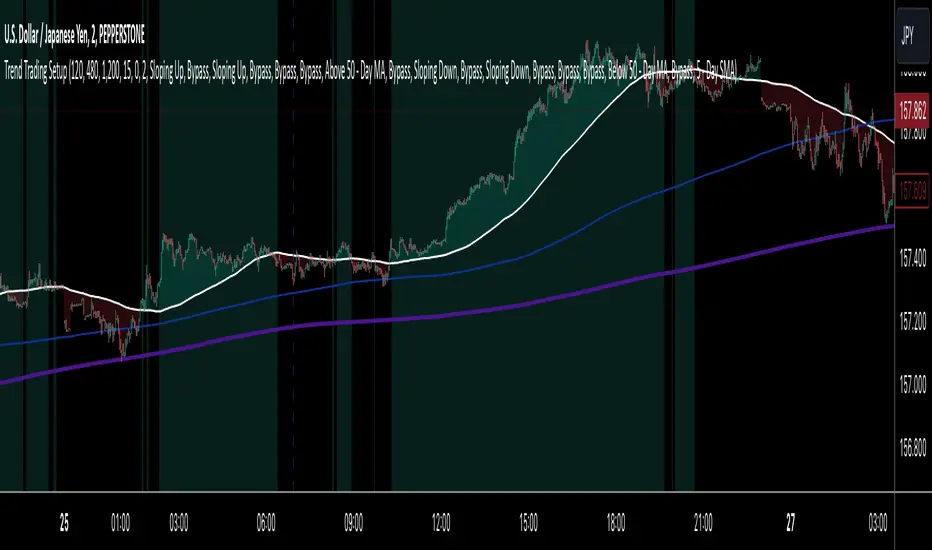
Trend Trading SetupTrend Trading Setup is an indicator that is designed to assist with trend trading by indicating when the basic conditions for a trade in either direction are met.
Note: Default values assume the 1-hour chart
The idea is that this will allow a trader to know for the first glance if a market is worthy of closer inspection or not.
Indicator Features:
1. Simple Moving Averages - defining the basic trade conditions
5 - Day Moving Average
20 - Day Moving Average
50 - Day Moving Average
2. Visualisation of The Price Location In Relation To The 5 - Day Moving Average
If price is above the 5-day Moving Average, the space between them is green. If price is below the 5-day Moving Average, the space between them is red.
3. Risk Management Section - calculates an ATR-based stop loss.
4. Indication When The Conditions Are Met
If the conditions for a bullish bias are met, the chart background is green. If the conditions for a bearish bias are met, the chart background is red. If none of the conditions are met, the chart background is left as is.
A user can adjust the length of any of the Moving Averages as well as the length of the ATR and the ATR Multiplier for the stop loss size. Default values assume the 1-hour chart, but surprisingly the settings seem to show logical results also on other time frames.
The Setup:
Bullish - 5-day Moving Average is above the 50-day Moving Average. The slope of both of the Moving Averages is positive and the price has to be above the 5-day Moving Average.
Bearish - Exactly the same as for the bullish bias, but opposite.
I do not recommend to take this Trend Trading Setup indicator as the only reason for a position. However, I believe it can be very useful to show when the overall conditions are in favour of a long position or in favour of a short position.
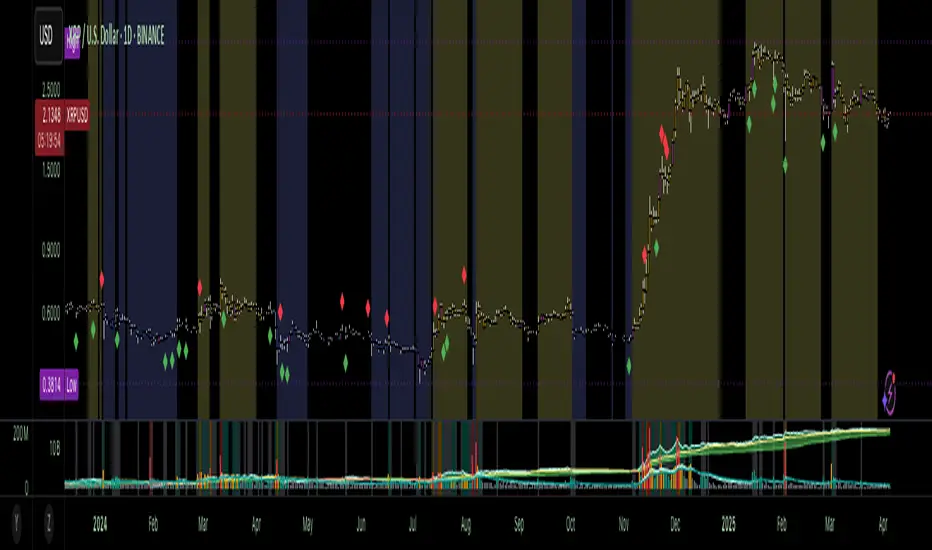
VWAP Direction HistogramThe ** VWAP Direction Histogram ** indicator is a powerful tool for traders looking to gauge the directional bias of the Volume Weighted Average Price (VWAP). VWAP is a critical metric that combines price and volume to provide a weighted average price, often used to identify institutional trading activity and support/resistance levels. This indicator builds upon the traditional VWAP by calculating its directional changes over a customizable lookback period, providing clear visual cues to traders through a color-coded histogram.
By identifying whether VWAP is rising or falling over the specified lookback period, this indicator helps traders determine the prevailing trend bias in the market. A positive VWAP direction suggests upward momentum and a bullish trend bias, while a negative direction indicates downward momentum and bearish sentiment. This information is further reinforced by coloring the chart candles based on the VWAP trend, enabling quick visual analysis and enhancing decision-making for trend-following strategies. Whether you're trading intraday or longer-term, the ** VWAP Direction Histogram ** offers an intuitive and effective way to align your trades with market trends.

Salman Indicator: Multi-Purpose Price ActionSalman Indicator: Multi-Purpose Price Action Tool for Pin Bars, Breakouts, and VWAP Anchoring
This indicator provides a comprehensive suite of price action insights, designed for active traders looking to identify key market structures and potential reversals. The script incorporates a Quarterly VWAP for trend bias, marks pin bars for possible reversal points, highlights outside bars for volatility signals, and indicates simple breakouts and pivot-level breaks. Customizable settings allow for flexibility in various trading styles, with default settings optimized for daily charts.
Outside Bars : Represented by an ⤬ symbol on the chart, these indicate bars where the current high is greater than the previous bar’s high, and the low is lower than the previous bar’s low, signaling high volatility and potential market reversals.
Pin Bars : Denoted by a small dot at the top or bottom of a candle’s wick, these are crucial signals of potential reversal areas. Pin bars are identified based on the percentage length of their shadows, with adjustable strictness in settings.
Quarterly VWAP : The light blue line on the chart represents the VWAP (Volume-Weighted Average Price), which is anchored to the Quarterly period by default. The VWAP acts as a directional bias filter, helping you to determine underlying market trends. This period, source, and offset are fully adjustable in the script’s settings.
Simple Breaks : Hollow candles on the chart indicate "simple breaks," defined when the current bar closes above the previous high or below the previous low. This is an effective way to highlight directional momentum in the market.
Bonus Pivot Breaks : The tilde symbol ~ appears when the price closes above or below prior pivot high/low levels, helping traders spot significant breakout or breakdown points relative to recent pivots.
Alerts
Simple Breaks : Alerts you when a breakout occurs beyond the previous bar’s high or low. Pin Bars : Notifies you of potential reversal points as indicated by bullish or bearish pin bars. Outside Bars : Triggers an alert whenever an outside bar is detected, indicating possible volatility changes.
How to Use
VWAP for Trend Bias : Use the Quarterly VWAP line to gauge overall market trend, with settings that allow adjustment to daily, weekly, monthly, or even larger time frames.
Pin Bars for Reversal Potential : Look for the dot markers on candle wicks, where the strictness of the pin bar detection can be adjusted via settings to match your trading preference.
Simple and Pivot Breaks for Momentum : Watch for hollow candles and the tilde symbol ~ as indicators of potential breakout momentum and pivot break levels, respectively.
This script can serve traders on multiple timeframes, from daily to weekly and beyond. The flexible configuration allows for adjustments in VWAP anchoring and pin bar criteria, providing a tailored fit for individual trading strategies.

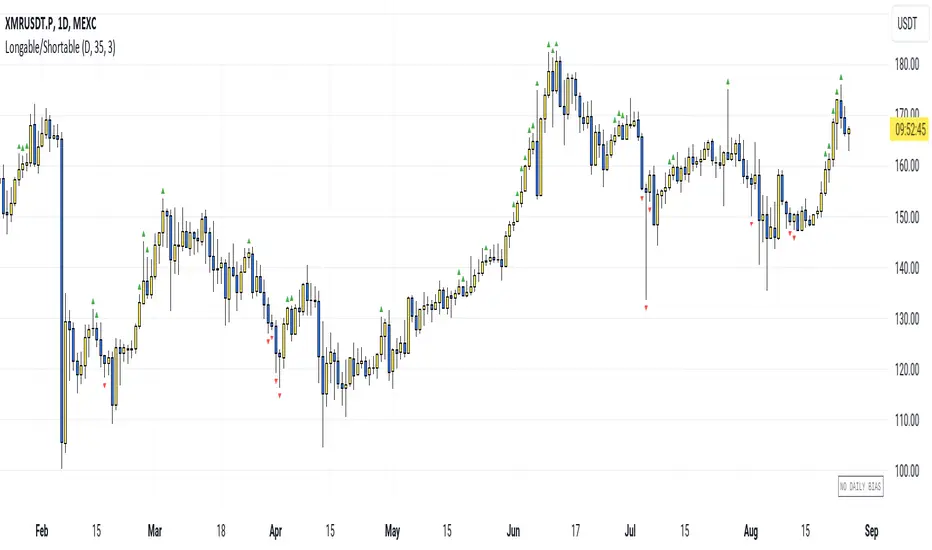
Longable/ShortableThis indicator advises intraday traders which direction NOT to take trades in, based on recent action in the daily chart. Works on any timeframe.
This is not a buy/sell indicator - it is a FILTER that is meant to SUPPRESS trades you may have wanted to take. Like a Daily Bias, but with a neutral position (no bias).
The indicator shows when NOT to take longs and when NOT to take shorts.
So you need an existing strategy to combine this with.
By default, the last 3 days are taken into account (smoothing=3). Change the threshold to get fewer or more warning signals.
The symbols are very simple:
Green triangle = Longs only
Red triangle = Shorts only
(Each signal is valid for the next candle. After that it expires.)
The current bias is also shown in the bottom right corner.
How it works: We look at which parts of the last candle overlap with the current one. When the new candle's low is far above the last candle's low, it is an indication not to go short. Similarly, when the new candle's high is far below the last candle's high, it is an indication not to go long.
For each direction, we calculate this as a percentage value (what percentage of the last candle is not overlapping the new one), smooth the value and give a signal when we are above the set threshold.
Anchored Monte Carlo Shuffled Projection [LuxAlgo]The Anchored Monte Carlo Shuffled Projection tool randomly simulates future price points based on historical bar movements made before a user-anchored point in time.
By anchoring our data and projections to a single point in time, users can better understand and reflect on how the price played out while taking into consideration our random simulations.
🔶 USAGE
After selecting the indicator to apply to the chart, you will be prompted to "Set the Anchor Point". Do so by clicking on the desired location on your chart, only time is used as the anchor point.
Note: To select a new anchor point when applied to the chart, click on the 'More' dropdown next to the indicator status bar (○○○), then select "Reset points...".
Alternate Method: You are also able to click and drag the vertical line that displays on the anchor point bar when the indicator is highlighted.
By randomly simulating bar movements, a range is developed of potential price action which could be utilized to locate future price development as well as potential support/resistance levels.
Performing numerous simulations and taking the average at each step will converge toward the result highlighted by the "Average Line", and can point out where the price might develop, assuming the trend and amount of volatility persist.
Current closing price + Sum of changes in the calculation window
This constraint will cause the simulations always to display an endpoint consistent with the current lookback's slope.
While this may be helpful to some traders, this indicator includes an option to produce a less biased range, as seen below:
🔶 DETAILS
The Anchored Monte Carlo Shuffled Projection tool creates simulations based on prices within a user-set lookback window originating at the specified anchor point. Simulations are done as follows:
Collect each bar's price changes in the user-set window.
Randomize the order of each change in the window.
Project the cumulative sum of the shuffled changes from the current closing price.
Collect data on each point along the way.
This is the process for the Default calculation; for the 'Randomize Direction' calculation, when added onto the front for every other change, the value is inverted, creating the randomized endpoints for each simulation.
The script contains each simulation's data for that bar, with a maximum of 1000 simulations.
To get a glimpse behind the scenes, each simulation (up to 99) can be viewed using the 'Visualize Simulations' Options, as seen below.
Because the script holds the full simulation data, the script can also calculate this data, such as standard deviations.
In this script the Standard deviation lines are the average of all standard deviations across the vertical data groups, this provides a singular value that can be displayed a distance away from the simulation center line.
🔶 SETTINGS
Lookback: Sets the number of Bars to include in calculations.
Simulation Count: Sets the number of randomized simulations to calculate. (Max 1000)
Randomize Direction: See Details Above. Creates a more 'Normalized' Distribution
Visualize Simulations: See Details Above. Turns on Visualizations, and colors are randomly generated. Visualized max does not cap the calculated max. If 1000 simulations are used, the data will be from 1000 simulations, however, only the last 99 simulations will be visualized.
🔹 Standard Deviations
Standard Deviation Multiplier: Sets the multiplier to use for the Standard Deviation distance away from the center line.
🔹 Style
Extend Lines: Extends the Simulated Value Lines into the future for further reference and analysis.

Discovery IndexThe Discovery Index is an original technical indicator which attempts to display directional market pressure and momentum based on accumulated candle-over-candle measurements.
Discovery , in this context, is the act of finding (discovering) New Highs and Lows.
> What is 'Discovery'
Not to be confused with "Price Discovery", the term for setting the spot price of an asset.
The term 'Discovery' in Discovery Index is used based on the literal definition of 'Discovery', such as, the action of finding what was previously unknown.
Given this definition,
Discovery is the difference between highs or lows only when the current high is higher than the previous high or the current low is lower than the previous low.
Below is a visual example of exactly where Discovery is seen from each candle.
Since discovery is only based on points of the candle, and not specifically the direction of the candle; it is possible for discovery to occur in both directions from the same candle.
It is also possible for no discovery to occur from a candle.
> Calculation
The Discovery Index is the Net Total of discovery data over a specified length of bars.
Discovery Index = Sum of Upwards Discovery + Sum of Downwards Discovery
Note: Upwards Discovery is always Positive, and Downwards Discovery is always Negative. By adding both together, their Net Total is produced. This value is the "Discovery Index".
Wick Calculation Example
> Volume Discovery
Using Volume for the Discovery Index Calculation allows for a different dimension to be added to the data for new analysis opportunities.
While volume data is only a single value, by accumulating this data over time, we are able to fabricate a candle body from the data by accounting for the direction of the chart candles.
This allows for the Calculation of the Discovery Index based on volume data.
Volume Example
> Display
The display uses a "Candlestick histogram" display. The bodies and wicks from the display represent the discovery data from the respective points in each candle. (Wick Discovery & Candle Body Discovery).
This style of histogram allows for the display of both data sources, preserving the accuracy and distinction between each type, while also providing a clean display.
> Considerations
Discovery index is not an Oscillator, since there are no upper or lower boundaries to its rotations.
There are not (at this time) any "Over-bought" or "Over-sold" Areas, this is partially due to the previous consideration since any levels for these could potentially change from chart to chart. Additionally, it would generally be better to read the data based on the context of the current market.
Non-directional movements effect the Discovery Index as well. Since Discovery does not occur from every bar, the Index reflects hesitations as well as movements in market direction.
With the option to input a symbol, the Discovery Index Indicator is not constrained to one chart ticker for its calculation and could help to see shifts between different symbols, making it easier to compare different assets.
With the separation of wicks and candle body data, a stronger move may be observed by its full-bodied movements, while a potentially more speculative move may be seen from large wick movements. Since wicks are often interpreted as either, Rejection for reversal OR as Testing for continuation, the interpretation for Wick Discovery generally varies based on context.
Discovery Index ⇾ Divergences! Due to its calculation, price (and/or volume) data is displayed in such a way that makes it useful as a tool for identifying divergence opportunities.
Remember, this indicator is lookback based. An immediate significant change from the data source (if not offset by a similar opposite change) will be represented for multiple bars after its occurrence. Due to this, data is likely to be skewed or biased from these occurrences for a period of time after.
Throughout development, "Discovery" has been shortened to just "Disco", therefore, this indicator is also an attempt to bring Disco Back.
Enjoy!

ICT Immediate Rebalance Toolkit [LuxAlgo]The ICT Immediate Rebalance Toolkit is a comprehensive suite of tools crafted to aid traders in pinpointing crucial trading zones and patterns within the market.
The ICT Immediate Rebalance, although frequently overlooked, emerges as one of ICT's most influential concepts, particularly when considered within a specific context. The toolkit integrates commonly used price action tools to be utilized in conjunction with the Immediate Rebalance patterns, enriching the capacity to discern context for improved trading decisions.
The ICT Immediate Rebalance Toolkit encompasses the following Price Action components:
ICT Immediate Rebalance
Buyside/Sellside Liquidity
Order Blocks & Breaker Blocks
Liquidity Voids
ICT Macros
🔶 USAGE
🔹 ICT Immediate Rebalance
What is an Immediate Rebalance?
Immediate rebalances, a concept taught by ICT, hold significant importance in decision-making. To comprehend the concept of immediate rebalance, it's essential to grasp the notion of the fair value gap. A fair value gap arises from market inefficiencies or imbalances, whereas an immediate rebalance leaves no gap, no inefficiencies, or no imbalances that the price would need to return to.
Rule of Thumb
After an immediate rebalance, the expectation is for two extension candles to follow; otherwise, the immediate rebalance is considered failed. It's important to highlight that both failed and successful immediate rebalances, when considered within a context, are significant signatures in trading.
Immediate rebalances can occur anywhere and in any timeframe.
🔹 Buyside/Sellside Liquidity
In the context of Inner Circle Trader's teachings, liquidity primarily refers to the presence of stop losses or pending orders, that indicate concentrations of buy or sell orders at specific price levels. Institutional traders, like banks and large financial entities, frequently aim for these liquidity levels or pools to accumulate or distribute their positions.
Buyside liquidity denotes a chart level where short sellers typically position their stops, while Sellside liquidity indicates a level where long-biased traders usually place their stops. These zones often serve as support or resistance levels, presenting potential trading opportunities.
The presentation applied here is the multi-timeframe version of our previously published Buyside-Sellside-Liquidity script.
🔹 Order Blocks & Breaker Blocks
Order Blocks and Breaker Blocks hold significant importance in technical analysis and play a crucial role in shaping market behavior.
Order blocks are fundamental elements of price action analysis used by traders to identify key levels in the market where significant buying or selling activity has occurred. These blocks represent areas on a price chart where institutional traders, banks, or large market participants have placed substantial buy or sell orders, leading to a temporary imbalance in supply and demand.
Breaker blocks, also known as liquidity clusters or pools, complement order blocks by identifying zones where liquidity is concentrated on the price chart. These areas, formed from mitigated order blocks, often act as significant barriers to price movement, potentially leading to price stalls or reversals in the future.
🔹 Liquidity Voids
Liquidity voids are sudden price changes when the price jumps from one level to another. Liquidity voids will appear as a single or a group of candles that are all positioned in the same direction. These candles typically have large real bodies and very short wicks, suggesting very little disagreement between buyers and sellers.
Here is our previously released Liquidity-Voids script.
🔹 ICT Macros
In the context of ICT's teachings, a macro is a small program or set of instructions that unfolds within an algorithm, which influences price movements in the market. These macros operate at specific times and can be related to price runs from one level to another or certain market behaviors during specific time intervals. They help traders anticipate market movements and potential setups during specific time intervals.
Here is our previously released ICT-Macros script.
🔶 SETTINGS
🔹 Immediate Rebalances
Immediate Rebalances: toggles the visibility of the detected immediate rebalance patterns.
Bullish, and Bearish Immediate Rebalances: color customization options.
Wicks 75%, %50, and %25: color customization options of the wick price levels for the detected immediate rebalance.
Ignore Price Gaps: ignores price gaps during calculation.
Confirmation (Bars): specifies the number of bars required to confirm the validation of the detected immediate rebalance.
Immediate Rebalance Icon: allows customization of the size of the icon used to represent the immediate rebalance.
🔹 Buyside/Sellside Liquidity
Buyside/Sellside Liquidity: toggles the visibility of the buy-side/sell-side liquidity levels.
Timeframe: this option is to identify liquidity levels from higher timeframes. If a timeframe lower than the chart's timeframe is selected, calculations will be based on the chart's timeframe.
Detection Length: lookback period used for the detection.
Margin: sets margin/sensitivity for the liquidity levels.
Buyside/Sellside Liquidity Color: color customization option for buy-side/sell-side liquidity levels.
Visible Liquidity Levels: allows customization of the visible buy-side/sell-side liquidity levels.
🔹 Order Blocks & Breaker Blocks
Order Blocks: toggles the visibility of the order blocks.
Breaker Blocks: toggles the visibility of the breaker blocks.
Swing Detection Length: lookback period used for the detection of the swing points used to create order blocks & breaker blocks.
Mitigation Price: allows users to select between the closing price or the wick of the candle.
Use Candle Body in Detection: allows users to use candle bodies as order block areas instead of the full candle range.
Remove Mitigated Order Blocks & Breaker Blocks: toggles the visibility of the mitigated order blocks & breaker blocks.
Order Blocks: Bullish, Bearish Color: color customization option for order blocks.
Breaker Blocks: Bullish, Bearish Color: color customization option for breaker blocks.
Visible Order & Breaker Blocks: allows customization of the visible order & breaker blocks.
Show Order Blocks & Breaker Blocks Labels: toggles the visibility of the order blocks & breaker blocks labels.
🔹 Liquidity Voids
Liquidity Voids: toggles the visibility of the liquidity voids.
Liquidity Voids Width Filter: filtering threshold while detecting liquidity voids.
Ignore Price Gaps: ignores price gaps during calculation.
Remove Mitigated Liquidity Voids: remove mitigated liquidity voids.
Bullish, Bearish, and Mitigated Liquidity Voids: color customization option..
Liquidity Void Labels: toggles the visibility of the liquidity voids labels.
🔹 ICT Macros
London and New York (AM, Launch, and PM): toggles the visibility of specific macros, allowing users to customize macro colors.
Macro Top/Bottom Lines, Extend: toggles the visibility of the macro's pivot high/low lines and allows users to extend the pivot lines.
Macro Mean Line: toggles the visibility of the macro's mean (average) line.
Macro Labels: toggles the visibility of the macro labels, allowing customization of the label size.
🔶 RELATED SCRIPTS
ICT-Killzones-Toolkit
Smart-Money-Concepts
Thanks to our community for recommending this script. For more conceptual scripts and related content, we welcome you to explore by visiting >>> LuxAlgo-Scripts .

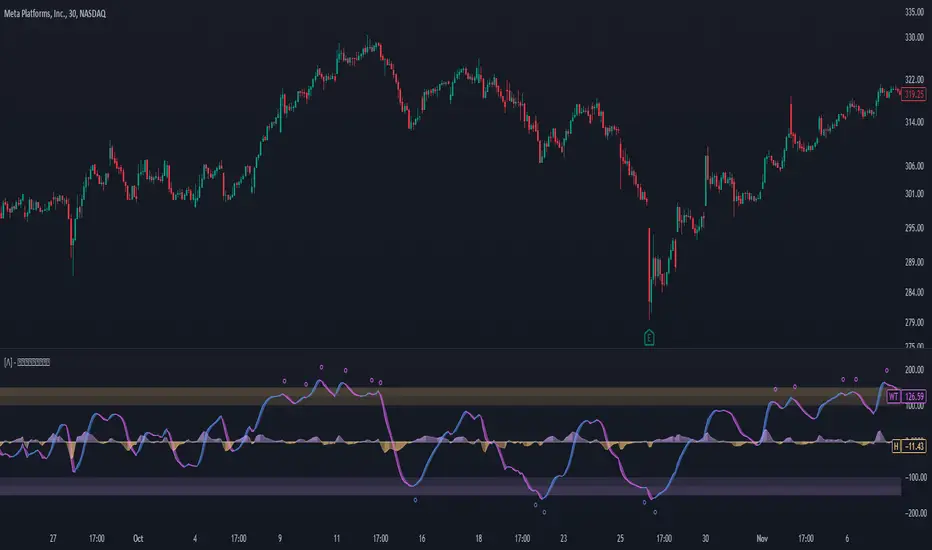
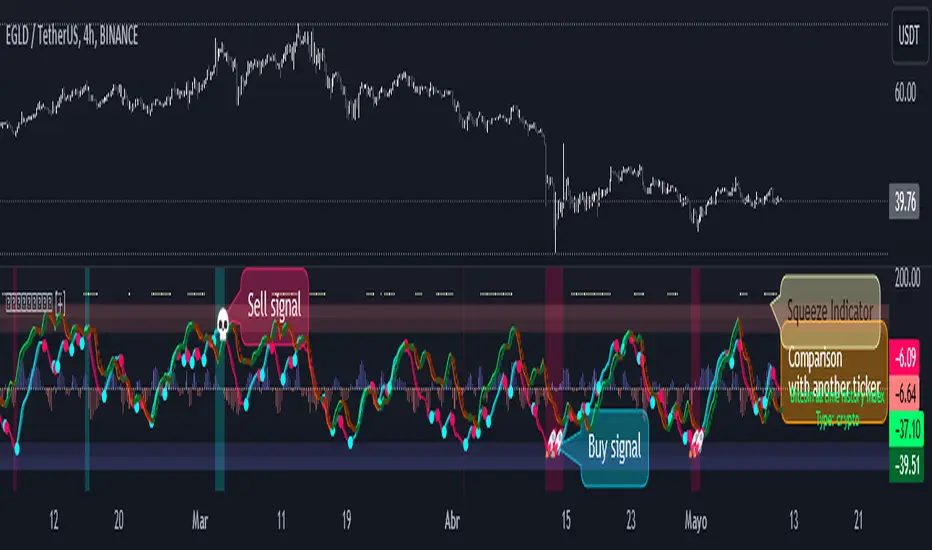
WaveTrend Oscillator PlusThe WaveTrend based on “Enhanced WaveTrend” of EliCobra. The WaveTrend Oscillator is a popular technical analysis tool used to identify overbought and oversold conditions in the market and generate trading signals. This indicator introduces additional features for improved analysis and comparison across assets.
WaveTrend:
The original WaveTrend indicator calculates two lines based on exponential moving averages and their relationship to the asset's price. The first line measures the distance between the asset's price and its EMA, while the second line smooths the first line over a specific period. The result is divided by 0.015 multiplied by the smoothed difference ('d' for reference). The indicator aims to identify overbought and oversold conditions by analyzing the relationship between the two lines.
In the original formula, the rudimentary estimation factor 0.015 times 'd' fails to accomodate for approximately a quarter of the data, preventing the indicator from reaching the traditional stationary levels of +-100. This limitation renders the indicator quantitatively biased, as it relies on the user's subjective adjustment of the levels. The enhanced version replaces this factor with the standard deviation of the asset's price, resulting in improved estimation accuracy and provides a more dynamic and robust outcome, we thereafter multiply the result by 100 to achieve a more traditional oscillation.
Enhancements and Features:
Dynamic Estimation: The original indicator uses an arbitrary estimation factor, while the enhanced version replaces it with the standard deviation of the asset's price. This modification provides a more dynamic and accurate estimation, adapting to the specific price characteristics of each asset.
Stationary Support and Resistance Levels: The enhanced version provides stationary key support and resistance levels that range from -150 to 150. These levels are determined based on the analysis of the indicator's data and encompass more than 95% of the indicator's values. These levels offer important reference points for traders to identify potential price reversals or significant price movements.
Comparison Across Assets: The enhanced version allows for better comparison and analysis across different assets. By incorporating the standard deviation of the asset's price, the indicator provides a more consistent and comparable interpretation of the market conditions across multiple assets.
Z-Score Analysis:
The Z-Score is a statistical measurement that quantifies how far a particular data point deviates from the mean in terms of standard deviations. In the enhanced version, the calculation involves determining the basis (mean) and deviation (standard deviation) of the asset's price to calculate its Z-Score, thereafter applying a smoothing technique to generate the final WaveTrend value.
Utility:
The offers traders and investors valuable insights into overbought and oversold conditions in the market. By analyzing the indicator's values and referencing the stationary support and resistance levels, traders can identify potential trend reversals, evaluate market strength, and make better informed analysis.
The following indicators were added:
⎆⎆ Squeeze Momentum Indicator
⎆⎆ Elliott Wave Oscillator
⎆⎆ Expert Trend Locator
Monte Carlo Shuffled Projection [LuxAlgo]The Monte Carlo Shuffled Projection tool randomly simulates future price points based on historical bar movements made within a user-selected window.
The tool shows potential paths price might take in the future, as well as highlighting potential support/resistance levels.
Note that simulations and their resulting elements are subject to slight changes over time.
🔶 USAGE
By randomly simulating bar movements, a range is developed of potential price action which could be utilized to locate future price development as well as potential support/resistance levels.
Performing a large number of simulations and taking the average at each step will converge toward the result highlighted by the "Average Line", and can point out where the price might develop assuming the trend and amount of volatility persist.
Current closing price + Sum of changes in the calculation window)
This constraint will cause the simulations to always display an endpoint consistent with the current lookback's slope.
While this may be helpful to some traders, this indicator includes an option to produce a less biased range as seen below:
🔶 DETAILS
The Monte Carlo Shuffled Projection tool creates simulations based on the most recent prices within a user-set window. Simulations are done as follows:
Collect each bar's price changes in the user-set window.
Randomize the order of each change in the window.
Project the cumulative sum of the shuffled changes from the current closing price.
Collect data on each point along the way.
This is the process for the Default calculation, for the 'Randomize Direction' calculation, when added onto the front for every other change, the value is inverted, creating the randomized endpoints for each simulation.
The script contains each simulation's data for that bar with a maximum of 1000 simulations.
To get a glimpse behind the scenes each simulation (up to 99) can be viewed using the 'Visualize Simulations' Options as seen below.
Because the script holds the full simulation data, the script can also do calculations on this data, such as calculating standard deviations.
In this script the Standard deviation lines are the average of all standard deviations across the vertical data groups, this provides a singular value that can be displayed a distance away from the simulation center line.
🔶 SETTINGS
Color and Toggle Options are Provided throughout.
Lookback: Sets the number of Bars to include in calculations.
Simulation Count: Sets the number of randomized simulations to calculate. (Max 1000)
Randomize Direction: See Details Above. Creates a more 'Normalized' Distribution
Visualize Simulations: See Details Above. Turns on Visualizations, and colors are randomly generated. Visualized max does not cap the calculated max. If 1000 simulations are used, the data will be from 1000 simulations, however only the last 99 simulations will be visualized.
Standard Deviation Multiplier: Sets the multiplier to use for the Standard Deviation distance away from the center line.
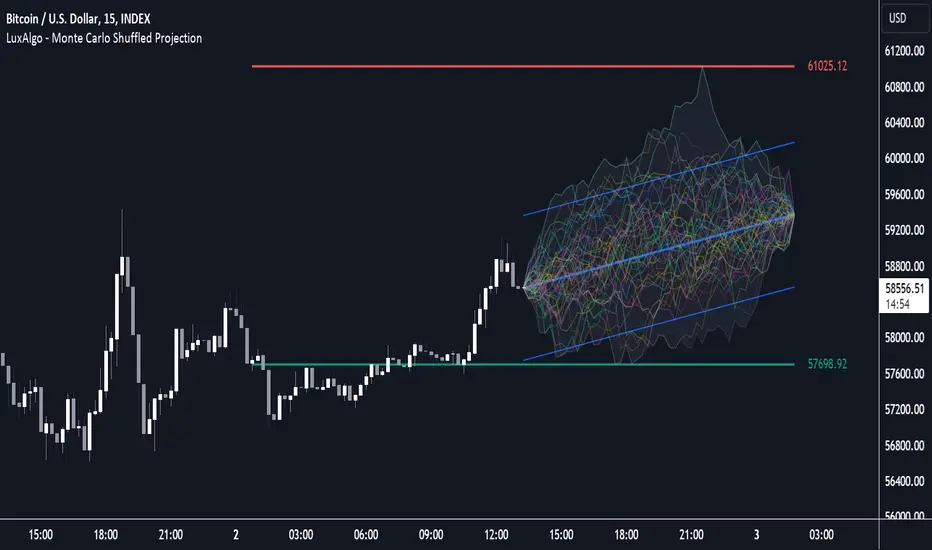
Kalman Filter Volume Bands by TenozenHello there! I am excited to introduce a new original indicator, the Kalman Filter Volume Bands. This indicator is calculated using the Kalman Filter, which is an adaptive-based smoothing quantitative tool. The Kalman Filter Volume Bands have two components that support the calculation, namely VWAP and VaR.
VWAP is used to determine the weight of the Kalman Filter Returns, but it doesn't have a significant impact on the calculation. On the other hand, VaR or Value at risk is calculated using the 99th percentile, which means that there is a 1% chance for the returns to exceed the 99th percentile level. After getting the VaR value, I manually adjust the bands based on the current market I'm trading on. I take the highest point (VaR*2) and the lowest point (-(VaR*2)) from the Kalman Filter, and then divide them into segments manually based on my preference.
This process results in 8 segments, where 2 segments near the Kalman Filter are further divided, making a total of 12 segments. These segments classify the current state of the price based on code-based coloring. The five states are very bullish, bullish, very bearish, bearish, and neutral.
I created this indicator to have an adaptive band that is not biased toward the volatility of the market. Most band-based indicators don't capture reversals that well, but the Kalman Filter Volume Bands can capture both trends and reversals. This makes it suitable for both trend-following and reversal trading approaches.
That's all for the explanation! Ciao!
Additional Reminder:
- Please use hourly timeframes or higher as lower timeframes are too noisy for reliable readings of this indicator.
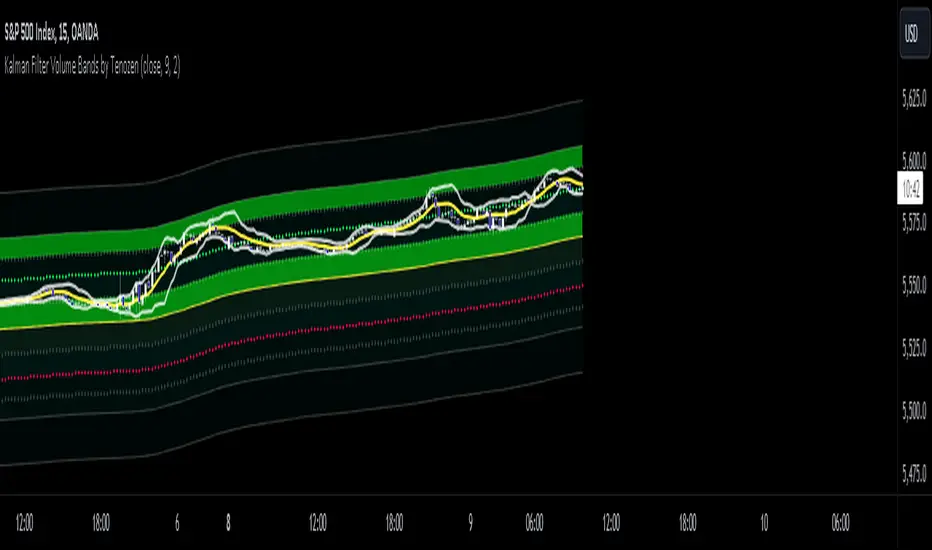
Trend Regression Kernel [IkkeOmar]Kernel by @jdehorty huge shoutout to him! This is only an idea for how I use it when trading
All credit for the kernel goes to him, I did not make the kernel! I don't know how to make it more clear.
I use this to assist with top-down analysis.
timeframe I want to trade : timeframe to analyse with white noise and kernel:
1m : 1H
5m : 2H
15m : 4H
1H : 1D
In the chart you see that I have the 1H open, I use the white noise at a "lower setting length" (55 in this case), I change the source of to be the kernel on the higher timeframe. When a new trend is detected by the White noise I wait for price to retest the kernel before building a position. Another case described below:
Here i use the adaptive MCVF (I have made this free for everyone on TradingView) to buy when price is below the kernel while the trend for the white noise is bullish .
Notice that the Kernel is set on the 4H timeframe! The source of the white noise is the kernel!
Here is an example in a bearish trend:
Notice, I am on the 5m chart, kernel uses the 2H chart and the source of the white noise is the kernel.
I use the adaptive MCVF to help me get entries AFTER the first touch of the kernel.
Mandatory code explanation, with respect to the house rules:
Input settings:
Input Settings:
The script provides various input parameters to customize the indicator:
src: The source of price data, defaulted to closing prices.
h, r, x_0: Parameters for Kernel 1.
h2, r2, x_2: Parameters for Kernel 2.
Kernel Regression Functions:
Two functions kernel_regression1 and kernel_regression2 are defined to perform kernel regression calculations.
These functions estimate the trend using the Nadaraya-Watson kernel non-parametric regression method.
They take the source data (_src), the size of the data series (_size), and the lookback window (_h) as inputs.
They iterate over the data series and calculate the weighted sum of the values based on the specified kernel parameters.
The result is divided by the cumulative weight to obtain the estimated value.
Estimations:
The kernel_regression1 and kernel_regression2 functions are called with the respective parameters to estimate trends (yhat1 and yhat2).
Buy and Sell Signals:
Buy and sell signals are generated based on crossover and crossunder conditions between the two trend estimates (yhat1 and yhat2).
buySignal is true when yhat1 crosses above yhat2.
SellSignal is true when yhat1 crosses below yhat2.
Plotting:
The average of the two trend estimates (yhat1 and yhat2) is calculated and plotted.
The color of the plot is determined based on whether yhat1 is greater than yhat2, less than yhat2, or equal to yhat2.
Buy and sell signals are plotted using triangle shapes below and above bars, respectively.
Alerts:
Alert conditions are set based on buy and sell signals. Alerts are triggered when a crossover (long signal) or crossunder (short signal) occurs.
The alerts include information about the signal type, symbol, and price.
It's important to mention that the buy and sell signals from the indicator is very discretionary, I rarely use them, and if I do it's if they are in confluence with a correction i am biased towards or if it has confluence with some of my other systems.
The adaptive MCVF and White noise is free for everyone on TradingView, linked below:)
Huge shoutout to @jdehorty, original kernel below:

COSTAR [SS]This idea came to me after I wrote the post about Co-Integration and pair trading. I wondered if you could use pair trading principles as a way to determine overbought and oversold conditions in a more neutral way than RSI or Stochastics.
The results were promising and this indicator resulted :-)!
About:
COSTAR provides another, more neutral way to determine whether an equity is overbought or oversold.
Instead of relying on the traditional oscillator based ways, such as using RSI, Stochastics and MFI, which can be somewhat biased and narrow sided, COSTAR attempts to take a neutral, unbiased approached to determine overbought and oversold conditions. It does this through using a co-integrated partner, or "pair" that is closely linked to the underlying equity and succeeds on both having a high correlation and a high t-statistic on the ADF test. It then references this underlying, co-integrated partner as the "benchmark" for the co-integration relationship.
How this succeeds as being "unbiased" and "neutral" is because it is responsive to underlying drivers. If there is a market catalyst or just general bullish or bearish momentum in the market, the indicator will be referencing the integrated relationship between the two pairs and referencing that as a baseline. If there is a sustained rally on the integrated partner of the underlying ticker that is holding, but the other ticker is lagging, it will indicate that the other ticker is likely to be under-valued and thus "oversold" because it is underperforming its benchmark partner.
This is in contrast to traditional approaches to determining overbought and oversold conditions, which rely completely on a single ticker, with no external reference to other tickers and no control over whether the move could potentially be a fundamental move based on an industry or sector, or whether it is a fluke or a squeeze.
The control for this giving "false" signals comes from its extent of modelling and assessment of the degree of integration of the relationship. The parameters are set by default to assess over a 1 year period, both the correlation and the integration. Anything that passes this degree of integration is likely to have a solid, co-integrated state and not likely to be a "fluke". Thus, the reliability of the assessment is augmented by the degree of statistical significance found within the relationship. The indicator is not going to prompt you to rely on a relationship that is statistically weak, and will warn you of such.
The indicator will show you all the information you require regarding the relationship and whether it is reliable or not, so you do not need to worry!
How to Use
The first step to use COSTAR is identifying which ticker has a strong relationship with the current ticker. In the main chart, you will see that SPY is overlaid with VIX. There is a strong, negative correlation between the VIX and SPY. When VIX is entered as the paired ticker, the indicator returns the data as stationary, indicating a compatible match.
Now you have 3 ways of viewing this relationship, 2 of which are going to be directly applicable to trading.
You can view them as
Price to Price Ratio (Not very useful for trading, but if you are curious)
Z-Score: Helpful for trading
Co-integration: Helpful for trading
Here is an example of all three:
Example of Z-Score Chart:
Example of Price Ratio:
Example of Co-Integration Pair:
Using for Trading
As stated above, the two best ways to use this for trading is to either use the Z-Score Chart or the Co-Integrated Pair chart.
The Z-Score chart is based off of the price ratio data and provides an assessment of both the independent and dependent data.
The co-integration shows the dependent (the ticker you are trading) in yellow and the independent (the ticker you are referencing) in teal. When teal is above yellow, you will see it is green. This means, based on your benchmark pair, there is still more up room and the ticker you are trading is actually lagging behind.
When the yellow crosses up, it will turn red. This means that your ticker is out-performing the benchmark pair and you likely will see pullback and a "regression to the mean" through re-integration.
The indicator is capable of plotting out entries and exits, which are guided by the z-score:
How Effective is it?
I created a basic strategy in Pinescript, and the back-test results vary. Trading ES1! using NQ1! as the co-integrated pair, results were around 78% effective.
With VIX, results were around 50% effective, but with a net profit.
Generally, the efficacy surpassed that of both stochastics and RSI.
I will be releasing the strategy version of this in the coming days, still just cleaning up that code and making it more "public use" friendly.
Other Applications
If you are a pair trader, you can technically use this for pair trading as well. That's essentially all this is doing :-).
Tips
If you are trading a ticker such as MSFT, AMD, KO etc., it's best to try to find an ETF or index that has that particular ticker as a large holding and use that as your benchmark. You will see on the indicator whether there is a high correlation and whether the data is indeed stationary.
If the indicator returns "Non-stationary", you can attempt to extend your regression range from 252 to 500. If this fixes the issue, ensure that the correlation is still >= 0.5 or <= -0.5. If this does not work still, you will need to find another pair, as its likely the result of incompatibility and an insignificant relationship.
To help you identify tickers with strong relationships, consider using a correlation heatmap indicator. I have one available and I think there are a couple of other similar ish ones out there. You want to make sure the relationship is stable over time (a correlation of >= 0.50 or <= -0.5 over the past 252 to 500 days).
IMPORTANT: The long and short exits delete the signal after one is signaled. Therefore, when you look back in the chart you will notice there are no signals to exit long or short. That is because they signal as they happen. This is to keep the chart clean.
'Tis all my friends!
Hope you enjoy and let me know your questions and suggestions below!
Side note:
COSTAR stands for Co-integration Statistical Analysis and Regression. ;)

Enhanced WaveTrend OscillatorThe Enhanced WaveTrend Oscillator is a modified version of the original WaveTrend. The WaveTrend indicator is a popular technical analysis tool used to identify overbought and oversold conditions in the market and generate trading signals. The enhanced version addresses certain limitations of the original indicator and introduces additional features for improved analysis and comparison across assets.
WaveTrend:
The original WaveTrend indicator calculates two lines based on exponential moving averages and their relationship to the asset's price. The first line measures the distance between the asset's price and its EMA, while the second line smooths the first line over a specific period. The result is divided by 0.015 multiplied by the smoothed difference ('d' for reference). The indicator aims to identify overbought and oversold conditions by analyzing the relationship between the two lines.
In the original formula, the rudimentary estimation factor 0.015 times 'd' fails to accomodate for approximately a quarter of the data, preventing the indicator from reaching the traditional stationary levels of +-100. This limitation renders the indicator quantitatively biased, as it relies on the user's subjective adjustment of the levels. The enhanced version replaces this factor with the standard deviation of the asset's price, resulting in improved estimation accuracy and provides a more dynamic and robust outcome, we thereafter multiply the result by 100 to achieve a more traditional oscillation.
Enhancements and Features:
The enhanced version of the WaveTrend indicator addresses several limitations of the original indicator and introduces additional features-
Dynamic Estimation: The original indicator uses an arbitrary estimation factor, while the enhanced version replaces it with the standard deviation of the asset's price. This modification provides a more dynamic and accurate estimation, adapting to the specific price characteristics of each asset.
Stationary Support and Resistance Levels: The enhanced version provides stationary key support and resistance levels that range from -150 to 150. These levels are determined based on the analysis of the indicator's data and encompass more than 95% of the indicator's values. These levels offer important reference points for traders to identify potential price reversals or significant price movements.
Comparison Across Assets: The enhanced version allows for better comparison and analysis across different assets. By incorporating the standard deviation of the asset's price, the indicator provides a more consistent and comparable interpretation of the market conditions across multiple assets.
Upon closer inspection of the modification in the enhanced version, we can observe that the resulting indicator is a smoothed variation of the Z-Score!
f_ewave(src, chlen, avglen) =>
basis = ta.ema(src, chlen)
dev = ta.stdev(src, chlen)
wave = (src - basis) / dev * 100
ta.ema(wave, avglen)
Z-Score Analysis:
The Z-Score is a statistical measurement that quantifies how far a particular data point deviates from the mean in terms of standard deviations. In the enhanced version, the calculation involves determining the basis (mean) and deviation (standard deviation) of the asset's price to calculate its Z-Score, thereafter applying a smoothing technique to generate the final WaveTrend value.
Utility:
The 𝗘𝗻𝗵𝗮𝗻𝗰𝗲𝗱 𝗪𝗧 indicator offers traders and investors valuable insights into overbought and oversold conditions in the market. By analyzing the indicator's values and referencing the stationary support and resistance levels, traders can identify potential trend reversals, evaluate market strength, and make better informed analysis.
It is important to note that this indicator should be used in conjunction with other technical analysis tools and indicators to confirm trading signals and validate market dynamics.
Credit:
The 𝗘𝗻𝗵𝗮𝗻𝗰𝗲𝗱 𝗪𝗧 indicator is a modification of the original WaveTrend Oscillator developed by @LazyBear on TradingView.
Example Charts: