4H Bias: Previous Candle FocusStructural Bias Confirmation Checklist
Has price broken a significant swing high/low on the 4HR?
Has price held beyond this level for at least one complete 4HR
candle?
Does the candle anatomy (OHLC vs OLHC pattern) confirm
directional intent?
Are subsequent 4HR candles showing continued momentum in
the bias direction?
Has a liquidity sweep occurred into the previous structure before
the continuation?
Search in scripts for "bias"

20-Day SMA BIAS%20-day Bias is a commonly used indicator in technical analysis. It is used to measure the gap between the stock price and its 20-day moving average to determine whether the stock price deviates from the normal state and whether there is an overbought or oversold phenomenon.
How to calculate the 20-day deviation value:
The calculation formula of the deviation rate is: ((closing price of the day - 20-day moving average price) / 20-day moving average price) * 100%.
Interpretation of 20-day deviation value:
Positive deviation rate:
Indicates that the stock price is higher than the 20-day moving average, which means that the stock price is high and may face correction pressure.
Negative deviation rate:
Indicates that the stock price is lower than the 20-day moving average, which means that the stock price is low and there may be a rebound opportunity.
Absolute value of the deviation rate:
The larger the absolute value, the higher the deviation of the stock price, and the higher the degree of overbought or oversold.
Apply the deviation rate to determine the buying and selling opportunities:
Positive deviation rate is too large:
When the positive deviation rate of the stock price from the 20-day moving average is too large, and the stock price is already at a high level, this may be a sell signal.
Negative deviation rate is too large:
When the negative deviation rate of the stock price from the 20-day moving average is too large, and the stock price is already at a low level, this may be a buy signal.
Stock price fluctuates around the moving average:
Stock price usually fluctuates around the moving average and adjusts after over-rising or over-falling.
Practical operation suggestions:
The standards of the market and individual stocks are different:
When the positive and negative deviation rate of the market and the quarterly line is greater than 5%, there is a greater chance of correction; large-cap stocks are between 5% and 10%; small and medium-sized stocks may be above 15% to 20%.
Combined with other indicators:
The deviation rate is only one of the technical analysis indicators. It is recommended to combine it with other indicators, such as KD indicators, RSI, etc., to make a comprehensive judgment and improve accuracy.
Reference to historical experience:
You can refer to the situation where the deviation rate of the stock was too large in the past to determine whether the current deviation rate is also too large.
Summary:
The 20-day deviation value is an indicator to determine whether the stock price is overbought or oversold, which can help investors determine the timing of buying and selling, but it needs to be combined with other indicators and historical data, and adjusted according to market conditions.

TICK Bias Timer with EMA Position📌 Description
This indicator tracks the time in minutes that the Exponential Moving Average (EMA) of the NYSE USI:TICK remains above or below the zero line. It serves as a powerful market breadth confirmation tool to support your intraday directional bias.
Rather than focusing on momentary TICK spikes, this tool emphasizes duration and persistence of buying/selling pressure across the entire NYSE – helping traders stay on the right side of the flow.
🔧 Features
✅ Measures how long the EMA of TICK stays above or below 0
✅ Visual plots of upward and downward pressure duration (in minutes)
✅ Background color changes based on EMA position relative to 0
✅ Automatic daily reset at a customizable time (e.g. 15:30 for RTH open)
✅ Gap filter to avoid spikes during overnight or weekend sessions
✅ Clean, minimalist design – built for real-time decision making
🎯 How to Use
EMA > 0 for 10+ minutes → sustained bullish breadth → intraday bullish bias
EMA < 0 for 10+ minutes → sustained bearish breadth → intraday bearish bias
Frequent flip between sides → uncertain or choppy market → trade with caution
Can be used in confluence with Volume Profile, VWAP, price action, and Bookmap to reinforce trade setups.
💡 Ideal For:
Scalpers looking for flow confirmation
Day traders who want to filter fake strength/weakness
Professionals using TICK, USI:ADD , USI:VOLD , and other internals for decision-making

S&R Precision Cloud by Dr. Abiram Sivprasad -4 directional biasDescription of the Script
**Script Name:** S&R Precision Cloud by Dr. Abhiram Sivprasad
**Overview:**
This script is designed to identify key support and resistance levels using the Central Pivot Range (CPR) methodology along with daily, weekly, and monthly pivots. It incorporates the Lagging Span from the Ichimoku Cloud to enhance decision-making in trading strategies for intraday, swing, and long-term positions mainly for directional bias.
---
### Key Components:
1. **Central Pivot Range (CPR):**
- **Central Pivot (CP):** Calculated as the average of the high, low, and close prices. This serves as a reference point for price action.
- **Below Central Pivot (BC) and Top Central Pivot (TC):** Derived to create a range that aids in identifying support and resistance levels.
2. **Support and Resistance Levels:**
- The script computes three support (S1, S2, S3) and resistance (R1, R2, R3) levels based on the Central Pivot.
- These levels are plotted for daily, weekly, and monthly time frames, providing traders with multiple reference points.
3. **Lagging Span:**
- The Lagging Span is plotted as the closing price shifted backward by 26 periods (as per Ichimoku settings).
- This serves as a filter for trade entries, where positions should only be taken in the direction opposite to where the price is relative to this line.
4. **User Inputs:**
- The script allows customization through checkboxes to plot daily, weekly, and monthly support and resistance levels as needed.
- Users can choose whether to display CPR and various support/resistance levels for better visual clarity.
5. **Color Coding:**
- The support and resistance lines are color-coded to distinguish between different levels (green for support, red for resistance, and blue for pivots).
---
### Trading Strategies:
- **Intraday Trading:**
- Utilize price movements around the Lagging Span and support/resistance levels for quick trades.
- **Swing Trading:**
- Identify potential reversal points at S2 and R2 levels, confirmed by divergences in price movement.
- **Long-Term Trading:**
- Monitor price behavior against the Lagging Span and significant pivot levels to capture longer trends.
---
### Summary:
This script equips traders with essential tools for technical analysis by clearly defining critical price levels and incorporating the Lagging Span for directional bias. It is suitable for various trading styles, including intraday, swing, and long-term strategies, making it a versatile addition to any trader’s toolkit.

HTF EMA Bias BackgroundThis indicator gives you the cross over points from EMAs on the 15 min chart as a coloured background, you can then go to the 1 min chart to see the overlay. Useful for a higher time frame BIAS.

Crypto Gann Channel Strategy (Long Bias, fixed)This is Gann Strategy Cody with Long Bias. Please try and let me know if can be improved.

Fancy Moving Average [BigBitsIO]This script is for a single moving average with as many features as I can possibly fit into a single moving average. If you can think of more, or have questions regarding this script, please message me or contact me via social media.
Features:
- A single moving average (MA).
- Standard MA inputs.
- MA type.
- MA period.
- MA price.
- MA resolution (time frame).
- Visibility toggle.
- Fancy MA inputs.
- Toggle to show only candles included in the MA calculation ("Highlight inclusion") or display entire MA history.
- Toggle to show a ghost trail when Highlight inclusion is toggled on. Displays a shaded version of past MA history before the inclusion period (as seen on snapshot).
- Toggle to show forecast values for the MA.
- Other inputs related to forecasting:
- Forecast bias. (Neutral forecasts MA if the current price remains the same.)
- Forecast period.
- Forecast magnitude.
*** DISCLAIMER: For educational and entertainment purposes only. Nothing in this content should be interpreted as financial advice or a recommendation to buy or sell any sort of security or investment including all types of crypto. DYOR, TYOB. ***

Scout Regiment - Bias# Scout Regiment - Bias Indicator
## English Documentation
### Overview
Scout Regiment - Bias is a technical indicator that measures the deviation (bias) between the current price and exponential moving averages (EMAs). It helps traders identify overbought/oversold conditions, trend strength, and potential reversal points through divergence detection.
### What is Bias?
Bias measures how far the price has moved away from a moving average, expressed as a percentage:
- **Positive Bias**: Price is above the EMA (potential overbought)
- **Negative Bias**: Price is below the EMA (potential oversold)
- **Formula**: Bias = (Price - EMA) / EMA × 100
### Key Features
#### 1. **Triple EMA Bias Lines**
The indicator calculates bias from three different EMAs:
- **EMA 55 Bias** (Default: Green/Red, 1px line)
- Short-term bias measurement
- Quick response to price changes
- Best for intraday and swing trading
- **EMA 144 Bias** (Pink, 2px line)
- Medium-term bias measurement
- Balanced response to price movements
- Ideal for swing trading
- **EMA 233 Bias** (White, 2px line)
- Long-term bias measurement
- Slower response, more stable
- Best for position trading
**Color Coding:**
- Green: Price above EMA (bullish)
- Red: Price below EMA (bearish)
#### 2. **Visual Components**
**Histogram Display**
- Shows EMA 55 bias as a histogram for easy visualization
- Green bars: Price above EMA 55
- Red bars: Price below EMA 55
- Can be toggled on/off
**Background Color**
- Light green background: Bullish bias (price above EMA 55)
- Light red background: Bearish bias (price below EMA 55)
- Optional display for cleaner charts
**Zero Line**
- White horizontal line at 0%
- Reference point for positive/negative bias
- Crossovers indicate trend changes
**Crossover Labels**
- "突破" (Breakout): When bias crosses above zero
- "跌破" (Breakdown): When bias crosses below zero
- Can be enabled/disabled for clarity
#### 3. **Divergence Detection**
The indicator automatically detects regular divergences for all three bias lines:
**Bullish Divergence (Yellow Labels)**
- Price makes lower lows
- Bias makes higher lows
- Suggests potential upward reversal
- Labels: "55涨", "144涨", "233涨"
**Bearish Divergence (Blue Labels)**
- Price makes higher highs
- Bias makes lower highs
- Suggests potential downward reversal
- Labels: "55跌", "144跌", "233跌"
**Divergence Parameters** (Customizable for each EMA):
- Left Lookback: Bars to the left of pivot (default: 5)
- Right Lookback: Bars to the right of pivot (default: 1)
- Max Lookback Range: Maximum distance between pivots (default: 60)
- Min Lookback Range: Minimum distance between pivots (default: 5)
### Configuration Settings
#### Bias Settings
- **EMA Periods**: Customize lengths for EMA 55, 144, and 233
- **Price Source**: Choose calculation source (default: close)
- **Enable/Disable**: Toggle each bias line independently
#### Display Settings
- **Show Histogram**: Toggle histogram display
- **Show Background Color**: Toggle background coloring
- **Show Crossover Labels**: Toggle breakout/breakdown labels
#### Divergence Settings (Per EMA)
- Individual controls for EMA 55, 144, and 233 divergences
- Customizable lookback parameters for precision tuning
- Adjustable range settings for different market conditions
### How to Use
#### For Trend Trading
1. **Identify Trend Direction**
- Price above zero = Uptrend
- Price below zero = Downtrend
2. **Confirm with Multiple Timeframes**
- EMA 55: Short-term trend
- EMA 144: Medium-term trend
- EMA 233: Long-term trend
3. **Trade in Direction of Bias**
- All three lines positive = Strong uptrend
- All three lines negative = Strong downtrend
#### For Mean Reversion Trading
1. **Identify Extremes**
- High positive bias (>5-10%) = Overbought
- High negative bias (<-5 to -10%) = Oversold
2. **Wait for Confirmation**
- Look for bias to turn back toward zero
- Watch for crossover labels
3. **Enter on Reversal**
- Enter long when extreme negative bias starts rising
- Enter short when extreme positive bias starts falling
#### For Divergence Trading
1. **Spot Divergence Labels**
- Yellow labels = Bullish divergence (potential buy)
- Blue labels = Bearish divergence (potential sell)
2. **Confirm with Price Action**
- Wait for price to confirm with structure break
- Look for support/resistance reactions
3. **Use Multiple EMAs**
- EMA 55 divergence: Quick reversals
- EMA 144 divergence: Reliable signals
- EMA 233 divergence: Major trend changes
#### For Multi-Timeframe Analysis
1. **Check Long-term Bias** (EMA 233)
- Determines overall market direction
2. **Find Medium-term Entry** (EMA 144)
- Look for pullbacks in long-term trend
3. **Time Short-term Entry** (EMA 55)
- Enter when short-term aligns with longer timeframes
### Trading Strategies
#### Strategy 1: Triple Confirmation
- Wait for all three bias lines to be positive (or negative)
- Enter in direction of unanimous bias
- Exit when any line crosses zero
- Best for: Strong trending markets
#### Strategy 2: Divergence Trading
- Enable all divergence detection
- Take trades only when divergence appears
- Confirm with price structure
- Best for: Range-bound and reversal setups
#### Strategy 3: Zero Line Crossover
- Enable crossover labels
- Enter long on "突破" labels
- Enter short on "跌破" labels
- Use stop loss at recent swing points
- Best for: Trend following
#### Strategy 4: Extreme Reversion
- Wait for bias to reach extremes (>10% or <-10%)
- Enter counter-trend when bias reverses
- Exit at zero line
- Best for: Ranging markets
### Best Practices
1. **Combine with Price Action**
- Don't trade bias alone
- Confirm with support/resistance
- Look for candlestick patterns
2. **Use Multiple Timeframes**
- Check higher timeframe bias
- Trade in direction of larger trend
- Use lower timeframe for entry timing
3. **Manage Risk**
- Set stop losses beyond recent swings
- Don't fight extreme bias in strong trends
- Reduce position size at extremes
4. **Customize for Your Market**
- Volatile assets: Use wider ranges
- Stable assets: Use tighter ranges
- Adjust EMA periods for your timeframe
5. **Watch for False Signals**
- Multiple small divergences = Less reliable
- Divergences at extremes = More reliable
- Confirm with other indicators
### Indicator Combinations
**With Volume:**
- High bias + Low volume = Weak move
- High bias + High volume = Strong move
**With Moving Averages:**
- Check if price is above/below key EMAs
- Bias confirms EMA trend strength
**With RSI/MACD:**
- Multiple indicator divergence = Stronger signal
- Use bias for overbought/oversold confirmation
### Performance Tips
- Disable unused features for faster loading
- Use histogram for quick visual reference
- Enable background color for trend clarity
- Use divergence detection selectively
### Common Patterns
1. **Bias Expansion**: Bias increasing = Strong trend
2. **Bias Contraction**: Bias decreasing = Trend weakening
3. **Zero Line Bounce**: Price respects EMA as support/resistance
4. **Extreme Bias**: Over-extension, watch for reversal
5. **Divergence Cluster**: Multiple EMAs diverging = High probability reversal
### Alert Conditions
You can set alerts for:
- Bias crossing above/below zero
- Extreme bias levels
- Divergence detection
- All three bias lines aligned
---
## 中文说明文档
### 概述
Scout Regiment - Bias 是一个技术指标,用于测量当前价格与指数移动平均线(EMA)之间的偏离程度(乖离率)。它帮助交易者识别超买超卖状况、趋势强度,以及通过背离检测发现潜在的反转点。
### 什么是乖离率?
乖离率衡量价格偏离移动平均线的程度,以百分比表示:
- **正乖离**:价格高于EMA(可能超买)
- **负乖离**:价格低于EMA(可能超卖)
- **计算公式**:乖离率 = (价格 - EMA) / EMA × 100
### 核心功能
#### 1. **三重EMA乖离率线**
指标计算三条不同EMA的乖离率:
- **EMA 55 乖离率**(默认:绿色/红色,1像素线)
- 短期乖离测量
- 对价格变化反应快速
- 适合日内和波段交易
- **EMA 144 乖离率**(粉色,2像素线)
- 中期乖离测量
- 对价格波动反应平衡
- 最适合波段交易
- **EMA 233 乖离率**(白色,2像素线)
- 长期乖离测量
- 反应较慢,更稳定
- 适合仓位交易
**颜色编码:**
- 绿色:价格高于EMA(看涨)
- 红色:价格低于EMA(看跌)
#### 2. **视觉组件**
**柱状图显示**
- 以柱状图形式显示EMA 55乖离率,便于可视化
- 绿色柱:价格高于EMA 55
- 红色柱:价格低于EMA 55
- 可开关显示
**背景颜色**
- 浅绿色背景:看涨乖离(价格高于EMA 55)
- 浅红色背景:看跌乖离(价格低于EMA 55)
- 可选显示,图表更清爽
**零轴**
- 零点位置的白色横线
- 正负乖离的参考点
- 穿越表示趋势变化
**穿越标签**
- "突破":乖离率向上穿越零轴
- "跌破":乖离率向下穿越零轴
- 可启用/禁用以保持清晰
#### 3. **背离检测**
指标自动检测所有三条乖离率线的常规背离:
**看涨背离(黄色标签)**
- 价格创新低
- 乖离率创更高的低点
- 暗示潜在向上反转
- 标签:"55涨"、"144涨"、"233涨"
**看跌背离(蓝色标签)**
- 价格创新高
- 乖离率创更低的高点
- 暗示潜在向下反转
- 标签:"55跌"、"144跌"、"233跌"
**背离参数**(每个EMA可自定义):
- 左侧回溯:枢轴点左侧K线数(默认:5)
- 右侧回溯:枢轴点右侧K线数(默认:1)
- 最大回溯范围:枢轴点之间最大距离(默认:60)
- 最小回溯范围:枢轴点之间最小距离(默认:5)
### 配置设置
#### Bias设置
- **EMA周期**:自定义EMA 55、144和233的长度
- **价格源**:选择计算源(默认:收盘价)
- **启用/禁用**:独立切换每条乖离率线
#### 显示设置
- **显示柱状图**:切换柱状图显示
- **显示背景颜色**:切换背景着色
- **显示突破标签**:切换突破/跌破标签
#### 背离设置(按EMA)
- EMA 55、144和233背离的独立控制
- 可自定义回溯参数用于精确调整
- 可调整范围设置以适应不同市场状况
### 使用方法
#### 趋势交易
1. **识别趋势方向**
- 价格高于零 = 上升趋势
- 价格低于零 = 下降趋势
2. **多时间框架确认**
- EMA 55:短期趋势
- EMA 144:中期趋势
- EMA 233:长期趋势
3. **顺乖离方向交易**
- 三条线全部为正 = 强劲上升趋势
- 三条线全部为负 = 强劲下降趋势
#### 均值回归交易
1. **识别极值**
- 高正乖离(>5-10%)= 超买
- 高负乖离(<-5至-10%)= 超卖
2. **等待确认**
- 等待乖离率回归零轴
- 观察穿越标签
3. **在反转时进场**
- 极端负乖离开始上升时做多
- 极端正乖离开始下降时做空
#### 背离交易
1. **发现背离标签**
- 黄色标签 = 看涨背离(潜在买入)
- 蓝色标签 = 看跌背离(潜在卖出)
2. **用价格行为确认**
- 等待价格通过结构突破确认
- 观察支撑/阻力反应
3. **使用多个EMA**
- EMA 55背离:快速反转
- EMA 144背离:可靠信号
- EMA 233背离:重大趋势变化
#### 多时间框架分析
1. **检查长期乖离**(EMA 233)
- 确定整体市场方向
2. **寻找中期入场**(EMA 144)
- 在长期趋势中寻找回调
3. **把握短期入场时机**(EMA 55)
- 短期与长期时间框架一致时进场
### 交易策略
#### 策略1:三重确认
- 等待三条乖离率线全部为正(或负)
- 顺一致乖离方向入场
- 任一线穿越零轴时离场
- 适合:强趋势市场
#### 策略2:背离交易
- 启用所有背离检测
- 仅在出现背离时交易
- 用价格结构确认
- 适合:震荡和反转设置
#### 策略3:零轴穿越
- 启用穿越标签
- 在"突破"标签时做多
- 在"跌破"标签时做空
- 在近期波动点设置止损
- 适合:趋势跟随
#### 策略4:极值回归
- 等待乖离率达到极值(>10%或<-10%)
- 乖离率反转时逆趋势入场
- 在零轴离场
- 适合:震荡市场
### 最佳实践
1. **结合价格行为**
- 不要单独使用乖离率交易
- 用支撑/阻力确认
- 寻找K线形态
2. **使用多时间框架**
- 检查更高时间框架的乖离
- 顺大趋势方向交易
- 用低时间框架把握入场时机
3. **风险管理**
- 在近期波动之外设置止损
- 不要在强趋势中对抗极端乖离
- 在极值处减少仓位
4. **针对您的市场定制**
- 波动大的资产:使用更宽的范围
- 稳定的资产:使用更紧的范围
- 根据时间框架调整EMA周期
5. **警惕假信号**
- 多个小背离 = 可靠性较低
- 极值处的背离 = 更可靠
- 用其他指标确认
### 指标组合
**与成交量配合:**
- 高乖离 + 低成交量 = 弱势波动
- 高乖离 + 高成交量 = 强势波动
**与移动平均线配合:**
- 检查价格是否在关键EMA上方/下方
- 乖离率确认EMA趋势强度
**与RSI/MACD配合:**
- 多指标背离 = 更强信号
- 使用乖离率确认超买超卖
### 性能提示
- 禁用未使用的功能以加快加载
- 使用柱状图快速视觉参考
- 启用背景颜色以清晰显示趋势
- 有选择地使用背离检测
### 常见形态
1. **乖离扩张**:乖离率增大 = 强趋势
2. **乖离收缩**:乖离率减小 = 趋势减弱
3. **零轴反弹**:价格将EMA作为支撑/阻力
4. **极端乖离**:过度延伸,注意反转
5. **背离集群**:多个EMA背离 = 高概率反转
### 警报条件
您可以为以下情况设置警报:
- 乖离率向上/向下穿越零轴
- 极端乖离水平
- 背离检测
- 三条乖离率线对齐
---
## Technical Support
For questions or issues, please refer to the TradingView community or contact the indicator creator.
## 技术支持
如有问题,请参考TradingView社区或联系指标创建者。

HS:- HA+BIAS📝 Daily Bias + Heikin Ashi Step Line (Notes)
1️⃣ Indicator Purpose
Combines Daily Market Bias with Heikin Ashi Average
Displays HA average as a STEP LINE WITH BREAKS
HA line changes color based on bias
Works on any timeframe
Bias logic is always calculated from Daily data
2️⃣ Heikin Ashi Calculation
Uses Heikin Ashi candles internally
Does not change chart candles
Formula used:
HA Average = (HA Open + HA Close) / 2
Provides a smoother price reference than normal candles
3️⃣ Daily Reference Levels
Uses previous day:
High
Low
These levels define market structure
Fetched using Daily timeframe regardless of chart timeframe
4️⃣ Positive Bias Condition (Bullish)
Bias becomes POSITIVE only when both conditions are true:
Today Close > Previous Day High
Today Low > Previous Day Low
📌 Indicates strong bullish control
5️⃣ Negative Bias Condition (Bearish)
Bias becomes NEGATIVE only when both conditions are true:
Today Close < Previous Day Low
Today High < Previous Day High
📌 Indicates strong bearish control
6️⃣ Bias Hold Rule (Most Important)
Bias does NOT flip frequently
Bias remains unchanged until:
Both opposite conditions are satisfied
Prevents false signals during sideways markets
Bias Values:
+1 → Positive
-1 → Negative
0 → Neutral
7️⃣ Bias Memory Concept
Bias is stored using a state variable
Previous bias is carried forward when no condition is met
Ensures stable trend direction

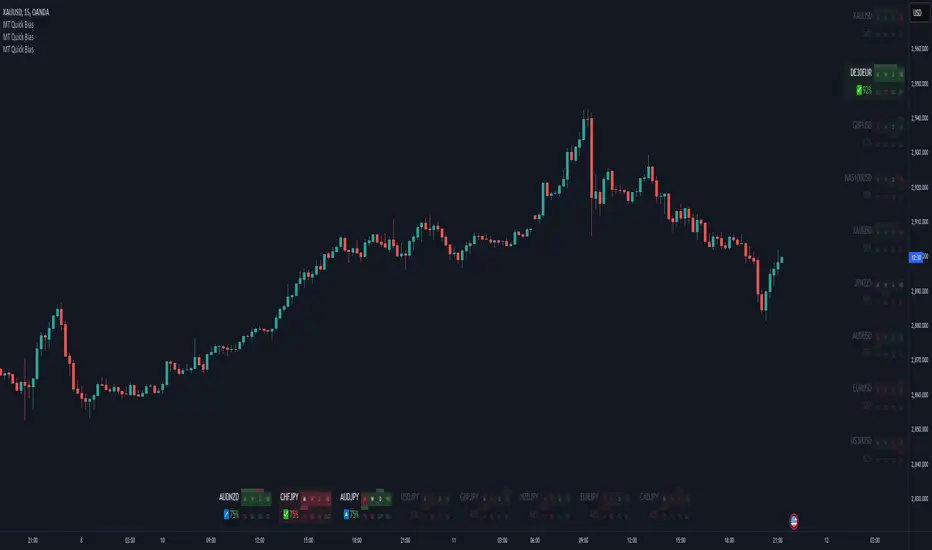
Momentum Theory Quick BiasMomentum Theory Quick Bias is a watchlist screener tool for rapid multi-timeframe analysis. It displays a variety of information from higher timeframes in order to set a directional bias including: breakout levels, peak levels, previous bar closes, and swing points.
✅ 8 Symbol Watchlist Scanner
✅ Quickly Set Directional Bias
✅ For Scalpers, Day Traders, and Swing Traders
--- 📷 INDICATOR GALLERY ---
--- 🚀 QUICK LOOK ---
✔ Multi-Timeframe Analysis
Displays various higher timeframe information in order to read how an asset is moving with one quick glance. Utilizes icons and colors that serve as visual cues.
--- ⚡ FEATURES ---
✔ Breakout Bias
Shows if the current price is above or below the breakout level on the timeframe.
✔ Peak Bias
Shows if the current previous peak has been triggered and where price is relative to it.
✔ Previous Bar Close
Shows how the previous bar closed and whether it's bullish or bearish.
Breakout
Fakeout
Inside
Outside
✔ Swing Point
Shows if the timeframe has currently flipped its breakout level.
✔ Bias Alignment
Shows visual icons if there is bias alignment between the timeframes.
↗️↘️ Breakout Bias Alignment
🔼🔽 Peak Bias Alignment
🔀 Breakout and Peak Bias Alignment, but opposite
✅ Breakout and Peak Bias Alignment
✔ Quick Analysis
Hover over the symbol name to view which timeframe levels are bullish or bearish and if peak levels have been triggered.
--- 🔥 OTHER FEATURES ---
✔ Built-In Presets
Create your own custom watchlist or use one of the built-in ones (using Oanda charts)
It's recommended to use the same source for all assets in your watchlist whenever possible
✔ Customized Layouts
Display the watchlist in a variety of different column arrangements.
✔ Dark and Light Modes
Adjustable theme colors to trade your chart the way you want.
✔ Plug-and-Play
Automatically changes the relevant levels depending on the viewed timeframe. Just fill in your watchlist, add it to your chart, and start trading!
Set the indicator to the following timeframes to view those arrangements:
Month Timeframe - Y / 6M / 3M / M
Week Timeframe - 6M / 3M / M / W
Day Timeframe - 3M / M / W / D
H4 Timeframe - Y / M / W / D
M15 Timeframe - M / W / D / H8
M10 Timeframe - M / W / D / H4
M5 Timeframe - W / D / H8 / H2
M3 Timeframe - W / D / H4 / H1
M2 Timeframe - D / H8 / H2 / M30
M1 Timeframe - D / H4 / H1 / M15
--- 📝 HOW TO USE ---
1) Create your watchlist or use one of the built-in presets and place it on the timeframe you want to see. If no watchlist is created, it automatically sets to the current asset.
2) Alignments will trigger in real-time and push to the top of the column.
It is recommended to place the indicator in a different chart window, so it won't have to refresh every time the asset or timeframe changes.
INDIVIDUAL ASSET BIAS DASHBOARD V3Strategy Name: Individual Asset Bias Dashboard V3
Author Concept: Multi-timeframe 3-pivot alignment bias monitor
Timeframe: Works on any chart, but bias is calculated on daily close vs higher timeframe pivots
Core Idea (3-Pivot Rule)
For each asset we compare the current daily closing level against three classic pivots from higher timeframes:
Previous Weekly pivot: (H+L+C)/3 of last completed week
Previous Monthly pivot: (H+L+C)/3 of last completed month
Previous 3-Monthly pivot: (H+L+C)/3 of last completed quarter
Bias Logic:
BULL → Price is above all three pivots
BEAR → Price is below all three pivots
MIXED → Price is in between (no clear alignment)
This is a clean, objective, and widely used institutional method to gauge short-term momentum alignment across multiple horizons.
Assets Tracke
SymbolMeaningSPX500S&P 500 IndexVIXVolatility IndexDXYUS Dollar IndexBTCUSDBitcoinXAUUSDGoldUSOILWTI Crude OilUS10Y10-Year US Treasury YieldUSDJPYJapanese Yen pair
Key Features
Real-time updating table in the bottom-left corner
Color coding: Lime = Bullish, Red = Bearish, Gray = Mixed
Optional "Change" column showing flips (▲/▼) when bias changes day-over-day
No repainting on closed daily bars (critical for reliability)
Compliant with TradingView rules (proper lookahead usage explained below)
Important Technical Notes (Why No Repainting)
lookahead = barmerge.lookahead_on is used only for higher-timeframe historical pivots → allowed and standard practice
Current price uses lookahead = barmerge.lookahead_off → reflects actual tradable daily close
Table only draws on barstate.islastconfirmedhistory or barstate.islast → prevents false signals on realtime bar
Limitations & Warnings
On intraday charts, the "current bias" updates with every tick using the running daily close
Bias can flip intraday before daily bar closes
On daily or higher charts, the dashboard is 100% confirmation-based and non-repainting
This is a bias filter, not a standalone trading system

Wick Bias - by TenAMTraderWick Bias - by TenAMTrader
Wick Bias helps traders quickly visualize market pressure by analyzing candle wicks and bodies over a user-defined number of bars. By comparing top and bottom wicks, the indicator identifies whether buying or selling pressure has been dominant, providing a clear Indicator Bias signal (Bullish, Bearish, or Neutral).
Key Features:
Shows Top Wicks %, Bottom Wicks %, and optional Body % for recent candles.
Highlights Indicator Bias to indicate short-term market trends.
Fully customizable colors for table rows and bias labels.
Option to show or hide body percentage.
Alerts trigger on bias flips, with optional on-chart labels.
Table can be placed in any chart corner.
Updates in real-time with each new bar.
Recommended Use:
Ideal for intraday and swing traders looking for a quick visual cue of short-term market momentum.
Can be combined with other technical analysis tools to confirm trade setups or potential reversals.
Disclaimer / Legal Notice:
This indicator is for educational and informational purposes only. It is not financial advice and should not be used as the sole basis for trading decisions. Past performance does not guarantee future results. Users are responsible for their own trades. The developer is not liable for any losses or damages resulting from the use of this indicator.

Institutional Orderflow Pro — VWAP, Delta, and Liquidity
Institutional Orderflow Pro is a next-generation order flow analysis indicator designed to help traders identify institutional participation, directional bias, and exhaustion zones in real time.
Unlike traditional volume-based indicators, it merges VWAP dynamics, cumulative delta, relative volume, and liquidity proximity into a single unified dashboard that updates tick-by-tick — without repainting.
The indicator is open-source, transparent, and educational. It aims to provide traders with a clearer read on who controls the market — buyers or sellers — and where liquidity lies.
The indicator combines multiple institutional-grade analytics into one framework:
RVOL (Relative Volume) = Compares current volume against the average of recent bars to identify strong institutional participation.
zΔ (Delta Z-Score) = Normalizes the buying/selling delta to reveal unusually aggressive market behavior.
CVDΔ (Cumulative Volume Delta Change) = Shows which side (buyers/sellers) is dominating this bar’s order flow.
VWAP Direction & Slope = Determines whether price is trading above/below VWAP and whether VWAP is trending or flat.
PD Distance (Prev Day Confluence) = Measures the current price’s distance from previous day’s high, low, close, and VWAP in ATR units — highlighting liquidity zones.
ABS/EXH Detection = Identifies institutional absorption and exhaustion patterns where momentum may reverse.
Bias Computation = Combines VWAP direction + slope to give a simplified regime signal: UP, DOWN, or FLAT.
All metrics are displayed through a color-coded, non-repainting HUD:
🟢 = bullish / favorable conditions
🔴 = bearish / weak conditions
⚫ = neutral / flat
🟡 = absorption (potential trap zone)
🟠 = exhaustion (momentum fading)
| Metric | Signal | Meaning |
| ---------------------- | ------- | ---------------------------------------------- |
| **RVOL ≥ 1.3** | 🟢 | High institutional activity — valid setup zone |
| **zΔ ≥ 1.2 / ≤ -1.2** | 🟢 / 🔴 | Unusual buy/sell aggression |
| **CVDΔ > 0** | 🟢 | Buyers dominate this bar |
| **VWAP dir ↑ / ↓** | 🟢 / 🔴 | Institutional bias long/short |
| **Slope ok = YES** | 🟢 | Trending market |
| **PD dist ≤ 0.35 ATR** | 🟢 | Near key liquidity zones |
| **Bias = UP/DOWN** | 🟢 / 🔴 | Trend-aligned environment |
| **ABS/EXH active** | 🟡 / 🟠 | Caution — possible reversal zone |
How to Use
Confirm Volume Context → RVOL > 1.2
Align with Bias → Take longs only when Bias = UP, shorts only when Bias = DOWN.
Check Slope and VWAP Dir → Ensure trending context (Slope = YES).
Confirm CVD and zΔ → Flow should agree with price direction.
Avoid ABS/EXH Triggers → These signal exhaustion or absorption by large players.
Enter Near PD Zones → Ideal trade zones are within 0.35 ATR of prior-day levels.
This multi-factor confirmation reduces noise and focuses only on high-probability institutional setups.
Originality
This script was written from scratch in Pine v6.
It does not reuse existing public indicators except for standard built-ins (ta.vwap, ta.atr, etc.).
The unique combination of delta z-scoring, VWAP slope filtering, and real-time confluence zones distinguishes it from typical orderflow tools or cumulative delta overlays.
The core innovation is its merged real-time HUD that integrates institutional metrics and natural-language feedback directly on the chart, allowing traders to read market context intuitively rather than decode multiple subplots.
Notes & Disclaimers
This indicator does not repaint.
It’s intended for educational and analytical purposes only — not as financial advice or a guaranteed signal system.
Works best on liquid instruments (Futures, Indices, FX majors).
Avoid non-standard chart types (Heikin Ashi, Renko, etc.) for accurate readings.
Open-source, modifiable, and compatible with Pine v6.
Recommended Use
Apply it with clean charts and standard candles for the best clarity.
Use alongside a basic structure or volume profile to contextualize institutional bias zones.
Author: Dhawal Ranka
Category - Orderflow / VWAP / Institutional Analysis
Version: Pine Script™ v6
License: Open Source (Educational Use)

Mara JPY Bias ProMara JPY Bias Pro™ is a precision tool built for serious traders who focus on JPY and USD pairs.
This synthetic index combines USDJPY + EURJPY + GBPJPY, generating a smooth and dynamic representation of JPY strength or weakness. When the line turns green, JPY is weakening — time to look for LONG setups on XXX/JPY pairs. When red, JPY is strengthening — ideal moment for SHORT trades.
Built-in bias logic with adjustable MA-based trend detection or slope/momentum view lets you customize signals based on your strategy.
Plus, we’ve included a normalized DXY overlay, so you can track USD strength in parallel — perfect for traders working with EUR/USD, GBP/USD, USD/JPY and JPY crosses.
💡 Designed for day traders, scalpers, and smart money traders looking for clean confluence.
✅ Features:
Visual color-coded JPY bias (Green = Long / Red = Short)
Optional USD (DXY) strength overlay
Customizable MA length and bias logic
Built-in alerts for bias shifts & momentum flips
🔔 Alert-ready – never miss a reversal.
Trade smarter. Cut the noise. Stay on the right side of the move.

Trend Blend
Trend blend is my new indicator. I use it to identify my bias when trading and filter out fake setups that are going in the wrong direction.
Trend blend utilises the 9 EMA (Red), 21 EMA (Black), and if you trade futures or Bitcoin, you can also use the VWAP (Blue).
There is also a table at the top right that displays the chart time frame bias
I prefer to use the 1-hour time frame for bias and execute the trades on 5-minute charts, mainly, and sometimes on the 1-minute for a smaller stoploss.
Here's an example of the trade I took during the London session on XAU/USD
1 hour bias was Bearish
Price broke out of the range
I waited for the London session to open, where I ended up taking a short on the 5-minute time frame as we broke out of the pre-London range
Entry was at the Fair Value Gap (5-minute bias was also Bearish as price traded into the FVG)
Stoploss was at the last high
Take Profit was the next major support level
Another set that I like to trade with the Trend blend is when price is trending bullish and price trades inside the 9 and 21 EMA, and there is a bullish candle closer above the 9 EMA with Stoploss below the low of the bullish candle and Take profit between 1-2 Risk to Reward
Same when there's a bearish trend, I wait for price to trade inside the 9 and 21 EMA, and I'll take sells when a bearish candle closes below the 9 EMA.
This setup works best in strong trends, or it can be used to enter a trade on a pullback or to scale into an existing trade.

24/9 EMA with Bias & SignalsThis is a simple indicator that plots the 24 & 9 EMAs.
It also highlights the potential bias of the market (bull or bear) based on if the 9 EMA is above or below the 24 EMA.
In addition there are signal crosses that you can use for alerts.
This indicator is best used to confirm a particular underlying bias on the 5m, 15M, 1HR, 4HR, and Daily timeframes.
It's important to note on lower timeframes that the bias can be counter trend bias of the overall larger momentum of the instrument you are trading.
For clarity this means that many retraces get going when the 9 crosses the 24. But ultimately the larger timeframe bias will continue after this counter trend retraces.
Combining this indicator with value channels and ATR is what I recommend.

Daily Candle Bias Backtesting Stats @MaxMaserati This indicator, is a powerful backtesting and probability tool designed to quantify the "follow-through" of specific candle types across different market sessions.
It identifies specific price action setups and tracks whether price hits a "Target" (continuation) or an "Invalidation" (reversal) first, providing real-time win rates for your favorite sessions.
The Candle Bias Stats indicator automatically categorizes every candle based on the MMM candle bias and tracks their historical success rate. It calculates how often a candle's high/low is broken before its opposite end is touched. By breaking this data down into sessions (Asian, London, NY), it identifies high-probability "time-of-day" windows where specific price action setups are most reliable.
MMM CANDLE LOGIC
Bullish Expansion & Breakout Signatures
Bullish Body Close Plus (BuBC Plus): Represents strong bullish momentum where price closes above the previous high and near its own top, signaling that buyers are in complete control.
Bullish Body Close Minus (BuBC Minus): Indicates weak bullish momentum; while the price closes above the previous high, a long top wick shows sellers pushed back, suggesting a potential retest of the previous high.
Bearish Expansion & Breakout Signatures
Bearish Body Close Plus (BeBC Plus): A very strong bearish signal where price closes below the previous low and near its own bottom, indicating sellers are dominant.
Bearish Body Close Minus (BeBC Minus): Signifies weak bearish momentum; the price breaks the previous low but finishes with a long bottom wick as buyers push back, often leading to a retest of the old ceiling.
Bullish Reversal & Trap Signatures (Affinity)
Bullish Affinity Plus (BuAF Plus): A strong bullish reversal where a new low is made, but sellers hit a wall and get trapped, causing price to finish near its top with a long bottom wick.
Bullish Affinity Minus (BuAF Minus): A weak bullish bounce where a new low is made and price finishes back inside the previous range, but buyers lack the energy for a significant move.
Bearish Reversal & Trap Signatures (Affinity)
Bearish Affinity Plus (BeAF Plus): A strong bearish reversal; buyers are trapped after making a new high, and price finishes near its bottom with a long top wick.
Bearish Affinity Minus (BeAF Minus): A weak bearish drop where sellers stop the rise but lack the energy to push price significantly lower.
Neutral & Volatility Signatures
Close Inside Bullish (CI•BuAF): Bullish neutral state where price stays inside the previous candle’s range but finishes in the top half, indicating buyers are slightly more active.
Close Inside Bearish (CI•BeAF): Bearish neutral state where price remains inside the previous box and finishes in the bottom half.
Seek & Destroy Bullish (S&D•BuAF): Bullish volatility characterized by price moving above and below the previous candle before buyers win the battle and close price near the top.
Seek & Destroy Bearish (S&D•BeAF): Bearish volatility where sellers win a high-chaos battle, closing price near the bottom after sweeping both sides of the previous candle.
H4 CANDLE EXAMPLE
Deep Dive: Analysis of the 4H Statistics
The image presents a comprehensive backtest of 4,999 total candles from September 2022 to December 2025. Here is the breakdown of what the interface is telling us:
1. The Strategy: Target vs. Invalidation
The indicator tracks BuBC (Bullish Body Close) and BeBC (Bearish Body Close).
The Target: For a Bullish candle, the target is the High. For a Bearish candle, it is the Low.
The Invalidation: The opposite end of the candle (the Low for Bullish, the High for Bearish).
The Goal: To see which level is touched first in the subsequent bars.
2. Global Performance (The Top Right Table)
Looking at the BuBC (1402 samples) section:
Target First (67.8%): In nearly 7 out of 10 cases, once a 4H candle closes "bullish" (breaking the previous high), the price continues higher to break its own high before it ever returns to take out its own low.
Both Hit (17.7%): This is a critical metric. It represents "Stop Runs" or "Wicks" where price hits the target but also hits the invalidation within the same tracking period.
Efficiency (1.3 Bars): This tells us the "follow-through" is almost immediate. If the trade doesn't work within 1 or 2 candles, the statistical edge drops off significantly.
3. The Session Breakdown (The Bottom Left Table)
This is where the "Edge" is found. Not all hours of the day are created equal.
Asian Late (02:00-06:00) – The "Star" Performer: With a 72.9% Target rate, this is labeled "BEST." It has the lowest "Both%" (6.5%), meaning moves during these hours are incredibly "clean." If a setup forms here, price usually moves directly to the target without looking back.
London Open & Overlap (06:00-14:00): These sessions maintain a high win rate (approx. 70%). This suggests that the European session provides reliable trend continuation for the S&P 500.
NY Session (14:00-18:00) – The "Trap" Zone: This is labeled "WORST" for a reason. While the win rate is basically a coin flip (49.6%), the Both% spikes to 36.7%. This means that even if you are right about the direction, the market is highly likely to "sweep" your stop loss before going to the target. It is the most volatile and "fake-out" prone time for this specific setup.
Summary of the Data
The statistics show that the S&P 500 4H Candle Bias is a highly reliable trend-following indicator, provided you trade it at the right time.
The data suggests a clear three-step logic:
Directional Edge: Both Bullish and Bearish body closes have a natural ~67% probability of continuation.
Timing is Everything: Trading during the Late Asian and London sessions increases your probability of success to over 70% with very low risk of a "fake-out."
Risk Warning: Avoid "Body Close" breakout strategies during the NY Mid-day (14:00-18:00). The statistics prove that this window is dominated by "Seek and Destroy" price action, where price is mathematically likely to hit both your target and your stop, usually hitting the stop first.

Triple 9 Bias filter Triple 9 Bias – Precision Multi-Timeframe Directional Filter
Technical Overview
The Triple 9 Bias is a precision multi-timeframe directional filter built exclusively for 5-minute (and lower) trading.
It stacks three EMA-9 trend directions (4H + 1H + 15m) as Primary confluence and uses only the 4H RSI-14 as Secondary confirmation.
Integrity Check: Zero repaint · Zero lookahead · Works identically on any chart timeframe.
The Trading Rule (Simple)
Long Trades: Only trade longs when all three EMA-9s are UP + 4H RSI > 50
Short Trades: Only trade shorts when all three EMA-9s are DOWN + 4H RSI < 50
Otherwise — stand aside.
Display Components
A. Plotted Higher-Timeframe EMAs (No Repainting)
All values are pulled from closed higher-timeframe bars.
4H EMA 9 (Red step-line)
1H EMA 9 (Purple step-line)
15m EMA 9 (Orange step-line)
B. Locked Dashboard (Bottom-Right)
Clean table split into Primary and Secondary sections for instant bias reading.
Colour Logic:
🟢 Lime = UP / BUY
🔴 Red = DOWN / SELL
Background Logic:
Full Green: Only when all three EMA-9s are UP
Full Red: Only when all three EMA-9s are DOWN
Gray: Otherwise = no trade
Indicator Breakdown
3.1. Primary Confluence – EMA 9 Slope
4H EMA 9 direction (compared 10 bars back)
1H EMA 9 direction (compared 6 bars back)
15m EMA 9 direction (compared 6 bars back)
3.2. Secondary Confluence
4H RSI-14 vs 50 level (BUY if >50, SELL if <50)
High-Probability Signal: When Primary = all three “UP” and Secondary = “BUY” → highest-probability bullish bias (and vice-versa for bearish).

HTF BIAS FILTER🧭HTF Bias Filter Indicator: 5 in 1 indicator
Technical Overview
The Bias Filter is a comprehensive multi-timeframe tool designed to confirm directional bias using five key indicators before entering a trade. It plots higher-timeframe Moving Averages directly on the chart and provides an immediate status summary via a static dashboard.
The more confluence on the dashboard, the greater the probability of the direction of the trade.
1. 📊 Display Components
A. Plotted Lines
The indicator uses the request.security function to draw Moving Averages from higher timeframes onto your current chart:
1H EMA 21 (Purple): The 21-period Exponential Moving Average calculated on the 1-Hour (60 min) chart. Plotted using a step-line style.
4H EMA 50 (Red): The 50-period Exponential Moving Average calculated on the 4-Hour (240 min) chart. Plotted using a step-line style.
B. Directional Dashboard
A fixed-position summary table is anchored to the bottom-right corner of the chart, providing a quick glance at the current status of all five filters.
2. 🎨 Colour Logic
Each of the five indicators is assigned a colour based on its current directional signal. The more indicators that show the same colour (confluence), the stronger the signal and the higher the likelihood of a high-probability trade.
🟢 Green indicators are signaling UP/BUY (Bullish momentum or trend).
🔴 Red indicators are signaling DOWN/SELL (Bearish momentum or trend).
⚫ Gray indicators are signaling Mixed or flat directions (neutral or undecided).
Note: The dashboard's main header color is determined by a strict confluence logic (All four 4H filters must align for Green/Red), while individual indicator colors follow the simple rules above.
3. 📋 Indicator Breakdown and Logic
The dashboard provides the direction of five different filters.
3.1. Higher-Timeframe (HTF) Trend Indicators
These two signals determine the immediate slope and direction of the primary Moving Averages:
4H EMA 50:
Timeframe: 4-Hour (240 min)
Logic: Compares the current EMA value to the value two bars ago on the 4H chart.
Output: UP ↑, DOWN ↓, or FLAT ⏸
1H EMA 21:
Timeframe: 1-Hour (60 min)
Logic: Compares the current EMA value to the value two bars ago on the 1H chart.
Output: UP ↑, DOWN ↓, or FLAT ⏸
3.2. 4-Hour Confluence Filters
These three indicators provide supplementary confirmation on Volume, Price Position, and Momentum, all calculated on the 4-Hour (240 min) chart:
4H OBV (Smoothed):
Timeframe: 4-Hour (240 min)
Logic: Direction is based on the current value of the 21-bar smoothed On-Balance Volume (OBV) compared to its value nine bars ago.
Output: UP ↑, DOWN ↓, or FLAT ⏸
4H ATR DIR (EMA Proxy):
Timeframe: 4-Hour (240 min)
Logic: Determines the price position by comparing the current Close price against the 4H EMA 50.
Output: BUY 🟢 (Close > EMA 50), SELL 🔴 (Close < EMA 50), or FLAT ⏸️ (Close = EMA 50).
4H RSI (14):
Timeframe: 4-Hour (240 min)
Logic: Momentum check comparing the 14-period Relative Strength Index (RSI) value against the 50 level.
Output: BUY 🟢 (RSI > 50), SELL 🔴 (RSI < 50), or FLAT ⏸️ (RSI = 50).

Aggression Bulbs v3.1 (Sessions + Bias, fixed)EYLONAggression Bulbs v3.2 (Sessions + Bias + Volume Surge)
This indicator highlights aggressive buy and sell activity during the London and New York sessions, using volume spikes and candle body dominance to detect institutional momentum.
⚙️ Main Logic
Compares each candle’s volume vs average volume (Volume Surge).
Checks body size vs full candle range to detect strong directional moves.
Uses an EMA bias filter to align signals with the current trend.
Displays green bubbles for aggressive buyers and red bubbles for aggressive sellers.
🕐 Sessions
London: 08:00–12:59 UTC+1
New York: 14:00–18:59 UTC+1
(Backgrounds: Yellow = London, Orange = New York)
📊 How to Read
🟢 Green bubble below bar → Aggressive BUY candle (strong demand).
🔴 Red bubble above bar → Aggressive SELL candle (strong supply).
Bubble size = relative strength (volume × candle dominance).
Use in confluence with key POI zones, volume profile, or delta clusters.
⚠️ Tips
Use on 1m–15m charts for scalping or intraday analysis.
Combine with your session bias or FVG zones for higher accuracy.
Set alerts when score ≥ threshold to catch early momentum.

NS ND - EVR - Daily Bias - TRFxVolume & Price Action Signals
What It Does
Combines three proven trading methodologies: Effort vs Result (EVR), No Supply/No Demand (NS/ND), and Daily Bias tracking for intraday traders.
Features
Effort vs Result (EVR)
- **Bullish**: Green triangle below bar when price sweeps previous low with high volume and significant wick
- **Bearish**: Red triangle above bar when price sweeps previous high with high volume and significant wick
- Identifies potential reversals where volume doesn't match price movement
No Supply / No Demand (NS/ND)
- **No Demand (Red dot)**: Up-candle with declining volume - buyers weakening
- **No Supply (Green dot)**: Down-candle with declining volume - sellers weakening
- Grey dots = unconfirmed, colored dots = confirmed within lookahead period
- Based on Volume Spread Analysis (VSA) principles
Daily Bias Label
Top-right corner shows market direction:
- **BULLISH ↑** - Closed above Previous Day High
- **BEARISH ↓** - Closed below Previous Day Low
- **BULLISH/BEARISH REV** - Swept level but closed back inside
- **RANGE ↔** - Trading between PDH/PDL
## Settings
- **EVR**: Toggle on/off, volume multiplier, wick %, inside bars, transparency
- **NS/ND**: Toggle on/off, lookahead bars (default: 10)
- **Daily Bias**: Toggle label display
## Best For
✓ Intraday trading (1m-1h timeframes)
✓ Reversal setups
✓ Volume analysis
✓ Confluence trading (all signals align)
How to Use
1. Enable components you want (all can be toggled independently)
2. Trade EVR signals in direction of Daily Bias
3. Look for NS/ND confirmation at key levels
4. Wait for colored dots (confirmed signals) over grey (unconfirmed)
**Note**: Works on intraday timeframes only. NS/ND signals may repaint during confirmation period.

HTF Bias Signals (Daily EMA Bias + LTF EMA Cross)clean, flexible indicator (Pine v5). It defines higher-timeframe (HTF) bias from Daily and/or Weekly EMAs, then only fires entries on your chart’s timeframe when that bias agrees with a simple fast/slow EMA trigger. It also includes alertconditions so you can automate alerts.

Sentiment Bias Gauge📌 Overview
The Sentiment Bias Gauge (SBG) is a unique overlay-style indicator that visually maps a sentiment value—such as market bullishness or bearishness—onto your price chart. It converts sentiment data (in this case, RSI-based) into a floating line that moves between defined price zones, allowing users to quickly understand the current market mood in the context of price.
⚙️ How It Works
• The indicator uses RSI (Relative Strength Index) as a proxy for market sentiment (0 to 100 scale).
• This sentiment value is then mapped to a vertical price range on your chart using a configurable zone (via top and bottom percent of chart range).
• The line floats up or down within the price chart, reflecting how bullish or bearish the sentiment is.
• It includes background shading to represent the sentiment level:
• 🔴 Red (Bearish): sentiment < 30
• 🟡 Yellow (Neutral): 30 ≤ sentiment ≤ 70
• 🟢 Green (Bullish): sentiment > 70
• A floating label shows the current sentiment score.
🌟 Key Features
• 📈 Overlay-Based Sentiment Line: Plots sentiment as a price-level line, giving intuitive spatial reference.
• 🔧 Configurable Range Placement: Adjust where the sentiment line appears within the chart’s high-low range.
• 🖌️ Color-Coded Background: Visually distinguish bullish, bearish, and neutral conditions.
• 🏷️ Real-Time Sentiment Label: Displays updated sentiment score on the most recent bar.
🧠 How to Use
• Use this indicator alongside your price action or technical strategy to gauge market mood.
• Combine with other sentiment indicators (e.g., fear/greed, delta volume, news sentiment).
• Especially helpful in sideways markets to identify potential shifts in bias before price reacts.
Why This Combination?
• RSI offers a reliable and intuitive proxy for market sentiment.
• Mapping the value directly onto the chart helps avoid constantly looking at a separate panel.
• The customizable chart range lets traders fit sentiment visuals within any market structure.
🎯 Why It’s Worth Using
• Makes sentiment visually accessible directly on the chart.
• Helps detect bullish/bearish bias shifts earlier than traditional indicators.
• A great tool for sentiment-aware discretionary trading or contextual overlays in algo strategies.
