Crypto Indicators #u9tusA set of low timeframe (LTF), medium timeframe (MTF), and high timeframe (HTF) indicators for use in crypto currencies / bitcoin.
Traditionally the 10, 20, 50, 100, and 200 SMAs are used in TA. With cryptos, I've found that the 8 EMA, 21, 55, and 128 SMAs backtest better, while no change in length was necessary for the 200. I wanted to combine all these into one indicator to easily add them to a chart layout, hence this script.
You can customize the length of each MA to your liking in the settings, or accept the defaults.
LTF Indicators:
8 EMA in blue hues, medium line stroke.
MTF Indicators:
21, 55 SMA in purple hues, medium line stroke.
HTF Indicators:
128, 200 SMA in yellow hues, thick line stroke.
Defaults are for daily timeframes and lower; suggest changing up the intervals for weekly and monthly to:
21 -> 30
55 -> 50
128 -> 100
$BTC, $ETH, #ALTS
twitter.com
(c) @jhaurawachsman 20190515
Search in scripts for "bitcoin"

Stock to Flowthis study gives the option to plot the stock to flow
OR the number of blocks per month. (you must edit the code by deleting the //)
it should be used only on the monthly timeframe
idea credited to:
medium.com

200/150
This a variation to my 120/60 Trend Model for the daily chart on Bitcoin, which has quite reliably been determining the over all trend as well as low risk entries within a longer term trend. It's a combination of 150 & 220 SMA, used on the 1D chart. Once price closes below both SMAs trend is an early bearish signal, while the SMAs flipping to red is later but more reliable bearish signal. For bullish trend it is the same thing just the opposite. Once the "cloud" switches red trend is bearish while once it switches green it's bullish.
Bitcoin tends to get rejected by the cloud during bullish and bearish trends. Once Bitcoin pushes through the cloud the trend will typically reverse.
Bitcoin trading within or close to the cloud is generally a good long or short entries, depending on the color of the cloud (red: short & green: long).

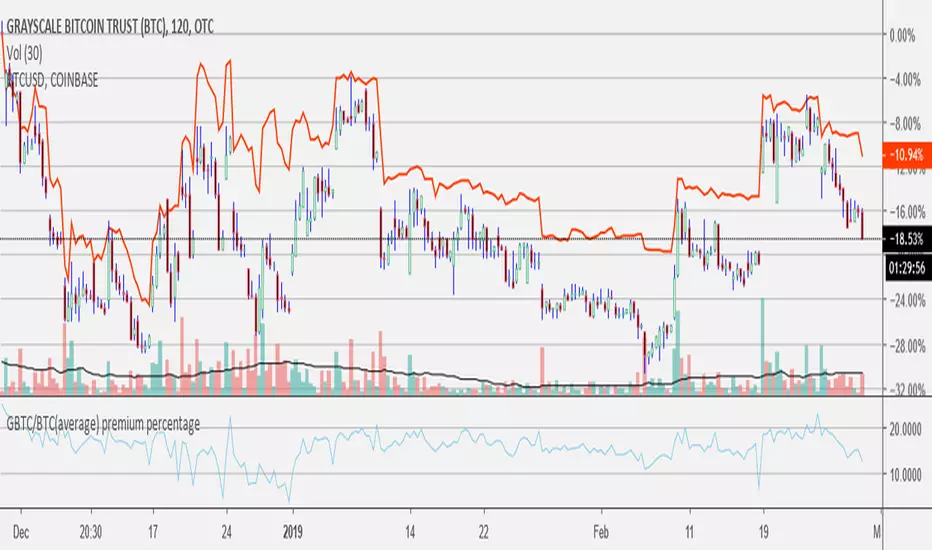
GBTC/BTC(average) premium percentageI updated the GBTC premium percentage indicator to the average bitcoin price (average between bitfinex, coinbase, bitstamp, bittrex, and gemini). I also left this new script open so you can update the amount of bitcoin per share because it is always changing. you can find the amount of bitcoin per share at grayscale.co half way down on the left.
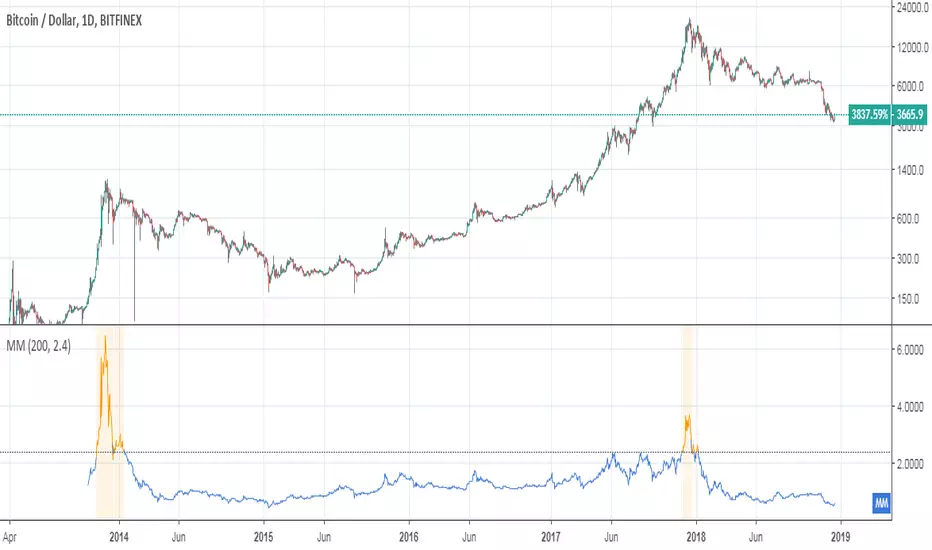
Mayer MultipleThis indicator was created by Trace Mayer as a way to analyze the price of Bitcoin in a historical context. Consider it as a kind of Volatility Ratio that was created by Jack Schwager for the securities.
To learn more about Mayer Multiple see:
charts.woobull.com
mayermultiple.info
www.theinvestorspodcast.com
Good luck!
RSI Cross by uykusuzpenguenRSI Cross Explanation;
It's simple,
When short-term RSI crossover long-term RSI ; BUY ( Green Area )
When short-term RSI crossunder long-term RSI ; SELL ( Red Area )
You can change RSI lenghts or moving average lenght on settings.
If you knew that, you would sell all your bitcoins at a price of $13.500 and not look back on 8th January.
Happy trading.

Mayer Multiple @ Current PriceThough this script is by me, the original idea comes from a podcast I heard where Trace Mayer talks about how he does crypto valuation. It is based on current price against the 200 day moving average. This indicator script will simply plot that value as a label overlayed on your trading view chart. Best long term results occur when acquiring BTC when the multiple is 2.4 or less. For more info, google "mayer multiple" This script/indicator is strictly for educational purposes. It is not exclusive to bitcoin.
To get the best look out of your charts I make the following changes.
1.Apply the indicator to your chart.
2. In the tools palette of trading view, when looking at a chart, click "Show Objects Tree" the icon displayed above the trash can.
In the objects tree panel, click the preferences icon for "Mayer Multiple @ Current Price"
Switch "scale" to "scale Left"
3. Then for your chart preferences (right click on chart background and select "Properties", and be sure the following are checked on the "Scales" tab
Left Axis
Right Axis
Indicator Last Value
Indicator Labels
Screenshots are not allowed in this view, so I can't post screenshots, but the view above is what it should look like when you are done.
For anyone who wants to see the code, here is the code of the script:
Use at will, and at your own risk.
//@version=3
// Created By Timothy Luce, inspired by Trace Mayer's 200 Day SMA cryptocurrency valuation method
study("Mayer Multiple @ Current Price", overlay=true)
currentPrice = close
currentDay = security(tickerid, "D", sma(close, 200))
mayerMultiple = currentPrice/currentDay
plot(mayerMultiple, color=#00ffaa, transp=100)
If you want to change the color, change this line: #00ffaa

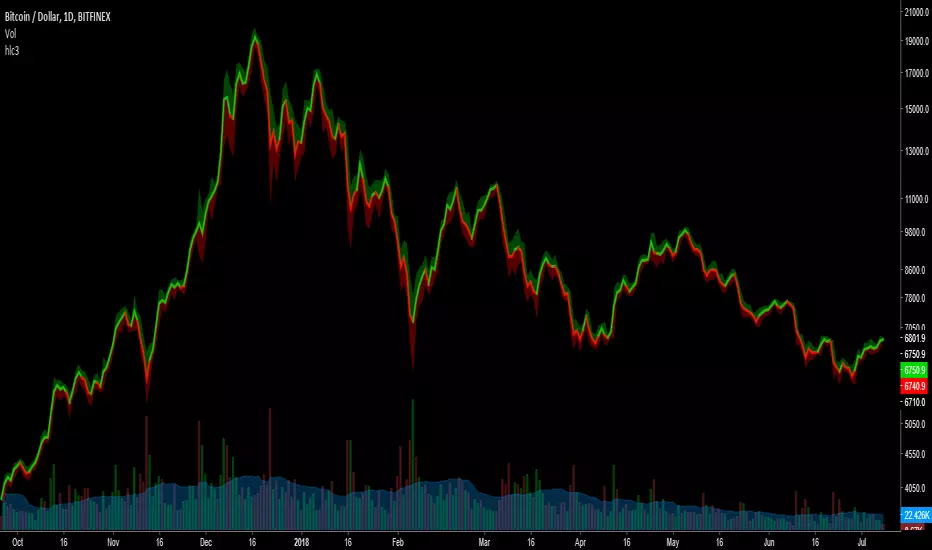
HLC3This is a script I wrote years ago. Some people prefer a line instead of candles, the standard tradingview line is too simple, so I copied the line from bitcoinity.org. I added heiken ashi colors to it as well. If you don't want that you can configure that in the options, you get a yellow line instead. You can also configure the source there, you do not have to use hlc3.
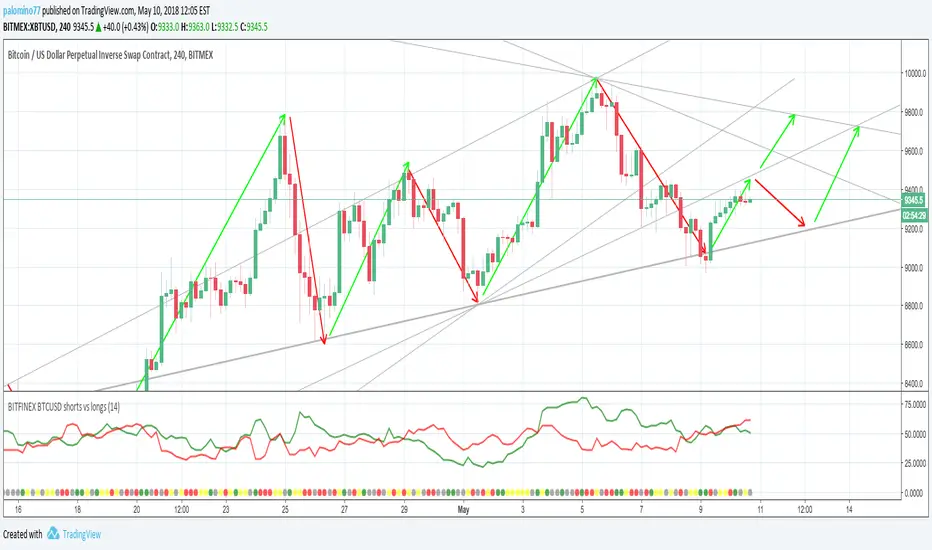
BITFINEX BTCUSD shorts vs longsA simple script to get an RSI of BTCUSD SHORTS and LONGS on Bitfinex.
(Forked from an open sourced script)
Moving Average Price MultipleAuthor: Preston Pysh & Trace Mayer
Visit www.MayerMultiple.com to see current charts & explanation
Listen to Preston's Podcast: www.theinvestorspodcast.com
Follow Preston on Twitter: twitter.com
This indicator calculate the Price Multiple from Current Close Price vs 200 Day Moving Average.
Based on Preston's article:
+ The average Mayer Multiple is 1.44 for the history of Bitcoin.
+ Safe Buying Threshold is 2.4

rem sim v0.1every alt-coin has similarity.
cause of bitcoin.
always i want to delete that similarity and read the true(?) value of each coin.
and i made some script for that, but not good enough.
this one is different.
Rem Sim (rs) removes the similarity very effectively.
it make avg WaveTrend from nxt, strat, steem, ...
and that is the similarity
and it show true(?) WaveTrend without similarity.
so if the alt-coin move like other alt-coin, the WT almost 0.
sorry my bad english.
if you dont understand my english. just look at that chart.
also you can see source code.
--------
대부분의 알트가 어느정도 비슷한 차트를 가지는데, 그 유사성을 제거하면 어떤 모양인지 궁금해서 만들었어요.
전에 만들었던 비트코인의 영향력을 제거해주는 아이디어는 실제론 별 효용이 없는데 이건 좀 쓸만해보이네요.
웨이브트렌드의 모양으로 보여줍니다.

UCS Squeeze Momentum Overlay with AlertsAll credit to the great ucsgears. His original indicator is on this page:
I just remixed the visuals and added alerts when price is released from the squeeze. I find it works well on lower timeframes for Forex and Bitcoin. Suggestions for other instruments and timeframes are welcome! When adding alerts use 'On Condition' to get the fastest alerts.
Best used in conjunction with the USC_SQZ_Opt Ooscillator from this page:
Possibly useful tip: the squeeze code here is great for identifying ranging markets, and can be used with other indicators to stop alerts firing in choppy markets.


MAGNUS® CyclesThis indicator will help you if you struggle making any profit in bitcoin.
It generates very few signals with very nice profit potential ( around 100% this year ! ).
Perfect tool for longterm swing traders and new traders that need help figuring out the midterm trend.
Use it with these parameters only:
weekly: 13, 5, 12
daily: 92, 21, 96

BTC Swing Plan Levels & ZonesThis indicator visualizes a clean, rules-based Bitcoin swing-trade plan with clearly defined entry, target, and risk zones.
🔹 What it shows
• Breakout Entry Level
• Multiple Profit Target Zones (T1 → T4)
• Primary & Hard Stop Risk Zone
• Mid-levels for structure awareness
• Optional background highlight when price is above the breakout (plan active)
All levels are fully editable from the settings panel, allowing you to adapt the framework to any BTC market regime or timeframe.
🔹 How to use
Wait for price to break and hold above the Entry level
Manage the trade target-by-target
Respect the defined stop zone for risk control
Stretch target (T4) is optional and meant for strong trend continuation
🔹 Designed for
• Swing traders
• Structure-based traders
• Risk-managed BTC positioning
• Clean chart layouts (no indicators, no noise)
This tool is not a signal generator — it is a visual trade-planning framework.
Always manage position size and risk responsibly.

BTC vs GOLD Macro RotationBTC vs GOLD Macro Rotation Indicator
BTC vs GOLD Macro Rotation Model
This indicator is a macroeconomic rotation model that compares the relative attractiveness of Bitcoin (BTC) versus Gold (GOLD) based on multiple fundamental macro factors.
How does it work?
The model analyzes weekly data from various macroeconomic indicators and generates a score for each asset. The taller bar indicates the preferred asset to rotate capital into.
- Green bars (above zero): BTC strength
- Yellow bars (below zero):GOLD strength
- Info table:Shows exact percentages and rotation recommendation
Macroeconomic Factors Analyzed:
1. DXY (US Dollar Index)
- Strong dollar → Favors GOLD
- Weak dollar → Favors BTC
2. Oil (WTI Crude)
- Oil rising → Favors GOLD
- Oil falling → Favors BTC
3. Copper
- Copper rising → Favors BTC (risk-on)
- Copper falling → Favors GOLD (risk-off)
4. Real Rates (Fed Funds - YoY Inflation)
- Real rates falling → Favors GOLD
- Real rates rising → Favors BTC
5. Fertilizer/Natural Gas Regime (Urea, Ammonia, Natural Gas)**
- Specific combinations of movements in these commodities generate inflationary/deflationary regime signals
Fertilizer Rules:**
| Urea | Ammonia | Gas | Signal |
|------|---------|-----|--------|
| ↑ | ↑ | ↓ | GOLD +2 |
| ↑ | ↑ | ↑ | GOLD +3, BTC -1 |
| ↓ | ↓ | ↓ | BTC +3, GOLD -1 |
| ↑ | ↓ | ↓ | BTC +3 |
| ↓ | ↑ | ↑ | GOLD +3, BTC -1 |
Technical Features:
- Operates on weekly timeframe regardless of chart
- Normalized changes for signal stability
- Configurable EMA smoothing
- Safe handling of invalid symbols (won't break if a ticker doesn't exist)
- All tickers are user-editable
Configurable Inputs:
- Symbols for all assets (BTC, GOLD, DXY, Oil, Copper, CPI, Fed Funds, Gas, Urea, Ammonia)
- Individual weights for each macro component
- Normalization length
- EMA smoothing
Interpretation:**
- **BTC dominant (taller green):** Macro conditions favor risk/digital assets
- **GOLD dominant (taller yellow):** Macro conditions favor safe-haven/tangible assets
This indicator is for educational and informational purposes only. It does not constitute financial advice. Always do your own research before making investment decisions.
Recommended Timeframe: Weekly (W) or Daily (D)

Anchored VWAP PercentageINDICATOR: ANCHORED VWAP PERCENTAGE (AVWAP)
1. Overview
The Anchored VWAP Percentage (AVWAP) is a quantitative momentum and mean-reversion tool. It measures the percentage distance between the current price and a Volume Weighted Average Price (VWAP) that resets automatically based on specific time cycles. It allows traders to identify overextended market conditions relative to institutional value.
---
2. Core Logic & Calculation
The script tracks the relationship between price and volume starting from a specific Anchor Point .
* Volume-Weighted Foundation: Unlike simple moving averages, this indicator uses the VWAP formula: sum(Volume * Price) / sum(Volume) .
* Automatic Anchoring: The starting point (Anchor) resets automatically depending on the chart timeframe (e.g., resets weekly on a 15m chart, or yearly on a Daily chart).
* Percentage Deviation: It calculates the precise gap between the price and the VWAP, plotted as an oscillator: ((Price - VWAP) / VWAP) * 100 .
---
3. Adaptive Intelligence (Multi-Asset & Multi-TF)
The AVWAP is built with an internal database of 85th Percentile (P85) volatility thresholds. It recognizes that different assets have different "stretching" limits:
1. Asset-Specific Calibration: It includes optimized data for Bitcoin, Ethereum, Altcoins, Forex, and Indices .
2. Dynamic Timeframe Mapping: The anchor period and the exhaustion thresholds adjust automatically. For example:
* Intraday (1m-5m): Anchors to an 8-hour (480 min) cycle.
* Mid-Term (15m-60m): Anchors to a Weekly (W) cycle.
* Swing (Daily): Anchors to a Yearly (12M) cycle.
---
4. Visual Anatomy
The indicator is designed for high-speed decision-making:
* The Histogram:
* Green: Price is trading above the VWAP (Bullish premium).
* Red: Price is trading below the VWAP (Bearish discount).
* P85 Threshold Lines:
* These lines represent the 85th percentile of historical deviations . Historically, the price stays within these boundaries 85% of the time.
* Background Highlighting: When the histogram crosses the P85 line, the background glows, signaling a Statistical Exhaustion Zone where a retracement to the mean is highly probable.
---
5. How to Trade with AVWAP
* Mean Reversion: When the histogram reaches the P85 Zone , the price is "statistically overextended." This is a prime area to look for reversals or to take profits on existing trends.
* Trend Strength: If the histogram stays near the Zero Line while the price moves, the trend is supported by healthy volume.
* Value Area: The Zero Line represents the Fair Value . Buying near the Zero Line during a bullish histogram (Green) offers a high-probability entry with low risk.
---
6. Technical Parameters
* Asset Selection: A dropdown to switch between Crypto, Forex, and Indices.
* Color Customization: User-defined colors for bullish and bearish sentiment.
* Precision Control: 4-decimal precision for accurate tracking of thin-margin assets like Forex.

BTC/Gold Breakout LevelScript to show the price Bitcoin would have to reach to break out against the December 2024 BTC/GOLD top of $41.

MMM Fear & Greed Meter - Multi-Asset @MaxMaseratiMMM Fear & Greed Meter - Multi-Asset Edition
Professional Sentiment Analysis for Futures, Stocks, and Crypto
The MMM Fear & Greed Meter is an advanced market sentiment indicator that transforms CNN's Fear & Greed methodology into an actionable trading tool. Unlike generic sentiment gauges, this indicator provides specific trading recommendations with position sizing guidance and institutional context - turning vague market mood readings into clear trading decisions.
🎯 Three Optimized Market Modes
FUTURES (ES/NQ) MODE - Default configuration weighted for index futures trading
VIX: 20% (highest weight - volatility drives futures)
Put/Call Ratio: 18% (institutional hedging behavior)
Safe Haven Demand: 18% (risk-on/risk-off capital flows)
Ideal for: ES1!, NQ1! futures traders, London Open preparation, intraday bias
STOCKS (EQUITIES) MODE - Optimized for stock picking and swing trading
52-Week High/Low: 20% (market breadth matters most)
Volume Breadth: 18% (sector rotation and participation)
SPX Momentum: 18% (trend confirmation)
Ideal for: Individual stocks, ETFs, portfolio management
CRYPTO (BTC/ETH) MODE - Calibrated for cryptocurrency's correlation to equity sentiment
Safe Haven: 25% (crypto moves inverse to risk-off)
SPX Momentum: 20% (crypto follows tech/equities)
VIX: 20% (crypto crashes when volatility spikes)
Ideal for: Bitcoin, Ethereum, major altcoins
CUSTOM MODE - Manually adjust all seven component weights to your preference
🔥 What Makes This Unique?
1. ACTIONABLE INTELLIGENCE
Not just a number - get specific recommendations:
"★ PRIORITIZE LONGS @ Key Support - Size up 1.5x"
"FAVOR SHORTS @ Resistance - Watch Distribution"
"TRADE YOUR EDGE - No Sentiment Bias"
2. INSTITUTIONAL FRAMING
Understand WHY the market feels this way:
"Institutions defending levels aggressively"
"Retail chasing, institutions distributing"
"Market stretched and vulnerable - violent turn coming"
3. POSITION SIZING GUIDANCE
Know HOW MUCH to risk:
Extreme zones (0-24, 76-100) + order flow confirmation = 1.5x size
Normal zones = standard position sizing
Neutral zone (45-55) = no sentiment edge, pure price action
4. DIRECTION-BASED COLOR CODING
Green action column = Bullish recommendations
Red action column = Bearish recommendations
Gray action column = No directional bias
5. GRANULAR DISPLAY CONTROLS
Configure exactly what you need:
Show/hide index display section
Show/hide component breakdown
Show/hide live action column
Show/hide decision matrix
27 possible layout combinations
📈 Seven Market Components
Based on CNN Fear & Greed methodology with market-specific weighting:
Market Momentum - S&P 500 vs 125-day moving average
Stock Price Strength - 52-week highs vs lows (NYSE breadth)
Stock Price Breadth - Advancing vs declining volume
Put/Call Options - Options market sentiment (calculated proxy)
Market Volatility (VIX) - CBOE Volatility Index
Safe Haven Demand - Stocks vs bonds 20-day performance
Junk Bond Demand - High yield vs investment grade spread
All components normalized to 0-100 scale, weighted by market relevance, combined into single sentiment index.
🎨 Trading Decision Matrix
EXTREME FEAR (0-24) + Bullish Order Flow @ Support
→ ★ PRIORITIZE LONGS | Size up 1.5x | Strong bounce expected
FEAR (25-44) + Bullish Order Flow @ Support
→ FAVOR LONGS | Normal size | Good reversal context
NEUTRAL (45-55) + Any Setup
→ TRADE YOUR EDGE | Standard approach | No macro bias
GREED (56-75) + Bearish Order Flow @ Resistance
→ FAVOR SHORTS | Watch distribution | Fake breakouts likely
EXTREME GREED (76-100) + Bearish Order Flow @ Resistance
→ ★ AGGRESSIVE SHORTS | Size up 1.5x | Rapid reversals expected
💡 How To Use
Daily Workflow (Recommended):
Check indicator once per morning (pre-session)
Note the sentiment zone and action recommendation
Apply bias filter to your technical setups throughout the day
Size up positions at extremes when order flow confirms
For Futures Traders:
Use bar close mode (default) for stable daily bias
However, try and test live candle option , it might give you early insights
Check before London Open (6:00 AM ET)
Combine with order flow analysis (Body Close, sweeps, institutional levels)
For Stock Traders:
Use for sector rotation decisions
Extreme Fear = buy quality at your edge support level
Extreme Greed = trim positions, raise cash
For Crypto Traders:
Crypto mode captures equity risk sentiment spillover
VIX spikes = crypto dumps (size shorts)
Safe haven demand = BTC correlation tracking
🔧 Technical Details
Data Sources: Universal TradingView symbols (SP:SPX, TVC:VIX, TVC:US10Y, AMEX:HYG, AMEX:LQD, INDEX breadth data with fallback proxies)
Calculation: Seven components normalized over 252-day period, weighted by market mode, combined into 0-100 composite index
Accuracy: 85-90% zone correlation to CNN Fear & Greed Index (zones matter more than exact numbers for trading bias)
Update Frequency: User-controlled - bar close (stable) or live (real-time)
Compatibility: Works on any chart timeframe (recommend daily for bias context)
🎓 Best Practices
DO:
Use as bias filter for your existing strategy
Check once per session for daily context
Size up at extremes with order flow confirmation
Pay attention to ZONES (Extreme Fear/Greed) not exact numbers
Combine with technical analysis and price action
DON'T:
Use as standalone entry/exit signals
Overtrade or force setups when neutral
Ignore price action because sentiment contradicts
Check constantly (designed for daily bias, not tick-by-tick)
Expect exact CNN number match (focus on zones)
🏆 Who Is This For?
Futures Traders - ES/NQ intraday traders needing daily bias context
Stock Traders - Equity swing traders and stock pickers
Crypto Traders - BTC/ETH traders following equity risk sentiment
Position Traders - Anyone wanting institutional sentiment context
Systematic Traders - Adding sentiment filter to mechanical systems
📚 Based On CNN Fear & Greed Methodology
This indicator builds upon CNN Business's proven Fear & Greed Index framework, enhancing it with:
Market-specific component weighting (Futures/Stocks/Crypto)
Actionable trading recommendations with position sizing
Institutional market context and framing
Flexible display options for different trading workflows
Universal data compatibility for all TradingView users

Ichimoku With GradingDescription:
This indicator is an enhanced version of the classic Ichimoku Kinko Hyo, designed to provide traders with an objective, quantitative assessment of trend strength. By breaking down the complex Ichimoku system into specific conditions, this script calculates a "Total Score" to help visualize the confluence of bullish or bearish signals.
How It Works
The core of this script is a 7-Point Grading System. Instead of relying on a single crossover, the script evaluates 7 distinct Ichimoku conditions simultaneously.
The Grading Criteria:
Tenkan > Kijun: Checks for the classic TK Cross (1 point if Bullish, -1 if Bearish).
Price vs TK/KJ: Checks if the Close is above both the Tenkan and Kijun (Bullish) or below both (Bearish).
Future Cloud: Analyzes the Kumo (Cloud) projected 26 bars ahead. If Senkou Span A > Senkou Span B, it is bullish.
Chikou Span: The Lagging Span validation. It compares the current Close to the Highs, Lows, and Cloud levels of 26 bars ago to ensure there are no obstacles.
Close > Tenkan: Checks immediate short-term momentum.
Close > Current Senkou Span A: Checks if price is above the current cloud's Span A.
Close > Current Senkou Span B: Checks if price is above the current cloud's Span B.
Total Score & Signals:
Maximum Score (+7): When all 7 conditions are met, a Green Triangle is plotted above the bar, indicating a strong trend confluence.
Minimum Score (-7): When all 7 conditions are negative, a Red Triangle is plotted below the bar.
Neutral/Mixed: Scores between -6 and +6 indicate a mixed trend or consolidation phase.
Dashboard Features
A table is displayed in the top-right corner to provide real-time data:
Score Breakdown: Shows the status of every individual metric (1 or -1).
Total Score: The sum of all metrics.
Distance to Tenkan %: This calculates the percentage distance between the Close and the Tenkan-sen.
Usage: Traders often use the Tenkan-sen as a trailing stop-loss level. This percentage helps gauge how extended the price is from the mean; a high percentage may indicate an overextended move, while a low percentage indicates a tight consolidation.
How to Use Ichimoku Lines
Beyond the grading system, this indicator plots the standard Ichimoku lines, which are powerful tools for price action analysis:
Support & Resistance: The Tenkan-sen (Conversion Line) and Kijun-sen (Base Line) act as dynamic support and resistance levels. In a strong trend, price will often respect the Tenkan-sen. In a moderate trend, it may pull back to the Kijun-sen before continuing.
The Kumo (Cloud): The edges of the current cloud (Senkou Span A and B) act as major support and resistance zones. A thick cloud represents strong S/R, while a thin cloud is easily broken.
Trend Identification: Generally, if the price is above the Cloud, the trend is bullish. If below, it is bearish. If the price is inside the Cloud, the market is considered to be in a noise/ranging zone.
Screenshots
1. Bitcoin Daily View:
Here you can see the dashboard in action. The grading system helps filter out noise by requiring all conditions to align before generating a signal.
2. Gold (XAUUSD) Example:
An example of a bearish confluence where the score hit -7, triggering a sell signal as the price broke through all Ichimoku support levels.
3. Euro (EURUSD) Mixed State:
This example shows a market in transition. While some metrics are positive (Green), others are negative (Red), resulting in a score of 4. This prevents premature entries during choppy market conditions.
Settings
Lengths: All Ichimoku periods (Tenkan, Kijun, Senkou B, Displacement) are fully customizable in the settings menu to fit your preferred timeframe or trading style (e.g., Doubled settings for crypto).
Disclaimer: This tool is for educational and informational purposes only. Past performance does not guarantee future results. Always manage your risk.

First Opening Price of the YearOverview
This indicator identifies and plots the opening price of the first trading session of the calendar year. The "Yearly Open" is a significant psychological level for traders and institutions, often serving as a major pivot point for the entire year's trend.
How it Works
The script utilizes Pine Script v5's persistent variables to track the year change.
Detection: It compares the current bar's year (year) with the previous bar's year (year ).
Storage: When a discrepancy is found (indicating a new year has started), the script captures the open price of that specific bar.
Persistence: Using the var keyword, this price is stored in memory and carried forward for every subsequent bar of the year without being recalculated.
Visualization: The price is plotted as a series of blue crosses (style_cross) to clearly mark the level on the chart.
Chart Analysis & Examples
The following examples demonstrate how this simple level dictates market structure across different assets:
Historical Pivot Points (S&P 500):
This chart demonstrates how the Yearly Open acts as a critical pivot. Notice in 2022 how price struggled around the open before dropping, while in 2023 and 2024, the yearly open provided a solid base for the subsequent rallies.
Trend Confirmation (Bitcoin):
In strong trending markets, the Yearly Open serves as a trailing support. As seen in this Bitcoin example, price maintaining its position above the blue line confirms a sustained bullish bias for the year, acting as a "floor" for the trend.
Market Structure & Bias (Gold):
This example highlights the "Line in the Sand" concept. The indicator clearly marks the starting point of the year, allowing traders to instantly gauge if the asset is net positive or negative year-to-date. It filters out the noise and focuses on the macro direction.
How to Use
Traders can use this indicator to determine the higher-timeframe bias:
Bullish Bias: When the current price is trading above the blue crosses, the market is considered to be positive relative to the start of the year.
Bearish Bias: When the current price is trading below the blue crosses, the market is negative relative to the start of the year.
Settings
This script is "plug and play" and requires no manual input adjustments. It automatically detects the timeframe and year changes based on the chart data provided.
Disclaimer
This tool is for informational purposes only and DOES NOT constitute financial advice. Always manage your risk appropriately.

Power Hour Trendlines [LuxAlgo]The Power Hour Trendlines indicator is based on Power Hours detection, and includes up to three displayed trendlines derived from the closing prices of all the bars within the last user-selected Power Hours.
Users can edit the time of Power Hours, choose how many sessions to take into account, enable or disable any trendlines, and change their colors.
🔶 USAGE
The Power Hour is defined as the last hour of the trading session and is set by default from 3:00 p.m. to 4:00 p.m. New York time. During this period, volume and volatility enter the market. Traders using higher timeframes may use this period to enter or exit positions by placing MOC (Market on Close) orders.
This tool works under the hypothesis that prices made during power hours (periods with high trading activity) are more relevant when used for the construction of trendlines.
An initial trendline is fit using linear regression; prices from power hours located above this initial fit are used for the upper trendline, while the ones below the fit are used for the lower one.
As with any trendline, traders can analyze the slope to determine the market's direction:
Positive slope: The market is trending up.
Negative slope: The market is trending down.
No slope: The market is trending sideways.
As we can see in the image, Nasdaq and Bitcoin are clearly in downtrends, gold is clearly in an uptrend, and the euro/U.S. dollar is in a sideways market over the last visible sessions.
As you can see, the trend lines may or may not be parallel to each other. The wider the area, the more volatile the data. The narrower the area, the less volatile the data. Let's look at an example.
In the image, the Dow30 and the euro/U.S. dollar have opposite behaviors. The volatility above the middle trendline is growing in the first case but shrinking in the second. In both cases, the volatility in the bottom area seems steady, so there are no big surprises there.
Traders can adjust the number of sessions for calculations, making the tool ideal for analyzing price behavior over different time frames.
As the image shows, we can clearly see how the market behaves over different time periods. XLY has been moving down over the last 10, 20, and 40 sessions, with a steeper decline over shorter periods. However, it has been moving sideways over the last 70 sessions.
One of the main uses of trendlines is to provide key support and resistance. In the image, SPY is shown with trendlines over the last 20 sessions. These lines provide excellent reference points for trading and observing price behavior in those areas, such as whether prices are accepted or rejected, which may trigger a response from other traders.
🔹 Not Allowed Timeframes
For obvious reasons, timeframes larger than 1H are not allowed. The Power Hour is defined as the last hour of the trading session. The tool will display a warning message if the timeframe is longer than 60 minutes.
🔶 SETTINGS
Power Hour (NY Time): Choose a custom Power Hour in New York time
Sessions Memory: Select how many Power Hours to take into account for calculations.
🔹 Style
Top: Enable or disable the top line and choose the line and background colors.
Middle: Enable or disable the middle line and choose the line color.
Bottom: Enable or disable the bottom line and choose the line and background colors.
Background: Enable or disable the background color for top and bottom lines.

BTC - DCA vs HODL Calculator MatrixBTC - DCA vs. HODL Calculator Matrix | RM
Overview
The BTC - DCA vs. HODL Calculator Matrix is a high-performance telemetry laboratory designed to settle the ultimate debate in Bitcoin accumulation: Is it more efficient to deploy all capital at once ( Lump Sum & HODL ) or utilize a recurring purchase strategy ( DCA )? More importantly, if DCA is the choice, which exact frequency and weekday provides the mathematical edge?
The Calculator Matrix was engineered to solve a critical limitation in the current script ecosystem (at least I couldnt find such an indicator): the inability to compare multiple DCA frequencies and specific calendar days simultaneously within a single dashboard. While developing this tool, I found that existing calculators typically only permit testing one strategy at a time (e.g., a generic "Weekly" buy). This script fills that gap by utilizing a high-performance array-based "Telemetry Engine" to rank dozens of variables—including every individual weekday and specific monthly dates—against a HODL benchmark in real-time. This unique simultaneous comparison allows investors to mathematically identify "Weekday Alpha" across any user-defined timeframe.
Core Philosophy
The script utilizes a Normalized Capital Model . To ensure a true "apples-to-apples" comparison, your total capital (e.g., $10,000) is distributed with mathematical precision across the exact number of entries for each specific strategy. This eliminates the ROI skewing commonly found in basic scripts, ensuring that every strategy is judged on the same total dollar expenditure over the same "Race Track."
Key Features & Analytics
• The Podium System: An automated ranking algorithm that awards 🥇 Gold, 🥈 Silver, and 🥉 Bronze medals to the top three performing strategies. Spoiler: Regular Winner: 1-time HODL (Lump Sum)
• Simultaneous Strategy Testing: Compare Daily, 7 different Weekly days (Mon-Sun), and Monthly dates (1st–28th) all at once.
• Risk Telemetry: Integrated Max Drawdown (MDD) sensors for every strategy, revealing the "Emotional Cost" of your accumulation path.
• Race Track Visuals: Blue dashed "Green Flag" and "Checkered Flag" lines visually define the boundaries of your backtest.
• Dashboard Customization: Use the "Odd/Even" filter to keep the matrix sleek and readable on (nearly) any screen resolution.
The Strategies Tested
• 1-TIME HODL: The benchmark (Lump sum entry on Day 1 - meaning all the capital is deployed at the start date).
• DAILY DCA: High-frequency, day-by-day accumulation (the capital is split amongst the different entries).
• WEEKLY (SUN-SAT): Evaluates which specific day of the week historically captures the best entries (e.g., "Weekend Dips").(The capital is split amongst the different entries).
• MONTHLY (1-28 + END): Tests monthly date performance to optimize for beginning-of-month or end-of-month cycles. (The capital is split amongst the different entries).
Monte Carlo Simulation & Python Research
While this tool allows you to manually check any specific timeframe, manual testing is limited by "Start Date Bias." To find the Universal Winner , I have conducted a Monte Carlo Simulation using 100 random entry dates over the last 5 years via Python/Colab. This research reveals the statistical probability of a day (like Saturday) winning the Gold medal across all market conditions.
Access the Python Heatmap Research in my substack article (link for substack in Bio).
How to Use
1. Set the Race Track: Input Start and End dates in the settings.
2. Fuel the Engine: Set your Total Capital ($).
3. Analyze the Matrix: Compare ROI vs. MAX DD. The goal is not just the highest return, but the best Risk-Adjusted return.
Technical Implementation
This script utilizes an array-based telemetry engine to handle the simultaneous calculation of 30+ independent investment strategies. To ensure computational efficiency and bypass the limitations of standard security-based backtesting, I implemented a custom-built accumulator logic using array.new_float() and array.set() . The core calculation loop ( if in_race and is_new_day ) processes capital deployment on a per-bar basis, utilizing ta.change(time("D")) to ensure entry synchronization with the Daily UTC close. By decoupling the unit accumulation ( u_weekly , u_monthly ) from the final valuation logic ( f_get_stats ), the script maintains a Normalized Capital Model. This ensures that even with complex comparative logic across varying frequencies, the script provides a mathematically rigorous, reproducible result that matches real-world execution at the Daily UTC Midnight close.
Note: All calculations are made on the "close" bar, which means UTC 00:00. By creating a strategy or using the research, make sure to be aware of your time zone
Disclaimer: Past performance is not indicative of future results. This tool is for educational and research purposes only. Rob Maths is not liable for any financial losses.
Tags:
robmaths, Rob Maths, DCA, HODL, Bitcoin, BTC, Backtest, RiskManagement, Investment, Strategy, Statistics
