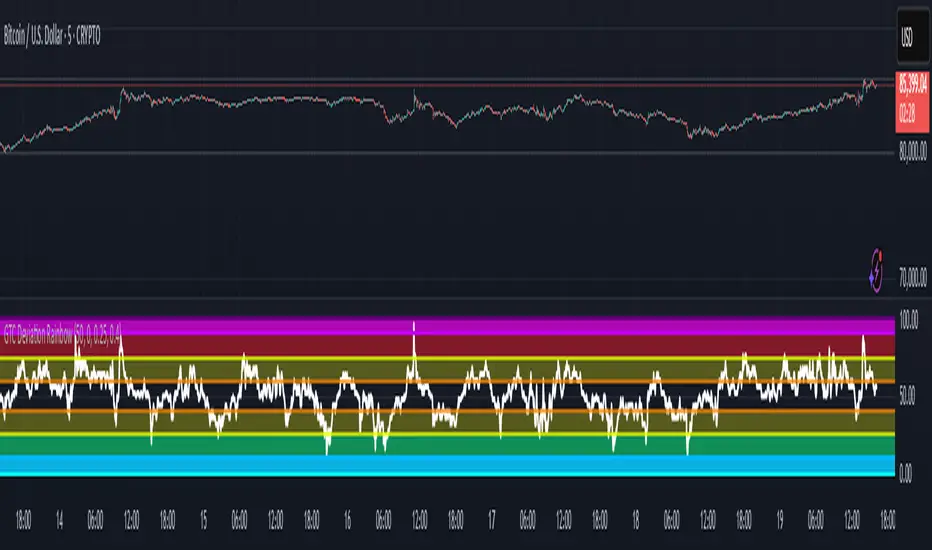
GTC Deviation Rainbow🚀 Introducing the GTC Deviation Rainbow: Your Ultimate Market Precision Tool
The GTC Deviation Rainbow is a powerful, all-in-one tool designed to pinpoint market extremes, detect mean reversion opportunities, and clarify trends with stunning accuracy. By visualizing multiple deviation bands, it reveals overbought and oversold conditions across all timeframes, giving you the insight you need to make confident, high-probability trades. The GTC Deviation Rainbow combines volatility analysis, mean reversion detection, and market trend clarity—all in one cutting-edge package.
🌈 What Makes the GTC Deviation Rainbow Revolutionary:
Unlike any other indicator available on the market, the GTC Deviation Rainbow offers a groundbreaking approach to market analysis. While most indicators focus on single metrics or basic oscillations, this tool visualizes layered deviation bands that provide a comprehensive view of market conditions. Its ability to simultaneously identify overbought and oversold states across multiple timeframes makes it an unparalleled resource for precision trading.
💡 Why This Indicator Stands Out:
The GTC Deviation Rainbow isn't just a tool—it's a strategy enhancer. Its unique ability to detect both micro and macro deviations offers powerful insights for scalpers, swing traders, and long-term investors alike. When the bands stretch too far from the mean, you know it's time to pay attention.
📈 Why You Need This Indicator:
✅ Comprehensive Market Analysis: Instantly identify when prices have deviated too far from their historical norms, signaling prime entry and exit points.
✅ Versatile Usage: Whether you’re looking for intraday reversals, swing trades, or long-term setups, the GTC Deviation Rainbow adapts to your trading style.
✅ Works Across Markets: From crypto and stocks to forex and commodities, this tool delivers clarity and precision everywhere.
✅ Visual Simplicity: Color-coded deviation bands eliminate guesswork, giving you straightforward, actionable insights.
🔥 How To Use It Effectively:
Spot Deviation Extremes: Watch for price interactions with outer deviation bands to find high-probability reversal zones.
Confirm Trends: Use the indicator to assess whether a price movement is a genuine trend or a temporary spike.
Align With Your Strategy: Combine the GTC Deviation Rainbow with your preferred methods to amplify your trading edge.
📌 Elevate Your Trading Game.
The GTC Deviation Rainbow Indicator isn't just another indicator—it's a powerful ally designed to keep you ahead of the market. Whether you’re hunting for short-term reversals or planning long-term moves, this tool will sharpen your edge like never before.
⚠️ Disclaimer:
The GTC Deviation Rainbow is a powerful tool designed to enhance your market analysis by providing unique insights. However, it is not a replacement for comprehensive market analysis or prudent risk management. Always combine our tools with thorough research, technical analysis, and a well-structured trading plan. Past performance is not indicative of future results. Trade responsibly.
Search in scripts for "bollingerband"
BBVOL SwiftEdgeBBVOL SwiftEdge – Precision Scalping with Volume and Trend Filtering
Optimized for scalping and short-term trading on fast-moving markets (e.g., 1-minute charts), BBVOL SwiftEdge combines Bollinger Bands, Heikin Ashi smoothing, volume momentum, and EMA trend alignment to deliver actionable buy/sell signals with visual trend cues. Ideal for forex, crypto, and stocks.
What Makes BBVOL SwiftEdge Unique?
Unlike traditional Bollinger Bands scripts that focus solely on price volatility, BBVOL SwiftEdge enhances signal precision by:
Using Heikin Ashi to filter out noise and confirm trend direction, reducing false signals in choppy markets.
Incorporating volume analysis to ensure signals align with significant buying or selling pressure (customizable thresholds).
Adding an EMA overlay to keep trades in sync with the short-term trend.
Coloring candlesticks (green for bullish, red for bearish, purple for consolidation) to visually highlight market conditions at a glance.
How Does It Work?
Buy Signal: Triggers when price crosses above the lower Bollinger Band, Heikin Ashi shows bullish momentum (close > open), buy volume exceeds your set threshold (default 30%), and price is above the EMA. A green triangle appears below the candle.
Sell Signal: Triggers when price crosses below the upper Bollinger Band, Heikin Ashi turns bearish (close < open), sell volume exceeds the threshold (default 30%), and price is below the EMA. A red triangle appears above the candle.
Trend Visualization: Candles turn green when price is significantly above the Bollinger Bands’ basis (indicating a bullish trend), red when below (bearish trend), or purple when near the basis (consolidation), based on a customizable threshold (default 10% of BB width).
Risk Management: Each signal calculates a stop-loss (10% beyond the opposite band) and take-profit (opposite band), plotted for reference.
How to Use It
Timeframe: Best on 1-minute to 5-minute charts for scalping; test higher timeframes for swing trading.
Markets: Works well in volatile markets like forex pairs (e.g., EUR/USD), crypto (e.g., BTC/USD), or liquid stocks.
Customization: Adjust Bollinger Bands length (default 10), multiplier (default 1.2), volume thresholds (default 30%), EMA length (default 3), and consolidation threshold (default 0.1%) to match your strategy.
Interpretation: Look for green/red triangles as entry signals, confirmed by candle colors. Purple candles suggest caution—wait for a breakout. Use stop-loss/take-profit levels for trade management.
Underlying Concepts
Bollinger Bands: Measures volatility and identifies overbought/oversold zones.
Heikin Ashi: Smooths price action to emphasize trend direction.
Volume Momentum: Calculates cumulative buy/sell volume percentages to confirm market strength (e.g., buyVolPercent = buyVolume / totalVolume * 100).
EMA: A fast-moving average (default length 3) ensures signals align with the immediate trend.
Chart Setup
The chart displays Bollinger Bands (orange), Heikin Ashi close (green circles), EMA (purple), and volume-scaled lines (lime/red). Signals are marked with triangles, and candle colors reflect trend state. Keep the chart clean by focusing on these outputs for clarity.

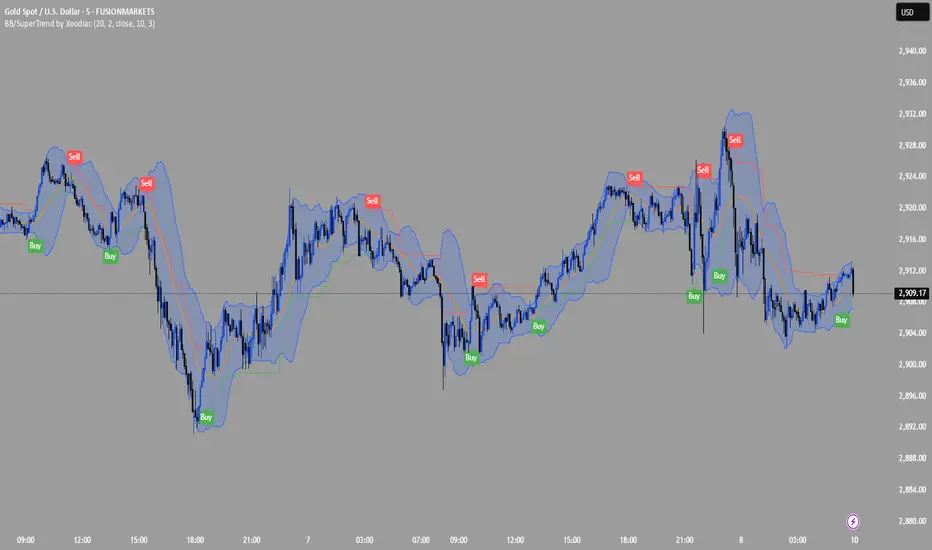
Bollinger Bands + Supertrend by XoediacBollinger Bands with Supertrend Indicator by Xeodiac
This script combines two powerful technical analysis tools — Bollinger Bands and the Supertrend Indicator — to provide traders with a comprehensive view of market volatility and trend direction.
Bollinger Bands: These bands consist of a middle band (the simple moving average, or SMA) and two outer bands (calculated as standard deviations away from the middle). The upper and lower bands act as dynamic support and resistance levels, expanding during high volatility and contracting during low volatility.
Supertrend Indicator: The Supertrend is a trend-following indicator that uses the Average True Range (ATR) to calculate an adaptive threshold, indicating whether the market is in an uptrend or downtrend. The indicator changes color based on the trend direction, providing clear buy and sell signals.
Features of the Script:
Volatility-based Signals : By incorporating the Bollinger Bands, the script adjusts to market volatility. Traders can identify periods of high and low volatility, helping to gauge potential price breakouts or reversals.
Trend Confirmation: The Supertrend helps confirm the trend direction, ensuring that trades are aligned with the overall market trend. Green Supertrend signals indicate an uptrend, while red signals indicate a downtrend.
Enhanced Decision-making: By using both indicators together, traders can make more informed decisions. For instance, buying opportunities are validated when the price is near the lower Bollinger Band, and the Supertrend is in a bullish phase, and vice versa for selling.
Customizable Parameters: The script allows users to customize the settings for both the Bollinger Bands and the Supertrend, enabling fine-tuning based on trading preferences or market conditions.
Ideal Use Cases:
Identifying trend reversals or continuation patterns in trending markets.
Monitoring price action during periods of low volatility for breakout opportunities.
Filtering out false signals by combining volatility with trend strength.
Full Spectrum Delta BandsI created the Full Spectrum Delta Bands (FullSpec ΔBB) to go beyond traditional Bollinger Bands by incorporating both OHLC (Open, High, Low, Close) and Close-based data into the calculations. Instead of relying solely on closing prices, this indicator evaluates deviations from the complete bar range (OHLC), offering a more accurate view of market behavior.
A key feature is the Delta Flip, which highlights shifts between OHLC and Close-based bands. These flips are visually marked with color changes, signaling potential trend reversals, breakout zones, or volatility shifts. Traders can use these moments as inflection points to refine their entry and exit strategies.
The indicator also supports customizable sensitivity and deviation multiplier settings, allowing it to adapt to different trading styles and timeframes. Lower deviation values (e.g., 1σ or 1.5σ) are ideal for scalping on shorter timeframes like 5-min or 15-min charts, while higher values (e.g., 2.5σ or 3σ) are better suited for long-term trend analysis on weekly or monthly charts. The standard deviation multiplier fine-tunes the upper and lower bands to match specific trading goals and market conditions.
I designed Full Spectrum Delta Bands to provide deeper insights and a clearer view of market dynamics compared to traditional Bollinger Bands. Whether you’re a scalper, swing trader, or long-term investor, this tool helps you make informed and confident trading decisions.

Ultra Smart TrailIntroduction
The Ultra Smart Trail indicator is a comprehensive tool for traders seeking to identify and follow market trends efficiently. Combining dynamic trend detection with adaptive price bands, this indicator simplifies the process of understanding market direction and strength. It provides clear visual cues and customizable settings, catering to both novice and experienced traders.
Detailed Description
The Ultra Smart Trail indicator works by calculating a Trend Flow Line (TFL) using a hybrid moving average technique. This TFL dynamically adjusts to market conditions, smoothing out price fluctuations while remaining responsive to significant market shifts.
.........
Trend Flow Line (TFL)
A color-coded line indicating bullish, bearish, or neutral trends based on price movement relative to the TFL.
The TFL uses a combination of weighted moving averages (WMA) and double-weighted moving averages (DWMA) for accuracy.
.....
Dynamic Price Bands
The indicator plots upper and lower bands around the TFL, based on customizable multipliers of standard deviation. These bands adapt dynamically to volatility, helping traders spot overbought or oversold conditions.
The script calculates standard deviation-based bands with customizable multipliers, enabling precise adjustment to trading styles or instruments.
.....
Uptrend/Downtrend Highlights
The background and price bands visually differentiate trending and ranging markets, making it easier to identify high-probability trade setups.
.....
Reversal Alerts
By analyzing the relationship between price and bands, the script highlights potential reversals or continuation zones with distinct levels and fills.
.........
This indicator is a powerful addition to any trader’s toolkit, simplifying market analysis and enhancing decision-making.

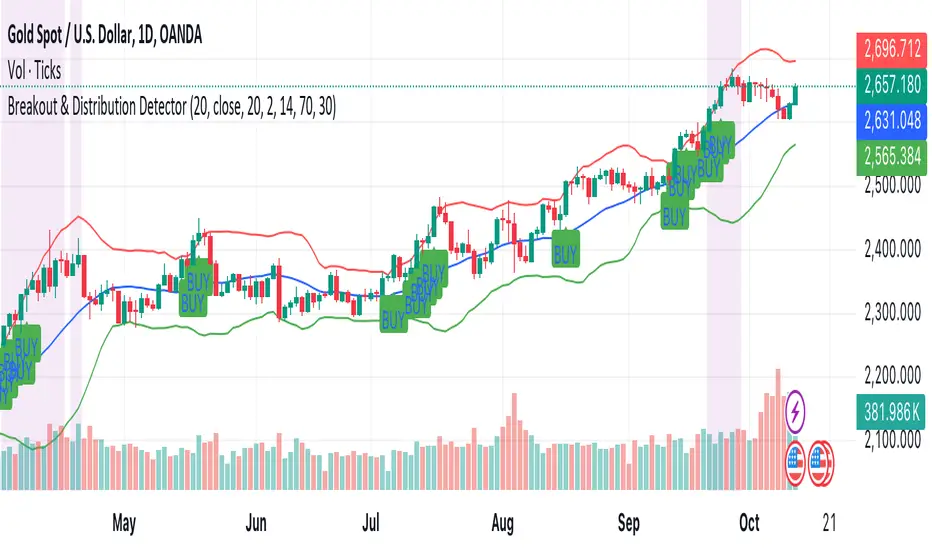
Breakout & Distribution DetectorHow the Script Works:
1. Bollinger Bands:
• The upper and lower Bollinger Bands are used to detect volatility and potential breakouts. When the price closes above the upper band, it’s considered a bullish breakout. When the price closes below the lower band, it’s a bearish breakout.
2. RSI (Relative Strength Index):
• The RSI is used for momentum confirmation. A bullish breakout is confirmed if the RSI is above 50, and a bearish breakout is confirmed if the RSI is below 50.
• If the RSI enters overbought (above 70) or oversold (below 30) levels, it signals a distribution phase, indicating the market may be ready to reverse or consolidate.
3. Moving Average:
• A simple moving average (SMA) of 20 periods is used to ensure we’re trading in the direction of the trend. Breakouts above the upper Bollinger Band are valid if the price is above the SMA, while breakouts below the lower Bollinger Band are valid if the price is below the SMA.
4. Signals and Alerts:
• BUY Signal: A green “BUY” label appears below the candle if a bullish breakout is detected.
• SELL Signal: A red “SELL” label appears above the candle if a bearish breakout is detected.
• Distribution Phase: The background turns purple if the market enters a distribution phase (RSI in overbought or oversold territory).
• Alerts: You can set alerts based on these conditions to get notifications for breakouts or when the market enters a distribution phase.
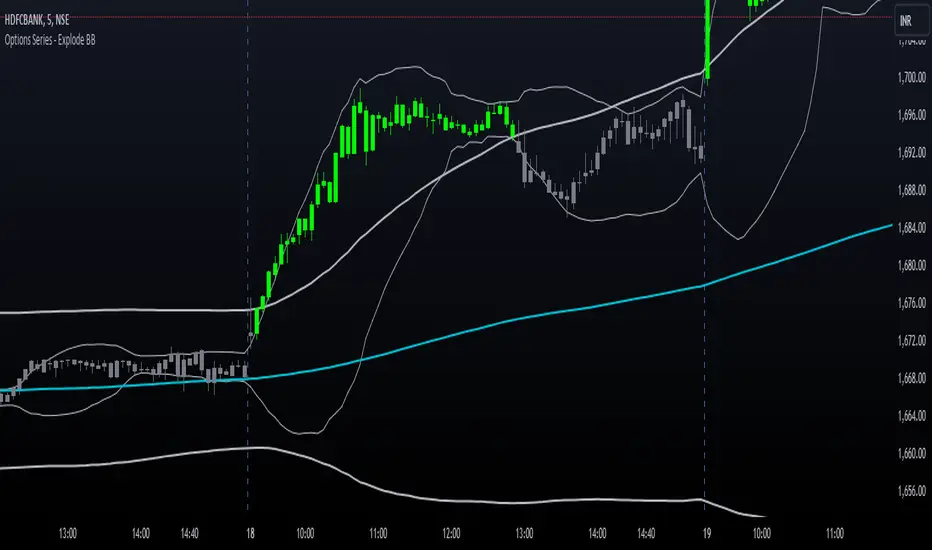
Options Series - Explode BB⭐ Bullish Zone:
⭐ Bearish Zone:
⭐ Neutral Zone:
The provided script integrates Bollinger Bands with different lengths (20 and 200 periods) and applies customized candle coloring based on certain conditions. Here's a breakdown of its importance and insights:
⭐ 1. Dual Bollinger Bands (BBs):
Bollinger Bands (BB) with 20-period length:
This is the standard setting for Bollinger Bands, with a 20-period simple moving average (SMA) as the central line and upper/lower bands derived from the standard deviation.
These bands are used to identify volatility. Wider bands indicate higher volatility, while narrower bands indicate low volatility.
200-period BB:
This is a longer-term indicator providing insight into the overall trend and long-term volatility.
The 200-period bands filter out noise and offer a "macro" view of price movements compared to the 20-period bands, which focus on short-term price actions.
⭐ 2. Overlay of Bollinger Bands and SMA:
The script plots the Bollinger Bands along with the SMA (Simple Moving Average) of the 200-period BB. This gives traders both a short-term (20-period) and long-term (200-period) perspective, which is valuable for detecting major trend shifts or key support and resistance zones.
Using multiple time frames (20-period for short-term and 200-period for long-term) can help traders spot both immediate opportunities and overarching trends.
⭐ 3. Candle Coloring Based on Key Conditions:
Bullish Signal (GreenFluroscent): When the price closes above the upper 200-period Bollinger Band, the candle turns green, indicating a potential bullish breakout.
Bearish Signal (RedFluroscent): If the price closes below the lower 200-period Bollinger Band, the candle turns red, suggesting a bearish breakout.
Neutral or Uncertain Market: Candles are gray when the price remains between the upper and lower bands, indicating a lack of a strong directional bias.
This color-coded visualization allows traders to quickly assess market sentiment based on the Bollinger Bands' extremes.
⭐ 4. Strategic Importance of the Setup:
Multi-timeframe Analysis: Combining short-term (20-period) and long-term (200-period) Bollinger Bands enables traders to assess the market's overall volatility and trend strength. The longer-term bands act as a reference for broader trend direction, while the shorter-term bands can signal shorter-term pullbacks or entry/exit points.
Breakout Identification: By color-coding the candles when prices cross either the upper or lower 200-period bands, the script makes it easier to spot potential breakouts. This can be particularly helpful in trading strategies that rely on volatility expansions or trend-following tactics.
⭐ 5. Customization and Flexibility:
Custom Colors: The script uses distinct fluorescent green and red colors to highlight key bullish and bearish conditions, providing clear visual cues.
Simplicity with Flexibility: Despite its simplicity, the script leaves room for customization, allowing traders to adjust the Bollinger Band multipliers or apply different conditions to candle coloring for more nuanced setups.
This script enhances standard Bollinger Band usage by introducing multi-timeframe analysis, breakout signals, and visual cues for trend strength, making it a powerful tool for both trend-following and mean-reversion strategies.
🚀 Conclusion:
This script effectively simplifies volatility analysis by visually marking bullish, bearish, and neutral zones, making it a robust tool for identifying trade opportunities across multiple timeframes. Its dual-band approach ensures both trend-following and mean-reversion strategies are supported.
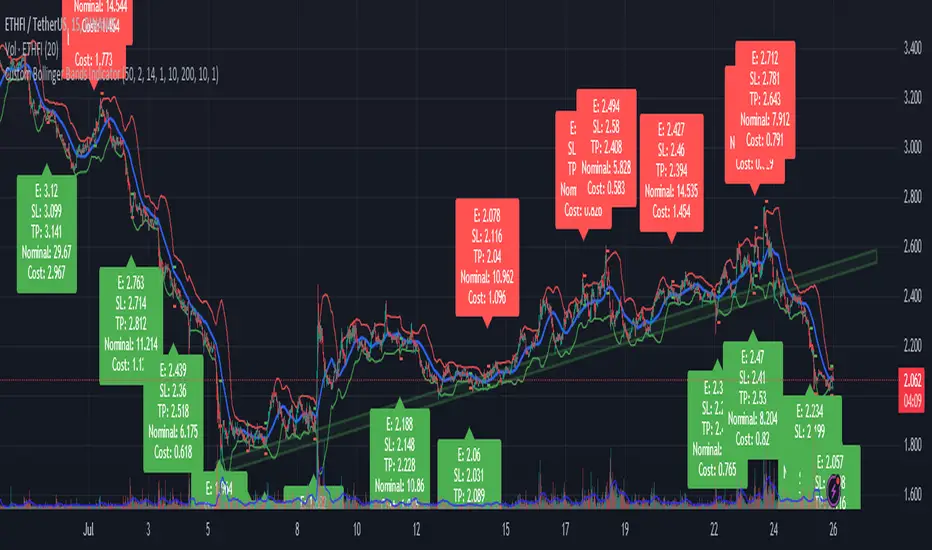
Chieu - Bollinger Bands SMA 50 StrategyOverview
The Custom Bollinger Bands Indicator is a versatile tool designed to help traders identify potential market reversals and optimize their trading strategies. This indicator combines Bollinger Bands with an ATR-based stop-loss mechanism, configurable take-profit levels, and dynamic position sizing to manage risk effectively. By highlighting key market conditions and providing clear visual cues, it enables traders to make informed decisions and execute trades with precision.
Key Features
Bollinger Bands Calculation:
The indicator calculates Bollinger Bands based on a configurable Simple Moving Average (SMA) length.
Standard deviation multiplier is adjustable, allowing traders to fine-tune the width of the bands.
Candlestick Highlighting:
Candles that touch the upper or lower Bollinger Bands are highlighted, indicating potential overbought or oversold conditions.
Reversal candles are identified and highlighted based on specific criteria:
The candle must touch the Bollinger Bands for two consecutive periods.
The reversal candle must have a body at least twice the size of the previous candle's body.
The reversal candle must close in the opposite direction to the previous candle (e.g., a bullish candle following a bearish one).
Stop-Loss and Take-Profit Levels:
Stop-loss levels are calculated using the ATR (Average True Range) indicator, ensuring they are dynamically adjusted based on market volatility.
Two configurable take-profit levels (1R and 2R) are plotted based on the initial risk (distance between entry and stop-loss).
Take-profit and stop-loss lines are visually represented on the chart for easy reference.
Position Sizing and Risk Management:
The indicator includes configurable inputs for account balance, leverage, and risk percentage.
It calculates the nominal value (position size without leverage) and cost value (position size with leverage) based on the specified risk parameters.
Combined labels display SL, TP, nominal value, and cost value, replacing the default "Reversal" text for clear, concise information.
Customization Options:
Users can configure the length of the take-profit lines.
The option to toggle the highlighting of candles touching the Bollinger Bands on or off, while always highlighting the identified reversal candles.
How to Use
Configuration:
Set the desired SMA length and Bollinger Bands multiplier in the input settings.
Configure the ATR length for accurate stop-loss calculations.
Adjust the risk-reward ratio and take-profit line length according to your trading strategy.
Specify your account balance, leverage, and risk percentage for precise position sizing.
Chart Analysis:
Monitor the chart for candles touching the upper or lower Bollinger Bands. These highlights indicate potential overbought or oversold conditions.
Look for highlighted reversal candles, which meet the specified criteria and suggest a potential market reversal.
Use the plotted stop-loss and take-profit lines to manage your trades effectively. The combined labels provide all necessary information (SL, TP, nominal value, and cost value) for quick decision-making.
Execution and Risk Management:
Enter trades based on the reversal candle signals.
Set your stop-loss at the indicated level using the ATR calculation.
Take partial profits at the first take-profit level (1R) and adjust your stop-loss to the entry point to secure the remaining position.
Exit the trade entirely at the second take-profit level (2R) or if the price returns to the adjusted stop-loss level.
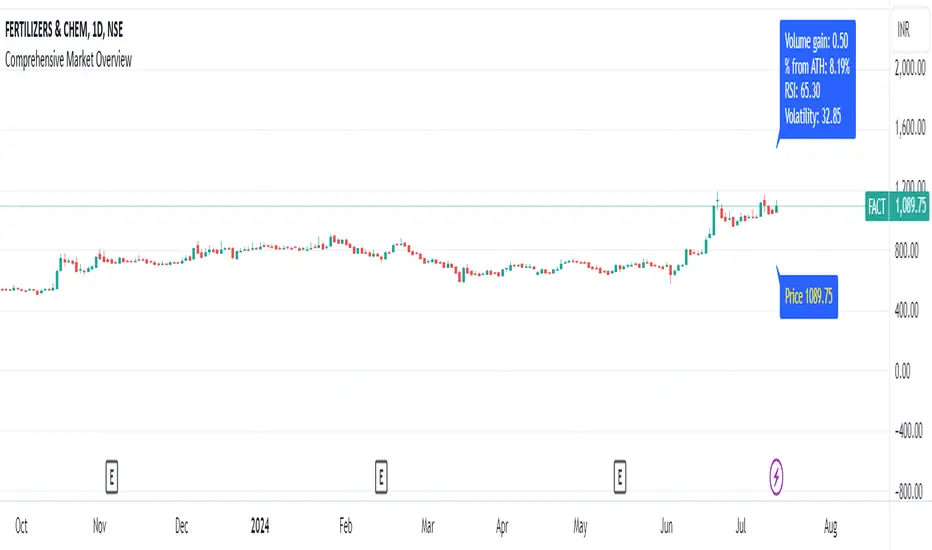
Comprehensive Market Overview1. What is this indicator about?
The "Comprehensive Market Overview" indicator provides a holistic view of the market by incorporating several key metrics:
Close Price: Displays the current close price below each candle.
Percent from All-Time High: Calculates how far the current close price is from the highest high observed over a specified period.
RSI (Relative Strength Index): Measures the momentum of price movements to assess whether a stock is overbought or oversold.
Volume Gain: Computes the current volume relative to its 20-period simple moving average (SMA), indicating volume strength or weakness.
Volatility: Quantifies market volatility by calculating the ratio of the Bollinger Bands' width (difference between upper and lower bands) to the SMA.
2. How it works?
Close Price Label: This label is displayed below each bar, showing the current close price.
Percent from All-Time High: Calculates the percentage difference between the highest high observed (all-time high) and the current close price.
RSI Calculation: Computes the RSI using a 14-period setting, providing insight into whether a stock is potentially overbought or oversold.
Volume Strength: Computes the current volume divided by its 20-period SMA, indicating whether volume is above or below average.
Volatility Calculation: Calculates the width of the Bollinger Bands (based on a 20-period SMA and 2 standard deviations) and expresses it as a percentage of the SMA, providing a measure of market volatility
3.Correct Trend Identification with Indicators
All-Time High (ATH) Levels:
Low Value (Near ATH): When the percent from ATH is low (close to 0%), it indicates that the current price is near the all-time high zone. This suggests strong bullish momentum and potential resistance levels.
High Value (Below ATH): A high percentage from ATH indicates how much the current price is below the all-time high. This could signal potential support levels or opportunities for price recovery towards previous highs.
RSI (Relative Strength Index):
Overbought (High RSI): RSI values above 70 typically indicate that the asset is overbought, suggesting a potential reversal or correction in price.
Oversold (Low RSI): RSI values below 30 indicate oversold conditions, suggesting a potential rebound or price increase.
Swing Trading Strategies
Confirmation with Visual Analysis: Visualizing the chart to confirm ATH levels and RSI readings can provide strong indications of market sentiment and potential trading opportunities:
Bullish Signals: Look for prices near ATH with RSI confirming strength (not yet overbought), indicating potential continuation or breakout.
Bearish Signals: Prices significantly below ATH with RSI showing weakness (not yet oversold), indicating potential for a bounce or reversal.
Volume Confirmation: Comparing current volume to its SMA helps confirm the strength of price movements. Higher current volume relative to the SMA suggests strong price action.
Volatility Assessment: Monitoring volatility through the Bollinger Bands' width ratio helps assess potential price swings. Narrow bands suggest low volatility, while wide bands indicate higher volatility and potential trading opportunities.
4.Entry and Exit Points:
Entry: Consider entering long positions near support levels when prices are below ATH and RSI is oversold. Conversely, enter short positions near resistance levels when prices are near ATH and RSI is overbought.
Exit: Exit long positions near resistance or ATH levels when prices show signs of resistance or RSI becomes overbought. Exit short positions near support levels or when prices rebound from oversold conditions.
Risk Management: Always incorporate risk management techniques such as setting stop-loss orders based on support and resistance levels identified through ATH and RSI analysis.
Implementation Example
Bollinger Bands with RSI and Volume confirmationThe 'Bollinger Bands with RSI and Volume Confirmation' is an invite-only indicator designed to identify potential buy and sell signals by combining Bollinger Bands, RSI, and volume. This combination aims to provide a clearer picture of market conditions and potential price movements. The indicator is optimized for use on 15-minute timeframes.
Key Features:
1. Bollinger Bands:
- Parameters: The length (default: 20 periods) and the multiplier (default: 2.0) can be adjusted to suit different trading strategies.
- Visualization: The indicator plots the upper, lower, and basis (middle) bands on the 15-minute price chart. It also includes higher timeframe (1-hour) Bollinger Bands.
2. Relative Strength Index (RSI):
- Calculation: The RSI length (default: 21 periods) and source can be customized. The indicator provides an option to choose between SMA and EMA for smoothing the RSI.
3. Volume Confirmation:
- Analysis: The volume moving average length (default: 20 periods) helps confirm signals. Buy and sell signals are only considered valid if the current volume confirms them.
How it Works:
Buy Signal:
- Timeframe and Data Integration: This indicator is used exclusively on the 15-minute chart. It integrates Bollinger Bands data from both the 15-minute and 1-hour charts to enhance the accuracy of bullish or bearish market conditions.
- Bollinger Bands Confluence: When the price reaches the lower band of both the 15-minute and 1-hour Bollinger Bands, it often indicates a stronger oversold condition and a potential support level. This confluence suggests a higher likelihood of a price reversal or bounce back toward the middle or upper band. However, it can also confirm strong bearish momentum.
- RSI Confirmation: To filter out false signals and ensure that the price is likely to move back up rather than continuing downwards, the RSI is used for additional confirmation. The buy signal is only considered if the RSI becomes bullish and crosses above its moving average (RSI-based MA).
- Volume Confirmation: To further validate the potential buy signal, the market volume is analyzed. The indicator checks if there is sufficient volume to support a price reversal. Only if all these conditions align—confluence of Bollinger Bands, bullish RSI, and confirming volume—a buy signal is generated.
- Signal Confirmation Period: The indicator allows a period for all these conditions to align, ensuring a robust and reliable buy signal.
Example Buy Signal:
Sell Signal:
- Timeframe and Data Integration: As with the buy signal, the sell signal is used exclusively on the 15-minute chart. It integrates Bollinger Bands data from both the 15-minute and 1-hour charts to improve the accuracy of bearish market conditions.
- Bollinger Bands Confluence: When the price reaches the upper band of both the 15-minute and 1-hour Bollinger Bands, it often indicates a stronger overbought condition and a potential resistance level. This confluence suggests a higher likelihood of a price reversal downward. However, it can also confirm strong bullish momentum.
- RSI Confirmation: To avoid false signals and ensure that the price is likely to move down rather than continuing upwards, the RSI is used for additional confirmation. The sell signal is only considered if the RSI indicates bearishness and crosses below its moving average (RSI-based MA).
- Volume Confirmation: To validate the potential sell signal, the market volume is analyzed. The indicator checks if there is sufficient volume to support a price reversal downward. Only if all these conditions align—confluence of Bollinger Bands, bearish RSI, and confirming volume—a sell signal is generated.
- Signal Confirmation Period: The indicator allows a period for all these conditions to align, ensuring a robust and reliable sell signal.
Here is an example:
Alerts:
- The indicator includes alert conditions for both buy and sell signals, notifying traders when conditions are met. In order to activate the alerts you must go to TradingView's alerts section and enable buy/sell alerts for an asset.
This indicator uses a multi-faceted approach to signal generationt:
1. Bollinger Bands: This technical analysis tool is used to measure market volatility and identify potential overbought and oversold conditions. By plotting the Bollinger Bands on both 15-minute and 1-hour timeframes, the indicator can detect significant price levels where market reactions are likely.
2. RSI (Relative Strength Index): RSI is utilized to measure the speed and change of price movements. By incorporating an option to choose between SMA and EMA for smoothing, the indicator offers flexibility to adapt to various market conditions. RSI crossing its moving average provides additional confirmation of potential reversals.
3. Volume Analysis: Volume is a critical component in confirming the validity of price movements. The indicator analyzes volume by calculating a moving average (default: 20 periods) to determine if there is sufficient market activity to support the identified signals.
Concepts Underlying Calculations:
- Confluence of Indicators: The primary concept behind this indicator is the confluence of multiple technical indicators. By requiring alignment between Bollinger Bands, RSI, and volume, the indicator filters out false signals and increases the probability of successful trades.
- Timeframe Analysis: Integrating data from multiple timeframes (15-minute and 1-hour) provides a more comprehensive view of market conditions, helping to identify significant support and resistance levels.
- Signal Validation: Each potential signal is subjected to a validation process involving RSI and volume analysis. This ensures that only high-probability signals are generated, reducing the risk of entering trades based on weak or unreliable signals.
This indicator was developed to streamline market analysis and provide a more efficient trading experience. By integrating multiple indicators into a single tool, traders can quickly observe market conditions and make informed decisions without the need to manually check each indicator on separate timeframes. This saves time and provides a clearer sense of how the market is moving, enhancing the overall trading strategy.
Disclaimer:
Trading involves substantial risk and is not suitable for every investor. Past performance is not indicative of future results. Always do your own research and consult with a professional financial advisor before making any trading decisions.

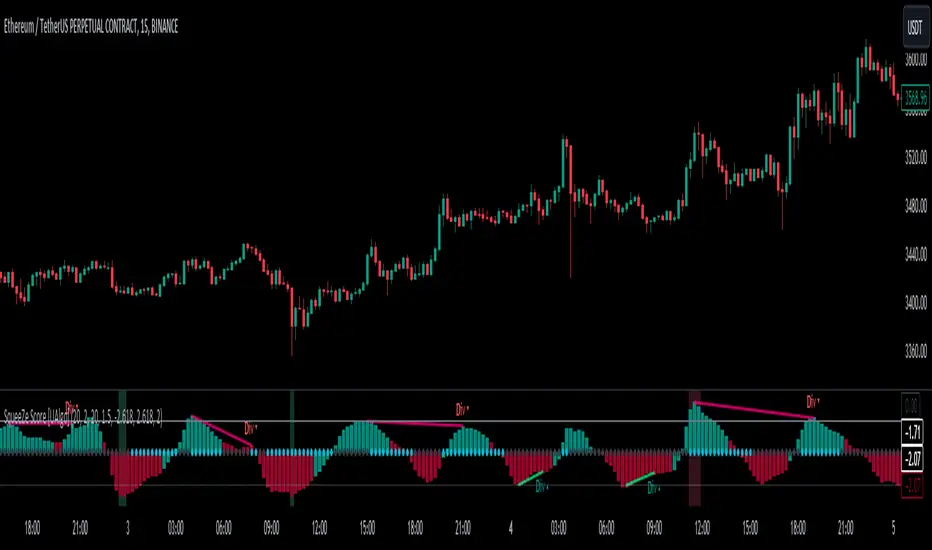
SqueeZe Score [UAlgo]The "SqueeZe Score" is a script based on the "Squeeze Momentum Indicator". It utilizes Bollinger Bands (BB) and Keltner Channels (KC) to identify periods of low volatility, indicating potential upcoming price movements. The Z-Score method is employed to measure deviations from the mean, highlighting extreme price movements within the context of the current volatility environment. This script provides traders with visual cues for potential bullish and bearish divergences, aiding in decision-making during trading activities.
🔶Key Features:
SqueeZe Settings: Users can customize parameters such as the length and multiplier factors for Bollinger Bands and Keltner Channels, providing flexibility to adapt the indicator to different trading strategies and market conditions.
Divergence Detection: The script includes options to detect and display both bullish and bearish divergences, providing additional insights into potential trend reversals or continuations.
Customizable Z-Score Thresholds: Thresholds for the Z-Score are user-defined, enabling traders to set levels at which extreme price movements are highlighted on the chart, facilitating quick identification of significant market conditions.
🔶Credit:
This script is inspired by the work of @LazyBear, who contributed to the original concept and development of the Squeeze Momentum indicator.
🔶Disclaimer:
- The information provided by this script is for educational and informational purposes only and should not be construed as financial advice.
- Users are encouraged to conduct their own research and analysis before making any investment decisions.
Bollinger bands / Connectable [Azullian]Deepen your understanding of market volatility using Bollinger Bands. This tool helps in discerning price movements and volatility trends, essential for crafting effective strategies.
This connectable Bollinger bands indicator is part of an indicator system designed to help test, visualize and build strategy configurations without coding. Like all connectable indicators , it interacts through the TradingView input source, which serves as a signal connector to link indicators to each other. All connectable indicators send signal weight to the next node in the system until it reaches either a connectable signal monitor, signal filter and/or strategy.
█ UNIFORM SETTINGS AND A WAY OF WORK
Although connectable indicators may have specific weight scoring conditions, they all aim to follow a standardized general approach to weight scoring settings, as outlined below.
■ Connectable indicators - Settings
• 🗲 Energy: Energy applies an ATR multiplier to the plotted shapes on the chart. A higher value plots shapes farther away from the candle, enhancing visibility.
• ☼ Brightness: Brightness determines the opacity of the shape plotted on the chart, aiding visibility. Indicator weight also influences opacity.
• → Input: Use the input setting to specify a data source for the indicator. Here you can connect the indicator to other indicators.
• ⌥ Flow: Determine where you want to receive signals from:
○ Both: Weights from this indicator and the connected indicator will apply
○ Indicator only: Only weights from this indicator will apply
○ Input only: Only weights from the connected indicator will apply
• ⥅ Weight multiplier: Multiply all weights in the entire indicator by a given factor, useful for quickly testing different indicators in a granular setup.
• ⥇ Threshold: Set a threshold to indicate the minimum amount of weight it should receive to pass it through to the next indicator.
• ⥱ Limiter: Set a hard limit to the maximum amount of weight that can be fed through the indicator.
■ Connectable indicators - Weight scoring settings
▢ Weight scoring conditions
• SM – Signal mode: Enable specific conditions for weight scoring
○ All: All signals will be scored.
○ Entries only: Only entries will score
○ Exits only: Only exits will score.
○ Entries & exits: Both entries and exits will score.
○ Zone: Continuous scoring for each candle within the zone.
• SP – Signal period: Defines a range of candles within which a signal can score.
• SC - Signal count: Specifies the number of bars to retrospectively examine and score.
○ Single: Score for a single occurrence
○ All occurrences: Score for all occurrences
○ Single + Threshold: Score for single occurrences within the signal period (SP)
○ Every + Threshold: Score for all occurrences within the signal period (SP)
▢ Weight scoring direction
• ES: Enter Short weight
• XL: Exit long weight
• EL: Enter Long weight
• XS: Exit Short weight
▢ Weight scoring values
• Weights can hold either positive or negative scores. Positive weights enhance a particular trading direction, while negative weights diminish it.
█ Bollinger bands - INDICATOR SETTINGS
■ Main settings
• Enable/Disable Indicator: Toggle the entire indicator on or off.
• S - Source: Choose an alternative data source for the Bollinger bands calculation.
• T - Timeframe: Select an alternative timeframe for the Bollinger bands calculation.
• LE - Length: Determine the period the bollinger bands are calculated on
• SD - Standard deviation: Determine the standard deviation for the bollinger bands.
• Enable/Disable plotting: Toggle the plotting of the Bollinger bands
• U: Choose a color for the upper band
• B: Choose a color for the basis
• L: Choose a color for the lower band
• BG: Choose a color for Bollinger bands background
■ Scoring functionality
• The Bollinger bands score long entries when the current low price is smaller than the lower band.
• The Bollinger bands score long exits when the current high price is higher than the upper band.
• The Bollinger bands score long zones the entire time the current low price is smaller than the lower band.
• The Bollinger bands score short entries when the current high is higher than the upper band.
• The Bollinger bands score short exits when the current low is smaller than the lower band.
• The Bollinger bands score short zones the entire time the current high price is higher than the upper band.
█ PLOTTING
• Standard: Symbols (EL, XS, ES, XL) appear relative to candles based on set conditions. Their opacity and position vary with weight.
• Conditional Settings: A larger icon appears if global conditions are met. For instance, with a Threshold(⥇) of 12, Signal Period (SP) of 3, and Scoring Condition (SC) set to "EVERY", a Bollinger bands signaling over two times in 3 candles (scoring 6 each) triggers a larger icon.
█ USAGE OF CONNECTABLE INDICATORS
■ Connectable chaining mechanism
Connectable indicators can be connected directly to the signal monitor, signal filter or strategy , or they can be daisy chained to each other while the last indicator in the chain connects to the signal monitor, signal filter or strategy. When using a signal filter you can chain the filter to the strategy input to make your chain complete.
• Direct chaining: Connect an indicator directly to the signal monitor, signal filter or strategy through the provided inputs (→).
• Daisy chaining: Connect indicators using the indicator input (→). The first in a daisy chain should have a flow (⌥) set to 'Indicator only'. Subsequent indicators use 'Both' to pass the previous weight. The final indicator connects to the signal monitor, signal filter, or strategy.
■ Set up this indicator with a signal filter and strategy
The indicator provides visual cues based on signal conditions. However, its weight system is best utilized when paired with a connectable signal filter, signal monitor, and/or strategy .
Let's connect the Bollinger bands to a connectable signal filter and a strategy :
1. Load all relevant indicators
• Load Bollinger bands / Connectable
• Load Signal filter / Connectable
• Load Strategy / Connectable
2. Signal Filter: Connect the Bollinger bands to the Signal Filter
• Open the signal filter settings
• Choose one of the three input dropdowns (1→, 2→, 3→) and choose : Bollinger bands / Connectable: Signal Connector
• Toggle the enable box before the connected input to enable the incoming signal
3. Signal Filter: Update the filter signals settings if needed
• The default settings of the filter enable EL (Enter Long), XL (Exit Long), ES (Enter Short) and XS (Exit Short).
4. Signal Filter: Update the weight threshold settings if needed
• All connectable indicators load by default with a score of 6 for each direction (EL, XL, ES, XS)
• By default, weight threshold (TH) is set at 5. This allows each occurrence to score, as the default score in each connectable indicator is 1 point above the threshold. Adjust to your liking.
5. Strategy: Connect the strategy to the signal filter in the strategy settings
• Select a strategy input → and select the Signal filter: Signal connector
6. Strategy: Enable filter compatible directions
• Set the signal mode of the strategy to a compatible direction with the signal filter.
Now that everything is connected, you'll notice green spikes in the signal filter representing long signals, and red spikes indicating short signals. Trades will also appear on the chart, complemented by a performance overview. Your journey is just beginning: delve into different scoring mechanisms, merge diverse connectable indicators, and craft unique chains. Instantly test your results and discover the potential of your configurations. Dive deep and enjoy the process!
█ BENEFITS
• Adaptable Modular Design: Arrange indicators in diverse structures via direct or daisy chaining, allowing tailored configurations to align with your analysis approach.
• Streamlined Backtesting: Simplify the iterative process of testing and adjusting combinations, facilitating a smoother exploration of potential setups.
• Intuitive Interface: Navigate TradingView with added ease. Integrate desired indicators, adjust settings, and establish alerts without delving into complex code.
• Signal Weight Precision: Leverage granular weight allocation among signals, offering a deeper layer of customization in strategy formulation.
• Advanced Signal Filtering: Define entry and exit conditions with more clarity, granting an added layer of strategy precision.
• Clear Visual Feedback: Distinct visual signals and cues enhance the readability of charts, promoting informed decision-making.
• Standardized Defaults: Indicators are equipped with universally recognized preset settings, ensuring consistency in initial setups across different types like momentum or volatility.
• Reliability: Our indicators are meticulously developed to prevent repainting. We strictly adhere to TradingView's coding conventions, ensuring our code is both performant and clean.
█ COMPATIBLE INDICATORS
Each indicator that incorporates our open-source 'azLibConnector' library and adheres to our conventions can be effortlessly integrated and used as detailed above.
For clarity and recognition within the TradingView platform, we append the suffix ' / Connectable' to every compatible indicator.
█ COMMON MISTAKES, CLARIFICATIONS AND TIPS
• Removing an indicator from a chain: Deleting a linked indicator and confirming the "remove study tree" alert will also remove all underlying indicators in the object tree. Before removing one, disconnect the adjacent indicators and move it to the object stack's bottom.
• Point systems: The azLibConnector provides 500 points for each direction (EL: Enter long, XL: Exit long, ES: Enter short, XS: Exit short) Remember this cap when devising a point structure.
• Flow misconfiguration: In daisy chains the first indicator should always have a flow (⌥) setting of 'indicator only' while other indicator should have a flow (⌥) setting of 'both'.
• Hide attributes: As connectable indicators send through quite some information you'll notice all the arguments are taking up some screenwidth and cause some visual clutter. You can disable arguments in Chart Settings / Status line.
• Layout and abbreviations: To maintain a consistent structure, we use abbreviations for each input. While this may initially seem complex, you'll quickly become familiar with them. Each abbreviation is also explained in the inline tooltips.
• Inputs: Connecting a connectable indicator directly to the strategy delivers the raw signal without a weight threshold, meaning every signal will trigger a trade.
█ A NOTE OF GRATITUDE
Through years of exploring TradingView and Pine Script, we've drawn immense inspiration from the community's knowledge and innovation. Thank you for being a constant source of motivation and insight.
█ RISK DISCLAIMER
Azullian's content, tools, scripts, articles, and educational offerings are presented purely for educational and informational uses. Please be aware that past performance should not be considered a predictor of future results.

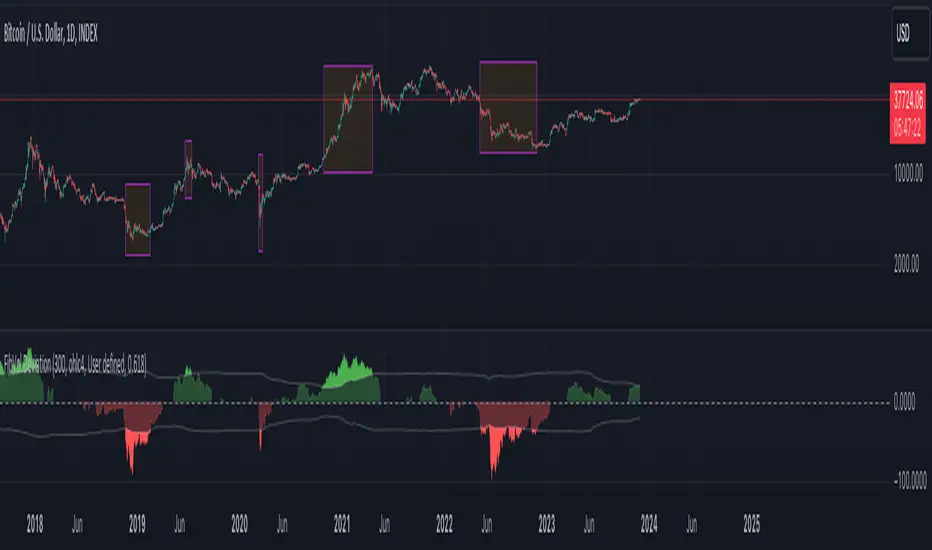
Fibonacci Bollinger Volume Weighted DeviationDiscover market dynamics with the 'Fibonacci Bollinger Volume Weighted Deviation' indicator – a unique tool blending Fibonacci ratios, Bollinger Bands, and volume-weighted analysis. Ideal for spotting overbought/oversold conditions and potential market turnarounds, this indicator is a must-have for traders seeking nuanced insights into price behavior and volatility.
Description:
"The 'Fibonacci Bollinger Volume Weighted Deviation' indicator presents a novel approach to market trend analysis by integrating Fibonacci ratios with the classic concept of Bollinger Bands. Designed for traders who incorporate Fibonacci levels in their market analysis, this indicator adapts Bollinger Bands to a user-defined Fibonacci ratio. It creates dynamic upper and lower bands around a Simple Moving Average (SMA), offering insights into price deviations and potential overbought or oversold market states.
Incorporating volume data, this indicator provides a volume-weighted perspective of price deviations. This feature is crucial in gauging the market sentiment, as significant volumes linked with price deviations can signal strong market moves. By plotting these deviations and emphasizing those that significantly diverge from the volume-weighted average, it aids in pinpointing potential turning points or key support and resistance zones.
Versatile in nature, the 'Fibonacci Bollinger Volume Weighted Deviation' indicator is adaptable to various trading styles and market conditions. It proves especially valuable in markets where Fibonacci levels are a key factor. Traders can explore long positions when prices fall below the lower band and consider short positions when prices breach the upper band. The addition of volume-weighted deviation analysis refines these trading signals, offering a more sophisticated and nuanced decision-making process for entries and exits.
As a standalone tool or in conjunction with other technical instruments, this indicator is an invaluable addition to any technical analyst's toolkit. It not only enhances traditional Fibonacci and Bollinger Band methodologies but also integrates volume analysis to provide a comprehensive view of market trends and movements."
Directional Bollinger Bands PredictorThis strategy works on the principal that if Bollinger bands are closer to each other then the price is sideways and if it expands then the market is trending.
The strategy is built with a standard deviation of 2 from the EMA 20 and with a range of 0.25.
Explanation of Input Settings:
1. EMA Length: Set as a standard 20 EMA however the trader can make changes if required
2. Standard Deviation Multiplier: This depicts the value of the bands that are formed in association to the EMA value. The default is set to 2 however the same can be changed by the trader.
3. Threshold Value: The threshold Value is the percentage of squeeze within the bands that show if the market is sideways or not. The standard is set at 0.25 however it can be changed.
Unlike the standard Bollinger Bands this indicator will help the user differentiate between rangebound markets and trending markets as a result of which the user can deploy the following trading systems
A. Small reversal trades from the upper band to the lower band when the area is highlighted and the market is range bound and
B. Trend following trades when the bands start expanding and the highlight is omitted.

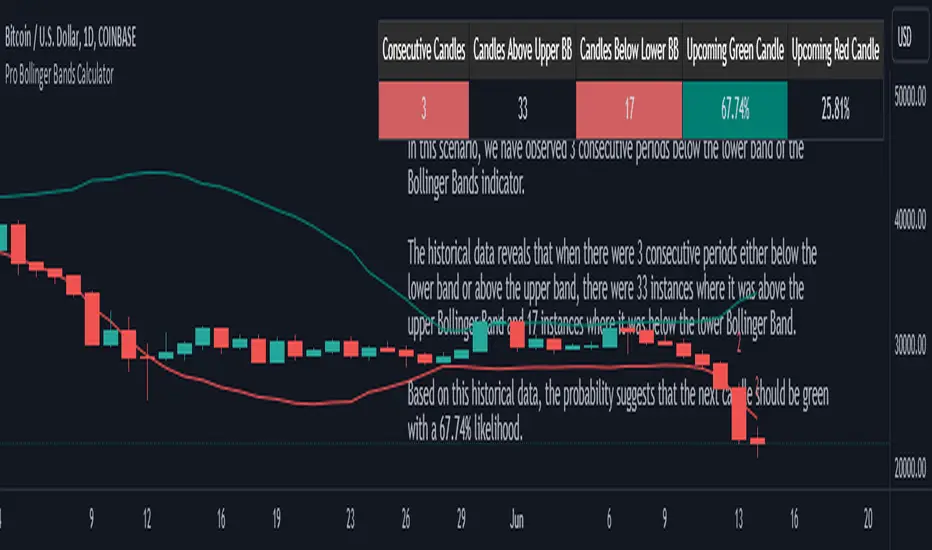
Pro Bollinger Bands CalculatorThe "Pro Bollinger Bands Calculator" indicator joins our suite of custom trading tools, which includes the "Pro Supertrend Calculator", the "Pro RSI Calculator" and the "Pro Momentum Calculator."
Expanding on this series, the "Pro Bollinger Bands Calculator" is tailored to offer traders deeper insights into market dynamics by harnessing the power of the Bollinger Bands indicator.
Its core mission remains unchanged: to scrutinize historical price data and provide informed predictions about future price movements, with a specific focus on detecting potential bullish (green) or bearish (red) candlestick patterns.
1. Bollinger Bands Calculation:
The indicator kicks off by computing the Bollinger Bands, a well-known volatility indicator. It calculates two pivotal Bollinger Bands parameters:
- Bollinger Bands Length: This parameter sets the lookback period for Bollinger Bands calculations.
- Bollinger Bands Deviation: It determines the deviation multiplier for the upper and lower bands, typically set at 2.0.
2. Visualizing Bollinger Bands:
The Bollinger Bands derived from the calculations are skillfully plotted on the price chart:
- Red Line: Represents the upper Bollinger Band during bearish trends, suggesting potential price declines.
- Teal Line: Represents the lower Bollinger Band in bullish market conditions, signaling the possibility of price increases.
3.Analyzing Consecutive Candlesticks:
The indicator's core functionality revolves around tracking consecutive candlestick patterns based on their relationship with the Bollinger Bands lines. To be considered for analysis, a candlestick must consistently close either above (green candles) or below (red candles) the Bollinger Bands lines for multiple consecutive periods.
4. Labeling and Enumeration:
To convey the count of consecutive candles displaying consistent trend behavior, the indicator meticulously assigns labels to the price chart. The position of these labels varies depending on the direction of the trend, appearing either below (for bullish patterns) or above (for bearish patterns) the candlesticks. The label colors match the candle colors: green labels for bullish candles and red labels for bearish ones.
5. Tabular Data Presentation:
The indicator complements its graphical analysis with a customizable table that prominently displays comprehensive statistical insights. Key data points within the table encompass:
- Consecutive Candles: The count of consecutive candles displaying consistent trend characteristics.
- Candles Above Upper BB: The number of candles closing above the upper Bollinger Band during the consecutive period.
- Candles Below Lower BB: The number of candles closing below the lower Bollinger Band during the consecutive period.
- Upcoming Green Candle: An estimated probability of the next candlestick being bullish, derived from historical data.
- Upcoming Red Candle: An estimated probability of the next candlestick being bearish, also based on historical data.
6. Custom Configuration:
To cater to diverse trading strategies and preferences, the indicator offers extensive customization options. Traders can fine-tune parameters such as Bollinger Bands length, upper and lower band deviations, label and table placement, and table size to align with their unique trading approaches.
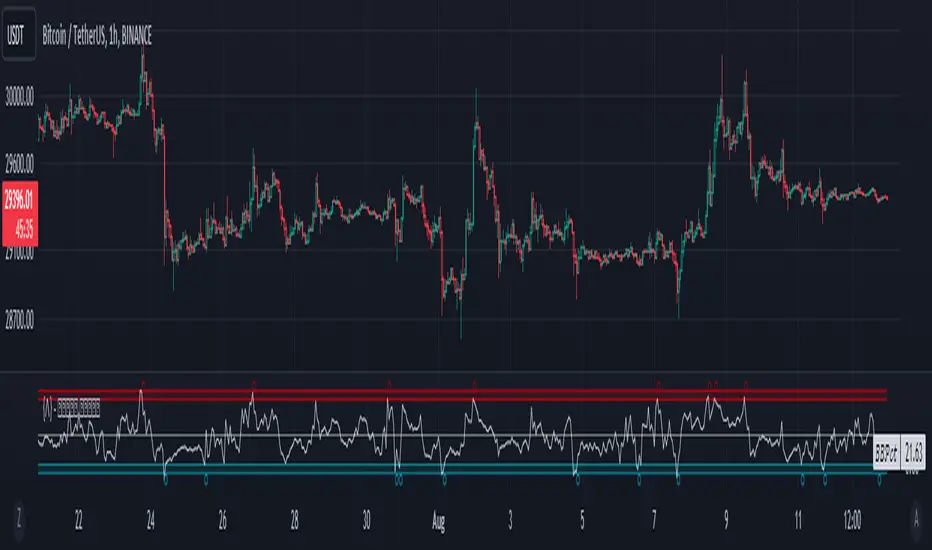
Bollinger Band Percentile SuiteThe Bollinger Band Percentile Suite (𝐵𝐵𝒫𝒸𝓉 𝒮𝓊𝒾𝓉𝑒) is a comprehensive and customizable toolkit built upon the foundation of the %B indicator. The methodology behind this toolkit remains consistent with the original %B indicator, while introducing a host of powerful features to enhance its functionality and adaptability.
Key Features and Customization:
The 𝐵𝐵𝒫𝒸𝓉 offers a wide array of customizable options to suit your trading preferences and strategies. It includes a variety of 14 moving average types that can be chosen as the basis for the Bollinger Band calculation. Additionally, traders have the flexibility to set their upper and lower boundaries for mean reversion detection, allowing for analysis tailored to the user's preference.
Deviation Calculation:
The toolkit provides an option to choose between standard and weighted deviation calculation methods. This added customization ensures that the indicator's behavior aligns with your unique trading style and preferences.
Signals and Reversals:
The 𝐵𝐵𝒫𝒸𝓉 excels in identifying potential overbought and oversold market conditions. It highlights these levels on the chart and marks potential reversal signals with small circles positioned either at the top or bottom of the indicator pane, providing traders with actionable insights.
Trend and Color Coding:
Incorporating a color-coded approach, the BBpct Suite enhances your understanding of market dynamics. It offers bar coloring options based on trend, allowing traders to identify bullish or bearish market conditions as the percentile goes above or below the midline.
Extremities and Reversions:
Recognizing extreme market conditions is crucial for traders. The 𝐵𝐵𝒫𝒸𝓉 includes color-coded indicators for extremities, indicating when the percentile ventures above or below the predefined thresholds. Moreover, it promptly identifies reversions by marking the moment the percentile crosses under the upper threshold (overbought) or over the lower threshold (oversold).
The Bollinger Band Percentile Suite equips traders with a versatile toolkit to gain valuable insights into market overbought and oversold conditions, and potential reversal signals. Its extensive customization options and array of features empower traders to make well-informed decisions based on their unique trading strategies and risk tolerance.
Please note that while the BBpct Suite provides robust analysis, it is advisable to combine its insights with other technical indicators and tools for a comprehensive trading approach.
Example Chart:
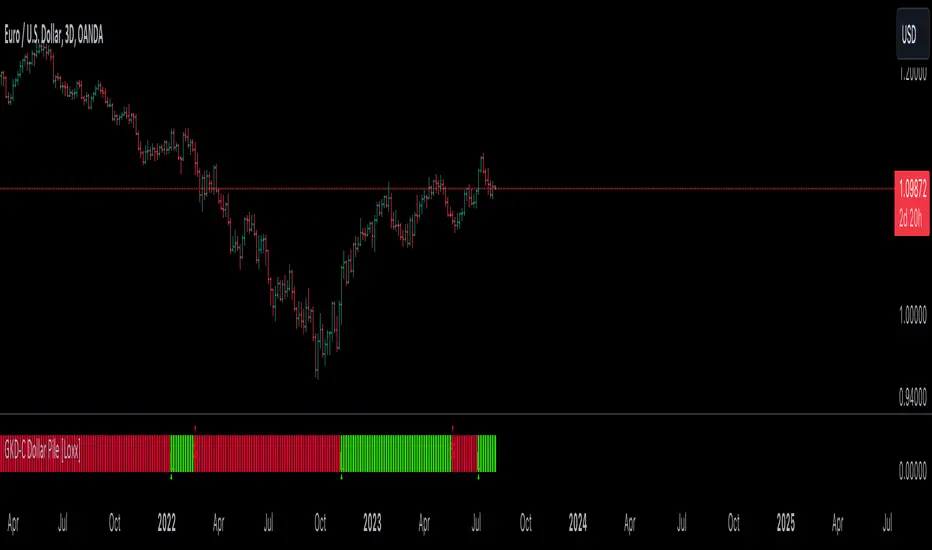
GKD-C Dollar Pile [Loxx]The Giga Kaleidoscope GKD-C Dollar Pile is a confirmation module included in Loxx's "Giga Kaleidoscope Modularized Trading System."
█ GKD-C Dollar Pile
Dollar Pile applies a custom strategy using Bollinger Bands, calculated from an asset's closing price. Based on the closing price's position relative to the bands, trading signals are produced. The bands can be further adjusted based on these signals. The outcome is visualized as a histogram, colored either green or red, representing the trading signal's direction.
█ Giga Kaleidoscope Modularized Trading System
Core components of an NNFX algorithmic trading strategy
The NNFX algorithm is built on the principles of trend, momentum, and volatility. There are six core components in the NNFX trading algorithm:
1. Volatility - price volatility; e.g., Average True Range, True Range Double, Close-to-Close, etc.
2. Baseline - a moving average to identify price trend
3. Confirmation 1 - a technical indicator used to identify trends
4. Confirmation 2 - a technical indicator used to identify trends
5. Continuation - a technical indicator used to identify trends
6. Volatility/Volume - a technical indicator used to identify volatility/volume breakouts/breakdown
7. Exit - a technical indicator used to determine when a trend is exhausted
8. Metamorphosis - a technical indicator that produces a compound signal from the combination of other GKD indicators*
*(not part of the NNFX algorithm)
What is Volatility in the NNFX trading system?
In the NNFX (No Nonsense Forex) trading system, ATR (Average True Range) is typically used to measure the volatility of an asset. It is used as a part of the system to help determine the appropriate stop loss and take profit levels for a trade. ATR is calculated by taking the average of the true range values over a specified period.
True range is calculated as the maximum of the following values:
-Current high minus the current low
-Absolute value of the current high minus the previous close
-Absolute value of the current low minus the previous close
ATR is a dynamic indicator that changes with changes in volatility. As volatility increases, the value of ATR increases, and as volatility decreases, the value of ATR decreases. By using ATR in NNFX system, traders can adjust their stop loss and take profit levels according to the volatility of the asset being traded. This helps to ensure that the trade is given enough room to move, while also minimizing potential losses.
Other types of volatility include True Range Double (TRD), Close-to-Close, and Garman-Klass
What is a Baseline indicator?
The baseline is essentially a moving average, and is used to determine the overall direction of the market.
The baseline in the NNFX system is used to filter out trades that are not in line with the long-term trend of the market. The baseline is plotted on the chart along with other indicators, such as the Moving Average (MA), the Relative Strength Index (RSI), and the Average True Range (ATR).
Trades are only taken when the price is in the same direction as the baseline. For example, if the baseline is sloping upwards, only long trades are taken, and if the baseline is sloping downwards, only short trades are taken. This approach helps to ensure that trades are in line with the overall trend of the market, and reduces the risk of entering trades that are likely to fail.
By using a baseline in the NNFX system, traders can have a clear reference point for determining the overall trend of the market, and can make more informed trading decisions. The baseline helps to filter out noise and false signals, and ensures that trades are taken in the direction of the long-term trend.
What is a Confirmation indicator?
Confirmation indicators are technical indicators that are used to confirm the signals generated by primary indicators. Primary indicators are the core indicators used in the NNFX system, such as the Average True Range (ATR), the Moving Average (MA), and the Relative Strength Index (RSI).
The purpose of the confirmation indicators is to reduce false signals and improve the accuracy of the trading system. They are designed to confirm the signals generated by the primary indicators by providing additional information about the strength and direction of the trend.
Some examples of confirmation indicators that may be used in the NNFX system include the Bollinger Bands, the MACD (Moving Average Convergence Divergence), and the MACD Oscillator. These indicators can provide information about the volatility, momentum, and trend strength of the market, and can be used to confirm the signals generated by the primary indicators.
In the NNFX system, confirmation indicators are used in combination with primary indicators and other filters to create a trading system that is robust and reliable. By using multiple indicators to confirm trading signals, the system aims to reduce the risk of false signals and improve the overall profitability of the trades.
What is a Continuation indicator?
In the NNFX (No Nonsense Forex) trading system, a continuation indicator is a technical indicator that is used to confirm a current trend and predict that the trend is likely to continue in the same direction. A continuation indicator is typically used in conjunction with other indicators in the system, such as a baseline indicator, to provide a comprehensive trading strategy.
What is a Volatility/Volume indicator?
Volume indicators, such as the On Balance Volume (OBV), the Chaikin Money Flow (CMF), or the Volume Price Trend (VPT), are used to measure the amount of buying and selling activity in a market. They are based on the trading volume of the market, and can provide information about the strength of the trend. In the NNFX system, volume indicators are used to confirm trading signals generated by the Moving Average and the Relative Strength Index. Volatility indicators include Average Direction Index, Waddah Attar, and Volatility Ratio. In the NNFX trading system, volatility is a proxy for volume and vice versa.
By using volume indicators as confirmation tools, the NNFX trading system aims to reduce the risk of false signals and improve the overall profitability of trades. These indicators can provide additional information about the market that is not captured by the primary indicators, and can help traders to make more informed trading decisions. In addition, volume indicators can be used to identify potential changes in market trends and to confirm the strength of price movements.
What is an Exit indicator?
The exit indicator is used in conjunction with other indicators in the system, such as the Moving Average (MA), the Relative Strength Index (RSI), and the Average True Range (ATR), to provide a comprehensive trading strategy.
The exit indicator in the NNFX system can be any technical indicator that is deemed effective at identifying optimal exit points. Examples of exit indicators that are commonly used include the Parabolic SAR, the Average Directional Index (ADX), and the Chandelier Exit.
The purpose of the exit indicator is to identify when a trend is likely to reverse or when the market conditions have changed, signaling the need to exit a trade. By using an exit indicator, traders can manage their risk and prevent significant losses.
In the NNFX system, the exit indicator is used in conjunction with a stop loss and a take profit order to maximize profits and minimize losses. The stop loss order is used to limit the amount of loss that can be incurred if the trade goes against the trader, while the take profit order is used to lock in profits when the trade is moving in the trader's favor.
Overall, the use of an exit indicator in the NNFX trading system is an important component of a comprehensive trading strategy. It allows traders to manage their risk effectively and improve the profitability of their trades by exiting at the right time.
What is an Metamorphosis indicator?
The concept of a metamorphosis indicator involves the integration of two or more GKD indicators to generate a compound signal. This is achieved by evaluating the accuracy of each indicator and selecting the signal from the indicator with the highest accuracy. As an illustration, let's consider a scenario where we calculate the accuracy of 10 indicators and choose the signal from the indicator that demonstrates the highest accuracy.
The resulting output from the metamorphosis indicator can then be utilized in a GKD-BT backtest by occupying a slot that aligns with the purpose of the metamorphosis indicator. The slot can be a GKD-B, GKD-C, or GKD-E slot, depending on the specific requirements and objectives of the indicator. This allows for seamless integration and utilization of the compound signal within the GKD-BT framework.
How does Loxx's GKD (Giga Kaleidoscope Modularized Trading System) implement the NNFX algorithm outlined above?
Loxx's GKD v2.0 system has five types of modules (indicators/strategies). These modules are:
1. GKD-BT - Backtesting module (Volatility, Number 1 in the NNFX algorithm)
2. GKD-B - Baseline module (Baseline and Volatility/Volume, Numbers 1 and 2 in the NNFX algorithm)
3. GKD-C - Confirmation 1/2 and Continuation module (Confirmation 1/2 and Continuation, Numbers 3, 4, and 5 in the NNFX algorithm)
4. GKD-V - Volatility/Volume module (Confirmation 1/2, Number 6 in the NNFX algorithm)
5. GKD-E - Exit module (Exit, Number 7 in the NNFX algorithm)
6. GKD-M - Metamorphosis module (Metamorphosis, Number 8 in the NNFX algorithm, but not part of the NNFX algorithm)
(additional module types will added in future releases)
Each module interacts with every module by passing data to A backtest module wherein the various components of the GKD system are combined to create a trading signal.
That is, the Baseline indicator passes its data to Volatility/Volume. The Volatility/Volume indicator passes its values to the Confirmation 1 indicator. The Confirmation 1 indicator passes its values to the Confirmation 2 indicator. The Confirmation 2 indicator passes its values to the Continuation indicator. The Continuation indicator passes its values to the Exit indicator, and finally, the Exit indicator passes its values to the Backtest strategy.
This chaining of indicators requires that each module conform to Loxx's GKD protocol, therefore allowing for the testing of every possible combination of technical indicators that make up the six components of the NNFX algorithm.
What does the application of the GKD trading system look like?
Example trading system:
Backtest: Multi-Ticker CC Backtest
Baseline: Hull Moving Average
Volatility/Volume: Hurst Exponent
Confirmation 1: Dollar Pile as shown on the chart above
Confirmation 2: uf2018
Continuation: Coppock Curve
Exit: Rex Oscillator
Metamorphosis: Baseline Optimizer
Each GKD indicator is denoted with a module identifier of either: GKD-BT, GKD-B, GKD-C, GKD-V, GKD-M, or GKD-E. This allows traders to understand to which module each indicator belongs and where each indicator fits into the GKD system.
█ Giga Kaleidoscope Modularized Trading System Signals
Standard Entry
1. GKD-C Confirmation gives signal
2. Baseline agrees
3. Price inside Goldie Locks Zone Minimum
4. Price inside Goldie Locks Zone Maximum
5. Confirmation 2 agrees
6. Volatility/Volume agrees
1-Candle Standard Entry
1a. GKD-C Confirmation gives signal
2a. Baseline agrees
3a. Price inside Goldie Locks Zone Minimum
4a. Price inside Goldie Locks Zone Maximum
Next Candle
1b. Price retraced
2b. Baseline agrees
3b. Confirmation 1 agrees
4b. Confirmation 2 agrees
5b. Volatility/Volume agrees
Baseline Entry
1. GKD-B Baseline gives signal
2. Confirmation 1 agrees
3. Price inside Goldie Locks Zone Minimum
4. Price inside Goldie Locks Zone Maximum
5. Confirmation 2 agrees
6. Volatility/Volume agrees
7. Confirmation 1 signal was less than 'Maximum Allowable PSBC Bars Back' prior
1-Candle Baseline Entry
1a. GKD-B Baseline gives signal
2a. Confirmation 1 agrees
3a. Price inside Goldie Locks Zone Minimum
4a. Price inside Goldie Locks Zone Maximum
5a. Confirmation 1 signal was less than 'Maximum Allowable PSBC Bars Back' prior
Next Candle
1b. Price retraced
2b. Baseline agrees
3b. Confirmation 1 agrees
4b. Confirmation 2 agrees
5b. Volatility/Volume agrees
Volatility/Volume Entry
1. GKD-V Volatility/Volume gives signal
2. Confirmation 1 agrees
3. Price inside Goldie Locks Zone Minimum
4. Price inside Goldie Locks Zone Maximum
5. Confirmation 2 agrees
6. Baseline agrees
7. Confirmation 1 signal was less than 7 candles prior
1-Candle Volatility/Volume Entry
1a. GKD-V Volatility/Volume gives signal
2a. Confirmation 1 agrees
3a. Price inside Goldie Locks Zone Minimum
4a. Price inside Goldie Locks Zone Maximum
5a. Confirmation 1 signal was less than 'Maximum Allowable PSVVC Bars Back' prior
Next Candle
1b. Price retraced
2b. Volatility/Volume agrees
3b. Confirmation 1 agrees
4b. Confirmation 2 agrees
5b. Baseline agrees
Confirmation 2 Entry
1. GKD-C Confirmation 2 gives signal
2. Confirmation 1 agrees
3. Price inside Goldie Locks Zone Minimum
4. Price inside Goldie Locks Zone Maximum
5. Volatility/Volume agrees
6. Baseline agrees
7. Confirmation 1 signal was less than 7 candles prior
1-Candle Confirmation 2 Entry
1a. GKD-C Confirmation 2 gives signal
2a. Confirmation 1 agrees
3a. Price inside Goldie Locks Zone Minimum
4a. Price inside Goldie Locks Zone Maximum
5a. Confirmation 1 signal was less than 'Maximum Allowable PSC2C Bars Back' prior
Next Candle
1b. Price retraced
2b. Confirmation 2 agrees
3b. Confirmation 1 agrees
4b. Volatility/Volume agrees
5b. Baseline agrees
PullBack Entry
1a. GKD-B Baseline gives signal
2a. Confirmation 1 agrees
3a. Price is beyond 1.0x Volatility of Baseline
Next Candle
1b. Price inside Goldie Locks Zone Minimum
2b. Price inside Goldie Locks Zone Maximum
3b. Confirmation 1 agrees
4b. Confirmation 2 agrees
5b. Volatility/Volume agrees
Continuation Entry
1. Standard Entry, 1-Candle Standard Entry, Baseline Entry, 1-Candle Baseline Entry, Volatility/Volume Entry, 1-Candle Volatility/Volume Entry, Confirmation 2 Entry, 1-Candle Confirmation 2 Entry, or Pullback entry triggered previously
2. Baseline hasn't crossed since entry signal trigger
4. Confirmation 1 agrees
5. Baseline agrees
6. Confirmation 2 agrees
VWAP Xing D, Prv.D, W, Q, M, & Y + SD [UOI]Introducing the "VWAP Xing D, Prv.D, W, Q, M, & Y + SD" Indicator: A Comprehensive, Multi-Timeframe Trading Tool for the Modern Trader
In today's dynamic and fast-paced financial markets, traders require versatile and powerful tools that can help them navigate the complex world of trading. The "VWAP Xing D, Prv.D, W, Q, M, & Y + SD" indicator is designed to be the ultimate, all-in-one solution for traders seeking a comprehensive and robust trading indicator. This cutting-edge tool combines the power of an extensive VWAP library with the versatility of Bollinger Bands, Donchian Channels, standard deviation multi-timeframe analysis, and an auto boxed range identifier, all to provide traders with the crucial insights needed to identify reversals, breakdowns, and breakups.
Offering the magnetic daily, previous day, weekly, monthly, quarterly, and even yearly VWAP levels, this comprehensive library caters to traders with varying time horizons and strategies. Coupled with the precision of Bollinger Bands and Donchian Channels, the indicator allows for accurate tracking of price volatility, enabling traders to make more informed decisions in response to changing market conditions. The integration of multi-timeframe standard deviation analysis further bolsters the indicator's ability to identify potential trading opportunities, ensuring that users can stay ahead of the curve.
Finally, the auto boxed range identifier serves as the cherry on top, automatically detecting critical price levels where reversals, breakdowns, and breakups are most likely to occur. This powerful feature not only helps traders confirm potential entry and exit points but also allows for more effective risk management.
Overall, the "VWAP Xing D, Prv.D, W, Q, M, & Y + SD" indicator is a comprehensive, multi-timeframe trading tool that empowers traders with unparalleled insights, precision, and adaptability. Whether you're a seasoned professional or a novice trader, this powerful indicator is a must-have tool for anyone looking to excel in today's competitive financial markets.
Multi-timeframe Volume Weighted Average
First let's define Volume Weighted Average Price (VWAP):
Volume Weighted Average Price (VWAP) is a widely-used technical analysis indicator that calculates the average price of a security, taking into account both price and trading volume. In essence, it represents the average price at which a security has been traded throughout a specified time period, giving more weight to transactions with higher volume.
The VWAP is often used by traders and investors to assess the market's trend and gauge the relative value of a security. It serves as a benchmark for institutional investors, who often use it to evaluate their trading performance and determine whether they are buying or selling at favorable prices.
The formula for calculating VWAP is:
VWAP = (Sum of (Price * Volume)) / Total Volume
By incorporating volume into the calculation, the VWAP provides a more accurate representation of a security's true average price, as it takes into consideration the impact of larger trades on the price. This makes it a valuable tool for traders seeking to make more informed decisions in the market and avoid getting caught in unfavorable trading positions.
VWAP is a crucial indicator that provides insights into the average price at which a financial asset, such as a stock or cryptocurrency, has been traded throughout a specific period. It takes into consideration the volume of trades executed at each price level during that period. The VWAP lines included in the " VWAP Xing D, Prv. D, W, Q, M, & Y" indicator offer various timeframe perspectives, allowing traders to analyze different levels of market trends and behaviors.
Here's a detailed explanation of the VWAP lines and their significance:
1. Daily VWAP (D): The daily VWAP line represents the average price at which the asset has been traded throughout the current trading day. It resets at the beginning of each trading session. Traders often use the daily VWAP as a reference point to gauge the fairness of their trade executions relative to the prevailing market prices. Price deviations from the daily VWAP can indicate shifts in market sentiment and potential trading opportunities.
2. Previous Day VWAP (Prv.D): The previous day VWAP line reflects the average price at which the asset was traded during the preceding trading day. It helps traders assess the continuity or deviation of the current day's price action relative to the previous day's trading activity. Traders often observe the previous day VWAP for insights into potential support or resistance levels and to identify whether the current day's price is trading above or below the previous day's average price.
3. Weekly VWAP (W): The weekly VWAP line calculates the average price of the asset over the entire week, taking into account the volume traded at each price level. Traders use the weekly VWAP to gain a broader perspective on the asset's price movement and potential trend directions. It can act as a significant support or resistance level, especially when the price interacts with the weekly VWAP.
4. Monthly VWAP (M): The monthly VWAP line provides a longer-term perspective by averaging the asset's price and volume data over the entire month. It helps traders identify key price levels that are significant within the monthly timeframe. Traders often observe the monthly VWAP to assess the overall trend and to determine whether the current price is trading above or below the monthly average.
5. Quarterly VWAP (Q): The quarterly VWAP line calculates the average price and volume data over a three-month period, representing a longer-term view of market activity. Traders use the quarterly VWAP to identify significant price levels and to analyze the broader trend within the quarterly timeframe. Deviations from the quarterly VWAP can indicate potential shifts in market sentiment and trading opportunities.
6. Yearly VWAP (Y): The yearly VWAP line represents the average price and volume data over the course of a year. It offers a comprehensive long-term perspective on the asset's price behavior and trend. Traders often consider the yearly VWAP as a key reference point for assessing the asset's overall performance and identifying major support or resistance levels.
By observing the VWAP lines, traders can gain insights into the prevailing market sentiment, potential support or resistance levels, and deviations from average prices. These deviations can be useful for identifying potential trading opportunities, such as when the price significantly deviates from the VWAP lines, suggesting potential overbought or oversold conditions. Additionally, VWAP can serve as a benchmark for evaluating trade executions and assessing the fair value of an asset.
It's important to note that while VWAP is a valuable tool, it should be used in conjunction with other technical analysis indicators and strategies to make informed trading decisions. Traders should consider factors like market context, trend analysis, and risk management principles to validate signals and confirm potential trading opportunities.
Bollinger Bands and Donchian Channels
In addition to VWAP this indicator also has combined the power of Bollinger Bands and Donchian Channels to produce a solid framework. The time frame by default is set to 30 min which is good for intraday trading but you can also change that in the setting to always use chart time frame intervals which works better on longer time frames.
IMPORTANT: You can change the time frame to always use chart or keep the default on 30 min or change it to another timeframe manually. If you allow the chart to always provide the intervals then the default 30 min will be ineffective and it automatically adjust to chart timeframe. Personally I think a fixed timeframe work better so keep in that way if you trade on 30 min or lower time frame.
Bollinger Bands and Donchian Channels are two popular technical analysis tools that provide valuable insights into price volatility, potential breakout levels, and support/resistance areas. When used in combination, they offer a comprehensive framework for analyzing market conditions and identifying trading opportunities.
Bollinger Bands: Bollinger Bands consist of two lines plotted above and below a moving average, typically a simple moving average (SMA). The upper band is calculated by adding the standard deviation of price multiplied by a customizable standard deviation factor to the SMA. The lower band is calculated by subtracting the standard deviation multiplied by the same factor from the SMA. The key features of Bollinger Bands are as follows:
1. Volatility Measurement: Bollinger Bands expand and contract based on market volatility. When the bands widen, it indicates higher volatility, and when they narrow, it suggests lower volatility. Traders can observe the width of the bands to gauge the potential for price movements and volatility expansions.
2. Overbought/Oversold Levels: Bollinger Bands can help identify overbought and oversold conditions in the market. When the price reaches or exceeds the upper band, it may indicate that the asset is overbought and due for a potential reversal or pullback. Conversely, when the price reaches or falls below the lower band, it may suggest oversold conditions and a possible bounce or reversal.
Donchian Channels: Donchian Channels consist of two lines representing the highest high and lowest low within a specified period. The key characteristics of Donchian Channels are as follows:
1. Breakout Levels: The upper line of the Donchian Channel represents the highest high within the specified period, while the lower line represents the lowest low. Traders often use Donchian Channels to identify potential breakout levels. When the price breaks above the upper channel line, it may indicate a bullish breakout and the potential for further upward momentum. Conversely, a break below the lower channel line suggests a bearish breakout and the possibility of downward momentum.
2. Support/Resistance Areas: Donchian Channels also act as dynamic support and resistance levels. The upper channel line can act as a resistance level where the price may encounter selling pressure. The lower channel line can act as a support level where the price may find buying interest. Traders can monitor price interactions with these levels to make informed trading decisions.
Advantages of Using Bollinger Bands and Donchian Channels Together: By combining Bollinger Bands and Donchian Channels, traders can gain a more comprehensive view of market conditions and potential trading opportunities. Here are some advantages of using them together:
1. Volatility Confirmation: Bollinger Bands help identify periods of high or low volatility, while Donchian Channels confirm breakouts and potential trend changes. When the bands widen and a breakout occurs above or below the Donchian Channels, it can provide confirmation of increased volatility and the start of a new trend.
2. Price Extremes and Breakouts: Bollinger Bands assist in identifying overbought and oversold conditions, while Donchian Channels help pinpoint breakout levels. When price reaches an extreme level according to Bollinger Bands and coincides with a breakout from the Donchian Channels, it can signal a significant trading opportunity.
3. Support/Resistance Validation: Donchian Channels act as dynamic support and resistance levels, and Bollinger Bands can validate these levels. When price bounces off the upper or lower Bollinger Band near a Donchian Channel level, it provides additional confirmation of the support or resistance area.
4. Risk Management: The combination of Bollinger Bands and Donchian Channels enables traders to set more precise stop-loss levels and define risk. They can place stop-loss orders beyond the support or resistance levels identified.
Standard Deviation
Standard deviation bands by default are disabled but you can easily enable them in the setting. The 1 standard deviation bands are made invisible by default to avoid a crowded space. You can reduce the transparency to view them.
In intraday trading, the Daily VWAP (Volume Weighted Average Price) with 3 standard deviations is a powerful tool that helps traders gauge price movements and potential trading opportunities. Here's how it works and why it is useful:
1. Calculation of Daily VWAP: The Daily VWAP is the average price at which a security has traded throughout the trading day, weighted by the volume of each trade. It provides a measure of the average price that traders have paid for the asset during the day.
2. Standard Deviation: Standard deviation is a statistical measure that quantifies the dispersion or variability of prices around the Daily VWAP. It gives an indication of how much prices deviate from the average. A higher standard deviation suggests greater price volatility.
3. Three Standard Deviations: By adding and subtracting three times the standard deviation from the Daily VWAP, you create bands that represent the potential price range within which the majority of intraday trading activity is expected to occur. These bands act as potential support and resistance levels and help traders identify price extremes.
4. Price Reversals: When the intraday price extends beyond the upper or lower band (three standard deviations), it suggests an overextended move or potential price reversal. Traders interpret this as an opportunity to enter or exit trades. If the price moves beyond the upper band, it may indicate overbought conditions and a possible reversal to the downside. Conversely, if the price moves below the lower band, it may signal oversold conditions and a potential reversal to the upside.
5. Volatility and Breakouts: Intraday traders often look for volatility and breakout opportunities. The three standard deviation bands on the Daily VWAP provide valuable information about price volatility. When the price breaks out of the bands, it suggests a significant increase in volatility and potential opportunities for intraday traders to take advantage of strong momentum moves.
6. Risk Management: The three standard deviation bands help traders define their risk and set stop-loss orders. By placing stop-loss orders outside the bands, traders can protect their positions in case the price moves beyond the expected range. This risk management technique allows traders to limit their potential losses and preserve capital.
7. Confirmation with Other Indicators: Intraday traders often use the three standard deviation bands on the Daily VWAP in conjunction with other technical indicators or chart patterns to strengthen their trading decisions. The bands can validate other signals or provide additional confirmation before entering or exiting a trade.
Overall, the Daily VWAP with three standard deviations is a valuable tool for intraday traders as it helps identify price extremes, potential reversals, volatility, and breakout opportunities. By incorporating this indicator into their trading strategies, traders can make more informed decisions and enhance their intraday trading performance.
Auto Boxed Range Detector
The true innovation in the "VWAP Xing D, Prv.D, W, Q, M, & Y + SD" indicator lies in the integration of the sophisticated 'Auto Boxed Range Detector.' This feature serves as the cornerstone of the tool's enhanced functionality, shedding light on critical price ranges to give traders a distinct advantage when identifying potential breakouts or breakdowns.
Meticulously designed with the needs of traders in mind, the Auto Boxed Range Detector automates the process of pinpointing trading ranges, resulting in increased precision and swiftness in your decision-making. By automating this crucial aspect of technical analysis, traders can now focus on other essential factors, ultimately maximizing their trading efficiency.
Furthermore, the Auto Boxed Range Detector helps traders avoid falling prey to false breakouts. By identifying the top of the boxed range in relation to resistance levels, users can more accurately predict the likelihood of a breakout. For instance, if the top of the boxed range is situated near a resistance line, the chances of a breakout are diminished unless the market is experiencing a trend day.
In essence, the Auto Boxed Range Detector not only streamlines the identification of trading ranges but also provides invaluable insights into the validity of potential breakouts or breakdowns. This innovative feature makes the "VWAP Xing D, Prv.D, W, Q, M, & Y + SD" indicator an indispensable tool for traders seeking to capitalize on opportunities while minimizing risk in today's fast-paced financial markets.
Once you get used to this tool it will be an integral part of your trading.

BB_MDL_V1Simple indicator that is based on the average line of the bollinger bands and the exponential average of 200 periods.
The customizable variable is bollinger bands length, currently the default is 35, you can tweak it to your liking and see how trend identification changes.
My recommendation is to work in 5-minute time frames in values such as SOL, FTM or MASK (cryptos)
This simple strategy can be combined with many others to gain more insight and get better market entries and exits.

Ignition Band Angles are Bollinger Bands with numeric angleI developed Bollinger Bands that provide a numeric value indicating their strength. To achieve this, I used the degree of the angle of attack and color-coded the numbers. The top band displays the number in the upper corner of the chart, the bottom band in the bottom corner, and the Basis is in the left middle. These numbers quantify the slope of the bands, which can be difficult to discern on a chart because stretching out the x and y axis can flatten or exaggerate a slope. With my Bollinger Bands, you get a constant reading that provides an accurate measurement of the angle and strength of a trend. I hope this helps.

BB Running Away CandleHello,
here is an indicator that can be helpful for your trading that is simple and easy to use.
Our culprit here is a candle that opens and closes below the lower band of Bollinger Band, Black and red lines are put on the high and low of that candle.
Green Arrows are happening when:
1- When candle closes above the black line and Stochastic RSI is in the oversold area >> "Confirmed B"
2- When candle closes above the black line >> "B"
Note that you can choose from the settings whether you want it confirmed or not.
Red Arrows are happening when:
1- Price reached the higher band of Bollinger Bands >> "BB High"
2- Stochastic crosses down from above 80 level >> "Stoch Crossdown"
3- RSI reached above 70 levle >> "RSI Oversold"
Note that you can choose to turn these on or off from the settings.
Settings of indicators are set to default.
NOTE: Alerts are put there however i didn't get the chance to test them, so would like to hear your feedback about them.
THE USE OF THIS INDICATOR IS YOUR OWN RESPONSIBILITY.
wishing you the best.
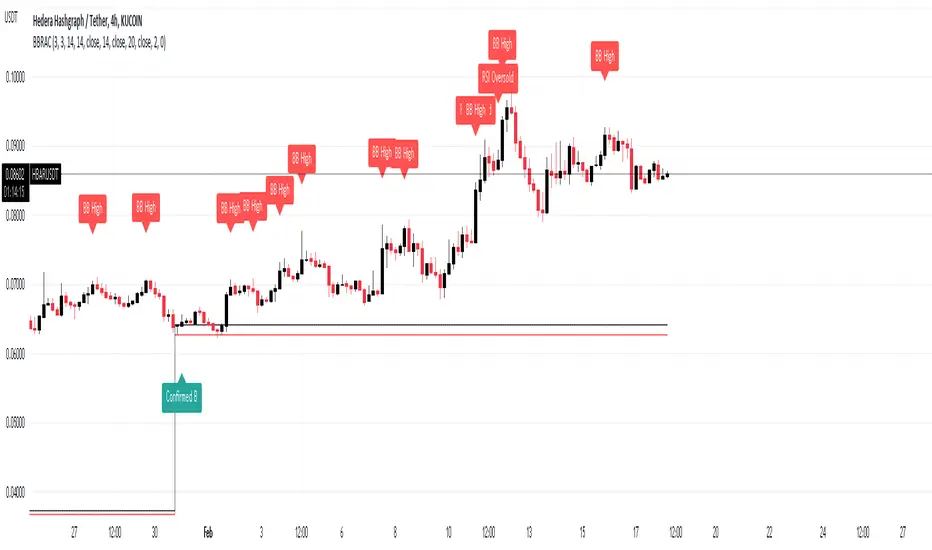
GKD-C Bollinger Bands Stop [Loxx]Giga Kaleidoscope Bollinger Bands Stop is a Confirmation module included in Loxx's "Giga Kaleidoscope Modularized Trading System".
█ Giga Kaleidoscope Modularized Trading System
What is Loxx's "Giga Kaleidoscope Modularized Trading System"?
The Giga Kaleidoscope Modularized Trading System is a trading system built on the philosophy of the NNFX (No Nonsense Forex) algorithmic trading.
What is an NNFX algorithmic trading strategy?
The NNFX algorithm is built on the principles of trend, momentum, and volatility. There are six core components in the NNFX trading algorithm:
1. Volatility - price volatility; e.g., Average True Range, True Range Double, Close-to-Close, etc.
2. Baseline - a moving average to identify price trend
3. Confirmation 1 - a technical indicator used to identify trends
4. Confirmation 2 - a technical indicator used to identify trends
5. Continuation - a technical indicator used to identify trends
6. Volatility/Volume - a technical indicator used to identify volatility/volume breakouts/breakdown
7. Exit - a technical indicator used to determine when a trend is exhausted
How does Loxx's GKD (Giga Kaleidoscope Modularized Trading System) implement the NNFX algorithm outlined above?
Loxx's GKD v1.0 system has five types of modules (indicators/strategies). These modules are:
1. GKD-BT - Backtesting module (Volatility, Number 1 in the NNFX algorithm)
2. GKD-B - Baseline module (Baseline and Volatility/Volume, Numbers 1 and 2 in the NNFX algorithm)
3. GKD-C - Confirmation 1/2 and Continuation module (Confirmation 1/2 and Continuation, Numbers 3, 4, and 5 in the NNFX algorithm)
4. GKD-V - Volatility/Volume module (Confirmation 1/2, Number 6 in the NNFX algorithm)
5. GKD-E - Exit module (Exit, Number 7 in the NNFX algorithm)
(additional module types will added in future releases)
Each module interacts with every module by passing data between modules. Data is passed between each module as described below:
GKD-B => GKD-V => GKD-C(1) => GKD-C(2) => GKD-C(Continuation) => GKD-E => GKD-BT
That is, the Baseline indicator passes its data to Volatility/Volume. The Volatility/Volume indicator passes its values to the Confirmation 1 indicator. The Confirmation 1 indicator passes its values to the Confirmation 2 indicator. The Confirmation 2 indicator passes its values to the Continuation indicator. The Continuation indicator passes its values to the Exit indicator, and finally, the Exit indicator passes its values to the Backtest strategy.
This chaining of indicators requires that each module conform to Loxx's GKD protocol, therefore allowing for the testing of every possible combination of technical indicators that make up the six components of the NNFX algorithm.
What does the application of the GKD trading system look like?
Example trading system:
Backtest: Strategy with 1-3 take profits, trailing stop loss, multiple types of PnL volatility, and 2 backtesting styles
Baseline: Hull Moving Average as shown on the chart above
Volatility/Volume: Volatility Ratio as shown on the chart above
Confirmation 1: Bollinger Bands Stop as shown on the chart above
Confirmation 2: Williams Percent Range
Continuation: Fisher Transform
Exit: Rex Oscillator
Each GKD indicator is denoted with a module identifier of either: GKD-BT, GKD-B, GKD-C, GKD-V, or GKD-E. This allows traders to understand to which module each indicator belongs and where each indicator fits into the GKD protocol chain.
Giga Kaleidoscope Modularized Trading System Signals (based on the NNFX algorithm)
Standard Entry
1. GKD-C Confirmation 1 Signal
2. GKD-B Baseline agrees
3. Price is within a range of 0.2x Volatility and 1.0x Volatility of the Goldie Locks Mean
4. GKD-C Confirmation 2 agrees
5. GKD-V Volatility/Volume agrees
Baseline Entry
1. GKD-B Baseline signal
2. GKD-C Confirmation 1 agrees
3. Price is within a range of 0.2x Volatility and 1.0x Volatility of the Goldie Locks Mean
4. GKD-C Confirmation 2 agrees
5. GKD-V Volatility/Volume agrees
6. GKD-C Confirmation 1 signal was less than 7 candles prior
Continuation Entry
1. Standard Entry, Baseline Entry, or Pullback; entry triggered previously
2. GKD-B Baseline hasn't crossed since entry signal trigger
3. GKD-C Confirmation Continuation Indicator signals
4. GKD-C Confirmation 1 agrees
5. GKD-B Baseline agrees
6. GKD-C Confirmation 2 agrees
1-Candle Rule Standard Entry
1. GKD-C Confirmation 1 signal
2. GKD-B Baseline agrees
3. Price is within a range of 0.2x Volatility and 1.0x Volatility of the Goldie Locks Mean
Next Candle:
1. Price retraced (Long: close < close or Short: close > close )
2. GKD-B Baseline agrees
3. GKD-C Confirmation 1 agrees
4. GKD-C Confirmation 2 agrees
5. GKD-V Volatility/Volume agrees
1-Candle Rule Baseline Entry
1. GKD-B Baseline signal
2. GKD-C Confirmation 1 agrees
3. Price is within a range of 0.2x Volatility and 1.0x Volatility of the Goldie Locks Mean
4. GKD-C Confirmation 1 signal was less than 7 candles prior
Next Candle:
1. Price retraced (Long: close < close or Short: close > close )
2. GKD-B Baseline agrees
3. GKD-C Confirmation 1 agrees
4. GKD-C Confirmation 2 agrees
5. GKD-V Volatility/Volume Agrees
PullBack Entry
1. GKD-B Baseline signal
2. GKD-C Confirmation 1 agrees
3. Price is beyond 1.0x Volatility of Baseline
Next Candle:
1. Price is within a range of 0.2x Volatility and 1.0x Volatility of the Goldie Locks Mean
3. GKD-C Confirmation 1 agrees
4. GKD-C Confirmation 2 agrees
5. GKD-V Volatility/Volume Agrees
█ Bollinger Bands Stop
What is Bollinger Bands Stop?
Bollinger Bands Stop is similar to Supertrend but uses Standard Deviation instead of ATR. includes a money risk and signal adjustment to fine-tune the signal. This can be used for TPs and SL as well as up/down trading.
Requirements
Inputs
Confirmation 1 and Solo Confirmation: GKD-V Volatility / Volume indicator
Confirmation 2: GKD-C Confirmation indicator
Outputs
Confirmation 2 and Solo Confirmation: GKD-E Exit indicator
Confirmation 1: GKD-C Confirmation indicator
Continuation: GKD-E Exit indicator
Additional features will be added in future releases.

Exponential Bollinger Bands (EBB)This script is a variation of the popular Bollinger Bands indicator, which uses exponential moving averages (EMA) instead of simple moving averages (SMA) as its core calculation. The indicator is designed to provide a visual representation of volatility, with the distance between the upper and lower bands being determined by the standard deviation of the underlying data.
The script starts by defining a number of helper functions that are used to calculate the moving averages and standard deviations required for the indicator. The first helper function is sma(), which calculates the simple moving average of the input data over a specified length. This function uses linear interpolation to smooth the data when the length is not an integer. The stdev() function calculates the standard deviation of the input data using the simple moving average calculated by the sma() function.
The bes() function calculates the exponential moving average of the input data over a specified length. The estdev() function calculates the standard deviation of the input data using the exponential moving average calculated by the bes() function.
The estdev function calculates the standard deviation using an exponential moving average method, rather than the traditional simple moving average method used by the stdev function. The exponential moving average method gives more weight to recent data, which can make the estdev more responsive to recent changes in volatility. This can make it more useful in certain types of analysis, such as identifying trends in volatility. Additionally, it also uses the same EMA algorithm to calculate the average value of the data set, which can help to keep the output of the estdev and average functions consistent.
The script also defines two more helper functions, average() and standard_deviation(), which allow the user to switch between using simple moving averages (SMA) and exponential moving averages (EMA) as the basis for the indicator. These functions take three arguments, the input data, the length of the moving average, and a string that specifies whether to use SMA or EMA.
The script then defines the input parameters for the indicator. The user can choose whether to use SMA or EMA as the basis for the indicator using the select parameter. The user can also specify the length of the moving average and the multiplier for the standard deviation using the length and multiplier parameters, respectively.
Finally, the script calculates the average and standard deviation of the input data using the selected method (SMA or EMA), and plots the upper and lower bands of the indicator. The upper band is calculated as the average plus the standard deviation multiplied by the specified multiplier, while the lower band is calculated as the average minus the standard deviation multiplied by the specified multiplier.
