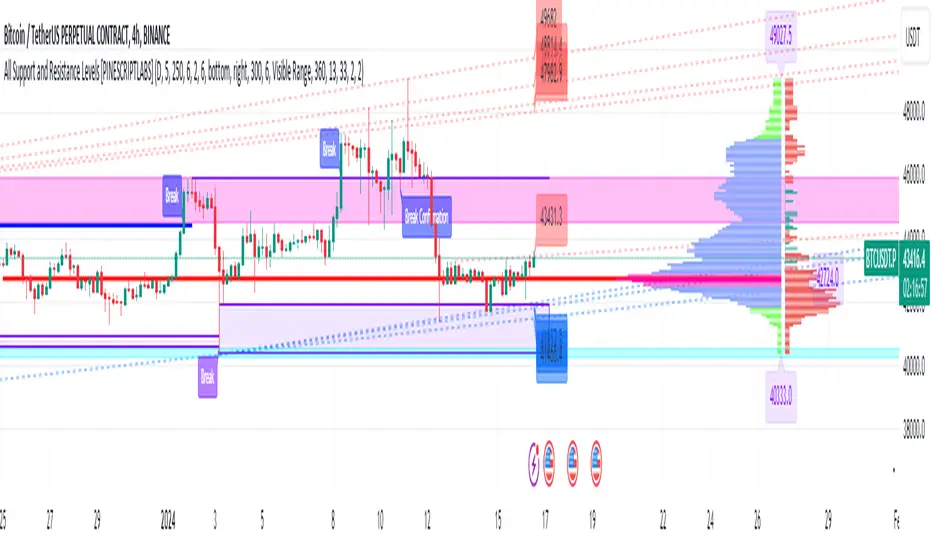
All Support and Resistance Levels [PINESCRIPTLABS]First, we observe the Light Blue Macro Supports and the Pink Macro Resistances. These channels are automatically formed based on market data, identifying pivot points in price history and determining the strength of these levels based on the number of pivot points within these same channels. When the price interacts with the macro Supports, we have a strong reaction that we can take advantage of in two ways:
1. The first and most common, as we can see in the chart, is that these zones elicit a strong reaction, and the price respects the channel. For us, as traders, it signifies a pivot point where we can initiate a trade, either a buy at the macro Support or a sell at the macro Resistance.
2. The second way to use them, for which this algorithm is also prepared, is in case a movement occurs where the price breaks these Macro Supports or Macro Resistances. We have a special alert that will notify us because when these macro channels are broken, they tend to do so violently in a move that we can also capitalize on. Usually, when such a breakout occurs, we will visit the next support or resistance channel, which can bring us significant benefits.
The following complex and highly accurate calculation provided by this indicator allows us to work with price supports and resistances within the internal structure of macro channels. As we can see in the chart, "boxes" are formed that represent the detected support and resistance areas. It also detects breakouts when the price crosses below the support "box" or above the resistance "box" and displays labels on the chart indicating when the breakout occurred, all in real-time. But here comes something very special: the algorithm also has a calculation that, as we see in the chart, there are occasions when the breakout occurs, but the price returns to the support or resistance "box" and is detected. At this moment, a label appears on the chart indicating a possible confirmation of the breakout. In other words, as the price initially broke out but returned to the "box," the algorithm will notify us with another label and a special alert when the price confirms the breakout.
At the same time, we can see in the chart that the algorithm also provides us with a volume profile that allows us to see where the most trading activity has concentrated based on price levels. We can also use it to identify support and resistance levels based on the point of control (POC) and value area levels. As we can see in the chart, there are labels with the exact price where the highest volume was traded. The top label in the chart shows the highest price, and the last label we see is for the lowest price. These displayed labels are within the defined range of retrocession or Lookback Length, which we can configure in our indicator. As we observe, the algorithm shows a strong confluence between the Macro Support channels and the volume profile labels, confirming the strongest areas of the range.
Finally, after calculating supports and resistances from three different perspectives, the algorithm provides us with a macro view of the price in the form of trend lines. In other words, it shows us supports and resistances in the form of diagonal channels where we can see trends in the market and areas where the price has historically encountered difficulties in advancing or retreating, which we can corroborate with the supports and resistances mentioned at the beginning.
As we can see in the chart, the algorithm also shows us labels with the exact price where angular price supports and resistances are located. These calculations are very important as they provide a trend perspective, and we can get an idea of where the price is headed, combining these with the other support and resistance calculations.
Remember that all the previous calculations have their own alerts for when supports or resistances are broken, or in the case of new channels being created, also when there is a breakout of a box or a confirmation of a breakout.
The second type of alert from the indicator is configured to make our indicators work for us without the need to be present on the chart, thanks to special programming within the indicator's code. It will execute automatic buys and sells on our preferred exchange through an alert configured for the 3Commas bot. All you need to do is input your Bot ID, provided by 3Commas, into the alert. All premium indicators come with a configuration explanation that will guide you in detail on where to input your Bot ID.
ESPAÑOL:
En primer lugar, observamos los Macro Soportes en color azul claro y las Macro Resistencias en color rosa. Estos canales se forman automáticamente en función de los datos del mercado, identificando puntos de pivote en el historial de precios y determinando la fuerza de estos niveles según la cantidad de puntos de pivote dentro de estos mismos canales. Cuando el precio interactúa con los macro Soportes, tenemos una fuerte reacción que podemos aprovechar de dos formas:
1. La primera y más común, como observamos en el gráfico, es que estas zonas provocan una fuerte reacción, y el precio respeta el canal. Para nosotros, como traders, significa un punto de pivote donde podemos generar una entrada, ya sea de compra en el macro soporte o de venta en la macro resistencia.
2. La segunda forma de utilizarlos, para la cual este algoritmo también está preparado, es en caso de que se genere un movimiento en el que el precio rompa estos Macro Soportes o Macro Resistencias. Contamos con una alerta especial que nos avisará, ya que al romperse estos macro canales suelen hacerlo con violencia en un movimiento que también podemos aprovechar. Regularmente, cuando existe este rompimiento, visitaremos el siguiente canal de soporte o resistencia, lo que nos puede traer grandes beneficios.
El siguiente cálculo complejo y muy preciso que nos ofrece este indicador nos permite trabajar con soportes y resistencias del precio dentro de la estructura interna de los canales macro. Como observamos en el gráfico, se producen "boxes" que representan las áreas de soporte y resistencia detectadas. Además, detecta breakouts cuando el precio cruza por debajo del "box" de soporte o por encima del "box" de resistencia y muestra etiquetas en el gráfico que nos indican cuándo ocurrió el breakout, todo esto en tiempo real. Pero aquí viene algo super especial: el algoritmo también tiene un cálculo que, como vemos en el gráfico, hay ocasiones en las que el breakout ocurre, pero el precio retorna al "box" de soporte o resistencia y es detectado. En este momento, aparece una etiqueta en el gráfico que nos muestra que estamos ante una posible confirmación del breakout. Es decir, como el precio había hecho en primer lugar el breakout pero regresó al "box", el algoritmo nos avisará con otra etiqueta y alerta especial cuando el precio confirme el breakout.
Al mismo tiempo, observamos en el gráfico que el algoritmo también nos muestra un perfil de volumen que nos permite ver dónde se ha concentrado la mayor actividad de negociación en función de los niveles de precios. También podemos usarlo para identificar niveles de soporte y resistencia basados en el punto de control (POC) y los niveles de valor (Value Area). Como vemos en el gráfico, tenemos etiquetas con el precio exacto donde se negoció la mayor cantidad de volumen. La etiqueta superior del gráfico nos muestra el precio más alto, y la última etiqueta que observamos es la de la parte baja, que nos indica el precio más bajo. Estas etiquetas mostradas están dentro del rango de retroceso definido o Lookback Length, que podemos configurar en nuestro indicador. Como observamos, el algoritmo nos muestra una fuerte confluencia entre los canales de soporte Macro y las etiquetas del perfil de volumen, lo que nos confirma las áreas más fuertes del rango.
Por último, después de hacer los cálculos de soportes y resistencias desde tres perspectivas distintas, el algoritmo nos proporciona una visión macro del precio en forma de líneas de tendencia. Es decir, nos muestra soportes y resistencias en forma de canales diagonales donde tendremos representadas las tendencias en el mercado y áreas en las que el precio históricamente ha encontrado dificultades para avanzar o retroceder, lo que podemos corroborar con los soportes y resistencias de los que hablamos al principio.
Como observamos en el gráfico, el algoritmo también nos muestra las etiquetas con el precio exacto donde se encuentran los soportes angulares del precio y las resistencias angulares. Estos cálculos son importantísimos, ya que nos ofrecen una perspectiva de tendencia y podemos tener una visión de hacia dónde se dirige el precio, combinando estos con los otros cálculos de soportes y resistencias.
Recuerden que todos los cálculos anteriores tienen su propia alerta para cuando los soportes o resistencias se quiebren o en su caso, se creen nuevos canales, también cuando haya una ruptura de un "box" o una confirmación de ruptura.
El segundo tipo de alerta del indicador está configurada para que nuestros indicadores trabajen para nosotros sin necesidad de estar presentes en el gráfico, esto mediante una programación especial dentro del código del indicador que realizará compras y ventas automáticas en nuestro Exchange de preferencia mediante una alerta configurada para el bot 3Commas. Solo bastará con que pongamos nuestro número de Bot o Bot ID que da el proveedor de 3Commas y lo insertemos en la alerta. Todos los indicadores premium tienen en su configuración una explicación detallada sobre dónde poner tus Bot ID.
Search in scripts for "bot"
RSI-all in one_Pro[vn]👉Hello traders.
Introducing the " RSI all-in-one " Bot that includes the functions:
+ Automatically scan RSI divergence
+ Automatically scan RSI trendlines
+ Create an alert when there is a golden signal (RSI creates a divergence and then breaks its trendline, signaling a trend reversal)
Explain:
During trading when using the indicator "RSI - trendlines - div " in my library on TW web page:
- I have an idea to create a Bot indicator about "Automatically scan RSI divergences and trendlines". Because those are the top strengths when traders use the RSI to forecast trend reversals.
- On each chart of the trading pair, the RSI draws the trendline pair as: uptrendline and downtrendline (closest to the RSI)
- So when the statistics on "Bot" also shows the column of RSI trendlines up and the column of RSI trendlines down
- Column |════🡹\n\ʀꜱɪ| - is the above RSI trendline
- Column |ʀꜱɪ\n\════🡻| - is the below RSI trendline
- When RSI approaches any one of its trendlines and the ratio is 10%, then:
+ in column |✎\n\𝖙.𝖑𝖎𝖓𝖊| Red colored digits (downtrend)
+ in column |𝖙.𝖑𝖎𝖓𝖊\n\✐| blue colored digits (uptrend)
Is the value of the RSI trendline for traders to pay more attention to when it can be the entry and exit points according to the resistance and support nature of the RSI trendlines.
- When the RSI breaks the above trendline, it shows is "🡹", if it is the first candle, at the column |════🡹\n\ʀꜱɪ| it shows as "🡹1|1|1" the cell turns green , that's the RSI signal breaking the line. Its resistance to go up, wait for the candle to close, we can enter "Buy/Long" order.
- When the RSI line breaks below the trendline, it shows is "🡻", if it is the first candle, then at the column |ʀꜱɪ\n\════🡻| it displays as "🡻1|1|1" the cell turns red , that's the RSI signal breaking the line Support to continue down, wait for the candle to close, we can enter "Sell/Short" order
- The parameter when breaking shows 10|10|10, it means that the RSI has broken 10 candles (RSI candles), and the first 10 candles are colored green (bullish) red (bearish) then hidden. (can be changed in settings). In addition, when displaying the parameters of the cell as above, the column |✎\n\𝖙.𝖑𝖎𝖓𝖊| and |𝖙.𝖑𝖎𝖓𝖊\n\✐| will show the percentage from when the RSI break point to the current RSI (closed)
- Column |𝚍𝚒𝚟| is a divergence signal. When the price makes a new high, a new low, and the RSI signals a divergence, it will start to increase the base from the number 1. From here, the Trader will know which trading pair is starting to divergence RSI. Cell is Green bullish divergence, Cell is red bearish divergence
- Column|🆁🆂🅸| is the current RSI .{🟢} RSI above the cloud , {🔴} RSI below the cloud , {⚪️} RSI in the cloud(RSI clouds also indicate very well the support and resistance zone of RSI)
- There are 5 warning functions on this indicator
- The parameter {20:2} is the length of the RSI trendline and combines the same parameters with the "RSI - trendlines - div{vn}" indicator when analyzing
💥 Summary:
Trading methods with this indicator:
+ Trade when there is a divergence
+ Trade when the RSI approaches its trendline (it is the support and resistance line of the RSI)
+ Trade when the RSI breaks the trendline (definitively above or below)
+ Trade when there is a divergence then after a few candles, RSI breaks through its trendline, giving a golden signal.
1 . image
Later(sau đó)
2 . image
Later(sau đó)
Note: The indicator can create up to 40 trading pairs, so traders should choose a super nice signal to enter orders.
-----------------------------------------------------Vietnamese-------------------------------------------------------
👉Xin chào các nhà giao dịch VietNam.
xin giới thiệu Bot "RSI-Tất cả trong một " bao gồm các chức năng:
+ Tự động quét phân kì RSI
+ Tự động quét đường xu hướng RSI
+ Tạo cảnh báo khi có tín hiệu vàng(RSI tạo phân kì và sau đó phá vỡ đường xu hướng của nó báo hiệu đảo chiều xu hướng)
Diễn giải:
- Trong quá trình giao dịch khi dùng chỉ báo "RSI - trendlines - div " trong thư viện của tôi trên trang TW . Tôi có ý tưởng tạo chỉ báo Bot về " Tự động quét phân kì và đường xu hướng của RSI ". Vì đó là những điểm mạnh hàng đầu khi nhà giao dịch sử dụng chỉ báo RSI để dự báo đảo chiều xu hướng.
- Trên mỗi biểu đồ của cặp giao dịch, chỉ báo RSI vẽ cặp trendline là: trendline tăng và trendline giảm (gần với RSI nhất)
- Vì vậy khi thống kê trên " Bot " cũng hiển thị cột của RSI trendlines tăng và cột của RSI trendlines giảm
- Cột |════🡹\n\ʀꜱɪ| - là trendline RSI bên trên
- Cột |ʀꜱɪ\n\════🡻|- là trendline RSI bên dưới
- Khi RSI phá đường xu hướng bên trên thì nó hiển thị là "🡹", nếu là cây nến đầu tiên thì tại cột |════🡹\n\ʀꜱɪ| nó hiển thị là "🡹1|1|1" ô đổi màu xanh , đó là tín hiệu RSI phá vỡ đường kháng cự của nó để đi lên , chờ nến đóng cửa ta có thể vào lệnh "Buy/Long"
- Khi đường RSI phá đường xu hướng bên dưới thì nó hiển thị là "🡻", nếu là cây nến đầu tiên thì tại cột |ʀꜱɪ\n\════🡻| nó hiển thị là "🡻1|1|1" ô đổi màu đỏ , đó là tín hiệu RSI phá vỡ đường hỗ trợ để xuống tiếp , chờ nến đóng cửa ta có thể vào lệnh "Sell/Short "
-Khi RSI tiến gần đến 1 đường trendline bất kì của nó mà tỉ lệ còn 10% thì:
+ tại cột |✎\n\𝖙.𝖑𝖎𝖓𝖊| chữ số tô màu đỏ (trend giảm)
+ tại cột |𝖙.𝖑𝖎𝖓𝖊\n\✐| chữ số tô màu xanh (trend tăng)
Là giá trị của đường trendline RSI để trader chú ý hơn khi đó có thể là điểm vào lệnh và thoát lệnh theo tính chất kháng cự hỗ trợ của RSI trendlines.
-Thông số khi phá vỡ hiển thị 10|10|10 thì hiểu là RSI đã phá vỡ 10 nến(nến RSI), và 10 nến đầu tiên được tô màu xanh(tăng giá) màu đỏ (giảm giá) sau đó được ẩn(có thể thay đổi trong cài đặt). Ngoài ra khi hiện thông số của ô như trên thì cột |✎\n\𝖙.𝖑𝖎𝖓𝖊| và |𝖙.𝖑𝖎𝖓𝖊\n\✐| sẽ hiển thị được số phần trăm tính từ khi điểm RSI phá vỡ đến RSI hiện tại(đóng cửa)
Cột |𝚍𝚒𝚟| là tín hiệu phân kì . Khi giá tạo đỉnh mới, đáy mới mà RSI báo tín hiệu là phân kì thì nó sẽ bắt đầu cơ số đếm từ số 1 tăng dần lên.Từ đây Trader sẽ biết được cặp giao dịch nào đang bắt đầu phân kì RSI. Ô màu xanh là phân kì tăng, ô màu đỏ là phân kì giảm
- Cột| 🆁🆂🅸 | là RSI hiện tại .{🟢} RSI trên mây , {🔴} RSI dưới mây , {⚪️} RSI trong mây(Mây của RSI cũng cho biết rất tốt vùng hỗ trợ, kháng cự của RSI)
- Có 5 chức năng cảnh báo trên chỉ báo này
- Thông số {20:2} là độ dài đường trendline RSI và kết hợp cùng thông số với chỉ báo "RSI - trendlines - div{vn}" khi phân tích
💥 Tổng kết:
Các phương pháp giao dịch với chỉ báo này:
+ Giao dịch khi có phân kì.
+ Giao dịch khi RSI tiếp cận đến đường xu hướng của nó(nó là đường hỗ trợ, kháng cự của RSI).
+ Giao dịch khi RSI phá vỡ đường xu hướng(trên hoặc dưới cách dứt khoát).
+ Giao dịch khi có phân kì sau đó qua vài nến, RSI phá vỡ qua đường xu hướng của nó báo hiệu tín hiệu vàng.
Lưu ý : Chỉ báo tạo được tối đa 40 cặp giao dịch, nên AE trader Việt cứ chọn tín hiệu siêu đẹp để vào lệnh nhé.

STP PSAR V5PSAR V5: Automate your trading bots to automate your life!
Welcome to the new revolution in trading bots! PSAR V5 is built to automatically change its indicator settings based on real-time market conditions without any human intervention. Instead of setting up 8-10 alerts for each pair, just setup 1 or 2 alerts.
PSAR is our high-frequency scalper that is designed to take hundreds of trades a day and is the most profitable bot available from Swing Trade Pros. PSAR V5 uses multiple filters (SEE BELOW FOR FILTER DESCRIPTIONS) to reduce the risk of using PSAR by filtering out trades that could become stuck, and changes these filters based on real-time market conditions. Even with multiple filters to reduce risk, it is always important for users to manage their risk and accept the risks of running trading bots and strategies.
PSAR V5 is our first fully automated trading bot, changing its own settings based on real-time market conditions. Ever notice how one setting doesn’t work in all market conditions? PSAR V5 solves this by using 4 different trend indicators to detect the trend of the market, and then uses predefined settings for 8 different trend conditions to automatically adjust as the market changes! This reduces risk and saves the user time.
PSAR V5 isn’t just hands-off, set it and forget it for one market condition, PSAR V5 is set it and forget it for ALL market conditions!!!
PSAR V5 is meant for the beginner user, making it easy to setup and easy to adjust with predefined default risk conditions for each market condition. PSAR V5 ADVANCED allows the user to finely tune each setting for every market condition, and is available for our advanced users in VIP .
DETAILED DESCRIPTION OF FILTERS USED:
PSAR TREND: To detect trend, PSAR V5 uses 4 high time frame PSAR filters to detect overall market conditions. By combining lower time frames such as 5 minute and 15 minute with higher time frame such as 4 hour and daily, PSAR trend detection allows for quick reactions during quick market changes while still adapting and staying on trend with overall market conditions using the higher time frames.
This enables PSAR V5 to combine all 4 PSAR trend filters to determine the strength of the overall market while reacting to quick changes, providing 8 different customizable trend conditions which PSAR uses for settings and to trigger up to 8 different bots, allowing the user to risk on when trend is in their favor, and risk off when trend is not in their favor. PSAR V5 also shows NO TREND when there is indecision in the market when all time frames do not agree.
DIVERGENCES: PSAR V5 uses an enhances version of our previous divergence filter to detect loss of strength in the market by detecting divergences in the Relative Strength Index and filtering out those trades.
ADX: PSAR V5 uses the ADX filter to capture the strongest part of a move in price while avoiding the end of the price movement. This allows us to filter out late longs and shorts.
PSAR DISTANCE: Our PSAR Distance filter will filter out any trades that get beyond a predefined distance from the PSAR indicator dots. This is very useful for avoiding tops and bottoms.
REPAINTING: Significant code has been added to avoid repainting by making each high time frame calculation individually within its own time frame, and then using the bar merge method to eliminate repaints.

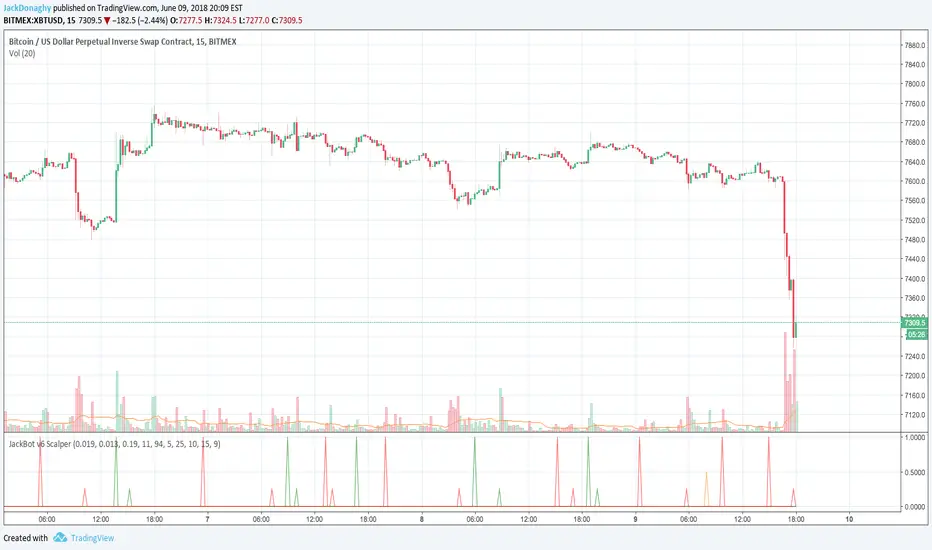
JackBot Scalper v6Jackbot Scalper v6 Update
In Version 6, Jackbot has improved performance on higher time frames with close to 85% success rate on 1-hour times frames and 70% success rate on 15-minute time frames.
Who
I am Jack Donaghy, a crypto trader and wealth strategist at an international asset management firm. I have traded billions in assets for clients and have grown a portfolio of personal assets by nearly 2200% within the last 1.5 years from trading. I originally invested in cryptocurrencies in November of 2016 and have been catching waves ever since. This bot is for those interested in scalping methods.
What
Jackbot Pro Scalper is a scalping study for Bitcoin that operates on small timeframes. It has a 60-70% success rate and operates with the goal of maximizing gains while minimizing losses. This bot works well with leveraged strategies as it pursues both long and short positions. While I primarily use the bot on BitMex, I have seen good success on Bitfinex with various USDT pairs including VEN and ETH.
When
With v6, the best results have come from 13, 15, and 17-minute charts with incredible success found on the 1-hour charts.
How
The bot works by 1. Defining its entry point. 2. Defining a take profit 3. Defining a stop loss. The magic of the bot is that it will not close a trade at the take profit, if volume and price are increasing, it will hold the exit until another indicator determines a reversal of the trend. More than that would ruin the logic so you will just have to see for yourself.
To Trade
Large Spikes = Entries (Green = Long, Red = Short)
Small Spikes = Take Profit (Green = Long Exit, Red = Short Exit)
Medium Spikes = Stop Loss (Purple = Long SL, Yellow = Short SL)
Previous Results
Backtested, Jackbot v6 shows that with 1 Bitcoin (unleveraged) you can make about 12K in a 1.5 month period. My personal experience was trading a test amount of Bitcoin on a particularly good run at 25x leverage using 25% of a test portfolio It went from 0.015 Bitcoin to 0.091 within 10 days. See ibb.co (This test was from V5.4 which V6 has improved upon.)
Disclaimer: This strategy is by no means perfect and not every trade will be a winner. It is a tool in your belt, not a perfect 100% trader. Previously, results show with a 25x leveraged position, the losses are ~20% before it will cut off the trade, however, the gains can be 40%+ (As the bot continues to run in certain conditions, it will often pick up major moves and hold them for longer.) It can have bad runs and a slew of poor entries, especially in tight volatile ranges.
PLEASE NOTE: This strategy can struggle with chop following major moves, if you are manually entering, consider other market conditions before entry if the price is in a tight range.
Cost
Jackbot will be offered for 0.1 Bitcoin and will be limited to the first 100 people who apply.
JackBot Scalper V5.4 Who
I am Jack Donaghy, a crypto trader and wealth strategist at an international asset management firm. I have traded billions in assets for clients and have grown a portfolio of personal assets by nearly 2200% within the last 1.5 years from trading. I originally invested in cryptocurrencies in November of 2016 and been catching waves ever since. This bot is for those interested in scalping methods.
What
Jackbot Pro Scalper is scalping study for bitcoin that operates on small timeframes. It has a 60-70% success rate and operates with the goal of maximizing gains while minimizing losses. This bot works well with leveraged strategies as pursues both long and short positions. While I primarily use it on BitMex, I have seen good success on Bitfinex.
When
5-30 minute charts, longer time frames can work but have not been successful enough to warrant publishing. Best results have come from 13 and 17-minute timeframes.
How
The bot works by 1. Defining its entry point. 2. Defining a take profit 3. Defining a stop loss. The magic of the bot is that it will not close a trade at the take profit, if volume and price are increasing, it will hold the exit until another indicator determines a reversal of the trend. More than that would ruin the logic so you will just have to see for yourself.
To Trade
Large Spikes = Entries (Green = Long, Red = Short)
Small Spikes = Take Profit (Green = Long Exit, Red = Short Exit)
Medium Spikes = Stop Loss (Purple = Long SL, Yellow = Short SL)
Previous Results
Backtested, this bot shows that with 1 Bitcoin (unleveraged) you can make about 10K in a 1.5 month period. My personal experience was trading a test amount of bitcoin on a particularly good run at 25x leverage using 25% of a test portfolio It went from 0.015 bitcoin to 0.091 within 10 days. See ibb.co
Disclaimer: This strategy is by no means perfect and not every trade will be a winner. Previously results show with a 25x leveraged position, the losses are ~20% before it will cut off the trade, however, the gains can be 40%+ (As the bot continues to run in certain conditions, it will often pick up major moves and hold them for longer.) It can have bad runs and a slew of poor entries, especially in tight volatile ranges.
PLEASE NOTE: This strategy can struggle with chop following major moves, if you are manually entering, consider other market conditions before entry if the price is in a tight range.

Omni-Trend Analytics + Live PnL DashboardOverview
The Omni-Trend Analytics suite is an all-in-one technical command center. It integrates the battle-tested UT Bot signal logic with a sophisticated real-time dashboard, session tracking, and multi-timeframe trend analysis.
📊 The "Nexus" Dashboard
The heart of this script is the 6-row dynamic dashboard, designed to give you "at-a-glance" confluence:
RSI & RSI-MA: Tracks the standard RSI alongside a custom RSI-based Moving Average to spot momentum shifts before they hit the price.
Selectable Trend Status: Unlike static indicators, you can toggle the "Trend" source between EMA 9, 20, or 200 in the settings to match your trading style (Scalping vs. Swing).
Distance to EMA: Shows exactly how "overextended" the price is from your selected trend line.
ATR Volatility (Color-Coded): Turns Green when volatility is expanding (ideal for trend following) and Red when the market is contracting (ideal for range-trading or caution).
Live PnL Tracking: Automatically calculates the profit or loss of the most recent UT Bot signal in real-time.
🛠️ Key Features & Settings
Precision Signals: Combines UT Bot Buy/Sell labels with RSI "!" reversal warnings for high-probability entries.
Institutional Moving Averages: Includes 5 SMAs (including the 610 SMA) and 3 EMAs (9, 20, 200) all set to a professional Thickness 2 for clarity.
Session Highlighting: Automatically shades the background for London and New York sessions to help you trade when liquidity is highest.
VWAP Integration: Includes a purple VWAP line to ensure you are trading at a "fair value" relative to volume.
🔔 Strategic Alert Suite
The script comes pre-loaded with 6 specialized alert conditions:
UT Bot Signal: Standard entry alerts.
RSI Cross RSI-MA: Early warning for momentum reversals.
High-Prob UT + VWAP: Signals that only trigger when aligned with institutional volume.
EMA 9/20 Momentum Cross: Classic trend-shift notification.
ATR Volatility Spike: Alerts you to 50% increases in market volatility.
PnL Target / Break-Even: Pings you when your live trade reaches a user-defined profit threshold.
💡 Trading Pro-Tip
The Convergence Strategy: Look for a UT Bot Buy signal that occurs during the London/NY Overlap while the ATR is Green (expanding) and the RSI is crossing over its RSI-MA. This "triple confluence" is the primary design intent of the Omni-Trend suite.

SFP + Binance Hedge Direct (Full)RSI SFP + Binance Direct Auto-Trading (Hedge Mode)
RSI SFP + 币安直连自动交易脚本 (双向持仓模式)
🇨🇳 中文说明 (Chinese)
简介 / Introduction 这是一个专为 Binance Futures Signal Bot(币安合约信号机器人) 深度定制的 RSI SFP(假突破)策略脚本。它移除了对第三方中间商(如 WunderTrading)的依赖,实现了 TradingView 到币安的毫秒级直连下单,极大降低了滑点。
核心功能 / Key Features
SFP 针尖策略: 基于 RSI 背离 + 前高/前低假突破(Swing Failure Pattern)捕捉反转机会。支持 "触碰即入场" 或 "收线确认" 模式。
币安直连 (Binance Direct): 内置符合币安 Hedge Mode (双向持仓) 标准的 JSON 生成器。支持自动挂入 TP/SL (止盈止损) 单。
智能资金管理: 无需手动计算总金额。只需输入 本金 (Margin) 和 杠杆 (Leverage),脚本自动计算总名义价值 (Notional Value) 并发送给交易所。
多重过滤系统: 集成 布林带 (Bollinger Bands) 和 成交量 (Volume) 过滤器,有效过滤震荡中的假信号。
双重报警支持:
机器人端: 发送标准 JSON 指令,包含开单、金额、止盈止损价。
手机端: 通过隐藏绘图输出,支持发送清晰易读的文本消息(如 "BTC Long, Entry: 95000, TP: 96000")。
设置指南 / Setup Guide
参数设置:
在 🤖 Bot Connection 中填入币安提供的 signalId 和 uid。
在 Position & Money 中设置您的单笔本金和杠杆(如 1000 U, 100x)。
币安设置:
在币安创建信号机器人时,务必选择 Order Size 单位为 USDT。
报警设置 (双报警模式):
自动交易: 创建报警 -> 选择 Any alert() function call -> 填入 Webhook URL -> 消息框留空。
手机提醒: 创建报警 -> 选择 Bullish/Bearish Reversal -> 填入 {{plot("Alert_Entry")}} 等占位符 -> 发送到 App。
🇺🇸 English Description
Introduction This is a specialized RSI SFP (Swing Failure Pattern) strategy script tailored for the Binance Futures Signal Bot. It eliminates the need for third-party middleware (like WunderTrading), enabling direct, low-latency execution from TradingView to Binance with minimal slippage.
Key Features
SFP Strategy: Captures reversals based on RSI Divergence + Structure False Breakouts (Wick-based). Supports "Touch Only" or "Close Return" entry modes.
Binance Direct Integration: Built-in JSON generator strictly compliant with Binance Hedge Mode. Automatically attaches TP/SL (Take Profit & Stop Loss) orders directly to the entry signal.
Smart Money Management: No need to calculate position sizes manually. Simply input your Margin (USDT) and Leverage. The script auto-calculates the Total Notional Value to send to the exchange.
Advanced Filtering: Integrated Bollinger Bands and Volume filters to reduce false signals during choppy markets.
Dual Alert System:
For Bot: Sends raw JSON commands with execution details.
For Phone: Uses hidden plots to allow clean, human-readable text alerts (e.g., "BTC Long, Entry: $...", "TP: $...").
Setup Guide
Script Settings:
Paste your Binance signalId and uid in the 🤖 Bot Connection section.
Set your Margin and Leverage in Position & Money (e.g., 1000 USDT, 100x).
Binance Settings:
When creating the Signal Bot on Binance, ensure Order Size unit is set to USDT.
Alert Setup (Double-Alert Method):
For Auto-Trading: Create Alert -> Select Any alert() function call -> Check Webhook -> Leave Message empty.
For Phone Notification: Create Alert -> Select Bullish/Bearish Reversal -> Use placeholders like {{plot("Alert_Entry")}} -> Notify on App.
⚠️ Risk Warning
This script automates high-leverage trading. Ensure your Binance Futures account is set to Hedge Mode before running. Use at your own risk.

ICT FVG Buy/Sell SignalsThis bot is built on ICT (Inner Circle Trader) concepts such as:
Fair Value Gaps (FVGs) – imbalance zones between candles.
Consequent Encroachment (CE) – the midpoint of a gap.
Premium / Discount Arrays – dealing ranges split into premium (sell-side) and discount (buy-side) zones.
Displacement candles – strong impulsive moves that confirm intent.
The bot scans for FVGs, marks CE levels, and waits for price to return to these levels.
When price revisits a valid FVG zone with displacement confirmation and in the correct PD array, the bot generates a BUY or SELL signal.
✅ Signal Rules
Buy Signal
Price trades back into a Bullish FVG.
Current bar shows bullish displacement (large bullish body relative to ATR).
Price is in discount territory of the current dealing range (if PD filter is enabled).
Close is above the CE line of the FVG.
Sell Signal
Price trades back into a Bearish FVG.
Current bar shows bearish displacement.
Price is in premium territory of the current dealing range.
Close is below the CE line of the FVG.
🎯 What You’ll See on the Chart
Green “BUY” labels below candles when long signals trigger.
Red “SELL” labels above candles when short signals trigger.
Shaded background:
Red = Premium zone (sell side).
Teal = Discount zone (buy side).
Yellow line = dealing range midpoint (equilibrium).
Dots on CE lines = midpoints of the latest bullish/bearish FVG.
🔔 Alerts
ICT Buy → Triggers when a bullish setup confirms.
ICT Sell → Triggers when a bearish setup confirms.
You can connect these alerts to:
TradingView notifications.
Webhooks (for brokers or bots like MetaTrader, NinjaTrader, or Discord).
⚙️ Settings
Swing length – how many bars to use when detecting swing highs/lows for the dealing range.
Use PD filter – toggle ON/OFF for requiring discount/premium alignment.
Displacement ATR multiple – how strong the candle body must be compared to ATR to count as a displacement.
ATR length – used for displacement filter.
📈 Supported Markets
Works on all symbols and timeframes.
Commonly applied to:
NASDAQ (NQ, QQQ)
S&P500 (ES, SPX, SPY)
Forex pairs
Crypto (BTC, ETH, etc.)
⚠️ Disclaimer
This bot is for educational purposes only. It does not guarantee profits and should be tested on demo accounts first.
Always apply proper risk management before trading live.

MetaFOX DCA (ASAP-RSI-BB%B-TV)Welcome To ' MetaFOX DCA (ASAP-RSI-BB%B-TV) ' Indicator.
This is not a Buy/Sell signals indicator, this is an indicator to help you create your own strategy using a variety of technical analyzing options within the indicator settings with the ability to do DCA (Dollar Cost Average) with up to 100 safety orders.
It is important when backtesting to get a real results, but this is impossible, especially when the time frame is large, because we don't know the real price action inside each candle, as we don't know whether the price reached the high or low first. but what I can say is that I present to you a backtest results in the worst possible case, meaning that if the same chart is repeated during the next period and you traded for the same period and with the same settings, the real results will be either identical to the results in the indicator or better (not worst). There will be no other factors except the slippage in the price when executing orders in the real trading, So I created a feature for that to increase the accuracy rate of the results. For more information, read this description.
Below I will explain all the properties and settings of the indicator:
A) 'Buy Strategies' Section: Your choices of strategies to Start a new trade: (All the conditions works as (And) not (OR), You have to choose one at least and you can choose more than one).
- 'ASAP (New Candle)': Start a trade as soon as possible at the opening of a new candle after exiting the previous trade.
- 'RSI': Using RSI as a technical analysis condition to start a trade.
- 'BB %B': Using BB %B as a technical analysis condition to start a trade.
- 'TV': Using tradingview crypto screener as a technical analysis condition to start a trade.
B) 'Exit Strategies' Section: Your choices of strategies to Exit the trades: (All the conditions works as (And) not (OR), You can choose more than one, But if you don't want to use any of them you have to activate the 'Use TP:' at least).
- 'ASAP (New Candle)': Exit a trade as soon as possible at the opening of a new candle after opening the previous trade.
- 'RSI': Using RSI as a technical analysis condition to exit a trade.
- 'BB %B': Using BB %B as a technical analysis condition to exit a trade.
- 'TV': Using tradingview crypto screener as a technical analysis condition to exit a trade.
C) 'Main Settings' Section:
- 'Trading Fees %': The Exchange trading fees in percentage (trading Commission).
- 'Entry Price Slippage %': Since real trading differs from backtest calculations, while in backtest results are calculated based on the open price of the candle, but in real trading there is a slippage from the open price of the candle resulting from the supply and demand in the real time trading, so this feature is to determine the slippage Which you think it is appropriate, then the entry prices of the trades will calculated higher than the open price of the start candle by the percentage of slippage that you set. If you don't want to calculate any slippage, just set it to zero, but I don't recommend that if you want the most realistic results.
Note: If (open price + slippage) is higher than the high of the candle then don't worry, I've kept this in consideration.
- 'Use SL': Activate to use stop loss percentage.
- 'SL %': Stop loss percentage.
- 'SL settings options box':
'SL From Base Price': Calculate the SL from the base order price (from the trade first entry price).
'SL From Avg. Price': Calculate the SL from the average price in case you use safety orders.
'SL From Last SO.': Calculate the SL from the last (lowest) safety order deviation.
ex: If you choose 'SL From Avg. Price' and SL% is 5, then the SL will be lower than the average price by 5% (in this case your SL will be dynamic until the price reaches all the safety orders unlike the other two SL options).
Note: This indicator programmed to be compatible with '3COMMAS' platform, but I added more options that came to my mind.
'3COMMAS' DCA bots uses 'SL From Base Price'.
- 'Use TP': Activate to use take profit percentage.
- 'TP %': Take profit percentage.
- 'Pure TP,SL': This feature was created due to the differences in the method of calculations between API tools trading platforms:
If the feature is not activated and (for example) the TP is 5%, this means that the price must move upward by only 5%, but you will not achieve a net profit of 5% due to the trading fees. but If the feature is activated, this means that you will get a net profit of 5%, and this means that the price must move upward by (5% for the TP + the equivalent of trading fees). The same idea is applied to the SL.
Note: '3COMMAS' DCA bots uses activated 'Pure TP,SL'.
- 'SO. Price Deviation %': Determines the decline percentage for the first safety order from the trade start entry price.
- 'SO. Step Scale': Determines the deviation multiplier for the safety orders.
Note: I'm using the same method of calculations for SO. (safety orders) levels that '3COMMAS' platform is using. If there is any difference between the '3COMMAS' calculations and the platform that you are using, please let me know.
'3COMMAS' DCA bots minimum 'SO. Price Deviation %' is (0.21)
'3COMMAS' DCA bots minimum 'SO. Step Scale' is (0.1)
- 'SO. Volume Scale': Determines the base order size multiplier for the safety orders sizes.
ex: If you used 10$ to buy at the trade start (base order size) and your 'SO. Volume Scale' is 2, then the 1st SO. size will be 20, the 2nd SO. size will be 40 and so on.
- 'SO. Count': Determines the number of safety orders that you want. If you want to trade without safety orders set it to zero.
'3COMMAS' DCA bots minimum 'SO. Volume Scale' is (0.1)
- 'Exchange Min. Size': The exchange minimum size per trade, It's important to prevent you from setting the base order Size less than the exchange limit. It's also important for the backtest results calculations.
ex: If you setup your strategy settings and it led to a loss to the point that you can't trade any more due to insufficient funds and your base order size share from the strategy becomes less than the exchange minimum trade size, then the indicator will show you a warning and will show you the point where you stopped the trading (It works in compatible with the initial capital). I recommend to set it a little bit higher than the real exchange minimum trade size especially if you trade without safety orders to not stuck in the trade if you hit the stop loss
- 'BO. Size': The base order size (funds you use at the trade entry).
- 'Initial Capital': The total funds allocated for trading using your strategy settings, It can be more than what is required in the strategy to cover the deficit in case of a loss, but it should not exceed the funds that you actually have for trading using this strategy settings, It's important to prevent you from setting up a strategy which requires funds more than what you have. It's also has other important benefits (refer to 'Exchange Min. Size' for more information).
- 'Accumulative Results': This feature is also called re-invest profits & risk reduction. If it's not activated then you will use the same funds size in each new trade whether you are in profit or loss till the (initial capitals + net results) turns insufficient. If it's activated then you will reuse your profits and losses in each new trade.
ex: The feature is active and your first trade ended with a net profit of 1000$, the next trade will add the 1000$ to the trade funds size and it will be distributed as a percentage to the BO. & SO.s according to your strategy settings. The same idea in case of a loss, the trade funds size will be reduced.
D) 'RSI Strategy' Section:
- 'Buy': RSI technical condition to start a trade. Has no effect if you don't choose 'RSI' option in 'Buy Strategies'.
- 'Exit': RSI technical condition to exit a trade. Has no effect if you don't choose 'RSI' option in 'Exit Strategies'.
E) 'TV Strategy' Section:
- 'Buy': TradingView Crypto Screener technical condition to start a trade. Has no effect if you don't choose 'TV' option in 'Buy Strategies'.
- 'Exit': TradingView Crypto Screener technical condition to exit a trade. Has no effect if you don't choose 'TV' option in 'Exit Strategies'.
F) 'BB %B Strategy' Section:
- 'Buy': BB %B technical condition to start a trade. Has no effect if you don't choose 'BB %B' option in 'Buy Strategies'.
- 'Exit': BB %B technical condition to exit a trade. Has no effect if you don't choose 'BB %B' option in 'Exit Strategies'.
G) 'Plot' Section:
- 'Signals': Plots buy and exit signals.
- 'BO': Plots the trade entry price (base order price).
- 'AVG': Plots the trade average price.
- 'AVG options box': Your choice to plot the trade average price type:
'Avg. With Fees': The trade average price including the trading fees, If you exit the trade at this price the trade net profit will be 0.00
'Avg. Without Fees': The trade average price but not including the trading fees, If you exit the trade at this price the trade net profit will be a loss equivalent to the trading fees.
- 'TP': Plots the trade take profit price.
- 'SL': Plots the trade stop loss price.
- 'Last SO': Plots the trade last safety order that the price reached.
- 'Exit Price': Plots a mark on the trade exit price, It plots in 3 colors as below:
Red (Default): Trade exit at a loss.
Green (Default): Trade exit at a profit.
Yellow (Default): Trade exit at a profit but this is a special case where we have to calculate the profits before reaching the safety orders (if any) on that candle (compatible with the idea of getting strategy results at the worst case).
- 'Result Table': Plots your strategy result table. The net profit percentage shown is a percentage of the 'initial capital'.
- 'TA Values': Plots your used strategies Technical analysis values. (Green cells means valid condition).
- 'Help Table': Plots a table to help you discover 100 safety orders with its deviations and the total funds needed for your strategy settings. Deviations shown in red is impossible to use because its price is <= 0.00
- 'Portfolio Chart': Plots your Portfolio status during the entire trading period in addition to the highest and lowest level reached. It's important when evaluating any strategy not only to look at the final result, but also to look at the change in results over the entire trading period. Perhaps the results were worryingly negative at some point before they rose again and made a profit. This feature helps you to see the whole picture.
- 'Welcome Message': Plots a welcome message and showing you the idea behind this indicator.
- 'Green Net Profit %': It plots the 'Net Profit %' in the result table in green color if the result is equal to or above the value that you entered.
- 'Green Win Rate %': It plots the 'Win Rate %' in the result table in green color if the result is equal to or above the value that you entered.
- 'User Notes Area': An empty text area, Feel free to use this area to write your notes so you don't forget them.
The indicator will take care of you. In some cases, warning messages will appear for you. Read them carefully, as they mean that you have done an illogical error in the indicator settings. Also, the indicator will sometimes stop working for the same reason mentioned above. If that happens then click on the red (!) next to the indicator name and read the message to find out what illogical error you have done.
Please enjoy the indicator and let me know your thoughts in the comments below.

SVMKR_UT_Bot_HMA_UCS_LRSThis Pine Script code is a TradingView study script titled "SVMKR_UT_Bot_HMA_UCS_LRS". It combines two separate trading indicators: the UT Bot (Ultimate Trailing Stop Bot) and the UCS_LRS (Linear Regression Slope) indicator.
UT Bot (Ultimate Trailing Stop Bot):
The UT Bot is designed to provide buy and sell signals based on a trailing stop strategy.
It calculates the trailing stop level using the Average True Range (ATR) and Heikin Ashi candle signals if enabled.
Buy signals are generated when the price crosses above the trailing stop, while sell signals occur when the price crosses below the trailing stop.
Additionally, buy and sell signals are visually represented on the chart with corresponding labels and shapes.
The script also includes options to customize the sensitivity of the trailing stop and to color the bars based on buy or sell signals.
Hull Moving Average (HMA):
This section calculates and plots the Hull Moving Average, a type of moving average that reduces lag and improves smoothing compared to traditional moving averages.
It uses the weighted moving average (WMA) to compute the HMA, which helps to identify trend direction and potential reversal points.
UCS_LRS (Linear Regression Slope):
The UCS_LRS indicator calculates the linear regression slope of the closing prices over a specified period.
It then applies exponential smoothing to the slope values and calculates an average slope.
Buy signals are generated when the current slope is greater than the average slope and positive, indicating an uptrend.
Conversely, sell signals are generated when the current slope is less than the average slope and negative, suggesting a downtrend.
The linear regression slope and its average are plotted on the chart, allowing traders to visually identify trend strength and potential reversal points.
Overall, this combined script provides traders with a comprehensive set of tools for trend following and momentum trading strategies, integrating trailing stop analysis, moving average smoothing, and linear regression slope analysis into a single script for technical analysis on TradingView charts.

Fibonacci Zone Study w/Candles - R3c0nTraderCredits:
Thank you "eykpunter" for granting me permission to use "Fibonacci Zones" to create this study
What does this do? How is it different?
This study was created so it can be used with the strategy 'Fibonacci Zone DCA Strategy - R3c0nTrader' in order to generate buy/sell signals for a 3Commas bot.
I was not able to use "eykpunter's" "Fibonacci Zones" to create these signals as it was missing the code for this. To create the buy or sell signal you need to be able to create an alert for when the price moves through the Fib levels. Unfortunately, the "price" is not available to be selected when creating an alert with the original study. Hence the need to create this new study and to resolve the issue.
This study has overlay turned off by default so it will appear in a separate pane below your active chart. I did this so I can clearly view and separate the strategy from the study.
Steps Overview:
Add the study to your chart
Configure the study to match the Fib length you used in the strategy.
Create Alerts from the study to generate the buy or sell signals to 3Commas
The below steps for creating signals are just examples! Since there are numerous ways you can open or close a trade from a signal, please do your own testing. This cannot be understated.
Example of how to generate buy signals:
After adding the study, select the three dots for this study and click on "Add an alert on Fibonacci Zone Study /w Candles…"
Setup the condition to trigger the alert. If you want to initiate a buy when the price crosses over the top of the lower Fib zone (downtrend zone), then use the following:
Condition>Fibonacci Zone Study>Price High>Crossing Up>Fibonacci Zone Study>Top-Low Fib Border
Options>Once per bar
Expiration>Open-ended
Alert actions>Webhook URL (use the 3Commas webhook URL)
Alert name>Enter a name, "BUY Paper-Fib-Bot"
Message>Use the 3Commas message from the paper bot to open the trade
Example of how to generate sell signals:
After adding the study, select the three dots for this study and click on "Add an alert on Fibonacci Zone Study /w Candles…"
Setup the condition to trigger the alert. If you want to initiate a sell when the price reaches the top of the High Fib zone (uptrend zone), then try the following:
Condition>Fibonacci Zone Study>Price High>Crossing Up>Fibonacci Zone Study>Top-High Fib Border
(Note: I used "Crossing Up" but "Crossing" is another option; I just haven't tested it yet with a paper bot)
Options>Once per bar
Expiration>Open-ended
Alert actions>Webhook URL (use the 3Commas webhook URL)
Alert name>Enter a name, "SELL Paper-Fib-Bot"
Message>Use the 3Commas message from the paper bot to close the trade

Investment Boat(Yatırım Botu)English:
The investment bot plugin works according to past 90 bar(candle) statistics. It shows goals that you can use to detect cheap products and products that you buy that you can easily sell. Invest bot add-on at the best price 1 (2 (Method:) to apply the technique of buying piece by piece, or the price becomes cheaper as it increases the amount of the purchase, make an average near the bottom, and opportunity all at once and decreases capital input blocks missing bottom: method of capture: the product helps to obtain.
Features:
The investment bot does not trade for you, it informs you at the most convenient times, purchases are made manually.
By automating all reviews of the product you want to review, it eliminates the human and error factor that doesn't leave a feature you forgot to review.
According to past statistics, it examines whether the price of the product being studied is suitable for profit, you can instantly determine which product is cheaper, and avoid getting caught up in FOMO.
Shows the correct Trading Method to be made in the trend determined by Trend Tracking. (Hold in rising trend, buy - sell in horizontal trend, buy opportunity in falling trend)
It shows Trend turns with colored candles and you get push notifications in important areas when the alarm is set. This feature is very important, it helps you capture the product from the bottom and continue the process by moving your stop level.
According to Old statistics examined when collecting and selling goods, it shows possible price return zones where you can easily buy and sell the product with red(buy) and green(sell) lines.
You may receive notifications in overbought and sold zones. Even if you don't follow the important price movements associated with the product with the alarm when you install an Alarm, you know that your eyes will not stay behind.
Keep the plugin to yourself with customizable settings.
Method 1:
The investment bot piecemeal purchase technique plugin scores between 0 and 6 based on the price of the product; 3x, 5x. Let's think of the X value as $ 100. It looks like a $ 500 transaction will open for 3x points, 300 points, 5x points. thanks to purchases made using the piecemeal purchase technique, you provide an average price close to the lower price of the product that returns from the bottom. A 0x score indicates that this product is not suitable for medium-and long-term purchases, its price is expensive, but it is your job to green lines hit-and-run operations.
Example usage: we decided to buy Bitcoin we want to buy Bitcoin we divide the capital you set aside to buy Bitcoin into 21 parts (1x+2x+3x+4x+5x+6x=21x) if Bitcoin were at the current 3x level (3x+4x+5x=12x) we would divide it into 12 parts. Our initial purchase support and resistance lines after raising the price if the price rises, we thought we would make a left turn at the profit level we made, but it could be pulled down if it goes according to the price level we continue to add, in the process of adding each, when adding the product, to give a signal to return the price if we don't. Sometimes it can drop from 2 to 3 levels without adding products skipped level we can shop by adding your purchases to the current level you have decided. If you have collected enough products, all that remains is to wait for the rise, so you can collect the investment you have created from the appropriate levels, piece by piece or wholesale, at targets indicated by Green lines created according to the old statistics. Don't forget to make a profit.
Method 2:
The yellow candle and purple candle that come in trend turns indicate the most accurate times for us to get in and out of the process. The price is to see the yellow candle, we get the product from here and immediately between 1-3% here now the goal is that if the circuit does not occur and the drop will be lower, we catch the product from the bottom, but thanks to the product caught from the bottom, we can not stop a few times until this return to get the product out of the process, when there should be a stop under the yellow candle, stop losses that turn from the bottom area are very easily compensated. After you purchase the product, a rising trend if the trend breaks the current trend continues to fall, if the process exits, but does not continue to decline-a trend we expect to see goals worsen purple candle purple candle means to sell, but when we see these purple candles, how much you sell doesn't mean we're going to stop level under the purple candle, cheap and easy to buy products we don't sell if the rising trend continues, we are constantly moving under the purple candle to the stop level. You get maximum profit at the end of the transaction, but sometimes Future fake moves and needles will cause you to stop unnecessarily, unfortunately there is no solution or measure for this.
Warning: the investment bot plugin aims to shop at the right time, but before buying, supports must be withdrawn, it must be verified that the price does not fall only to act according to the plugin and to trade non-stop (even when collecting goods 10-20% should be placed, even better than losing 70-80% in possible large falls) is wrong. Depending on the chart time you use, the results calculated by the plugin may vary, and smaller time statistics give less reliable results.
Türkçe:
Yatırım Botu eklentisi geçmiş 90 bar(mum) istatistiklerine göre çalışmaktadır. Ucuzlayan ürünleri tespit etmek için kullanabileceğiniz gibi aldığınız ürünleri rahatça satabileceğiniz hedefleri de göstermektedir. Yatırım Botu eklentisi size tepeden ürün aldırmaz ürünü en uygun fiyattan alabilmeniz için (Yöntem 1:) parçalı alım tekniği uygulamanıza yada (Yöntem 2:) dip yakalamanıza yardımcı olur: Fiyat ucuzladıkça alım miktarını arttırarak ortalamanızın dibe yakın olmasını sağlar ayrıca tüm sermayeniz ile tek seferde girip düşüşlerde fırsatları kaçırmanıza engel olur.
Özellikleri:
Yatırım Botu sizin yerinize alım satım yapmaz en uygun zamanlarda sizi bilgilendirir, alımlar manuel yapılır.
İncelenmek istenen ürün ile ilgili tüm incelemeleri otomatik yaparak incelemeyi unuttuğunuz bir özellik bırakmaz insan ve hata faktörünü ortadan kaldırır.
İncelenen ürün fiyatının kazanç elde edilebilmesi için uygun durumda olup olmadığını geçmiş istatistiklere göre inceler hangi ürünün daha fazla ucuzladığını anında tespit edebilirsiniz, FOMO'ya kapılmanızın önüne geçer tepeden malı elinize veremezler.
Trend takibi ile tespit edilen trend'te yapılması doğru olan trade yöntemini gösterir. (Yükselen Trend'te Alınan Tutulur, Yatay Trend'te Al - Sat, Düşen Trend'te ise Fırsat Alımı)
Trend dönüşlerini renkli mumlar ile gösterir ve alarm kurulduğunda önemli bölgelerde anlık bildirimler alırsınız. Bu özellik çok önemlidir ürünü en dipten yakalamanıza ve stop seviyenizi taşıyarak işleme devam etmenize yardımcı olur.
Mal toplarken ve satarken incelenen eski istatistiklere göre ürünü kolayca alabileceğiniz ve satabileceğiniz muhtemel fiyat dönüş bölgelerini kırmızı(alış) ve yeşil(satış) çizgiler ile gösterir.
Aşırı alım ve satım bölgelerinde bildirim alabilirsiniz. Alarm kurduğunuzda alarm bulunan ürün ile ilgili önemli fiyat hareketlerini takip etmeseniz bile bilirsiniz, gözünüz arkada kalmaz.
Özelleştirilebilir ayarlar ile eklentiyi kendinize uydurun.
Yöntem 1:
Yatırım Botu Parçalı Alım Tekniği Eklentisi ürünün fiyatına bakarak ucuzlama durumunu 0 ile 6 arasında puanlar; 3x, 5x gibi. X değerini 100 dolar olarak düşünelim. 3x olan puana 300 dolarlık 5x olan puana 500 dolarlık işlem açılacak gibi. Parçalı alım tekniği ile yapılan alımlar sayesinde fiyatı dipten dönen ürünün dip fiyatına yakın bir ortalama sağlarsınız. 0x puanı o ürünün orta uzun vade alım için uygun olmadığını fiyatının pahalı olduğunu gösterir ancak yeşil hedeflere kadar vur kaç işlemleri yapmak sizin bileceğiniz iştir.
Örnek Kullanım: Bitcoin almaya karar verdik alım yapmak istiyoruz Bitcoin almak için ayırdığınız sermayeyi 21 parçaya bölüyoruz (1x+2x+3x+4x+5x+6x=21x) eğer Bitcoin şuan 3x alınabilir seviyede olsaydı (3x+4x+5x=12x) 12 parçaya bölecektik. İlk alımımızı destek ve direnç çizgilerini çektikten sonra fiyatın yukarı dönüş yapacağını düşündüğümüz seviyeden yapıyoruz fiyat yukarı giderse hemen kar ediyoruz ancak oldu da aşağı giderse alınabilir fiyat seviyelerine göre ekleme yapmaya devam ediyoruz her ekleme işlemi yapılırken fiyatın yukarı dönüş için bir sinyal vermesi şart ürün düşerken ekleme yapmıyoruz. Bazen ürün biz ekleme yapmadan 2 3 seviye birden düşebilir burada karar sizin atlanan seviye alımlarını mevcut seviyeye ekleyerek alım yapabilirsiniz. Yeterince ürün topladıysanız geriye sadece yükselişi beklemek kalır uygun seviyelerden toplayarak oluşturduğunuz yatırımı eski istatistiklere göre oluşturulan Yeşil Çizgilerle gösterilen hedeflerde parça parça yada toptan satabilirsiniz. Kar almayı ihmal etmeyin.
Yöntem 2:
Trend dönüşlerinde gelen sarı mum ve mor mum işleme girmemiz ve çıkmanız için en doğru zamanları gösterir. Sarı mum'u gördüğünüzde fiyat dip bölgesinden dönüş yapıyordur ürünü buradan alır ve hemen sarı mum altına stop koyarız %1-3 arasında olmalı daha fazla değil burada amaç eğer dönüş gerçekleşmez ve düşüş devam ederse işlemden çıkıp ürünü daha aşağıda gerçekleşecek dönüşten tekrar almaktır, ürünü dipten yakalayana kadar birkaç sefer stop olabiliriz ancak dipten yakalanan ürün sayesinde stop zararları çok rahat telafi edilmektedir. Ürünü aldıktan sonra bulunduğumuz trend yükselen bir trend ise kolay al-sat hedeflerinde ürünü ucuza satmıyoruz mor mum görmeyi bekliyoruz mor mum trend'in bozulabileceği anlamını taşıyor ancak kesin bozulacak elindekini sat kaç demek değildir bu nedenle mor mum'u gördüğümüzde stop seviyemizi mor mum altına taşıyoruz trend bozulur düşüş devam ederse işlemden çıkmış oluyoruz ancak düşüş devam etmez yükselen trend devam ederse stop seviyemizi sürekli mor mum altına taşıyarak ilerliyoruz. Sonunda maximum kar alarak işlemden çıkıyoruz ancak bazen gelecek fake hareketler ve iğneler gereksiz stop olmanıza neden olacaktır bunun bir çözümü yada önlemi yok malesef.
Uyarı: Yatırım Botu eklentisi doğru zamanlarda alım yaptırmayı amaçlar ancak alım yapmadan önce destekler çizilmeli fiyatın aşağı gitmediği onaylanmalıdır sadece eklentiye göre hareket etmek ve stopsuz işlem yapmak (Mal toplarken dahi %10-20 aşağıya bile olsa mutlaka konulmalıdır olası büyük düşüşlerde %70-80 kaybetmekten iyidir) yanlıştır. Kullandığınız grafik zamanına göre eklentinin hesapladığı sonuçlar değişebilir, küçük zaman istatistikleri daha az güvenilir sonuçlar verir.

Kairos [Signals]Kairos bot looks for the opportune time to buy low and sell high at targets
It provides signals to open and close trades, and indicates favorable positions for a stop loss and profit taking
The Kairos bot can be used on any chart and on any time frame
---BACKTESTER---
Using the backtester script the user can look at a chart's history between selected dates to find optimal bot settings and optimal time frames
The backtester is based on general percentages for profit taking as indicated below:
-------------T1 T2 T3 T4 T5 T6 CLOSE
1 Target: 50% 50%
2 Targets: 50% 25% 25%
3 Targets: 40% 30% 20% 10%
4 Targets: 40% 25% 20% 10% 5%
5 Targets: 35% 25% 20% 10% 5% 5%
6 Targets: 30% 25% 20% 10% 5% 5% 5%
ie: If 2 targets are selected:
- 50% of investment will be taken at target 1
- 25% of investment will be taken at target 2
- and the remainder 25% will be taken when the trade is closed on a close signal
However, it is up to the user's own risk appetite to determine where and how much profit to take
Note that the backtester does not have any on screen indicators other than OPEN and CLOSE, however profit taking can be indicated by ticking the Style -> Trades on Chart tick box on the settings userform
---SIGNALS---
The signals script can be used for automation and can indicate up to 6 potential Profit Targets, as well as a Stop Loss based on how many bars back needs to be taken into consideration
The signals (Open/Close) can be automated using TradingView alerts, however the Stop Loss and Profit Taking are only indicators and are for the users own interpretation
The user does not have to place a Stop Loss or take profit at the Targets if so wished, the bot can be used to simply buy on an OPEN signal and sell on a CLOSE signal, however, the backtester will indicate that it is far more profitable to take profits.
It is advised to take profits just below indicated Targets as these are potentially high selling zones and price action can sometimes turn down just short of these targets.
---INVITE-ONLY SCRIPT---
This is an invite-only script, so if you would like to try out Kairos Bot, send me a message

BURAK KRİPTO AL - SAT BOTUBURAK CRYPTO BUY-SELL BOT — Designed for high performance in crypto markets!This strategy is built on a powerful algorithm optimized with years of real trading experience. It follows trends while perfectly catching buy-at-the-bottom and sell-at-the-top opportunities.Main Features:
Trend direction detection with EMA + SMA combination
Overbought/oversold filters using RSI and Stochastic
Volume confirmation (volume breakout filter included)
ATR-based dynamic stop loss and take profit
Sideways market filter — prevents unnecessary trades
Works on all cryptocurrencies (BTCUSDT, ETHUSDT, SOLUSDT, XRPUSDT, etc.)
Both long and short signals (can be turned off separately)
High win rate and excellent profit factor in backtests Who is it for?Daily and swing traders
Spot and futures traders
Those who want to run fully automated bots (easily connected via alerts to 3Commas, Pionex, Bitsgap, etc.)
How to use:Add the script to your chart
Create an alert → “Alert on BURAK CRYPTO BUY-SELL BOT”
In the alert message field, write: For buy: BUY {{ticker}}
For sell: SELL {{ticker}}
Connect to your bot and let it do the rest automatically!
Disclaimer: No strategy guarantees 100% profit. Always apply your own risk management. Past performance is not indicative of future results.If you like it, don’t forget to hit the Like button and leave a comment! ♡
Any questions? Drop them in the comments — I reply as fast as possible!#crypto #bitcoin #tradingbot #tradingview #signals #altsat

3x ORB Alerts (JSON webhook, 3 ORBs)2× ORB Alerts (JSON Webhook, ORB4 + ORB5) is a clean, lightweight multi-session Opening Range Breakout (ORB) alert engine designed for automated trading systems using TradingView webhooks.
This indicator provides up to 3 independent ORB windows, each with:
Custom session time
Custom cutoff time (HHMM or HH:MM)
First-close breakout detection (Up or Down)
Dedicated alert conditions
Persistent ORB range + breakout price
Full JSON webhook output for bots
No boxes, no lines, no visual clutter (performance-optimized)
✔️ What this indicator does
Tracks ORB high/low during the selected session
Locks the range once the session ends
Waits for a valid breakout (close > high or close < low)
Triggers alerts only once per ORB per day
Sends a clean JSON payload to your trading bot
✔️ Webhook JSON includes
Symbol
Timeframe
ORB window number (1–3)
Breakout direction
Break price
ORB range
ATR (optional filtering)
Close price
Timestamp
Custom API key
✔️ Why this script exists
This indicator is built specifically for automated ORB trading bots, where reliability, clean signals, and low-latency alerts are critical.
No repainting, no noise — just clear breakout confirmations for fully automated systems.
✔️ Use Cases
Futures (GC, NQ, ES, CL, FDAX, etc.)
Forex session breakout strategies
Crypto ORB systems (BTC, ETH)
Multi-session automated strategies
Proprietary trading automation
✔️ How to use
Set up 1,2,3 ORB sessions
Add corresponding alert conditions
Select "Once per bar close"
Paste your webhook URL
Your trading bot receives a JSON package on every breakout

2x ORB Alerts (JSON webhook, ORB4 + ORB5)2× ORB Alerts (JSON Webhook, ORB4 + ORB5) is a clean, lightweight multi-session Opening Range Breakout (ORB) alert engine designed for automated trading systems using TradingView webhooks.
This indicator provides 2 independent ORB windows, each with:
Custom session time
Custom cutoff time (HHMM or HH:MM)
First-close breakout detection (Up or Down)
Dedicated alert conditions
Persistent ORB range + breakout price
Full JSON webhook output for bots
No boxes, no lines, no visual clutter (performance-optimized)
✔️ What this indicator does
Tracks ORB high/low during the selected session
Locks the range once the session ends
Waits for a valid breakout (close > high or close < low)
Triggers alerts only once per ORB per day
Sends a clean JSON payload to your trading bot
✔️ Webhook JSON includes
Symbol
Timeframe
ORB window number (4&5)
Breakout direction
Break price
ORB range
ATR (optional filtering)
Close price
Timestamp
Custom API key
✔️ Why this script exists
This indicator is built specifically for automated ORB trading bots, where reliability, clean signals, and low-latency alerts are critical.
No repainting, no noise — just clear breakout confirmations for fully automated systems.
✔️ Use Cases
Futures (GC, NQ, ES, CL, FDAX, etc.)
Forex session breakout strategies
Crypto ORB systems (BTC, ETH)
Multi-session automated strategies
Proprietary trading automation
✔️ How to use
Set up to 4&5 ORB sessions
Add corresponding alert conditions
Select "Once per bar close"
Paste your webhook URL
Your trading bot receives a JSON package on every breakout

SWRSI Trends (Source Out)Overview SWRSI Trends is a specialized momentum indicator based on the Relative Strength Index (RSI). While it functions as a visual trading aid with bar coloring and signal shapes, its primary purpose is to serve as a modular signal provider for other strategies and backtesting bots on TradingView.
It detects trend reversals by monitoring RSI crossovers at specific custom levels (Default: 60 and 40), rather than the standard 70/30 extreme zones.
Key Features
1. External Source Outputs (Connect to Bots) This script includes hidden plot outputs specifically designed to interface with other scripts.
RSI LONG SIGNAL (Source): Outputs a value of 1 when a Long condition is met, 0 otherwise.
RSI SHORT SIGNAL (Source): Outputs a value of 1 when a Short condition is met, 0 otherwise.
Usage: You can select these outputs as the "Entry Source" in compatible Strategy scripts or Backtest Bots without needing to copy-paste code.
2. Signal Logic
Long Signal: Triggered when the RSI line crosses OVER the Lower Threshold (Default: 40). This indicates momentum is recovering from the lower zone.
Short Signal: Triggered when the RSI line crosses UNDER the Upper Threshold (Default: 60). This indicates momentum is cooling off from the upper zone.
3. Visual Aids
Bar Coloring: Candles change color based on RSI position (Green above 60, Red below 40).
Dynamic Line: The RSI line changes color to reflect the current zone.
Settings
RSI Length: The lookback period for calculation (Default: 14).
Short Threshold: Level for bearish crossover (Default: 60).
Long Threshold: Level for bullish crossover (Default: 40).
Color Bars: Toggle candle painting on/off.
How to Connect to Another Indicator
Add SWRSI Trends to your chart.
Open the settings of your Target Strategy/Bot (e.g., SwietcherBot).
In the "Source" or "External Signal" input field, select "SWRSI Trends: RSI LONG SIGNAL" or "RSI SHORT SIGNAL" from the dropdown menu.
Breakout Patterns Detector: Triangle & Wedge [Splirus]This indicator identifies Breakout Patterns such as Ascending Triangles , Descending Triangles , Symmetric Triangles , Ascending Wedges , and Descending Wedges , using candlestick charts and Trendlines. It provides visual cues, stop-loss (SL), and take-profit (TP) levels, alongside a detailed dashboard to evaluate performance. The indicator supports two alert modes: Manual Mode for trader notifications and Bot Mode for automated trading signals.
To achieve optimal results, users are encouraged to experiment with indicator parameters and analyze the dashboard summary to find the perfect configuration for each timeframe, pair, and market condition.
Pattern Identification
The indicator detects the following breakout patterns based on pivot highs and lows:
Ascending Triangle : Flat upper trendline, rising lower trendline.
Descending Triangle : Flat lower trendline, declining upper trendline.
Symmetric Triangle : Converging trendlines with similar slopes (within a user-defined threshold).
Ascending Wedge : Both trendlines slope upward, converging.
Descending Wedge : Both trendlines slope downward, converging.
Patterns are identified using configurable left and right bars for small and big patterns, with slope thresholds normalized by ATR. A trend confirmation filter ensures breakouts align with market direction, and users can adjust breakout confirmation bars to validate signals.
The goal is to fine-tune these settings to suit specific timeframes and pairs, as each combination may require a unique setup for optimal performance.
Stop-Loss Calculation
Stop-loss levels are calculated dynamically based on pattern type and breakout direction:
Symmetric Triangle : SL is set at the first pivot of the opposite trendline, adjusted by a buffer percentage.
Ascending/Descending Triangle : SL is placed at the breakout trendline’s price, plus the buffer.
Ascending/Descending Wedge : SL is set at the second pivot of the opposite trendline, adjusted by the buffer.
The indicator calculates leverage based on a user-defined risk tolerance percentage. Users should adjust the SL buffer and risk tolerance to balance risk and reward, monitoring the dashboard to assess how these settings impact performance across different timeframes and pairs.
Take-Profit Calculation
Three take-profit levels ( TP1 , TP2 , TP3 ) are calculated using pattern height and user-defined multipliers:
For Ascending/Descending Triangles, height is the difference between the max and min prices within the pattern.
For Symmetric Triangles and Wedges, height is the vertical distance between trendlines at the pattern’s start.
TP levels are set as:
TP1 = Breakout price ± (Height × TP1 Multiplier).
TP2 = Breakout price ± (Height × TP2 Multiplier).
TP3 = Breakout price ± (Height × TP3 Multiplier, with a 1.5x adjustment for Wedges).
Experiment with TP multipliers to optimize the risk-reward ratio, using the dashboard to evaluate TP hit rates and overall profitability for each configuration.
Symmetric Triangle:
Ascending/Descending Wedge:
Ascending/Descending Triangles:
Finding the Perfect Configuration
The indicator’s dashboard provides a comprehensive summary of performance metrics, including total trades, TP1/TP2/TP3 hits, SL hits, profit/loss percentages, and win rates for bullish, bearish, and combined trades. These metrics are crucial for identifying the ideal parameter settings:
Timeframe and Pair Variability : Each timeframe (e.g., 15m, 30min, 1H, 4H, Daily) and pair (e.g., BTC/USD, EUR/USD) behaves differently. Adjust parameters like left/right bars, minimum pattern length, and breakout confirmation bars to match the volatility and trend characteristics of the chosen pair and timeframe.
Parameter Tuning : Modify slope thresholds, trend confirmation filters, and bars inside the pattern to filter out false breakouts. For example, a higher breakout confirmation bar setting may reduce signals but increase reliability on longer timeframes.
Dashboard Analysis : Focus on the dashboard’s win rate, profit/loss ratio, and TP/SL hit frequencies. A “Perfect” win rate (>66%) or high TP hit rate indicates a strong configuration. If the SL hit rate is high, consider tightening the trend confirmation filter or increasing the SL buffer.
Iterative Testing : Test different combinations of settings (e.g., small vs. big patterns, aggressive vs. conservative breakout confirmation) and compare dashboard results over time. The goal is to find a balance where the indicator consistently delivers high win rates and profitability for your specific trading setup.
Alert Modes
The indicator supports two alert modes to suit different trading styles:
Manual Mode : Generates alerts for breakouts with entry price, SL, TP1/TP2/TP3, and leverage, tailored for Crypto or Forex markets. Use this mode to manually evaluate signals while refining configurations.
Bot Mode : Sends automated trading signals. To avoid conflicts, Bot Mode ensures no short position alert is triggered while a long position is active, and vice versa. This mode is ideal once you’ve identified an optimal configuration via the dashboard.
Additional Features
Historical Patterns : Displays past trendlines with customizable transparency and extension, helping users analyze how patterns performed under different settings.
Customizable Settings : Adjust pattern size, breakout confirmation, trend filters, and visual preferences (colors, dashboard location) to match your trading style.
Market Compatibility : Supports Crypto and Forex markets across all timeframes, but requires careful tuning for each market type.
Usage Notes
Start with default settings and monitor the dashboard to establish a baseline performance for your chosen timeframe and pair.
Gradually adjust one parameter at a time (e.g., left/right bars, TP multipliers) and compare dashboard results to identify improvements.
Use historical pattern analysis to understand how past breakouts performed under different configurations, guiding your optimization process.
Once a high win rate and profitability are achieved, consider automating trades with Bot Mode for consistent execution.
Disclaimer
This indicator is intended for educational purposes only and should not be considered financial advice. Trading involves significant risk, and past performance is not indicative of future results. Users are strongly advised to thoroughly test and validate the indicator’s signals in a demo environment before using it in live trading. The author is not responsible for any financial losses incurred while using this indicator. Always conduct your own research and consult with a qualified financial advisor before making trading decisions.

All-in-One BB Stoch RSI + PSAR + Keltner + ADX + Trailing StopThis invite-only indicator combines multiple advanced tools into a single script, generating buy/short signals alongside comprehensive alerts. Priced at just $25/month, it’s ideal for both manual trading and integration with bots.
Key Features & Alerts
Buy & Short Signals
Quickly identify potential long or short entries.
Three Take-Profit (TP) Lines
Long: After a BUY signal, three lines appear (TP1, TP2, TP3), allowing you to take partial profits—e.g., 30%, 30%, 30%—and keep the remaining 10% to trail.
Short: Similarly, after a SHORT signal, three TP lines help you scale out as price moves in your favor.
Stop-Loss Line (Based on Bollinger Width)
Precisely calculates a stop-loss distance using Bollinger Band width (a percentage below for longs or above for shorts).
Trailing Stop-Loss
Any remaining position can be trailed under (or above) Parabolic SAR, Keltner Channels, and Bollinger, with an extra 0.2% margin for added caution.
ADX + Stoch RSI + RSI (MA)
Filter out weak trends, gauge volatility, and confirm overbought/oversold regions in real time.
Compatible With Trading Bots
Built-in alerts can be connected to bot logic (via webhooks), enabling automated management of entries, TPs, stop-losses, and trailing stops.
Why Use This Indicator?
All-in-One Script: Eliminates chart clutter by merging multiple indicators into one.
Partial Take-Profits: Clearly defined TP1, TP2, TP3 lines help you lock in gains progressively.
Enhanced Risk Control: Stop-loss and trailing stop lines update automatically, keeping your trades protected.
Easy Bot Integration: Perfect for traders wanting direct alerts or automated trading setups.
Invite-Only for Exclusive Access: Maintain a competitive edge with protected source code.
How to Use:
Add to Chart
After access is granted, go to Indicators → Invite-Only Scripts and select this script.
Enable Specialized Alerts
Receive notifications for Buy/Short signals, the three TP lines, Stop-Loss, and Trailing Stop events.
Scale Out or Automate
Manually close partial positions at the TP lines (e.g., 30% each time) and let the remaining 10% trail for bigger moves.
Or link these alerts to a trading bot for fully automated position management.
Price: $25/month
Interested? Contact me (via direct message or email) for more details and to subscribe. Experience clearer charts, timely signals, and robust risk management in one invite-only package!
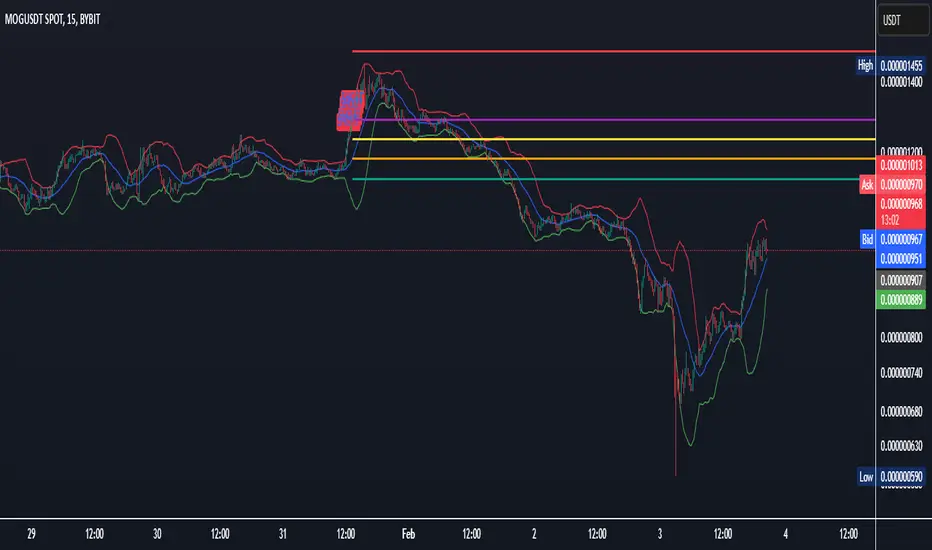
Multi-indicator Signal Builder [Skyrexio]Overview
Multi-Indicator Signal Builder is a versatile, all-in-one script designed to streamline your trading workflow by combining multiple popular technical indicators under a single roof. It features a single-entry, single-exit logic, intrabar stop-loss/take-profit handling, an optional time filter, a visually accessible condition table, and a built-in statistics label. Traders can choose any combination of 12+ indicators (RSI, Ultimate Oscillator, Bollinger %B, Moving Averages, ADX, Stochastic, MACD, PSAR, MFI, CCI, Heikin Ashi, and a “TV Screener” placeholder) to form entry or exit conditions. This script aims to simplify strategy creation and analysis, making it a powerful toolkit for technical traders.
Indicators Overview
1. RSI (Relative Strength Index)
Measures recent price changes to evaluate overbought or oversold conditions on a 0–100 scale.
2. Ultimate Oscillator (UO)
Uses weighted averages of three different timeframes, aiming to confirm price momentum while avoiding false divergences.
3. Bollinger %B
Expresses price relative to Bollinger Bands, indicating whether price is near the upper band (overbought) or lower band (oversold).
4. Moving Average (MA)
Smooths price data over a specified period. The script supports both SMA and EMA to help identify trend direction and potential crossovers.
5. ADX (Average Directional Index)
Gauges the strength of a trend (0–100). Higher ADX signals stronger momentum, while lower ADX indicates a weaker trend.
6. Stochastic
Compares a closing price to a price range over a given period to identify momentum shifts and potential reversals.
7. MACD (Moving Average Convergence/Divergence)
Tracks the difference between two EMAs plus a signal line, commonly used to spot momentum flips through crossovers.
8. PSAR (Parabolic SAR)
Plots a trailing stop-and-reverse dot that moves with the trend. Often used to signal potential reversals when price crosses PSAR.
9. MFI (Money Flow Index)
Similar to RSI but incorporates volume data. A reading above 80 can suggest overbought conditions, while below 20 may indicate oversold.
10. CCI (Commodity Channel Index)
Identifies cyclical trends or overbought/oversold levels by comparing current price to an average price over a set timeframe.
11. Heikin Ashi
A type of candlestick charting that filters out market noise. The script uses a streak-based approach (multiple consecutive bullish or bearish bars) to gauge mini-trends.
12. TV Screener
A placeholder condition designed to integrate external buy/sell logic (like a TradingView “Buy” or “Sell” rating). Users can override or reference external signals if desired.
Unique Features
1. Multi-Indicator Entry and Exit
You can selectively enable any subset of 12+ classic indicators, each with customizable parameters and conditions. A position opens only if all enabled entry conditions are met, and it closes only when all enabled exit conditions are satisfied, helping reduce false triggers.
2. Single-Entry / Single-Exit with Intrabar SL/TP
The script supports a single position at a time. Once a position is open, it monitors intrabar to see if the price hits your stop-loss or take-profit levels before the bar closes, making results more realistic for fast-moving markets.
3. Time Window Filter
Users may specify a start/end date range during which trades are allowed, making it convenient to focus on specific market cycles for backtesting or live trading.
4. Condition Table and Statistics
A table at the bottom of the chart lists all active entry/exit indicators. Upon each closed trade, an integrated statistics label displays net profit, total trades, win/loss count, average and median PnL, etc.
5. Seamless Alerts and Automation
Configure alerts in TradingView using “Any alert() function call.”
The script sends JSON alert messages you can route to your own webhook.
The indicator can be integrated with Skyrexio alert bots to automate execution on major cryptocurrency exchanges
6. Optional MA/PSAR Plots
For added visual clarity, optionally plot the chosen moving averages or PSAR on the chart to confirm signals without stacking multiple indicators.
Methodology
1. Multi-Indicator Entry Logic
When multiple entry indicators are enabled (e.g., RSI + Stochastic + MACD), the script requires all signals to align before generating an entry. Each indicator can be set for crossovers, crossunders, thresholds (above/below), etc. This “AND” logic aims to filter out low-confidence triggers.
2. Single-Entry Intrabar SL/TP
One Position At a Time: Once an entry signal triggers, a trade opens at the bar’s close.
Intrabar Checks: Stop-loss and take-profit levels (if enabled) are monitored on every tick. If either is reached, the position closes immediately, without waiting for the bar to end.
3. Exit Logic
All Conditions Must Agree: If the trade is still open (SL/TP not triggered), then all enabled exit indicators must confirm a closure before the script exits on the bar’s close.
4. Time Filter
Optional Trading Window: You can activate a date/time range to constrain entries and exits strictly to that interval.
Justification of Methodology
Indicator Confluence: Combining multiple tools (RSI, MACD, etc.) can reduce noise and false signals.
Intrabar SL/TP: Capturing real-time spikes or dips provides a more precise reflection of typical live trading scenarios.
Single-Entry Model: Straightforward for both manual and automated tracking (especially important in bridging to bots).
Custom Date Range: Helps refine backtesting for specific market conditions or to avoid known irregular data periods.
How to Use
1. Add the Script to Your Chart
In TradingView, open Indicators , search for “Multi-indicator Signal Builder”.
Click to add it to your chart.
2. Configure Inputs
Time Filter: Set a start and end date for trades.
Alerts Messages: Input any JSON or text payload needed by your external service or bot.
Entry Conditions: Enable and configure any indicators (e.g., RSI, MACD) for a confluence-based entry.
Close Conditions: Enable exit indicators, along with optional SL (negative %) and TP (positive %) levels.
3. Set Up Alerts
In TradingView, select “Create Alert” → Condition = “Any alert() function call” → choose this script.
Entry Alert: Triggers on the script’s entry signal.
Close Alert: Triggers on the script’s close signal (or if SL/TP is hit).
Skyrexio Alert Bots: You can route these alerts via webhook to Skyrexio alert bots to automate order execution on major crypto exchanges (or any other supported broker).
4. Visual Reference
A condition table at the bottom summarizes active signals.
Statistics Label updates automatically as trades are closed, showing PnL stats and distribution metrics.
Backtesting Guidelines
Symbol/Timeframe: Works on multiple assets and timeframes; always do thorough testing.
Realistic Costs: Adjust commissions and potential slippage to match typical exchange conditions.
Risk Management: If using the built-in stop-loss/take-profit, set percentages that reflect your personal risk tolerance.
Longer Test Horizons: Verify performance across diverse market cycles to gauge reliability.
Example of statistic calculation
Test Period: 2023-01-01 to 2025-12-31
Initial Capital: $1,000
Commission: 0.1%, Slippage ~5 ticks
Trade Count: 468 (varies by strategy conditions)
Win rate: 76% (varies by strategy conditions)
Net Profit: +96.17% (varies by strategy conditions)
Disclaimer
This indicator is provided strictly for informational and educational purposes .
It does not constitute financial or trading advice.
Past performance never guarantees future results.
Always test thoroughly in demo environments before using real capital.
Enjoy exploring the Multi-Indicator Signal Builder! Experiment with different indicator combinations and adjust parameters to align with your trading preferences, whether you trade manually or link your alerts to external automation services. Happy trading and stay safe!

Ultimate Grid Tool + Alerts (DCA & Limit Orders) [enzedengineer]Overview
The "Ultimate Grid Tool + Alerts" script works much like a grid bot from automated trading services such as 3Commas making it a good free alternative with some extra utility.
How it works
The user is prompted to set up a grid by manually defining a lower and upper range and then by selecting how many grid segments they want (max 20). The script will automatically create equally spaced grids within this defined range. The script has built in alerts which are intended to be used in conjunction with a third-party application to execute buy and sell orders on an exchange.
The script has two alert functionalities to choose between:
Limit orders (like traditional grid bots) or;
DCA zones (time-based)
DCA zones:
This is the default selection. Each zone has its own alert condition which is triggered if the price closes within that zone. The frequency of the alert is determined by the user's chart resolution, therefore you can have the alert trigger every day, or 4 hours, or 30 minutes and so on. This allows for flexibility, for example, you could go from DCA'ing at $20 per day at higher prices to $100 per day as the price drops into the lower end of your grid range.
Limit orders:
This mode is selected by checking the "Limit Order" box. As mentioned earlier, this mode works like traditional grid bots with each grid line representing a limit order. The alert condition is met when ta.cross(close, gridline) = true.
Buy and Sell:
This mode is selected by checking the "Buy and Sell" box. This is a visual modification only which changes the colour of the grids to help plan the user's trading. Please note, there is no buying or selling logic within the script itself - this should be built into the alert message to be used with a third-party application for exchange order execution.
Use case: The author of this script has been using it with the default settings to DCA into Bitcoin in the current bear market. Using a chart resolution of 15 minutes the script purchases x-amount of Bitcoin every 15 minutes (Alertatron executes the exchange orders). This method provides a well blended average price and takes away the internal conundrum of "should I buy some today". No matter what, the bot will make a purchase within at least 15 minutes of the ultimate Bitcoin bottom and arguably this gives a psychological edge and reduces FOMO (fear of missing out).
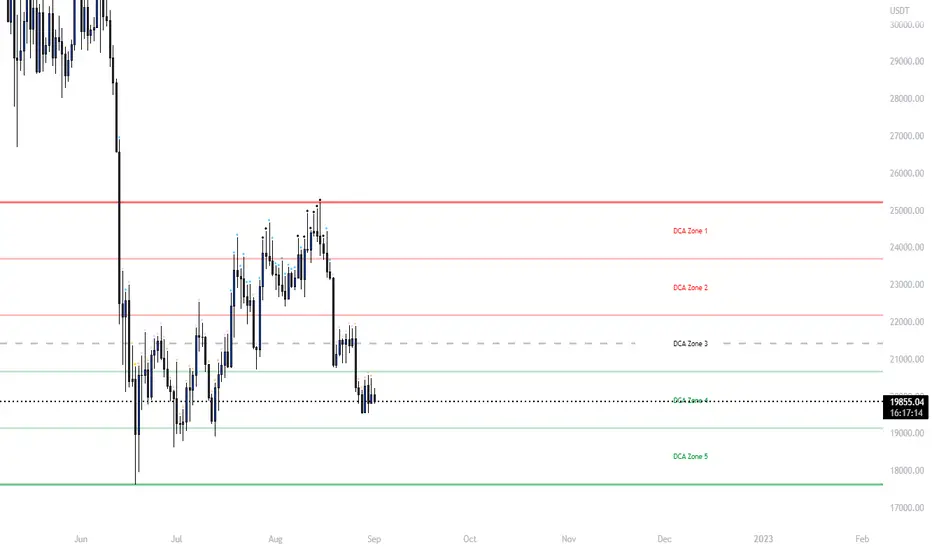
MPF EMA Cross Strategy (8~13~21) by Market Pip FactoryThis script is for a complete strategy to win maximum profit on trades whilst keeping losses at a minimum, using sound risk management at no greater than 1.5%
The 3x EMA Strategy uses the following parameters for trade activation and closure.
1/ Daily Time Frame for trend confirmation
2/ 4 Hourly Time Frame for trend confirmation
3/ 1 Hourly Time Frame for trend confirmation AND trade execution
4/ 3x EMAs (Exponential Moving Averages)
* EMA#1 = 8 EMA (Red Color)
* EMA#2 = 13 EMA (Blue Color)
* EMA#3 = 21 EMA (Orange Color)
5/ Fanning of all 3x EMAs and CrossOver/CrossUnder for Trend Confirmation
6/ Price Action touching an 8 EMA for trade activation
7/ Price Action touching a 21 EMA for trade cancellation BEFORE activation
* For LONG trades: 8 EMA would be ABOVE 21 EMA
* For SHORT trades: 8 EMA would be BELOW 21 EMA
* For trade Cancellation, price action would touch the 21 EMA before trade is activated
* For trade Entry, price action would touch 8 EMA
Once trigger parameter is identified, entry is found by:
a) Price action touches 8 EMA (Candle must Close for confirmed Trade preparation)
b) Trade preparation can be cancelled before trade is activated if price action touches 21 EMA
c) Trailing Stop Loss can be used (optional) by counting back 5 candles from current candle
CLOSURE of a Trade is identified by:
e) 8 EMA crossing the 21 EMA, then close trade, no matter LONG or SHORT
f) Trail Stop Loss
IMPORTANT:
g) No more than ONE activated trade per EMA crossover
h) No more than ONE active trade per pair
NOTE: This strategy is to be used in conjunction with Cipher Twister (my other indicator) to reduce trades on
sideways price action and market trends for super high win ratio.
NOTE: Enabling of LONGs and SHORTs Via Cipher Twister is done by using the previous
green or red dot made. Additionally, when the trend changes, so do the dot's validity based
on being above or below the 0 centerline.
----------------------------
Strategy and Bot Logic
----------------------------
.....::: FOR SHORT TRADES ONLY :::.....
The Robot must use the following logic to enable and activate the SHORT trades:
Parameters:
$(crossunder)=8EMA,21EMA=Bearish $(crossover)=8EMA,21EMA=Bullish $entry=SELL STOP ORDER (Short)
$EMA#1 = 8 EMA (Red Color) $EMA#2 = 13 EMA (Blue Color) $EMA#3 = 21 EMA (Orange Color)
Strategy Logic:
1/ Check Daily Time Frame for trend confirmation if:
(look back up to 50 candles - find last cross of EMAs)
$(chart)=daily and trend=$(crossunder) then goto 2/ *Means: crossunder = ema21 > ema8
$(chart)=daily and trend=$(crossover) then stop (No trades) *Means: crossover = ema8 > ema21
NOTE: This function is switchable. 0=off and 1=on(active). Default = 1 (on)
2/ Check 4 Hourly Time Frame for trend confirmation if:
(look back up to 50 candles - find last cross of EMAs)
$(chart)=4H and trend=$(crossunder) then goto 3/ *Means: crossunder = ema21 > ema8
$(chart)=4H and trend=$(crossover) then stop (No trades) *Means: crossover = ema8 > ema21
NOTE: This function is switchable. 0=off and 1=on(active). Default = 1 (on)
3/ 1 Hourly Time Frame for trend confirmation AND trade execution if:
(look back up to 50 candles - find last cross of EMAs)
$(chart)=1H and trend=$(crossunder) then goto 4/ *Means: crossunder = ema21 > ema8
$(chart)=1H and trend=$(crossover) then stop (No trades) *Means: crossover = ema8 > ema21
4/ Trade preparation:
* if Next (subsequent) candle touches 8EMA, then set STOP LOSS and ENTRY
* $stoploss=3 pips ABOVE current candle HIGH
* $entry=3 pips BELOW current candle LOW
5/ Trade waiting (ONLY BEFORE entry is hit and trade activated):
* if price action touches 21 EMA then cancel trade and goto 1/
Note: Once trade is active this function does not apply !
6/ Trade Activation:
* if price activates/hits ENTRY price, then bot activates trade SHORTs market
7/ Optional Trailing stop:
* if active, then trailing stop 3 pips ABOVE previous HIGH of previous 5th candle
or * Move Stop Loss to Break Even after $X number of pips
NOTE: This means count back and apply accordingly to the 5th previous candle from current candle.
NOTE: This function is switchable. 0=off and 1=on(active). Default = 0 (off)
8/ Trade Close ~ Take Profit:
* Only TP when
$(chart)=1H and trend=$(crossover) then close trade ~ Or obviously if Stop Loss is hit if 7/ is activated.
----------END FOR SHORT TRADES LOGIC----------
.....::: FOR LONG TRADES ONLY :::.....
The Robot must use the following logic to enable and activate the LONG trades:
Parameters:
$(crossunder)=8EMA,21EMA=Bearish $(crossover)=8EMA,21EMA=Bullish $entry=BUY STOP ORDER (Long)
$EMA#1 = 8 EMA (Red Color) $EMA#2 = 13 EMA (Blue Color) $EMA#3 = 21 EMA (Orange Color)
Strategy Logic:
1/ Check Daily Time Frame for trend confirmation if:
(look back up to 50 candles - find last cross of EMAs)
$(chart)=daily and trend=$(crossover) then goto 2/ *Means: crossover = ema8 > ema21
$(chart)=daily and trend=$(crossunder) then stop (No trades) *Means: crossunder = ema21 > ema8
NOTE: This function is switchable. 0=off and 1=on(active). Default = 1 (on)
2/ Check 4 Hourly Time Frame for trend confirmation if:
(look back up to 50 candles - find last cross of EMAs)
$(chart)=4H and trend=$(crossover) then goto 3/ *Means: crossover = ema8 > ema21
$(chart)=4H and trend=$(crossunder) then stop (No trades) *Means: crossunder = ema21 > ema8
NOTE: This function is switchable. 0=off and 1=on(active). Default = 1 (on)
3/ 1 Hourly Time Frame for trend confirmation AND trade execution if:
(look back up to 50 candles - find last cross of EMAs)
$(chart)=1H and trend=$(crossover) then goto 4/ *Means: crossover = ema8 > ema21
$(chart)=1H and trend=$(crossunder) then stop (No trades) *Means: crossunder = ema21 > ema8
4/ Trade preparation:
* if Next (subsequent) candle touches 8EMA, then set STOP LOSS and ENTRY
* $stoploss=3 pips BELOW current candle LOW
* $entry=3 pips ABOVE current candle HIGH
5/ Trade waiting (ONLY BEFORE entry is hit and trade activated):
* if price action touches 21 EMA then cancel trade and goto 1/
Note: Once trade is active this function does not apply !
6/ Trade Activation:
* if price activates/hits ENTRY price, then bot activates trade LONGs market
7/ Optional Trailing stop:
* if active, then trailing stop 3 pips BELOW previous LOW of previous 5th candle
or * Move Stop Loss to Break Even after $X number of pips
NOTE: This means count back and apply accordingly to the 5th previous candle from current candle.
NOTE: This function is switchable. 0=off and 1=on(active). Default = 0 (off)
8/ Trade Close ~ Take Profit:
* Only TP when
$(chart)=1H and trend=$(crossunder) then close trade ~ Or obviously if Stop Loss is hit if 7/ is activated.
----------END FOR LONG TRADES LOGIC----------
IMPORTANT:
* If an existing trade is already open for that same pair, & price action touches 8EMA, do NOT open a new trade..
* bot must continuously check if a trade is currently open on the pair that triggers
* New trades are to be only opened if there is no active trade opened on current pair.
* Only 1 trade per pair rule !
* 5 simultaneous open trades (not same pairs) default = 5 but value can be changed accordingly.
* Maximum risk management must not exceed 1.5% on lot size
*** Some features are not yet available autoated, they will be added in due course in subsequent version updates ***

MoonFlag DailyThis is a useful indicator as it shows potential long and short regions by coloring the AI wavecloud green or red.
There is an option to show a faint white background in regions where the green/red cloud parts are failing as a trade from the start position of each region.
Its a combination of 3 algos I developed, and there is an option to switch to see these individually, although this has lots of info and is a bit confusing.
It does have alerts and there are text boxes in the indicator settings where a comment can be input - this is useful for webhooks bots auto trading.
Most useful in this indicator is that at the end of each green/long or red/short region there is a label that shows the % gain or loss for a trade.
The label at the end of the chart shows the % of winning longs/shorts and the average % gain or loss for all the longs/shorts within the set test period (set in settings)
So, I generally set the chart initially on a 15min timeframe with the indicator timeframe (in settings) set to run on say 30min or 1hour. I then select a long test period (several plus months) and then optimize the wavelcloud length (in settings) to give the best %profit per trade. (Longs always seem to give better results than shorts)
I then, change the chart timeframe to much faster, say 1min or 5min, but leave the indicator timeframe at 1 hour. In this manner - the label only shows a few trades however, the algo is run at every bar close and when this is set to 1min, this means that losses will be minimised at the bot exits quickly. In comparison - if the chart is on a 15min timeframe - it can take this amount before the bot will exit a trade and by then there could be catastrophic losses.
It is quite hard to get a positive result - although with a bit of playing around - just as a background indicator - I find this useful. I generally set-up on say 4charts all with different timeframes and then look for consistency between the long/short signal positions. (Although when I run as a bot I use a fast timeframe)
Please do leave some comments and get in touch.
MoonFlag (Josef Tainsh PhD)
