[ADOL_]ARVIS 3ENG) This is version 3 of ARVIS BOT. ARVIS 3
Since it is a new version with a completely different identity from Trend Break, we do not use the name Trend Break.
It is a version made lighter in the existing version and newly created logic.
Existing ARVIS users can use versions 1, 2, 3 and 3R auxiliary tools to be added without additional rights.
Optional use is possible.
principle)
Features of the new core logic:
It was created considering the relative strength RSI and the ICHIMOKU moving average.
Identify the trend strength to generate a long and short reversal signal at the reversal of the trend.
By using HTF signal, it is possible to bring the signal of the upper time to the smaller time.
By using HTF, the candle splits and the standard maintains the flow of time.
A method was used to reduce the whipsaw of frequent signal appearances.
option)
A volatility warning notification has been included. A function that alerts you before volatility increases.
It is indicated in the form of ■ at the bottom of the chart.
You can optionally set the signal range.
Dynamic Fibonacci moving along the candlestick was applied. 0.5 is used as a criterion for determining a large trend.
By combining the RSI and the moving average, you can apply a background that utilizes the RSI as a sensitivity.
By combining RSI and Stochastic, the overbought/oversold section was output as the background.
You can output overbought/oversold at the desired time as a background.
Up/down divergence included as background.
Black is downward divergence and white is upward divergence.
In the lower right corner, an indicator for the probability of a long is added by combining the multiple moving averages and the figures analyzed for the convergence trend.
50% is used as a reference point for long/short conversion, 10~20% is considered oversold section, and 80~90% is considered overbought section.
It can be used as a reference point for counter-trend trading. Probability indicators allow you to increase your judgment with visualized numbers.
principle example)
time frame)
Recommended time frame: 15-minute peaks >> 1-hour peaks > 1.3-minute peaks = 4 hour peaks = daily
alarm)
Various alert functions are available. based on the alert signal
When trading, various signals help to set specific conditions.
- HTF Long Short , Alert
- Volatility warning alert
- Basic long and short alerts
- Up/down divergence alert
trading method)
1. Utilize SIGNAL1 L,S signals. It is a similar approach to the existing manual bot mode.
2.SIGNAL2's , signals can bring high-time signals to buy and sell. This is a similar approach to the existing autobot mode.
If you bring a high time signal to a small time, you can refine the hit point, so in this case, use SIGNAL2 of 15 minutes or longer.
SIGNAL2 15-minute view at 3-minute peak, SIGNAL 1 hour view at 15-minute peak, and SIGNAL 4 hour view at 1-hour peak are recommended values.
3-1. Entry criteria/stop loss criteria (when trading hands and bots)
- entry criteria; Follow the signal.
- Stop loss criteria;
Use fixed stop loss: Set 1% fixed stop loss section from signal generation. (% is set individually)
Use Candle Stop Loss: Set a stop loss when the low or high point of the signal generating bar collapses.
Use flow stop loss: Set the stop loss considering the flow of the wave.
3-2. Entry criteria/stop loss criteria (in case of signal-based bot trading)
- It is not recommended to use more than 3x magnification. The above entry requires manual intervention and risk management.
It switches every time the opposite signal appears after entering without setting the stop loss separately.
Example of using the 15-minute HTF signal in the 3-minute scale
4. Note
You are solely responsible for any trading decisions you make.
ARVIS 3R indicator will be updated. Required for use of ARVIS 3
This is an additional feature. It is created as an indicator at the bottom, not as a candle chart.
5. How to use
It is set to be available only to invited users. When invited,
Tap Add Indicator to Favorites at the bottom of the indicator.
If you click the indicator at the top of the chart screen and look at the left tab, there is a Favorites tab.
Add an indicator by clicking the indicator name in the Favorites tab.
KOR) ARVIS BOT의 3버전입니다. ARVIS 3
Trend Break와 정체성을 완전히 달리한 신버전이므로
더이상 Trend Break 의 명칭을 쓰지 않습니다.
기존버전을 경량화하고 로직을 새롭게 만든 버전입니다.
기존의 ARVIS 이용자는 추가 권한 없이 1,2,3버전과 추가될 3R보조도구의
선택 활용이 가능합니다.
원리)
새로운 핵심적인 로직의 기능 :
상대강도인 RSI와 ICHIMOKU 이평선을 고려하여 만들어졌습니다.
추세강도를 파악해 추세의 전환자리에서 롱과 숏의 전환 신호를 발생시키도록 합니다.
HTF신호를 이용하여 상위 시간의 신호를 작은 시간대로 가져올 수 있습니다.
HTF를 활용함으로써 캔들은 쪼개고 기준은 상위 시간의 흐름을 유지해
잦은 신호출현의 휩쏘를 줄이는 방법을 사용하였습니다.
옵션)
변동성 경고 알림이 포함되었습니다. 변동성이 커지기 전에 미리 알려주는 기능으로
차트하단에 ■ 형태로 표기됩니다.
시그널의 범위를 옵션으로 설정할 수 있습니다.
캔들을 따라 움직이는 동적 피보나치가 적용되었습니다. 0.5를 큰 추세 판단 기준으로 활용합니다.
RSI와 이평선을 결합하여 RSI를 민감도로 활용한 배경을 적용할 수 있습니다.
RSI와 스토캐스틱을 결합하여 과매수/과매도구간을 배경으로 출력하였습니다.
원하는 시간의 과매수/과매도를 배경으로 출력할 수 있습니다.
상승/하락 다이버전스가 배경으로 포함되었습니다.
검은색은 하락다이버전스, 흰색은 상승다이버전스입니다.
우측하단에 다중이평선과 수렴추세를 분석한 수치를 종합하여 롱의 확률에 대한 표시기가 추가되었습니다.
50%는 롱/숏의 전환 기준점으로 활용하며, 10~20%는 과매도 구간, 80~90%는 과매수 구간으로 간주하여
역추세 매매의 기준점으로 활용할 수 있습니다. 확률 표시기를 통해 가시화된 수치로 판단을 높일 수 있습니다.
원리 예시)
타임프레임)
추천타임프레임 : 15분봉 >> 1시간봉 > 1,3분봉 = 4시간봉 = 일봉
알람)
다양한 얼러트 기능을 사용할 수 있습니다. 얼러트 신호를 기반으로
매매시 다양한 신호는 구체적 조건 설정에 도움이 됩니다.
- HTF 롱숏🥵,🥶 얼러트
- 변동성 경고 얼러트
- 기본 롱,숏 얼러트
- 상승/하락 다이버전스 얼러트
매매방법)
1. SIGNAL1 L,S 신호를 활용합니다. 기존의 수동봇 모드와 비슷한 접근입니다.
2.SIGNAL2의 🥵,🥶 신호는 높은 시간의 신호를 가져와 매매할 수 있습니다. 기존의 자동봇 모드와 비슷한 접근입니다.
높은 시간대의 신호를 작은시간으로 가져오면 타점을 정교화 할 수 있으므로, 이와같은 경우 15분 이상의 SIGNAL2를 활용합니다.
3분봉에서 SIGNAL2 15분 보기, 15분봉에서 SIGNAL 1시간 보기, 1시간봉에서 SIGNAL 4시간 보기가 추천값입니다.
3-1. 진입기준/손절기준(손,봇 매매시)
- 진입기준; 시그널을 따릅니다.
- 손절기준;
고정손절가 이용 : 시그널 발생으로부터 1% 고정 손절가 구간을 설정합니다.(%는 개별로 설정)
캔들손절가 이용 : 시그널 발생봉의 저점이나 고점이 무너지면 손절을 설정합니다.
흐름손절가 이용 : 파동의 흐름을 고려하여 손절을 설정합니다.
3-2. 진입기준/손절기준(신호기반 봇 매매시)
- 3배율 이상을 권장하지 않습니다. 이상의 진입은 수동개입으로 리스크관리가 필요합니다.
손절가를 따로 설정하지 않고 진입후 반대신호가 뜰때마다 스위칭을 합니다.
3분봉에서 15분HTF 신호사용의 예시
4. 참고
귀하가 내리는 모든 거래 결정은 전적으로 귀하의 책임입니다.
ARVIS 3R 지표가 업데이트 예정입니다. ARVIS 3의 활용에 필요한
부가적인 기능입니다. 캔들차트가 아닌 하단의 지표로 생성됩니다.
5. 사용방법
초대된 사용자만 사용할 수 있도록 설정이 되어있습니다. 초대를 받을 경우,
지표 하단의 즐겨찾기에 인디케이터 넣기를 누릅니다.
차트화면 상단에 지표를 눌러서 왼쪽탭에 보면 즐겨찾기 탭이 있습니다.
즐겨찾기 탭에서 지표이름을 눌러서 지표를 추가합니다.
Search in scripts for "bot"

ComboTrade V.2.1 (BuySell Signals,Take profit,4MA,Fibo,Ichi+QL)A WORD WITH ESTEEMED TRADERS:
The type of indicator that a trader uses to create a strategy depends on the type of strategy he intends to employ; this is related to the trading style and the trader's loss tolerance.
A trader looking for a long-term trade with high profits may adopt a follow-up strategy, and on the other hand, a trader who decides to make short-term trades with frequent but low profits may be eager to use a strategy based on price fluctuations. Different types of indicators can be used to confirm the results.
Indicators alone should not be used as a tool to make trading decisions. Instead, every trader should use indicators to receive trading signals and formulate trading strategies and determine his or her exact method.
Brief and essential description:
With the above description, traders are advised to use the ComboTrade indicator as a trading assistant. Using the tools embedded in this trading assistant makes it easy for traders and depending on the trading strategy, you can get the best result for positioning.
Note 1: The trading time frame for ComboTrade with over one hour (1H) will achieve best result. Checking out the lower time frame to buy or sell as a confirmation is recommended.
Note 2: At Trading View home screen choose “ Candles or ...” as “Bar’s Style”.
Once you added ComboTrade into to your chart, go to the setting gear of the ComboTrade indicator, which includes two sections: “Input” and “Style”.
The “Input” section is for the input values of the indicators and the “Style” section is for activating and deactivating the tools.
Activate Moving Average 7, 21, 50 and 200 with close (Default)
Activate Combo Cloud by tick the “Show ichimoku” if you use it (Default)
By activating ichimoku, three components will be added to the Como Cloud with below details:
1- The “Quality Line” shows the quality line (26 Kijun-sen future candlesticks) which helps the trader to understand the direction of the trend and will help the trader to make a decision.
2. The “Period Line” shows the 103-day period and can act as a support and resistance tool. In addition, this number can be changed.
3- The intersection of various Como cloud lines has also been installed.
The TP (Take Profit) signal indicates a similar buy or sell area using the RSI and Stochastic oscillators, and be sure to pay special attention to it. Be sure to tick the related box (TP) at “Style” section.
The “Trailing Stop” at “Style” section acts as a support and resistance line. It acts as a support when the price candle is placed above the Trailing Stop line and as a resistance if the price candle is placed below the Trailing Stop line.
At “Bot Key Value” in “Input” section, the number is adjustable from 0.25 to any number. According to the trader's strategy, the number of input and output signals in this section can be adjusted. The best number for BTC is 0.78 and for Altcoins is 0.78 to 1.
At “Bot ATR Period” in “Input” section, the best default number is 8. The best values for Altcoins is 8 to 10, which has a significant effect on the regulation of signaling and support and authority lines.
The “Bot Buy” and “Bot Sell” at “Style” section are the main and most important parts of the indicator that you must tick in order to active them both.
“Plot Background” can activate the Como Cloud and set it to green (ascending) and red (descending).
The “Labels” and “Lines” are related to the important Fibonacci tool, which by displaying the lines of the Fibonacci lines and by activating the label, the numbers related to the price and the Fibonacci numbers are displayed. It helps traders to extract data from the last few days.
DISCLAIMER:
ALL DECISIONS AND RISK MANAGEMENT, ETC. ARE THE FULL RESPONSIBILITY OF THE TRADER AND THE AUTHOR IS NOT RESPONSIBLE FOR THE POSITIONS AND THE RESULTS OF THE TRADES (POSSIBLE LOSSES) IN ANY WAYS. DO YOUR OWN RESEARCH (DYOR) BEFORE ENTERING/ EXISTING IN TO/ FROM ANY POSITIONS.
Please like and use your comments after using the indicator.
Always be Profitable!
JebraTrade
14 April 2021

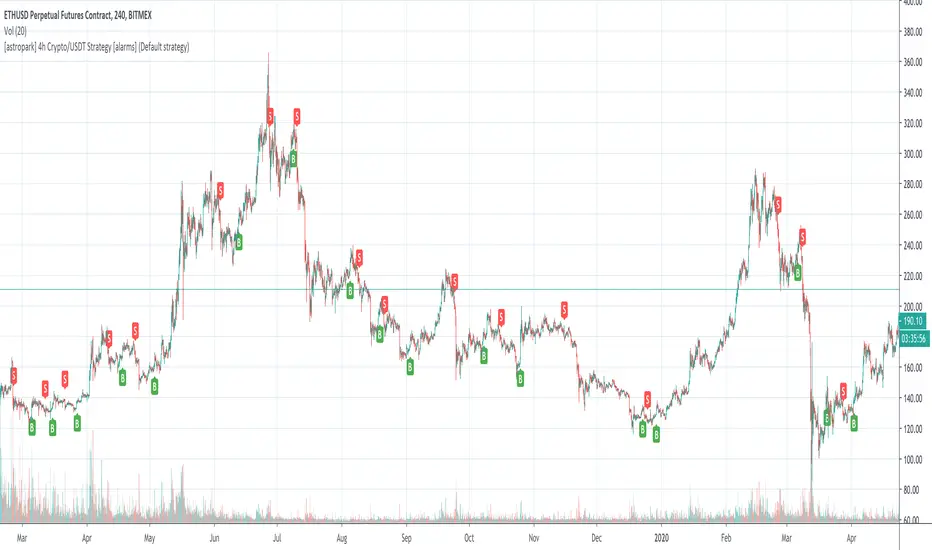
[astropark] 4h Crypto/USDT Strategy [alarms]Dear Followers,
today a new Swing and Scalper Tool , which works great for Cryptocurrencies on the USDT market on 4h timeframe .
This tool has some cool features:
it works on many timeframes, but best one is 4H timeframe : so you can enjoy both manual and bot trading by using a 24/7 running bot;
it comes in three working mode : default, alternative and high frequency ;
auto-stoploss: you can enable an stoploss in trade, bot will follow
It's always suggested to use a proper money and risk management in trades. This is not the "Holy Grail", it does not exist.
Strategy results are calculated from the beginning of 2018 till now, so more than 2 years, using 10000$ as initial capital and working at 1x leverage (no leverage at all!) and 0.1% trading fee already applied.
You can always DM me if you need any help to configure it on your preferred chart or if you want a customization of this bot for a specific pair.
This script will let you set all notification alerts you may need in order to be alerted on each triggered signals.
The one for backtesting purpose can be found by searching for the astropark's "4h Crypto/USDT Strategy" and then choosing the indicator with "strategy" suffix in the name, or you can find here below
This is a premium indicator , so send me a private message in order to get access to this script.
Theft Indicator - BOOM Buy/Sell SignalsWhat is our indicator?
Theft Indicator - BOOM is a script that shows entry levels on a condition that is met with our special algo. The algo consists of crossovers, which are not visible but we take pride in the effort we have put to make this indicator have a high success rate as long as you have a scalping target price set.
Does it Repaint?
Our indicator does NOT re-paint. Although while setting an alert it may pop up the repaint alert, please take into consideration that once a signal is fired on a "CLOSED BAR", our signal will never disappear, they do not repaint.
What Markets is it usable with?
You can use it in any market, Forex, Stocks, Crypto, Indices. All time frames work, not all trades will be profitable (this is how trading is, you can take a loss sometimes). But the Majority is profitable if you use a stop loss and target price.
How to use:
Simple plug and play it to your chart, in addition to a few other indicators we will recommend to you (we still have not published them yet), and this will confirm your trades. You can also connect TV alerts with a bot and let it run. Please be aware that SLIPPAGE time is important, If you run a bot on this indicator you HAVE to know that the buy/sell price will be on the bar AFTER the Candle close (For example: the BUY/SELL alert is on a candle, the buy/sell your bot or you will execute WILL be in the following candle depending on your trading system. We advise you to not leave the bot to trade on its own, you have to monitor and have a specific syntax that we will help you with creating according to your trading style.
P.S: This is not financial advice, we are just sharing our indicator that we know has good results, and it will take time for people in -ve profiles to recover losses and for the profiting to be more profitable. We use a specific trading method that only works with it
You can contact me for more information about the indicator, Goodluck :)

Theft Indicator - Pip GainerWhat is our indicator?
Theft Indicator - Pip Gainer is one of our recent published scripts that shows price action on a certain period of time (We Use a modified version of ATR). We take pride in enabling trading to become easier for the experienced and the non-experienced traders around the globe. Buy & Sell alerts will be fired once a condition in our algo is met.
Does it Repaint?
Our indicator does NOT re-paint. Although while setting an alert it may pop up the repaint alert, please take into consideration that once a signal is fired on a "CLOSED BAR", our signal will never disappear, they do not repaint.
What Markets is it usable with?
This version is dedicated to FOREX markets, we encourage using it for low timeframes starting the 3 minute to the 15 minute timeframe. WE RECOMMEND USING THIS IN THE FOREX MARKET, ESPECIALLY WITH CURRENCY PAIRS.
How to use:
Simple plug and play it to your chart, in addition to a few other indicators we will recommend to you (we still have not published them yet), and this will confirm your trades. You can also connect TV alerts with a bot and let it run. Please be aware that SLIPPAGE time is important, If you run a bot on this indicator you HAVE to know that the buy/sell price will be on the bar AFTER the Candle close (For example: the BUY/SELL alert is on a candle, the buy/sell your bot or you will execute WILL be in the following candle depending on your trading system. We advise you to not leave the bot to trade on its own, you have to monitor and have a specific syntax that we will help you with creating according to your trading style.
How are the Buy/Sell Alerts fired?
We use the simple ATR (Average True Range) indicator. However we have modified the indicator to serve our trading system. Check below for a definition of what ATR is:
What is Average True Range - ATR?
The average true range (ATR) is a technical analysis indicator that measures market volatility by decomposing the entire range of an asset price for that period. Specifically, ATR is a measure of volatility introduced by market technician J. Welles Wilder Jr. The true range indicator is taken as the greatest of the following: current high less the current low; the absolute value of the current high less the previous close; and the absolute value of the current low less the previous close. The average true range is then a moving average, generally using 14 days, of the true ranges.
Why is our indicator special and different from the normal ATR indicators?
We have modified the mathematical equation and changed it slightly to give more accurate signals, we do not promise all trades are profitable, the use of this indicator is up to your own judgement and liability. We believe that we have an indicator like no other ATR.
P.S: This is not financial advice, we are just sharing our indicator that we know has good results, and it will take time for people in -ve profiles to recover losses and for the profiting to be more profitable. We use a specific trading method that only works with it
You can contact me for more information about the indicator, Goodluck :)

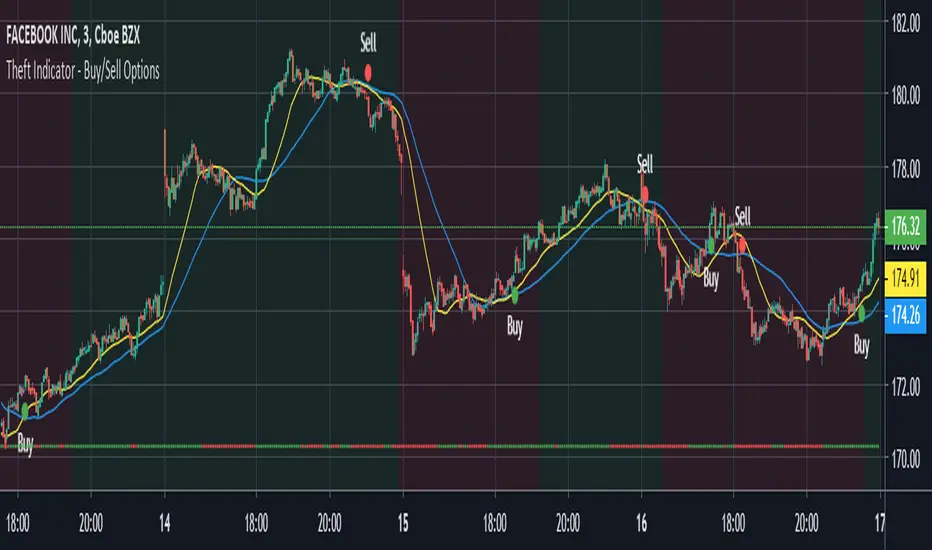
Theft Indicator - Buy/Sell Options Trading 1-3Mins ScalpingWhat is our indicator?
Theft Indicator - Buy/Sell Options Trading Signals is our third published script that shows price action on a certain period of time (We Use ATR indicator). We take pride in enabling trading to become easier for the experienced and the non-experienced traders around the globe. Buy & Sell alerts will be fired once a condition in our algo is met.
Does it Repaint?
Our indicator does NOT re-paint. Although while setting an alert it may pop up the repaint alert, please take into consideration that once a signal is fired on a "CLOSED BAR", our signal will never disappear, they do not repaint.
What Markets is it usable with?
You can use it in any market, Forex, Stocks, Crypto, Indices. All time frames are profitable, not all trades. But the Majority is profitable if you use a stop loss and target price. Although this one is for STOCK OPTIONS, it can work for other markets as well, but it will best perform with STOCKS & OPTIONS TRADING
How to use:
Simple plug and play it to your chart, in addition to a few other indicators we will recommend to you (we still have not published them yet), and this will confirm your trades. You can also connect TV alerts with a bot and let it run. Please be aware that SLIPPAGE time is important, If you run a bot on this indicator you HAVE to know that the buy/sell price will be on the bar AFTER the Candle close (For example: the BUY/SELL alert is on a candle, the buy/sell your bot or you will execute WILL be on the following candle depending on your trading system) THIS IS WITH EVERY SCRIPT, NOT MINE ONLY. We advise you to not leave the bot to trade on its own, you have to monitor and have a specific syntax that we will help you with creating according to your trading style.
How are the Buy/Sell Alerts fired?
We use the simple ATR (Average True Range) indicator. However we have modified the indicator to serve our trading system. Check below for a definition of what ATR is:
What is Average True Range - ATR?
The average true range (ATR) is a technical analysis indicator that measures market volatility by decomposing the entire range of an asset price for that period. Specifically, ATR is a measure of volatility introduced by market technician J. Welles Wilder Jr. The true range indicator is taken as the greatest of the following: current high less the current low; the absolute value of the current high less the previous close; and the absolute value of the current low less the previous close. The average true range is then a moving average, generally using 14 days, of the true ranges.
Why is our indicator special and different from the normal ATR indicators?
We have modified the uniqueness of ATR and changed it slightly to give more accurate signals, we do not promise all trades are profitable, the use of this indicator is up to your own judgement and liability. We believe that we have an indicator like no other ATR.
P.S: This is not financial advice, we are just sharing our indicator that we know has good results, and it will take time for people in -ve profiles to recover losses and for the profiting to be more profitable. We use a specific trading method that only works with it
You can contact me for more information about the indicator, Goodluck :)
Theft Indicator - 5Min Scalping SystemWhat is our indicator?
Theft Indicator - Buy & Sell Alert System is our first published script that shows price action on a certain period of time (We Use ATR indicator). We take pride in enabling trading to become easier for the experienced and the non-experienced traders around the globe. Buy & Sell alerts will be fired once a condition in our algo is met.
Does it Repaint?
Our indicator does NOT re-paint. Although while setting an alert it may pop up the repaint alert, please take into consideration that once a signal is fired on a "CLOSED BAR", our signal will never disappear, they do not repaint.
What Markets is it usable with?
You can use it in any market, Forex, Stocks, Crypto, Indices. All time frames are profitable, not all trades. But the Majority is profitable if you use a stop loss and target price.
How to use:
Simple plug and play it to your chart, in addition to a few other indicators we will recommend to you (we still have not published them yet), and this will confirm your trades. You can also connect TV alerts with a bot and let it run. Please be aware that SLIPPAGE time is important, If you run a bot on this indicator you HAVE to know that the buy/sell price will be on the bar AFTER the Candle close (For example: the BUY/SELL alert is on a candle, the buy/sell your bot or you will execute WILL be in the following candle depending on your trading system. We advise you to not leave the bot to trade on its own, you have to monitor and have a specific syntax that we will help you with creating according to your trading style.
How are the Buy/Sell Alerts fired?
We use the simple ATR (Average True Range) indicator. However we have modified the indicator to serve our trading system. Check below for a definition of what ATR is:
What is Average True Range - ATR?
The average true range (ATR) is a technical analysis indicator that measures market volatility by decomposing the entire range of an asset price for that period. Specifically, ATR is a measure of volatility introduced by market technician J. Welles Wilder Jr. The true range indicator is taken as the greatest of the following: current high less the current low; the absolute value of the current high less the previous close; and the absolute value of the current low less the previous close. The average true range is then a moving average, generally using 14 days, of the true ranges.
Why is our indicator special and different from the normal ATR indicators?
We have modified the mathematical equation and changed it slightly to give more accurate signals, we do not promise all trades are profitable, the use of this indicator is up to your own judgement and liability. We believe that we have an indicator like no other ATR.
P.S: This is not financial advice, we are just sharing our indicator that we know has good results, and it will take time for people in -ve profiles to recover losses and for the profiting to be more profitable. We use a specific trading method that only works with it
You can contact me for more information about the indicator, Goodluck :)

Backtesting & Trading Engine [PineCoders]The PineCoders Backtesting and Trading Engine is a sophisticated framework with hybrid code that can run as a study to generate alerts for automated or discretionary trading while simultaneously providing backtest results. It can also easily be converted to a TradingView strategy in order to run TV backtesting. The Engine comes with many built-in strats for entries, filters, stops and exits, but you can also add you own.
If, like any self-respecting strategy modeler should, you spend a reasonable amount of time constantly researching new strategies and tinkering, our hope is that the Engine will become your inseparable go-to tool to test the validity of your creations, as once your tests are conclusive, you will be able to run this code as a study to generate the alerts required to put it in real-world use, whether for discretionary trading or to interface with an execution bot/app. You may also find the backtesting results the Engine produces in study mode enough for your needs and spend most of your time there, only occasionally converting to strategy mode in order to backtest using TV backtesting.
As you will quickly grasp when you bring up this script’s Settings, this is a complex tool. While you will be able to see results very quickly by just putting it on a chart and using its built-in strategies, in order to reap the full benefits of the PineCoders Engine, you will need to invest the time required to understand the subtleties involved in putting all its potential into play.
Disclaimer: use the Engine at your own risk.
Before we delve in more detail, here’s a bird’s eye view of the Engine’s features:
More than 40 built-in strategies,
Customizable components,
Coupling with your own external indicator,
Simple conversion from Study to Strategy modes,
Post-Exit analysis to search for alternate trade outcomes,
Use of the Data Window to show detailed bar by bar trade information and global statistics, including some not provided by TV backtesting,
Plotting of reminders and generation of alerts on in-trade events.
By combining your own strats to the built-in strats supplied with the Engine, and then tuning the numerous options and parameters in the Inputs dialog box, you will be able to play what-if scenarios from an infinite number of permutations.
USE CASES
You have written an indicator that provides an entry strat but it’s missing other components like a filter and a stop strategy. You add a plot in your indicator that respects the Engine’s External Signal Protocol, connect it to the Engine by simply selecting your indicator’s plot name in the Engine’s Settings/Inputs and then run tests on different combinations of entry stops, in-trade stops and profit taking strats to find out which one produces the best results with your entry strat.
You are building a complex strategy that you will want to run as an indicator generating alerts to be sent to a third-party execution bot. You insert your code in the Engine’s modules and leverage its trade management code to quickly move your strategy into production.
You have many different filters and want to explore results using them separately or in combination. Integrate the filter code in the Engine and run through different permutations or hook up your filtering through the external input and control your filter combos from your indicator.
You are tweaking the parameters of your entry, filter or stop strat. You integrate it in the Engine and evaluate its performance using the Engine’s statistics.
You always wondered what results a random entry strat would yield on your markets. You use the Engine’s built-in random entry strat and test it using different combinations of filters, stop and exit strats.
You want to evaluate the impact of fees and slippage on your strategy. You use the Engine’s inputs to play with different values and get immediate feedback in the detailed numbers provided in the Data Window.
You just want to inspect the individual trades your strategy generates. You include it in the Engine and then inspect trades visually on your charts, looking at the numbers in the Data Window as you move your cursor around.
You have never written a production-grade strategy and you want to learn how. Inspect the code in the Engine; you will find essential components typical of what is being used in actual trading systems.
You have run your system for a while and have compiled actual slippage information and your broker/exchange has updated his fees schedule. You enter the information in the Engine and run it on your markets to see the impact this has on your results.
FEATURES
Before going into the detail of the Inputs and the Data Window numbers, here’s a more detailed overview of the Engine’s features.
Built-in strats
The engine comes with more than 40 pre-coded strategies for the following standard system components:
Entries,
Filters,
Entry stops,
2 stage in-trade stops with kick-in rules,
Pyramiding rules,
Hard exits.
While some of the filter and stop strats provided may be useful in production-quality systems, you will not devise crazy profit-generating systems using only the entry strats supplied; that part is still up to you, as will be finding the elusive combination of components that makes winning systems. The Engine will, however, provide you with a solid foundation where all the trade management nitty-gritty is handled for you. By binding your custom strats to the Engine, you will be able to build reliable systems of the best quality currently allowed on the TV platform.
On-chart trade information
As you move over the bars in a trade, you will see trade numbers in the Data Window change at each bar. The engine calculates the P&L at every bar, including slippage and fees that would be incurred were the trade exited at that bar’s close. If the trade includes pyramided entries, those will be taken into account as well, although for those, final fees and slippage are only calculated at the trade’s exit.
You can also see on-chart markers for the entry level, stop positions, in-trade special events and entries/exits (you will want to disable these when using the Engine in strategy mode to see TV backtesting results).
Customization
You can couple your own strats to the Engine in two ways:
1. By inserting your own code in the Engine’s different modules. The modular design should enable you to do so with minimal effort by following the instructions in the code.
2. By linking an external indicator to the engine. After making the proper selections in the engine’s Settings and providing values respecting the engine’s protocol, your external indicator can, when the Engine is used in Indicator mode only:
Tell the engine when to enter long or short trades, but let the engine’s in-trade stop and exit strats manage the exits,
Signal both entries and exits,
Provide an entry stop along with your entry signal,
Filter other entry signals generated by any of the engine’s entry strats.
Conversion from strategy to study
TradingView strategies are required to backtest using the TradingView backtesting feature, but if you want to generate alerts with your script, whether for automated trading or just to trigger alerts that you will use in discretionary trading, your code has to run as a study since, for the time being, strategies can’t generate alerts. From hereon we will use indicator as a synonym for study.
Unless you want to maintain two code bases, you will need hybrid code that easily flips between strategy and indicator modes, and your code will need to restrict its use of strategy() calls and their arguments if it’s going to be able to run both as an indicator and a strategy using the same trade logic. That’s one of the benefits of using this Engine. Once you will have entered your own strats in the Engine, it will be a matter of commenting/uncommenting only four lines of code to flip between indicator and strategy modes in a matter of seconds.
Additionally, even when running in Indicator mode, the Engine will still provide you with precious numbers on your individual trades and global results, some of which are not available with normal TradingView backtesting.
Post-Exit Analysis for alternate outcomes (PEA)
While typical backtesting shows results of trade outcomes, PEA focuses on what could have happened after the exit. The intention is to help traders get an idea of the opportunity/risk in the bars following the trade in order to evaluate if their exit strategies are too aggressive or conservative.
After a trade is exited, the Engine’s PEA module continues analyzing outcomes for a user-defined quantity of bars. It identifies the maximum opportunity and risk available in that space, and calculates the drawdown required to reach the highest opportunity level post-exit, while recording the number of bars to that point.
Typically, if you can’t find opportunity greater than 1X past your trade using a few different reasonable lengths of PEA, your strategy is doing pretty good at capturing opportunity. Remember that 100% of opportunity is never capturable. If, however, PEA was finding post-trade maximum opportunity of 3 or 4X with average drawdowns of 0.3 to those areas, this could be a clue revealing your system is exiting trades prematurely. To analyze PEA numbers, you can uncomment complete sets of plots in the Plot module to reveal detailed global and individual PEA numbers.
Statistics
The Engine provides stats on your trades that TV backtesting does not provide, such as:
Average Profitability Per Trade (APPT), aka statistical expectancy, a crucial value.
APPT per bar,
Average stop size,
Traded volume .
It also shows you on a trade-by-trade basis, on-going individual trade results and data.
In-trade events
In-trade events can plot reminders and trigger alerts when they occur. The built-in events are:
Price approaching stop,
Possible tops/bottoms,
Large stop movement (for discretionary trading where stop is moved manually),
Large price movements.
Slippage and Fees
Even when running in indicator mode, the Engine allows for slippage and fees to be included in the logic and test results.
Alerts
The alert creation mechanism allows you to configure alerts on any combination of the normal or pyramided entries, exits and in-trade events.
Backtesting results
A few words on the numbers calculated in the Engine. Priority is given to numbers not shown in TV backtesting, as you can readily convert the script to a strategy if you need them.
We have chosen to focus on numbers expressing results relative to X (the trade’s risk) rather than in absolute currency numbers or in other more conventional but less useful ways. For example, most of the individual trade results are not shown in percentages, as this unit of measure is often less meaningful than those expressed in units of risk (X). A trade that closes with a +25% result, for example, is a poor outcome if it was entered with a -50% stop. Expressed in X, this trade’s P&L becomes 0.5, which provides much better insight into the trade’s outcome. A trade that closes with a P&L of +2X has earned twice the risk incurred upon entry, which would represent a pre-trade risk:reward ratio of 2.
The way to go about it when you think in X’s and that you adopt the sound risk management policy to risk a fixed percentage of your account on each trade is to equate a currency value to a unit of X. E.g. your account is 10K USD and you decide you will risk a maximum of 1% of it on each trade. That means your unit of X for each trade is worth 100 USD. If your APPT is 2X, this means every time you risk 100 USD in a trade, you can expect to make, on average, 200 USD.
By presenting results this way, we hope that the Engine’s statistics will appeal to those cognisant of sound risk management strategies, while gently leading traders who aren’t, towards them.
We trade to turn in tangible profits of course, so at some point currency must come into play. Accordingly, some values such as equity, P&L, slippage and fees are expressed in currency.
Many of the usual numbers shown in TV backtests are nonetheless available, but they have been commented out in the Engine’s Plot module.
Position sizing and risk management
All good system designers understand that optimal risk management is at the very heart of all winning strategies. The risk in a trade is defined by the fraction of current equity represented by the amplitude of the stop, so in order to manage risk optimally on each trade, position size should adjust to the stop’s amplitude. Systems that enter trades with a fixed stop amplitude can get away with calculating position size as a fixed percentage of current equity. In the context of a test run where equity varies, what represents a fixed amount of risk translates into different currency values.
Dynamically adjusting position size throughout a system’s life is optimal in many ways. First, as position sizing will vary with current equity, it reproduces a behavioral pattern common to experienced traders, who will dial down risk when confronted to poor performance and increase it when performance improves. Second, limiting risk confers more predictability to statistical test results. Third, position sizing isn’t just about managing risk, it’s also about maximizing opportunity. By using the maximum leverage (no reference to trading on margin here) into the trade that your risk management strategy allows, a dynamic position size allows you to capture maximal opportunity.
To calculate position sizes using the fixed risk method, we use the following formula: Position = Account * MaxRisk% / Stop% [, which calculates a position size taking into account the trade’s entry stop so that if the trade is stopped out, 100 USD will be lost. For someone who manages risk this way, common instructions to invest a certain percentage of your account in a position are simply worthless, as they do not take into account the risk incurred in the trade.
The Engine lets you select either the fixed risk or fixed percentage of equity position sizing methods. The closest thing to dynamic position sizing that can currently be done with alerts is to use a bot that allows syntax to specify position size as a percentage of equity which, while being dynamic in the sense that it will adapt to current equity when the trade is entered, does not allow us to modulate position size using the stop’s amplitude. Changes to alerts are on the way which should solve this problem.
In order for you to simulate performance with the constraint of fixed position sizing, the Engine also offers a third, less preferable option, where position size is defined as a fixed percentage of initial capital so that it is constant throughout the test and will thus represent a varying proportion of current equity.
Let’s recap. The three position sizing methods the Engine offers are:
1. By specifying the maximum percentage of risk to incur on your remaining equity, so the Engine will dynamically adjust position size for each trade so that, combining the stop’s amplitude with position size will yield a fixed percentage of risk incurred on current equity,
2. By specifying a fixed percentage of remaining equity. Note that unless your system has a fixed stop at entry, this method will not provide maximal risk control, as risk will vary with the amplitude of the stop for every trade. This method, as the first, does however have the advantage of automatically adjusting position size to equity. It is the Engine’s default method because it has an equivalent in TV backtesting, so when flipping between indicator and strategy mode, test results will more or less correspond.
3. By specifying a fixed percentage of the Initial Capital. While this is the least preferable method, it nonetheless reflects the reality confronted by most system designers on TradingView today. In this case, risk varies both because the fixed position size in initial capital currency represents a varying percentage of remaining equity, and because the trade’s stop amplitude may vary, adding another variability vector to risk.
Note that the Engine cannot display equity results for strategies entering trades for a fixed amount of shares/contracts at a variable price.
SETTINGS/INPUTS
Because the initial text first published with a script cannot be edited later and because there are just too many options, the Engine’s Inputs will not be covered in minute detail, as they will most certainly evolve. We will go over them with broad strokes; you should be able to figure the rest out. If you have questions, just ask them here or in the PineCoders Telegram group.
Display
The display header’s checkbox does nothing.
For the moment, only one exit strategy uses a take profit level, so only that one will show information when checking “Show Take Profit Level”.
Entries
You can activate two simultaneous entry strats, each selected from the same set of strats contained in the Engine. If you select two and they fire simultaneously, the main strat’s signal will be used.
The random strat in each list uses a different seed, so you will get different results from each.
The “Filter transitions” and “Filter states” strats delegate signal generation to the selected filter(s). “Filter transitions” signals will only fire when the filter transitions into bull/bear state, so after a trade is stopped out, the next entry may take some time to trigger if the filter’s state does not change quickly. When you choose “Filter states”, then a new trade will be entered immediately after an exit in the direction the filter allows.
If you select “External Indicator”, your indicator will need to generate a +2/-2 (or a positive/negative stop value) to enter a long/short position, providing the selected filters allow for it. If you wish to use the Engine’s capacity to also derive the entry stop level from your indicator’s signal, then you must explicitly choose this option in the Entry Stops section.
Filters
You can activate as many filters as you wish; they are additive. The “Maximum stop allowed on entry” is an important component of proper risk management. If your system has an average 3% stop size and you need to trade using fixed position sizes because of alert/execution bot limitations, you must use this filter because if your system was to enter a trade with a 15% stop, that trade would incur 5 times the normal risk, and its result would account for an abnormally high proportion in your system’s performance.
Remember that any filter can also be used as an entry signal, either when it changes states, or whenever no trade is active and the filter is in a bull or bear mode.
Entry Stops
An entry stop must be selected in the Engine, as it requires a stop level before the in-trade stop is calculated. Until the selected in-trade stop strat generates a stop that comes closer to price than the entry stop (or respects another one of the in-trade stops kick in strats), the entry stop level is used.
It is here that you must select “External Indicator” if your indicator supplies a +price/-price value to be used as the entry stop. A +price is expected for a long entry and a -price value will enter a short with a stop at price. Note that the price is the absolute price, not an offset to the current price level.
In-Trade Stops
The Engine comes with many built-in in-trade stop strats. Note that some of them share the “Length” and “Multiple” field, so when you swap between them, be sure that the length and multiple in use correspond to what you want for that stop strat. Suggested defaults appear with the name of each strat in the dropdown.
In addition to the strat you wish to use, you must also determine when it kicks in to replace the initial entry’s stop, which is determined using different strats. For strats where you can define a positive or negative multiple of X, percentage or fixed value for a kick-in strat, a positive value is above the trade’s entry fill and a negative one below. A value of zero represents breakeven.
Pyramiding
What you specify in this section are the rules that allow pyramiding to happen. By themselves, these rules will not generate pyramiding entries. For those to happen, entry signals must be issued by one of the active entry strats, and conform to the pyramiding rules which act as a filter for them. The “Filter must allow entry” selection must be chosen if you want the usual system’s filters to act as additional filtering criteria for your pyramided entries.
Hard Exits
You can choose from a variety of hard exit strats. Hard exits are exit strategies which signal trade exits on specific events, as opposed to price breaching a stop level in In-Trade Stops strategies. They are self-explanatory. The last one labelled When Take Profit Level (multiple of X) is reached is the only one that uses a level, but contrary to stops, it is above price and while it is relative because it is expressed as a multiple of X, it does not move during the trade. This is the level called Take Profit that is show when the “Show Take Profit Level” checkbox is checked in the Display section.
While stops focus on managing risk, hard exit strategies try to put the emphasis on capturing opportunity.
Slippage
You can define it as a percentage or a fixed value, with different settings for entries and exits. The entry and exit markers on the chart show the impact of slippage on the entry price (the fill).
Fees
Fees, whether expressed as a percentage of position size in and out of the trade or as a fixed value per in and out, are in the same units of currency as the capital defined in the Position Sizing section. Fees being deducted from your Capital, they do not have an impact on the chart marker positions.
In-Trade Events
These events will only trigger during trades. They can be helpful to act as reminders for traders using the Engine as assistance to discretionary trading.
Post-Exit Analysis
It is normally on. Some of its results will show in the Global Numbers section of the Data Window. Only a few of the statistics generated are shown; many more are available, but commented out in the Plot module.
Date Range Filtering
Note that you don’t have to change the dates to enable/diable filtering. When you are done with a specific date range, just uncheck “Date Range Filtering” to disable date filtering.
Alert Triggers
Each selection corresponds to one condition. Conditions can be combined into a single alert as you please. Just be sure you have selected the ones you want to trigger the alert before you create the alert. For example, if you trade in both directions and you want a single alert to trigger on both types of exits, you must select both “Long Exit” and “Short Exit” before creating your alert.
Once the alert is triggered, these settings no longer have relevance as they have been saved with the alert.
When viewing charts where an alert has just triggered, if your alert triggers on more than one condition, you will need the appropriate markers active on your chart to figure out which condition triggered the alert, since plotting of markers is independent of alert management.
Position sizing
You have 3 options to determine position size:
1. Proportional to Stop -> Variable, with a cap on size.
2. Percentage of equity -> Variable.
3. Percentage of Initial Capital -> Fixed.
External Indicator
This is where you connect your indicator’s plot that will generate the signals the Engine will act upon. Remember this only works in Indicator mode.
DATA WINDOW INFORMATION
The top part of the window contains global numbers while the individual trade information appears in the bottom part. The different types of units used to express values are:
curr: denotes the currency used in the Position Sizing section of Inputs for the Initial Capital value.
quote: denotes quote currency, i.e. the value the instrument is expressed in, or the right side of the market pair (USD in EURUSD ).
X: the stop’s amplitude, itself expressed in quote currency, which we use to express a trade’s P&L, so that a trade with P&L=2X has made twice the stop’s amplitude in profit. This is sometimes referred to as R, since it represents one unit of risk. It is also the unit of measure used in the APPT, which denotes expected reward per unit of risk.
X%: is also the stop’s amplitude, but expressed as a percentage of the Entry Fill.
The numbers appearing in the Data Window are all prefixed:
“ALL:” the number is the average for all first entries and pyramided entries.
”1ST:” the number is for first entries only.
”PYR:” the number is for pyramided entries only.
”PEA:” the number is for Post-Exit Analyses
Global Numbers
Numbers in this section represent the results of all trades up to the cursor on the chart.
Average Profitability Per Trade (X): This value is the most important gauge of your strat’s worthiness. It represents the returns that can be expected from your strat for each unit of risk incurred. E.g.: your APPT is 2.0, thus for every unit of currency you invest in a trade, you can on average expect to obtain 2 after the trade. APPT is also referred to as “statistical expectancy”. If it is negative, your strategy is losing, even if your win rate is very good (it means your winning trades aren’t winning enough, or your losing trades lose too much, or both). Its counterpart in currency is also shown, as is the APPT/bar, which can be a useful gauge in deciding between rivalling systems.
Profit Factor: Gross of winning trades/Gross of losing trades. Strategy is profitable when >1. Not as useful as the APPT because it doesn’t take into account the win rate and the average win/loss per trade. It is calculated from the total winning/losing results of this particular backtest and has less predictive value than the APPT. A good profit factor together with a poor APPT means you just found a chart where your system outperformed. Relying too much on the profit factor is a bit like a poker player who would think going all in with two’s against aces is optimal because he just won a hand that way.
Win Rate: Percentage of winning trades out of all trades. Taken alone, it doesn’t have much to do with strategy profitability. You can have a win rate of 99% but if that one trade in 100 ruins you because of poor risk management, 99% doesn’t look so good anymore. This number speaks more of the system’s profile than its worthiness. Still, it can be useful to gauge if the system fits your personality. It can also be useful to traders intending to sell their systems, as low win rate systems are more difficult to sell and require more handholding of worried customers.
Equity (curr): This the sum of initial capital and the P&L of your system’s trades, including fees and slippage.
Return on Capital is the equivalent of TV’s Net Profit figure, i.e. the variation on your initial capital.
Maximum drawdown is the maximal drawdown from the highest equity point until the drop . There is also a close to close (meaning it doesn’t take into account in-trade variations) maximum drawdown value commented out in the code.
The next values are self-explanatory, until:
PYR: Avg Profitability Per Entry (X): this is the APPT for all pyramided entries.
PEA: Avg Max Opp . Available (X): the average maximal opportunity found in the Post-Exit Analyses.
PEA: Avg Drawdown to Max Opp . (X): this represents the maximum drawdown (incurred from the close at the beginning of the PEA analysis) required to reach the maximal opportunity point.
Trade Information
Numbers in this section concern only the current trade under the cursor. Most of them are self-explanatory. Use the description’s prefix to determine what the values applies to.
PYR: Avg Profitability Per Entry (X): While this value includes the impact of all current pyramided entries (and only those) and updates when you move your cursor around, P&L only reflects fees at the trade’s last bar.
PEA: Max Opp . Available (X): It’s the most profitable close reached post-trade, measured from the trade’s Exit Fill, expressed in the X value of the trade the PEA follows.
PEA: Drawdown to Max Opp . (X): This is the maximum drawdown from the trade’s Exit Fill that needs to be sustained in order to reach the maximum opportunity point, also expressed in X. Note that PEA numbers do not include slippage and fees.
EXTERNAL SIGNAL PROTOCOL
Only one external indicator can be connected to a script; in order to leverage its use to the fullest, the engine provides options to use it as either an entry signal, an entry/exit signal or a filter. When used as an entry signal, you can also use the signal to provide the entry’s stop. Here’s how this works:
For filter state: supply +1 for bull (long entries allowed), -1 for bear (short entries allowed).
For entry signals: supply +2 for long, -2 for short.
For exit signals: supply +3 for exit from long, -3 for exit from short.
To send an entry stop level with an entry signal: Send positive stop level for long entry (e.g. 103.33 to enter a long with a stop at 103.33), negative stop level for short entry (e.g. -103.33 to enter a short with a stop at 103.33). If you use this feature, your indicator will have to check for exact stop levels of 1.0, 2.0 or 3.0 and their negative counterparts, and fudge them with a tick in order to avoid confusion with other signals in the protocol.
Remember that mere generation of the values by your indicator will have no effect until you explicitly allow their use in the appropriate sections of the Engine’s Settings/Inputs.
An example of a script issuing a signal for the Engine is published by PineCoders.
RECOMMENDATIONS TO ASPIRING SYSTEM DESIGNERS
Stick to higher timeframes. On progressively lower timeframes, margins decrease and fees and slippage take a proportionally larger portion of profits, to the point where they can very easily turn a profitable strategy into a losing one. Additionally, your margin for error shrinks as the equilibrium of your system’s profitability becomes more fragile with the tight numbers involved in the shorter time frames. Avoid <1H time frames.
Know and calculate fees and slippage. To avoid market shock, backtest using conservative fees and slippage parameters. Systems rarely show unexpectedly good returns when they are confronted to the markets, so put all chances on your side by being outrageously conservative—or a the very least, realistic. Test results that do not include fees and slippage are worthless. Slippage is there for a reason, and that’s because our interventions in the market change the market. It is easier to find alpha in illiquid markets such as cryptos because not many large players participate in them. If your backtesting results are based on moving large positions and you don’t also add the inevitable slippage that will occur when you enter/exit thin markets, your backtesting will produce unrealistic results. Even if you do include large slippage in your settings, the Engine can only do so much as it will not let slippage push fills past the high or low of the entry bar, but the gap may be much larger in illiquid markets.
Never test and optimize your system on the same dataset , as that is the perfect recipe for overfitting or data dredging, which is trying to find one precise set of rules/parameters that works only on one dataset. These setups are the most fragile and often get destroyed when they meet the real world.
Try to find datasets yielding more than 100 trades. Less than that and results are not as reliable.
Consider all backtesting results with suspicion. If you never entertained sceptic tendencies, now is the time to begin. If your backtest results look really good, assume they are flawed, either because of your methodology, the data you’re using or the software doing the testing. Always assume the worse and learn proper backtesting techniques such as monte carlo simulations and walk forward analysis to avoid the traps and biases that unchecked greed will set for you. If you are not familiar with concepts such as survivor bias, lookahead bias and confirmation bias, learn about them.
Stick to simple bars or candles when designing systems. Other types of bars often do not yield reliable results, whether by design (Heikin Ashi) or because of the way they are implemented on TV (Renko bars).
Know that you don’t know and use that knowledge to learn more about systems and how to properly test them, about your biases, and about yourself.
Manage risk first , then capture opportunity.
Respect the inherent uncertainty of the future. Cleanse yourself of the sad arrogance and unchecked greed common to newcomers to trading. Strive for rationality. Respect the fact that while backtest results may look promising, there is no guarantee they will repeat in the future (there is actually a high probability they won’t!), because the future is fundamentally unknowable. If you develop a system that looks promising, don’t oversell it to others whose greed may lead them to entertain unreasonable expectations.
Have a plan. Understand what king of trading system you are trying to build. Have a clear picture or where entries, exits and other important levels will be in the sort of trade you are trying to create with your system. This stated direction will help you discard more efficiently many of the inevitably useless ideas that will pop up during system design.
Be wary of complexity. Experienced systems engineers understand how rapidly complexity builds when you assemble components together—however simple each one may be. The more complex your system, the more difficult it will be to manage.
Play! . Allow yourself time to play around when you design your systems. While much comes about from working with a purpose, great ideas sometimes come out of just trying things with no set goal, when you are stuck and don’t know how to move ahead. Have fun!
@LucF
NOTES
While the engine’s code can supply multiple consecutive entries of longs or shorts in order to scale positions (pyramid), all exits currently assume the execution bot will exit the totality of the position. No partial exits are currently possible with the Engine.
Because the Engine is literally crippled by the limitations on the number of plots a script can output on TV; it can only show a fraction of all the information it calculates in the Data Window. You will find in the Plot Module vast amounts of commented out lines that you can activate if you also disable an equivalent number of other plots. This may be useful to explore certain characteristics of your system in more detail.
When backtesting using the TV backtesting feature, you will need to provide the strategy parameters you wish to use through either Settings/Properties or by changing the default values in the code’s header. These values are defined in variables and used not only in the strategy() statement, but also as defaults in the Engine’s relevant Inputs.
If you want to test using pyramiding, then both the strategy’s Setting/Properties and the Engine’s Settings/Inputs need to allow pyramiding.
If you find any bugs in the Engine, please let us know.
THANKS
To @glaz for allowing the use of his unpublished MA Squize in the filters.
To @everget for his Chandelier stop code, which is also used as a filter in the Engine.
To @RicardoSantos for his pseudo-random generator, and because it’s from him that I first read in the Pine chat about the idea of using an external indicator as input into another. In the PineCoders group, @theheirophant then mentioned the idea of using it as a buy/sell signal and @simpelyfe showed a piece of code implementing the idea. That’s the tortuous story behind the use of the external indicator in the Engine.
To @admin for the Volatility stop’s original code and for the donchian function lifted from Ichimoku .
To @BobHoward21 for the v3 version of Volatility Stop .
To @scarf and @midtownsk8rguy for the color tuning.
To many other scripters who provided encouragement and suggestions for improvement during the long process of writing and testing this piece of code.
To J. Welles Wilder Jr. for ATR, used extensively throughout the Engine.
To TradingView for graciously making an account available to PineCoders.
And finally, to all fellow PineCoders for the constant intellectual stimulation; it is a privilege to share ideas with you all. The Engine is for all TradingView PineCoders, of course—but especially for you.
Look first. Then leap.

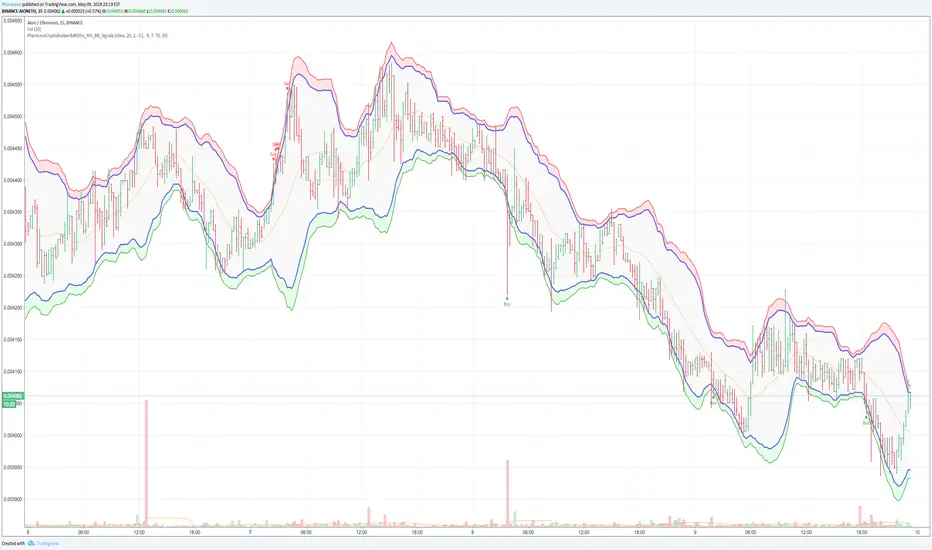
Pharoceus CryptoScalper's RSI+BB Signal+AlertsDescription
This is an indicator with alerts/signals and it's designed for Cryptocurrency leverage trading (scalping). This indicator features, the most popularly used indicators in technical analysis and that is the Bollinger Bands and Relative Strenght Index (RSI). The CryptoScalper's RSI+BB Signal+Alerts was designed for use with ProfitTrailer V2 and can also be used with all other trading bots that allows alerts or on its own as a powerful market leverage trading indicator using alerts because it offers buy alerts as well.
The Pharoceus CryptoScalper's RSI+BB Signal+Alerts can be customized to any trader specific patterns and settings, making it so easy to use. With the Buy and Sell Signal feature, trading on any cryptocurrency exchange can be automated likewise with any crypto trading bot as stated previously; but I'll always recommend using it for buys only if you're using it with a bot. This indicator/script can be used with any base pair; BTC, ETH, and USD or USDT as well. This is also not affiliated with any bot or exchange and it's not advertising either ProfitTrailer or any bot or exchanges.
This is a free indicator for anyone to use, for access and support, also strategy, results and settings discussion, join the discord channel (link below) and come build a real community. If you want to support my work and more free signals, donations are highly encouraged.
I am not a financial adviser and all gains or losses are at the discretion of all users and I would not be held liable for any of the other. This effort is solely of an individual who believes Signals shouldn't have to cost traders an arm or a leg or taken as an opportunity to rip people off.
Also, I know a lot of people are asking for access to the ProfitTrailerV2 RSI+BB+SRSI+Stochastic Oscillator Signal+Alerts and have not gotten it. The reason was because beta-testers brought issues as regarding the buy signals and I'm revisiting that indicator and working on the issue. Should have made this known but TV doesn't allow edits after 15mins or I would make it known via comments soon.
discord.gg
BTC: 199qMzu4gvr3bUXWEpLG5uS6TEKKvw5pbe
ETH: 0xf8339952a224a228f2f8c58a5666a8ffleddebfb
BCH: qqmmds8u3f8m6ek387jtefg07525dvaxzqrshd86gz
RT-Main IndicatorThe RT-Main Indicator is the core indicator that started it all. Developed over more than 5 years, this all in one tool helps traders identify when market participants are buying and selling using multi-colored candles that update in real time. It also identifies key support and resistance levels with Rainbow Pivots and highlights unusual price movements with Whale Print arrows. At its core, the RT-Main Indicator tracks buying and selling with eight colors instead of two, because real world markets are complex and order flow should not be treated as purely binary(Red vs Green).
Introduction
The RT-Main Indicator is designed as a primary Rainbow Theory Tool. It uses color coded candles to show changes in strength, Rainbow Pivots to mark important support and resistance areas, and Whale Prints to flag abnormal buy and sell activity. The goal is to bring these components together into a single framework so traders can read trend, structure, and larger player behavior without stacking many separate indicators.
This tutorial will cover each aspect of the tool:
Colored Candles
Whales are stealth experts and their strength is their ability to not be detected as they move the market. Rainbow Theory illuminates them from the shadows with a spectrum of specifically coded colors to display their unique strengths/weaknesses. In practice, this means the RT-Main Indicator uses internal strength and exhaustion metrics to color candles so that shifts in buying and selling pressure are easier to see.
The base of the RT-Main Indicator is the colored candles it paints onto the chart. These colors automatically tune to the chart based on the timeframe the trader is currently using (1D, H12, H1, 15M, etc). Instead of painting charts with a single Bullish Color (Green) and a single Bearish Color (Red), Rainbow Theory breaks out and identifies these moves into four Bearish Colors (Red|Orange|Yellow|White) and four Bullish Colors (Green|Blue|Purple|Pink). Each color tells a different story of the trend and helps traders better understand the nature of the current trend.
Bullish Colors
#4 - Green Candles - Weakest bullish color, these trends can sustain for extended periods of time.
#3 - Blue Candles - Strong bullish color, a move is starting to develop and can sustain.
#2 - Purple Candles - Second strongest bullish color, Whales are committed to the move but cannot sustain this level of momentum for long durations and a top is near.
#1 - Pink Candles - Strongest bullish color, Whales are using every single ounce of energy they have to push price up, the trend cannot be sustained and its time to take profits.
Bearish Colors
#4 - Red Candles - Weakest bearish color, these trends can sustain for extended periods of time.
#3 - Orange Candles - Strong bearish color, a move is starting to develop and can sustain.
#2 - Yellow Candles - Second strongest bearish color, Whales are committed to the move but cannot sustain this level of momentum for long durations and a bottom is near.
#1 - White Candles - Strongest bearish color, Whales are using every single ounce of energy they have to push price down into all out capitulation, the trend cannot be sustained and its time to look for entries.
How To Enable Colored Candles
By default, the Indicator’s Candles are placed behind the default candles. To properly display them, you must bring them forward. To do this, click the settings icon on the indicator, click visual order and then click bring to front:
Example - Bringing all the colors together into a Bearish Trend that reverses into a Bullish Trend:
The color thresholds can be tuned using the following options:
Automatic Tuning On/Off - Enables or disables the automatic color tuning that adjusts for each timeframe.
Auto Tuning Gain (Inc/Dec) - Increases or decreases how aggressive the automatic tuning algorithm adjusts color tuning.
Manual Fine Tuning - Linear Color Shift - Manually controls the linear sensitivity for color candle thresholds. This can be visualized as a setting being adjusted up or down in a straight, linear fashion. Linear Color Shift
Manual Fine Tuning - Exponential Color Shift - Manually controls the exponential sensitivity for color candle thresholds. This can be visualized as a setting being adjusted in an exponential manner where each level moves in an exponential shift instead of all moving equally. Exponential Color Shift Dark Mode
Some traders prefer light colored backgrounds for their charting, which can make white candles difficult to see. The RT-Main Indicator includes a Dark Mode toggle so colors stay readable on both dark and light charts.
Dark Mode Candles On/Off - Forces the indicator to use the second color set stored in the Style tab in the RT-Main Indicator settings when using light backgrounds. The White/Black Candle can also have a custom color applied if the trader is not content with these two default options.
Custom Candle Colors
In addition to toggling between light and dark modes, each individual color used by the RT-Main Indicator can be edited in the Style tab. This allows traders to keep the same logic while adjusting the visual palette to match their own chart layout.
Rainbow Rotations
Rainbow Rotations are a feature traders use to catch reversals or reversions when a trend fully blows out. The algorithm triggers on the first weaker candle that closes after a Pink or White candle prints. The general idea of this event is to show peaks and valleys of an asset.
In a strong bearish move, White candles mark extreme selling. If a weaker Yellow candle appears after a White candle, that first weaker candle is where the rotation event triggers and a Rainbow Rotation marker is placed on the chart. In a strong bullish move, Pink candles mark extreme buying. The first weaker bullish candle after a Pink candle triggers the opposite side rotation marker.
Note that Rainbow Rotations can only be visible for a finite amount of candles. The Replay function in TradingView can be used to review previous triggers.
Rainbow Rotation settings are available near the top of the settings menu:
Rainbow Rotation Alerts On/Off - Toggles these signals on or off with one click.
Rainbow Rotation Symbol - Customizes the symbol that is plotted on the chart for Rainbow Rotations. Both text and emojis can be used instead of the default symbol.
Rainbow Rotation Alerts
Rainbow Rotations can also be automated with standard TradingView alerts. To set this up:
Click the Alert icon on the right side of the screen.
Change Condition to the RT-Main Indicator.
Change the second condition to one of the three options:
Bullish Alerts | Bearish Alerts | Bearish and Bullish Alerts
Set Trigger to Once Per Bar Close.
Once set up, this allows traders to be notified when the RT-Main Indicator detects an extreme bullish or bearish trend that is starting to reverse.
Automated Pivots
One of the RT-Main Indicator's most powerful functions is the automated support and resistance pivots. This logic uses two internal bots that are tuned to look for potential support and resistance order blocks.
The Resistance Pivot Bot prints lines that are painted with red dashes.
The Support Pivot Bot prints lines that are painted with green dashes.
Regardless of the color of the dashed pivot line, any trend that approaches a pivot should be respected. For example, a trend moving up towards a green support pivot should still treat that area as resistance if price is approaching from below.
As the algorithm continues to print additional pivots on the chart, traders can start identifying order blocks that are otherwise hidden in the price action. These order blocks are key support and resistance areas that trends will often interact with and respect. Multiple stacked pivots in the same region are a visual clue that such an order block has formed.
Pivots can be tuned with the following options:
Pivot On/Off - Quickly toggles all pivots on or off.
Pivot Style - Switches between different styles of marking pivots.
Pivot Sensitivity (Inc/Dec) - Tunes the sensitivity of the pivot algorithms. Adjusting this changes how many pivots are printed on the chart.
Pivot Line Drawing Length - Controls how long the indicator draws the pivot lines.
Resistance / Support Pivot Colors - Allows customization of pivot colors to match the rest of the chart.
Whale Prints
One of the most important parts of the RT-Main Indicator is tracking Whale Prints. This portion of the script looks for abnormal buys and sells that are more consistent with large players than typical flow. Under normal circumstances, whales try to avoid being visible when they buy or sell, but there are times where they are forced to come out of hiding and deliberately move the market.
The Whale Print logic is tuned to notify the trader when it detects that this type of unusual activity may be occurring.
Bearish Whale Prints are marked on the chart with a red triangle.
Bullish Whale Prints are marked on the chart with a green triangle.
Whale Print clusters are situations where multiple Whale Prints have been identified in the past 10 candles. While individual Whale Prints are useful, clusters of Whale Prints are particularly important because they often signal that a very large move is potentially being prepared/defended.
The Whale Print table is an active tracker that counts the number of bullish and bearish Whale Prints that have occurred in the past 10 candles. Whale Print settings can be tuned with:
Whale Print Clusters Table On/Off - Toggles the Whale Print table on or off with one click.
Whale Print Clusters Alerts On/Off - Toggles the Whale Print cluster symbol on or off.
Whale Print Cluster Symbol - Changes the symbol on the chart for Whale Clusters. Emojis and text can both be used instead of the default symbol.
Whale Print Cluster Bullish/Bearish Label Color - Customizes the color of the Whale Print cluster labels on the chart. Whale Print Cluster Alerts
Whale Print Cluster alerts can be automated with standard TradingView alerts. To set this up:
Click the Alert icon on the right side of the screen.
Change Condition to the RT-Main Indicator.
Change the second condition to one of the two options:
Bull Whale Cluster Alert | Bear Whale Cluster Alert
Set Trigger to Once Per Bar Close. Once set up, this allows traders to be notified when the RT-Main Indicator detects a Whale Print Cluster.
Bull/Bear Trend Step Line
The inflection point of the colored candles is controlled by the Bull/Bear Trend Step Line. This is the grey stepped line on the chart where the bullish and bearish colors meet. Candles above this line are marked by the four bullish candle colors.
Candles below this line are marked by the four bearish candle colors.
The Bull/Bear Trend Step Line can be tuned with:
Bull/Bear Line Offset - Controls a vertical threshold for the line.
Bull/Bear Line Smoothness - Controls the sensitivity and smoothness of the line so traders can fine tune it for their specific setups. Most traders do not adjust the Bull/Bear Step Line. The small group that does typically only use these settings for lower timeframe trading setups below 5 minute candles. If preferred, the line can be recolored or hidden from the Style tab of the RT-Main Indicator without changing how the core color logic works.
Important Note
The RT-Main Indicator is intended to provide additional context around trend strength, exhaustion, and key areas of support and resistance. It is not a standalone signal generator and should always be used together with your own analysis, testing, and risk management. Historical color patterns, pivots, and Whale Prints do not guarantee future results.
🐋 Tight lines and happy trading!

EMA + RSI Autotrade Webhook - VarunOverview
The EMA + RSI Autotrade Webhook is a powerful trend-following indicator designed for automated crypto futures trading. This indicator combines the reliability of Exponential Moving Average (EMA) crossovers with RSI momentum filtering to generate high-probability buy and sell signals optimized for webhook integration with crypto exchanges like Delta Exchange, Binance Futures, and Bybit.Key Features
Simple & Effective: Uses proven EMA 9/21 crossover strategy
RSI Momentum Filter: Eliminates low-probability trades in ranging markets
Webhook Ready: Two clean alerts (LONG Entry, SHORT Entry) for seamless automation
Exchange Compatible: Works with Delta Exchange, 3Commas, Alertatron, and other webhook platforms
Zero Lag Signals: Real-time alerts on crossover confirmation
Visual Clarity: Clean chart markers for easy signal identification
How It Works
Entry Signals:
LONG Entry: Triggers when EMA 9 crosses above EMA 21 AND RSI is above 52 (bullish momentum confirmed)
SHORT Entry: Triggers when EMA 9 crosses under EMA 21 AND RSI is below 48 (bearish momentum confirmed)
Technical Components:
Fast EMA: 9-period (tracks short-term price action)
Slow EMA: 21-period (identifies primary trend)
RSI: 14-period (confirms momentum strength)
RSI Long Threshold: 52 (filters weak bullish signals)
RSI Short Threshold: 48 (filters weak bearish signals)
Best Use Cases
Crypto Futures Trading: Bitcoin, Ethereum, Altcoin perpetual contracts
Automated Trading Bots: Integration with Delta Exchange webhooks, TradingView alerts
Timeframes: Optimized for 15-minute charts (works on 5min-1H)
Markets: Trending crypto markets with clear directional moves
Risk Management: Best used with 1-2% stop loss per trade (managed externally)
Webhook Automation Setup
Add indicator to your TradingView chart
Create alerts for "LONG Entry" and "SHORT Entry"
Configure webhook URL from your exchange (Delta Exchange, Binance, etc.)
Use alert message: Entry LONG {{ticker}} @ {{close}} or Entry SHORT {{ticker}} @ {{close}}
Exchange automatically reverses positions on opposite signals
Advantages
✅ No manual trading required - fully automated
✅ Eliminates emotional trading decisions
✅ Catches trending moves early with EMA crossovers
✅ RSI filter reduces whipsaws in choppy markets
✅ Works 24/7 without monitoring
✅ Simple two-alert system (easy to manage)
✅ Compatible with multiple exchanges via webhooksStrategy Philosophy
This indicator follows a trend-following with momentum confirmation approach. By waiting for both EMA crossover AND RSI confirmation, it ensures you're entering trades with genuine momentum behind them, not just random price noise. The tight RSI thresholds (52/48) keep you aligned with the prevailing trend.Recommended Settings
Timeframe: 15-minute (primary), 5-minute (scalping), 1-hour (swing)
Markets: BTC/USDT, ETH/USDT, high-liquidity altcoin perpetuals
Position Sizing: 100% capital per signal (exchange manages reversals)
Stop Loss: 2% (managed via exchange or external bot)
Leverage: 1-2x for conservative approach, up to 5x for aggressive
Important Notes
⚠️ This indicator generates entry signals only - position reversals are handled automatically by your exchange
⚠️ Always backtest on historical data before live trading
⚠️ Use proper risk management and position sizing
⚠️ Best performance in trending markets; may generate false signals in tight ranges
⚠️ Requires TradingView Premium or higher for webhook functionalityTags
cryptocurrency futures automated-trading ema-crossover rsi webhook delta-exchange tradingview-alerts trend-following momentum bitcoin ethereum crypto-bot algo-trading 15-minute-strategy

AutoPivot Levels with Alerts [ChartWhizzperer] – Dynamic EditionAuto-Pivot Levels 4 methods with alerts – Dynamic Edition
Now with
- Live Mode
- 4 Pivot Methods
- 7 Session Types (5m, 15m, 30m, Hourly, Daily, Weekly, Monthly)
- PineConnector-Ready Alerts!
Free, Open Source, Pine Script v6-compliant.
NEW: Live Mode (Ultra-Dynamic, Repainting) – Switchable in UI!
Instantly switch between Classic (session-based, repaint-free) and Live (rolling window, real-time, repainting) using the simple checkbox in the settings!
Live Mode recalculates all pivots on every tick/bar, using the current high/low/close for the chosen session (5m, 15m, 30m, hourly, daily, weekly, monthly).
Perfect for:
- Scalping and high-frequency trading
- Real-time bot/automation setups (PineConnector-ready)
- Fast-moving or breakout markets
Classic Mode: For traditional, stable levels based on confirmed session data – ideal for backtesting and trading history.
Four Calculation Methods (Choose What Fits YOU)
1. Classic
Standard pivot calculation.
Based on previous session’s High, Low, Close.
Simple, proven, and suitable for any asset.
2. Fibonacci
Projects levels using Fibonacci ratios of the prior session’s range.
Great for traders who want to align pivots with fib retracements and extensions.
3. Camarilla
Uses unique multipliers for support/resistance, focusing on mean reversion and volatility.
Popular among futures and forex day traders.
4. Woodie
Puts extra weight on previous Close for more responsive pivots.
Often used in trending or choppy conditions.
Switch methods anytime in the UI – the script recalculates instantly and keeps your chart clean!
Level-Specific Alerts – PineConnector Ready!
Dedicated alert for EVERY level and direction (Up/Down):
Pivot (P), R1, R2, R3, S1, S2, S3
No configuration hassle:
All alerts are pre-defined in the TradingView Alert Panel and work across all session types (5m → monthly).
Machine-readable message format:
PIVOT=R1 DIR=UP SYMBOL={{ticker}} PRICE={{close}}
Direct plug-and-play with PineConnector, webhooks, Discord, Telegram, bots, and other automation tools.
Never miss a breakout, reversal, or key support/resistance touch!
Powerful Customization & Performance
- Session selection: 5m, 15m, 30m, Hourly, Daily, Weekly, Monthly (choose what suits your trading style).
- Show/hide any level (Pivot, R1–R3, S1–S3) for minimal chart clutter.
- Color selection for each level to match your theme or highlight key pivots.
- Auto-cleanup: Old lines and labels are cleared on every recalculation or session change for maximum performance and visual clarity.
- Zero runtime errors: Strict Pine Script v6 practices for stability.
How To Use – Quick Start
1) Add the indicator to your TradingView chart.
2) Pick your calculation method (Classic, Fibonacci, Camarilla, Woodie).
3) Set session type (5m, 15m, 30m, Hourly, Daily, Weekly, Monthly).
4) Switch between Classic and Live Mode with a single click in settings.
5) Customize your levels (on/off, colors).
6) Open the Alert Panel, select any pre-configured alert (e.g. "R2 Cross Down"), and go live!
7) Connect with PineConnector or any webhook system instantly using the pre-formatted alert messages.
Who Is It For?
- Active scalpers & bot traders: Live Mode + PineConnector-ready alerts = instant, automated reactions.
- Swing and position traders: Use Classic Mode for stable, repaint-free levels.
- Strategy developers: Seamless integration into automated and manual trading workflows.
License & Community
Open Source, Non-Commercial:
Free for personal & educational use under CC BY-NC-SA 4.0.
Feedback, bug reports & ideas:
Drop a comment, or contact me for feature requests.
Trade smart. Trade dynamic. Unlock the true power of pivots – with ChartWhizzperer!

MACD Forecast [Titans_Invest]MACD Forecast — The Future of MACD in Trading
The MACD has always been one of the most powerful tools in technical analysis.
But what if you could see where it’s going, instead of just reacting to what has already happened?
Introducing MACD Forecast — the natural evolution of the MACD Full , now taken to the next level. It’s the world’s first MACD designed not only to analyze the present but also to predict the future behavior of momentum.
By combining the classic MACD structure with projections powered by Linear Regression, this indicator gives traders an anticipatory, predictive view, redefining what’s possible in technical analysis.
Forget lagging indicators.
This is the smartest, most advanced, and most accurate MACD ever created.
🍟 WHY MACD FORECAST IS REVOLUTIONARY
Unlike the traditional MACD, which only reflects current and past price dynamics, the MACD Forecast uses regression-based projection models to anticipate where the MACD line, signal line, and histogram are heading.
This means traders can:
• See MACD crossovers before they happen.
• Spot trend reversals earlier than most.
• Gain an unprecedented timing advantage in both discretionary and automated trading.
In other words: this indicator lets you trade ahead of time.
🔮 FORECAST ENGINE — POWERED BY LINEAR REGRESSION
At its core, the MACD Forecast integrates Linear Regression (ta.linreg) to project the MACD’s future behavior with exceptional accuracy.
Projection Modes:
• Flat Projection: Assumes trend continuity at the current level.
• LinReg Projection: Applies linear regression across N periods to mathematically forecast momentum shifts.
This dual system offers both a conservative and adaptive view of market direction.
📐 ACCURACY WITH FULL CUSTOMIZATION
Just like the MACD Full, this new version comes with 20 customizable buy-entry conditions and 20 sell-entry conditions — now enhanced with forecast-based rules that anticipate crossovers and trend reversals.
You’re not just reacting — you’re strategizing ahead of time.
⯁ HOW TO USE MACD FORECAST❓
The MACD Forecast is built on the same foundation as the classic MACD, but with predictive capabilities.
Step 1 — Spot Predicted Crossovers:
Watch for forecasted bullish or bearish crossovers. These signals anticipate when the MACD line will cross the signal line in the future, letting you prepare trades before the move.
Step 2 — Confirm with Histogram Projection:
Use the projected histogram to validate momentum direction. A rising histogram signals strengthening bullish momentum, while a falling projection points to weakening or bearish conditions.
Step 3 — Combine with Multi-Timeframe Analysis:
Use forecasts across multiple timeframes to confirm signal strength (e.g., a 1h forecast aligned with a 4h forecast).
Step 4 — Set Entry Conditions & Automation:
Customize your buy/sell rules with the 20 forecast-based conditions and enable automation for bots or alerts.
Step 5 — Trade Ahead of the Market:
By preparing for future momentum shifts instead of reacting to the past, you’ll always stay one step ahead of lagging traders.
🤖 BUILT FOR AUTOMATION AND BOTS 🤖
Whether for manual trading, quantitative strategies, or advanced algorithms, the MACD Forecast was designed to integrate seamlessly with automated systems.
With predictive logic at its core, your strategies can finally react to what’s coming, not just what already happened.
🥇 WHY THIS INDICATOR IS UNIQUE 🥇
• World’s first MACD with Linear Regression Forecasting
• Predictive Crossovers (before they appear on the chart)
• Maximum flexibility with Long & Short combinations — 20+ fully configurable conditions for tailor-made strategies
• Fully automatable for quantitative systems and advanced bots
This isn’t just an update.
It’s the final evolution of the MACD.
______________________________________________________
🔹 CONDITIONS TO BUY 📈
______________________________________________________
• Signal Validity: The signal will remain valid for X bars .
• Signal Sequence: Configurable as AND or OR .
🔹 MACD > Signal Smoothing
🔹 MACD < Signal Smoothing
🔹 Histogram > 0
🔹 Histogram < 0
🔹 Histogram Positive
🔹 Histogram Negative
🔹 MACD > 0
🔹 MACD < 0
🔹 Signal > 0
🔹 Signal < 0
🔹 MACD > Histogram
🔹 MACD < Histogram
🔹 Signal > Histogram
🔹 Signal < Histogram
🔹 MACD (Crossover) Signal
🔹 MACD (Crossunder) Signal
🔹 MACD (Crossover) 0
🔹 MACD (Crossunder) 0
🔹 Signal (Crossover) 0
🔹 Signal (Crossunder) 0
🔮 MACD (Crossover) Signal Forecast
🔮 MACD (Crossunder) Signal Forecast
______________________________________________________
______________________________________________________
🔸 CONDITIONS TO SELL 📉
______________________________________________________
• Signal Validity: The signal will remain valid for X bars .
• Signal Sequence: Configurable as AND or OR .
🔸 MACD > Signal Smoothing
🔸 MACD < Signal Smoothing
🔸 Histogram > 0
🔸 Histogram < 0
🔸 Histogram Positive
🔸 Histogram Negative
🔸 MACD > 0
🔸 MACD < 0
🔸 Signal > 0
🔸 Signal < 0
🔸 MACD > Histogram
🔸 MACD < Histogram
🔸 Signal > Histogram
🔸 Signal < Histogram
🔸 MACD (Crossover) Signal
🔸 MACD (Crossunder) Signal
🔸 MACD (Crossover) 0
🔸 MACD (Crossunder) 0
🔸 Signal (Crossover) 0
🔸 Signal (Crossunder) 0
🔮 MACD (Crossover) Signal Forecast
🔮 MACD (Crossunder) Signal Forecast
______________________________________________________
______________________________________________________
🔮 Linear Regression Function 🔮
______________________________________________________
• Our indicator includes MACD forecasts powered by linear regression.
Forecast Types:
• Flat: Assumes prices will stay the same.
• Linreg: Makes a 'Linear Regression' forecast for n periods.
Technical Information:
• Function: ta.linreg()
Parameters:
• source: Source price series.
• length: Number of bars (period).
• offset : Offset.
• return: Linear regression curve.
______________________________________________________
______________________________________________________
⯁ UNIQUE FEATURES
______________________________________________________
Linear Regression: (Forecast)
Signal Validity: The signal will remain valid for X bars
Signal Sequence: Configurable as AND/OR
Table of Conditions: BUY/SELL
Conditions Label: BUY/SELL
Plot Labels in the graph above: BUY/SELL
Automate & Monitor Signals/Alerts: BUY/SELL
Linear Regression (Forecast)
Signal Validity: The signal will remain valid for X bars
Signal Sequence: Configurable as AND/OR
Table of Conditions: BUY/SELL
Conditions Label: BUY/SELL
Plot Labels in the graph above: BUY/SELL
Automate & Monitor Signals/Alerts: BUY/SELL
______________________________________________________
📜 SCRIPT : MACD Forecast
🎴 Art by : @Titans_Invest & @DiFlip
👨💻 Dev by : @Titans_Invest & @DiFlip
🎑 Titans Invest — The Wizards Without Gloves 🧤
✨ Enjoy!
______________________________________________________
o Mission 🗺
• Inspire Traders to manifest Magic in the Market.
o Vision 𐓏
• To elevate collective Energy 𐓷𐓏
🎗️ In memory of João Guilherme — your light will live on forever.

Price action + MA + MTF RSI + S/R Zones by GunjanPanditDescription:
This script combines multiple powerful trading tools into a unified indicator designed for trend-following and confirmation-based entries. It is built to assist traders in identifying actionable signals based on price structure, volatility, and momentum across multiple timeframes.
🔧 How It Works
✅ UT Bot Core Logic
The script uses a variation of the UT Bot (Ultimate Trend Bot) method to generate buy/sell signals.
Signals are based on ATR-filtered trailing stop levels to reduce noise and detect real trend changes.
A Buy is triggered when the price closes above the UT trailing stop.
A Sell is triggered when the price closes below it.
✅ Multi-Timeframe RSI Confirmation
RSI is calculated on a user-defined higher timeframe (default: 1 hour).
A buy signal is confirmed only if RSI is below the oversold level, and vice versa for sell signals.
This confirmation layer adds an extra filter to improve signal reliability and reduce whipsaws.
✅ Support & Resistance Zones (MTF)
The script automatically plots dynamic support and resistance zones using highs/lows from the selected higher timeframe.
These zones are visualized as shaded bands, helping users recognize key levels where price may reverse or consolidate.
✅ Visual Aids & Alerts
Buy and Sell signals are clearly labeled on the chart.
Optional RSI plot in a separate pane for visual monitoring.
Real-time alert conditions included for both Buy and Sell entries.
📈 Use Case & Recommendations
This script is best suited for:
Swing trading or intraday strategies in trending markets.
Traders who want confirmation across timeframes to filter noise.
Spotting key entry zones aligned with momentum and volatility.
Recommended to use in combination with:
Volume or trend structure analysis.
Stop-loss and take-profit risk management based on ATR or S/R zones.
inal Thoughts
This indicator is ideal for traders who value:
Multi-timeframe analysis
Visual clarity
Signal confirmation
And clean, customizable overlays for actionable trading insights.
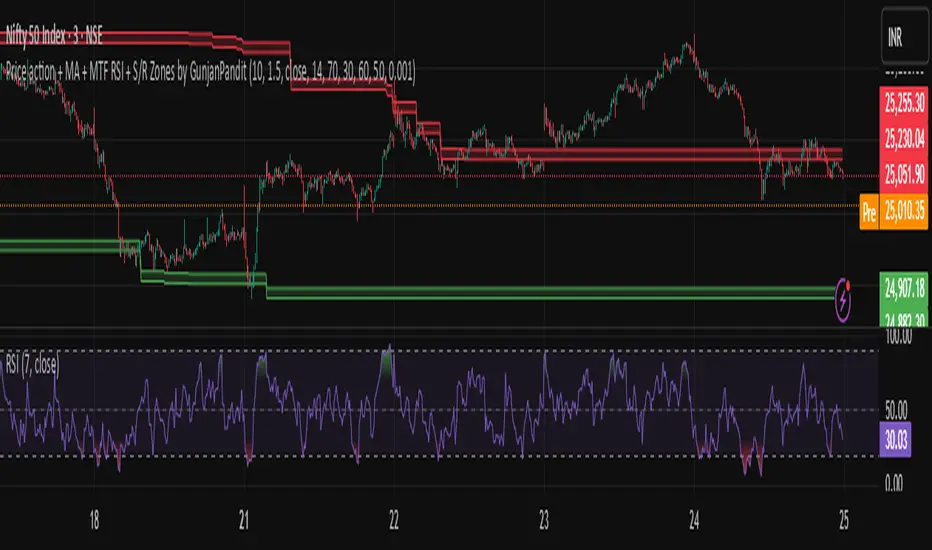
ian_Trado v15 Trend Entry Filter# 📈 ian_Trado v15 Trend Entry Filter (Pine Script v6)
The **ian_Trado v15** is a multi-factor **trend confirmation filter** for NASDAQ (NAS100), Dow Jones (DJ30), Gold (XAU), DAX, and USDJPY.
It combines **EMA structure**, **Donchian channel breakout**, **MACD histogram momentum**, **Volume confirmation**, and a **Range Compression Filter** to avoid entering during choppy or sideways markets.
✅ Designed for **bot deployment** (e.g., grid bots, long/short breakout bots) or **manual trading**.
---
## 🔍 How This Filter Works:
1. **EMA Trend Confirmation**
- Long Trend: EMA(1) > EMA(5) > EMA(60)
- Short Trend: EMA(1) < EMA(5) < EMA(60)
2. **Donchian Channel Width Expansion**
- Only allows trades when the **breakout width** exceeds a minimum threshold.
3. **MACD Histogram Slope Filter (Optional)**
- Confirms momentum building in the direction of the trend.
- Strict Mode: MACD histogram must consistently rise or fall over 3 bars.
4. **Volume Filter (Optional)**
- Ensures volume supports the move (filters out weak conditions).
5. **Range Compression Filter (Optional)**
- Avoids entries during sideways chop.
6. **Cooldown Control**
- Limits overtrading by requiring spacing between entries.
7. **Exit Conditions**
- Gray dot appears when trending conditions are no longer valid.
---
## ⚙️ Settings Explained:
| Setting | Description |
|:--------|:------------|
| **Cooldown Bars** | Minimum bars between consecutive entries |
| **Profit Target (%)** | Visual profit marker for exit tracking |
| **Donchian Channel Length** | Lookback period for detecting breakout width |
| **Minimum Donchian Width** | Threshold to confirm meaningful breakouts |
| **Volume Lookback Period** | Average volume validation window |
| **Box Range (Range Compression)** | Max allowed price range over lookback bars |
| **Range Compression Bars** | Number of bars to check for range compression |
| **Strict MACD Filter** | Use stricter MACD slope checks |
---
## 📊 Recommended Settings by Instrument (1H Chart):
| Asset | Min Donchian Width | Range Compression | Profit Target |
|:------|:-------------------|:------------------|:--------------|
| **NAS100** (Nasdaq) | 300–450 pts | 400 pts / 40 bars | 1.5% |
| **DJ30** (Dow Jones) | 400–600 pts | 500 pts / 40 bars | 1.0–1.5% |
| **XAU/USD** (Gold) | 10–15 pts | 8 pts / 30 bars | 0.8–1.2% |
| **DAX40** (Germany) | 200–300 pts | 250 pts / 40 bars | 1.0% |
| **USD/JPY** (Forex) | 0.5–0.8 pts | 0.4 pts / 40 bars | 0.5–0.8% |
---
## 🔔 Alerts Available:
- Long Entry
- Short Entry
- Exit Zone
> **Note:** Volume filter may be disabled if volume is unreliable (e.g., some forex pairs).
---
## 📅 Version:
- **ian_Trado v15** — April 2025
- Built with **Pine Script v6** for maximum stability
- Clean toggling and plotting logic (no `na` errors)

Time-based Alerts for Trading Windows🌟 Time-based Alerts for Trading Windows 🌐📈
This is a re-uploaded script as the previous one got hidden.
This Time-based Alerts for Trading Windows script is a highly customizable and reliable tool designed to assist traders in managing automated strategies or manually monitoring specific market conditions. Inspired by CrossTrade's Time-based Alert, this script is tailored for those who rely on precise time windows to trigger actions, such as sending webhook signals or managing Expert Advisors (EAs).
Whether you are a scalper, day trader, or algorithmic trader, this script empowers you to stay on top of your trades with fully customizable time-based alerts.
🛠️ Customizable Time Alerts
This indicator allows you to create up to 12 unique time windows by specifying the exact hour and minute for each alert. Each time window corresponds to an individual alert condition, making it perfect for managing trades during specific market sessions or key time periods.
For example:
Alert 1 can be set at 9:30 AM (market open).
Alert 2 can be set at 3:55 PM (just before market close).
Each alert can be toggled on or off in the indicator settings, allowing you to manage alerts without having to reconfigure your script.
You can adjust the colours to fit any colour scheme you like!
🕒 Odd and Even Time Alerts
The script comes with three built-in alert type categories:
Odd Alerts (marked with a green triangle on the chart): These correspond to odd-numbered inputs like Alert 1, Alert 3, Alert 5, and so on.
Even Alerts (marked with a red triangle on the chart): These correspond to even-numbered inputs like Alert 2, Alert 4, Alert 6, and so on.
You can also customize all 12 alerts individually to include a custom alert message
These alerts serve as a convenient way to differentiate between multiple trading strategies or market conditions. You can customize alert messages for odd and even alerts directly from TradingView’s alert panel.
🔗 Webhook Integration for Automation
This script is fully compatible with webhook-based automation. By configuring your alerts in TradingView, you can send signals to trading bots, EAs, or any third-party system. For example, you can:
Turn off an EA at a specific time (e.g., 3:55 PM EST).
Send buy/sell signals to your bot during predefined trading windows.
Simply use TradingView’s alert message editor to format webhook payloads for your automation system.
🌐 Timezone Flexibility
Trading happens across multiple time zones, and this script accounts for that. You can toggle between:
Eastern Time (New York): Ideal for most US-based markets.
Central Time (Exchange): Useful for futures and commodities traders.
This ensures your alerts are always in sync with your preferred time zone, eliminating confusion.
🎨 Visual Indicators
The script plots visual markers directly on your chart to indicate active alerts:
Up Facing Triangles: Represent odd-numbered alerts, providing a quick reference for these time windows.
Down Facing Triangles: Represent even-numbered alerts, helping you track different strategies or conditions.
These visual markers make it easy to see when alerts are triggered, even at a glance.
📈 Practical Use Case
Let’s say you’re trading the USTEC index on a 1-minute chart. You want to:
Turn off your trading bot at 16:55 EST to avoid after-market volatility.
Trigger a re-entry signal at 17:30 EST to capture moves during the Asian session.
Visually monitor these actions on your chart for easy reference.
This script makes it possible with precision alerts and webhook integration. Simply configure the time windows in the settings and set up your alerts in TradingView.
🚨 How to Set Up Alerts
Enable or Disable Alerts: Use the script’s settings to toggle specific alerts on or off as needed.
Set Custom Time Windows: Define the hour and minute for each alert in the settings panel.
Create Alerts in TradingView:
Go to the TradingView alert panel.
Select the condition (e.g., "Odd Time-based Alert (Green)" or "Even Time-based Alert (Red)").
Customize the alert message for webhook integration or personal notification.
Choose the trigger type: Once Per Bar or Once Per Bar Close to keep the alert active.
Integrate with Webhooks: Use the alert message field to format payloads for automation systems like MT4, MT5, or third-party bots.
📋 Key Notes
Alerts can trigger indefinitely if set to "Once Per Bar" or "Once Per Bar Close".
Always ensure the expiration date is set far in the future to avoid unexpected alert deactivation.
Test webhook messages and alert configurations thoroughly before using them in live trading.
This script is a powerful addition to your trading toolbox, offering precision, flexibility, and automation capabilities. Whether you’re turning off an EA, managing trades during market sessions, or automating strategies via webhooks, this script is here to support you.
Start using the Time-based Alerts for Trading Windows today and trade with confidence! 🚀✨

Smart DCA Strategy (Public)INSPIRATION
While Dollar Cost Averaging (DCA) is a popular and stress-free investment approach, I noticed an opportunity for enhancement. Standard DCA involves buying consistently, regardless of market conditions, which can sometimes mean missing out on optimal investment opportunities. This led me to develop the Smart DCA Strategy – a 'set and forget' method like traditional DCA, but with an intelligent twist to boost its effectiveness.
The goal was to build something more profitable than a standard DCA strategy so it was equally important that this indicator could backtest its own results in an A/B test manner against the regular DCA strategy.
WHY IS IT SMART?
The key to this strategy is its dynamic approach: buying aggressively when the market shows signs of being oversold, and sitting on the sidelines when it's not. This approach aims to optimize entry points, enhancing the potential for better returns while maintaining the simplicity and low stress of DCA.
WHAT THIS STRATEGY IS, AND IS NOT
This is an investment style strategy. It is designed to improve upon the common standard DCA investment strategy. It is therefore NOT a day trading strategy. Feel free to experiment with various timeframes, but it was designed to be used on a daily timeframe and that's how I recommend it to be used.
You may also go months without any buy signals during bull markets, but remember that is exactly the point of the strategy - to keep your buying power on the sidelines until the markets have significantly pulled back. You need to be patient and trust in the historical backtesting you have performed.
HOW IT WORKS
The Smart DCA Strategy leverages a creative approach to using Moving Averages to identify the most opportune moments to buy. A trigger occurs when a daily candle, in its entirety including the high wick, closes below the threshold line or box plotted on the chart. The indicator is designed to facilitate both backtesting and live trading.
HOW TO USE
Settings:
The input parameters for tuning have been intentionally simplified in an effort to prevent users falling into the overfitting trap.
The main control is the Buying strictness scale setting. Setting this to a lower value will provide more buying days (less strict) while higher values mean less buying days (more strict). In my testing I've found level 9 to provide good all round results.
Validation days is a setting to prevent triggering entries until the asset has spent a given number of days (candles) in the overbought state. Increasing this makes entries stricter. I've found 0 to give the best results across most assets.
In the backtest settings you can also configure how much to buy for each day an entry triggers. Blind buy size is the amount you would buy every day in a standard DCA strategy. Smart buy size is the amount you would buy each day a Smart DCA entry is triggered.
You can also experiment with backtesting your strategy over different historical datasets by using the Start date and End date settings. The results table will not calculate for any trades outside what you've set in the date range settings.
Backtesting:
When backtesting you should use the results table on the top right to tune and optimise the results of your strategy. As with all backtests, be careful to avoid overfitting the parameters. It's better to have a setup which works well across many currencies and historical periods than a setup which is excellent on one dataset but bad on most others. This gives a much higher probability that it will be effective when you move to live trading.
The results table provides a clear visual representation as to which strategy, standard or smart, is more profitable for the given dataset. You will notice the columns are dynamically coloured red and green. Their colour changes based on which strategy is more profitable in the A/B style backtest - green wins, red loses. The key metrics to focus on are GOA (Gain on Account) and Avg Cost.
Live Trading:
After you've finished backtesting you can proceed with configuring your alerts for live trading.
But first, you need to estimate the amount you should buy on each Smart DCA entry. We can use the Total invested row in the results table to calculate this. Assuming we're looking to trade on
BTCUSD
Decide how much USD you would spend each day to buy BTC if you were using a standard DCA strategy. Lets say that is $5 per day
Enter that USD amount in the Blind buy size settings box
Check the Blind Buy column in the results table. If we set the backtest date range to the last 10 years, we would expect the amount spent on blind buys over 10 years to be $18,250 given $5 each day
Next we need to tweak the value of the Smart buy size parameter in setting to get it as close as we can to the Total Invested amount for Blind Buy
By following this approach it means we will invest roughly the same amount into our Smart DCA strategy as we would have into a standard DCA strategy over any given time period.
After you have calculated the Smart buy size, you can go ahead and set up alerts on Smart DCA buy triggers.
BOT AUTOMATION
In an effort to maintain the 'set and forget' stress-free benefits of a standard DCA strategy, I have set my personal Smart DCA Strategy up to be automated. The bot runs on AWS and I have a fully functional project for the bot on my GitHub account. Just reach out if you would like me to point you towards it. You can also hook this into any other 3rd party trade automation system of your choice using the pre-configured alerts within the indicator.
PLANNED FUTURE DEVELOPMENTS
Currently this is purely an accumulation strategy. It does not have any sell signals right now but I have ideas on how I will build upon it to incorporate an algorithm for selling. The strategy should gradually offload profits in bull markets which generates more USD which gives more buying power to rinse and repeat the same process in the next cycle only with a bigger starting capital. Watch this space!
MARKETS
Crypto:
This strategy has been specifically built to work on the crypto markets. It has been developed, backtested and tuned against crypto markets and I personally only run it on crypto markets to accumulate more of the coins I believe in for the long term. In the section below I will provide some backtest results from some of the top crypto assets.
Stocks:
I've found it is generally more profitable than a standard DCA strategy on the majority of stocks, however the results proved to be a lot more impressive on crypto. This is mainly due to the volatility and cycles found in crypto markets. The strategy makes its profits from capitalising on pullbacks in price. Good stocks on the other hand tend to move up and to the right with less significant pullbacks, therefore giving this strategy less opportunity to flourish.
Forex:
As this is an accumulation style investment strategy, I do not recommend that you use it to trade Forex.
For more info about this strategy including backtest results, please see the full description on the invite only version of this strategy named "Smart DCA Strategy"

[3Commas] Signal BuilderSignal Builder is a tool designed to help traders create custom buy and sell signals by combining multiple technical indicators. Its flexibility allows traders to set conditions based on their specific strategy, whether they’re into scalping, swing trading, or long-term investing. Additionally, its integration with 3Commas bots makes it a powerful choice for those looking to automate their trades, though it’s also ideal for traders who prefer receiving alerts and making manual decisions.
🔵 How does Signal Builder work?
Signal Builder allows users to define custom conditions using popular technical indicators, which, when met, generate clear buy or sell signals. These signals can be used to trigger TradingView alerts, ensuring that you never miss a market opportunity. Additionally, all conditions are evaluated using "AND" logic, meaning signals are only activated when all user-defined conditions are met. This increases precision and helps avoid false signals.
🔵 Available indicators and recommended settings:
Signal Builder provides access to a wide range of technical indicators, each customizable to popular settings that maximize effectiveness:
RSI (Relative Strength Index): An oscillator that measures the relative strength of price over a specific period. Traders typically configure it with 14 periods, using levels of 30 (oversold) and 70 (overbought) to identify potential reversals.
MACD (Moving Average Convergence Divergence): A key indicator tracking the crossover between two moving averages. Common settings include 12 and 26 periods for the moving averages, with a 9-period signal line to detect trend changes.
Ultimate Oscillator: Combines three different time frames to offer a comprehensive view of buying and selling pressure. Popular settings are 7, 14, and 28 periods.
Bollinger Bands %B: Provides insight into where the price is relative to its upper and lower bands. Standard settings include a 20-period moving average and a standard deviation of 2.
ADX (Average Directional Index): Measures the strength of a trend. Values above 25 typically indicate a strong trend, while values below suggest weak or sideways movement.
Stochastic Oscillator: A momentum indicator comparing the closing price to its range over a defined period. Popular configurations include 14 periods for %K and 3 for %D smoothing.
Parabolic SAR: Ideal for identifying trend reversals and entry/exit points. Commonly configured with a 0.02 step and a 0.2 maximum.
Money Flow Index (MFI): Similar to RSI but incorporates volume into the calculation. Standard settings use 14 periods, with levels of 20 and 80 as oversold and overbought thresholds.
Commodity Channel Index (CCI): Measures the deviation of price from its average. Traders often use a 20-period setting with levels of +100 and -100 to identify extreme overbought or oversold conditions.
Heikin Ashi Candles: These candles smooth out price fluctuations to show clearer trends. Commonly used in trend-following strategies to filter market noise.
🔵 How to use Signal Builder:
Configure indicators: Select the indicators that best fit your strategy and adjust their settings as needed. You can combine multiple indicators to define precise entry and exit conditions.
Define custom signals: Create buy or sell conditions that trigger when your selected indicators meet the criteria you’ve set. For example, configure a buy signal when RSI crosses above 30 and MACD confirms with a bullish crossover.
TradingView alerts: Set up alerts in TradingView to receive real-time notifications when the conditions you’ve defined are met, allowing you to react quickly to market opportunities without constantly monitoring charts.
Monitor with the panel: Signal Builder includes a visual panel that shows active conditions for each indicator in real time, helping you keep track of signals without manually checking each indicator.
🔵 3Commas integration:
In addition to being a valuable tool for any trader, Signal Builder is optimized to work seamlessly with 3Commas bots through Webhooks. This allows you to automate your trades based on the signals you’ve configured, ensuring that no opportunity is missed when your defined conditions are met. If you prefer automation, Signal Builder can send buy or sell signals to your 3Commas bots, enhancing your trading process and helping you manage multiple trades more efficiently.
🔵 Example of use:
Imagine you trade in volatile markets and want to trigger a sell signal when:
Stochastic Oscillator indicates overbought conditions with the %K value crossing below 80.
Bollinger Bands %B shows the price has surpassed the upper band, suggesting a potential reversal.
ADX is below 20, indicating that the trend is weak and could be about to change.
With Signal Builder , you can configure these conditions to trigger a sell signal only when all are met simultaneously. Then, you can set up a TradingView alert to notify you as soon as the signal is activated, giving you the opportunity to react quickly and adjust your strategy accordingly.
👨🏻💻💭 If this tool helps your trading strategy, don’t forget to give it a boost! Feel free to share in the comments how you're using it or if you have any questions.
_________________________________________________________________
The information and publications within the 3Commas TradingView account are not meant to be and do not constitute financial, investment, trading, or other types of advice or recommendations supplied or endorsed by 3Commas and any of the parties acting on behalf of 3Commas, including its employees, contractors, ambassadors, etc.

MH DCA Trail EmulatorThe Market Hunter DCA Bot emulator is designed to simplify the visual analysis of the algorithm and bot configuration. The algorithm calculates the distance specified in the settings from hai to DCA0 (the first grid order) and trails the grid before entering the position. After exiting the position, the current high is calculated and a new grid is placed at the specified distance.
There are 3 levels available in the settings DCA0 DCA1 DCA2, take profit and liquidation. The average position rate is calculated based on the volume of orders DCA0=X1, DCA1=X1, DCA2=X2.
Эмулятор работы Market Hunter DCA Bot разработан для упрощения визуального анализа работы алгоритма и настройки бота. Алгоритм рассчитывает указанное в настройках расстояние от хая до DCA0 (первого ордера сетки) и трейлит сетку до входа в позицию. После выхода из позиции рассчитывается текущий хай и на указанном расстоянии ставит новую сетку.
В настройках доступно 3 уровня DCA0 DCA1 DCA2, тейк профит и ликвидация. Средний курс позиции рассчитывается исходя из объёмов ордеров DCA0=X1, DCA1=X1, DCA2=X2.х

Smart DCA StrategyINSPIRATION
While Dollar Cost Averaging (DCA) is a popular and stress-free investment approach, I noticed an opportunity for enhancement. Standard DCA involves buying consistently, regardless of market conditions, which can sometimes mean missing out on optimal investment opportunities. This led me to develop the Smart DCA Strategy – a 'set and forget' method like traditional DCA, but with an intelligent twist to boost its effectiveness.
The goal was to build something more profitable than a standard DCA strategy so it was equally important that this indicator could backtest its own results in an A/B test manner against the regular DCA strategy.
WHY IS IT SMART?
The key to this strategy is its dynamic approach: buying aggressively when the market shows signs of being oversold, and sitting on the sidelines when it's not. This approach aims to optimize entry points, enhancing the potential for better returns while maintaining the simplicity and low stress of DCA.
WHAT THIS STRATEGY IS, AND IS NOT
This is an investment style strategy. It is designed to improve upon the common standard DCA investment strategy. It is therefore NOT a day trading strategy. Feel free to experiment with various timeframes, but it was designed to be used on a daily timeframe and that's how I recommend it to be used.
You may also go months without any buy signals during bull markets, but remember that is exactly the point of the strategy - to keep your buying power on the sidelines until the markets have significantly pulled back. You need to be patient and trust in the historical backtesting you have performed.
HOW IT WORKS
The Smart DCA Strategy leverages a creative approach to using Moving Averages to identify the most opportune moments to buy. A trigger occurs when a daily candle, in its entirety including the high wick, closes below the threshold line or box plotted on the chart. The indicator is designed to facilitate both backtesting and live trading.
HOW TO USE
Settings:
The input parameters for tuning have been intentionally simplified in an effort to prevent users falling into the overfitting trap.
The main control is the Buying strictness scale setting. Setting this to a lower value will provide more buying days (less strict) while higher values mean less buying days (more strict). In my testing I've found level 9 to provide good all round results.
Validation days is a setting to prevent triggering entries until the asset has spent a given number of days (candles) in the overbought state. Increasing this makes entries stricter. I've found 0 to give the best results across most assets.
In the backtest settings you can also configure how much to buy for each day an entry triggers. Blind buy size is the amount you would buy every day in a standard DCA strategy. Smart buy size is the amount you would buy each day a Smart DCA entry is triggered.
You can also experiment with backtesting your strategy over different historical datasets by using the Start date and End date settings. The results table will not calculate for any trades outside what you've set in the date range settings.
Backtesting:
When backtesting you should use the results table on the top right to tune and optimise the results of your strategy. As with all backtests, be careful to avoid overfitting the parameters. It's better to have a setup which works well across many currencies and historical periods than a setup which is excellent on one dataset but bad on most others. This gives a much higher probability that it will be effective when you move to live trading.
The results table provides a clear visual representation as to which strategy, standard or smart, is more profitable for the given dataset. You will notice the columns are dynamically coloured red and green. Their colour changes based on which strategy is more profitable in the A/B style backtest - green wins, red loses. The key metrics to focus on are GOA (Gain on Account) and Avg Cost .
Live Trading:
After you've finished backtesting you can proceed with configuring your alerts for live trading.
But first, you need to estimate the amount you should buy on each Smart DCA entry. We can use the Total invested row in the results table to calculate this. Assuming we're looking to trade on BITSTAMP:BTCUSD
Decide how much USD you would spend each day to buy BTC if you were using a standard DCA strategy. Lets say that is $5 per day
Enter that USD amount in the Blind buy size settings box
Check the Blind Buy column in the results table. If we set the backtest date range to the last 10 years, we would expect the amount spent on blind buys over 10 years to be $18,250 given $5 each day
Next we need to tweak the value of the Smart buy size parameter in setting to get it as close as we can to the Total Invested amount for Blind Buy
By following this approach it means we will invest roughly the same amount into our Smart DCA strategy as we would have into a standard DCA strategy over any given time period.
After you have calculated the Smart buy size , you can go ahead and set up alerts on Smart DCA buy triggers.
BOT AUTOMATION
In an effort to maintain the 'set and forget' stress-free benefits of a standard DCA strategy, I have set my personal Smart DCA Strategy up to be automated. The bot runs on AWS and I have a fully functional project for the bot on my GitHub account. Just reach out if you would like me to point you towards it. You can also hook this into any other 3rd party trade automation system of your choice using the pre-configured alerts within the indicator.
PLANNED FUTURE DEVELOPMENTS
Currently this is purely an accumulation strategy. It does not have any sell signals right now but I have ideas on how I will build upon it to incorporate an algorithm for selling. The strategy should gradually offload profits in bull markets which generates more USD which gives more buying power to rinse and repeat the same process in the next cycle only with a bigger starting capital. Watch this space!
MARKETS
Crypto:
This strategy has been specifically built to work on the crypto markets. It has been developed, backtested and tuned against crypto markets and I personally only run it on crypto markets to accumulate more of the coins I believe in for the long term. In the section below I will provide some backtest results from some of the top crypto assets.
Stocks:
I've found it is generally more profitable than a standard DCA strategy on the majority of stocks, however the results proved to be a lot more impressive on crypto. This is mainly due to the volatility and cycles found in crypto markets. The strategy makes its profits from capitalising on pullbacks in price. Good stocks on the other hand tend to move up and to the right with less significant pullbacks, therefore giving this strategy less opportunity to flourish.
Forex:
As this is an accumulation style investment strategy, I do not recommend that you use it to trade Forex.
STRATEGY IN ACTION
Here you see the indicator running on the BITSTAMP:BTCUSD pair. You can read the indicator as follows:
Vertical green bands on historical candles represents where buy signals triggered in the past
Table on the top right represents the results of the A/B backtest against a standard DCA strategy
Green Smart Buy column shows that Smart DCA was more profitable than standard DCA on this backtest. That is shown by the percentage GOA (Gain on Account) and the Avg Cost
Smart Buy Zone label marks the threshold which the entire candle must be below to trigger a buy signal (line can be changed to a box under plotting settings)
Green color of Smart Buy Zone label represents that the open candle is still valid for a buy signal. A signal will only be generated if the candle closes while this label is still green
Below is the same BITSTAMP:BTCUSD chart a couple of days later. Notice how the threshold has been broken and the Smart Buy Zone label has turned from green to red. No buy signal can be triggered for this day - even if the candle retraced and closed below the threshold before daily candle close.
Notice how the green vertical bands tend to be present after significant pullbacks in price. This is the reason the strategy works! Below is the same BITSTAMP:BTCUSD chart, but this time zoomed out to present a clearer picture of the times it would invest vs times it would sit out of the market. You will notice it invests heavily in bear markets and significant pullbacks, and does not buy anything during bull markets.
Finally, to visually demonstrate the indicator on an asset other than BTC, here is an example on CRYPTO:ETHUSD . In this case the current daily high has not touched the threshold so it is still possible for this to be a valid buy trigger on daily candle close. The vertical green band will not print until the buy trigger is confirmed.
BACKTEST RESULTS
Now for some backtest results to demonstrate the improved performance over a standard DCA strategy using all non-stablecoin assets in the top 30 cryptos by marketcap.
I've used the TradingView ticker (exchange name denoted as CRYPTO in the symbol search) for every symbol tested with the exception of BTCUSD because there was some dodgy data at the beginning of the TradingView BTCUSD chart which overinflated the effectiveness of the Smart DCA strategy on that ticker. For BTCUSD I've used the BITSTAMP exchange data. The symbol links below will take you to the correct chart and exchange used for the test.
I'm using the GOA (Gain on Account) values to present how each strategy performed.
The value on the left side is the standard DCA result and the right is the Smart DCA result.
✅ means Smart DCA strategy outperformed the standard DCA strategy
❌ means standard DCA strategy outperformed the Smart DCA strategy
To avoid overfitting, and to prove that this strategy does not suffer from overfitting, I've used the exact same input parameters for every symbol tested below. The settings used in these backtests are:
Buying strictness scale: 9
Validation days: 0
You can absolutely tweak the values per symbol to further improve the results of each, however I think using identical settings on every pair tested demonstrates a higher likelihood that the results will be similar in the live markets.
I'm presenting results for two time periods:
First price data available for trading pair -> closing candle on Friday 26th Jan 2024 (ALL TIME)
Opening candle on Sunday 1st Jan 2023 -> closing candle on Friday 26th Jan 2024 (JAN 2023 -> JAN 2024)
ALL TIME:
BITSTAMP:BTCUSD 80,884% / 133,582% ✅
CRYPTO:ETHUSD 17,231% / 36,146% ✅
CRYPTO:BNBUSD 5,314% / 2,702% ❌
CRYPTO:SOLUSD 1,745% / 1,171% ❌
CRYPTO:XRPUSD 2,585% / 4,544% ✅
CRYPTO:ADAUSD 338% / 353% ✅
CRYPTO:AVAXUSD 130% / 160% ✅
CRYPTO:DOGEUSD 13,690% / 16,432% ✅
CRYPTO:TRXUSD 414% / 466% ✅
CRYPTO:DOTUSD -16% / -7% ✅
CRYPTO:LINKUSD 1,161% / 2,164% ✅
CRYPTO:TONUSD 25% / 47% ✅
CRYPTO:MATICUSD 1,769% / 1,587% ❌
CRYPTO:ICPUSD 70% / 50% ❌
CRYPTO:SHIBUSD -20% / -19% ✅
CRYPTO:LTCUSD 486% / 718% ✅
CRYPTO:BCHUSD -4% / 3% ✅
CRYPTO:LEOUSD 102% / 151% ✅
CRYPTO:ATOMUSD 46% / 91% ✅
CRYPTO:UNIUSD -16% / 1% ✅
CRYPTO:ETCUSD 283% / 414% ✅
CRYPTO:OKBUSD 1,286% / 1,935% ✅
CRYPTO:XLMUSD 1,471% / 1,592% ✅
CRYPTO:INJUSD 830% / 1,035% ✅
CRYPTO:OPUSD 138% / 195% ✅
CRYPTO:NEARUSD 23% / 44% ✅
Backtest result analysis:
Assuming we have an initial investment amount of $10,000 spread evenly across each asset since the creation of each asset, it would have provided the following results.
Standard DCA Strategy results:
Average percent return: 4,998.65%
Profit: $499,865
Closing balance: $509,865
Smart DCA Strategy results:
Average percent return: 7,906.03%
Profit: $790,603
Closing balance: $800,603
JAN 2023 -> JAN 2024:
BITSTAMP:BTCUSD 47% / 66% ✅
CRYPTO:ETHUSD 26% / 33% ✅
CRYPTO:BNBUSD 15% / 17% ✅
CRYPTO:SOLUSD 272% / 394% ✅
CRYPTO:XRPUSD 7% / 12% ✅
CRYPTO:ADAUSD 43% / 59% ✅
CRYPTO:AVAXUSD 116% / 151% ✅
CRYPTO:DOGEUSD 8% / 14% ✅
CRYPTO:TRXUSD 48% / 65% ✅
CRYPTO:DOTUSD 24% / 35% ✅
CRYPTO:LINKUSD 83% / 124% ✅
CRYPTO:TONUSD 7% / 21% ✅
CRYPTO:MATICUSD -3% / 7% ✅
CRYPTO:ICPUSD 161% / 196% ✅
CRYPTO:SHIBUSD 1% / 8% ✅
CRYPTO:LTCUSD -15% / -7% ✅
CRYPTO:BCHUSD 47% / 68% ✅
CRYPTO:LEOUSD 9% / 11% ✅
CRYPTO:ATOMUSD 1% / 15% ✅
CRYPTO:UNIUSD 9% / 23% ✅
CRYPTO:ETCUSD 27% / 40% ✅
CRYPTO:OKBUSD 21% / 30% ✅
CRYPTO:XLMUSD 11% / 19% ✅
CRYPTO:INJUSD 477% / 446% ❌
CRYPTO:OPUSD 77% / 91% ✅
CRYPTO:NEARUSD 78% / 95% ✅
Backtest result analysis:
Assuming we have an initial investment amount of $10,000 spread evenly across each asset for the duration of 2023, it would have provided the following results.
Standard DCA Strategy results:
Average percent return: 61.42%
Profit: $6,142
Closing balance: $16,142
Smart DCA Strategy results:
Average percent return: 78.19%
Profit: $7,819
Closing balance: $17,819

MTF Triple Kagi Indicator v1.0Introduction
The indicator attempts to implement three (3) time-based, multi-timeframe, non-repainting Kagi lines as an overlay to your chart and applying a trend bullish/bearish trend strength evaluation based on the position of the Kagi close prices between the Fast Kagi and Slow Kagi.
How is it original and useful?
This indicator is unique in that it combines a Fast and Slow Kagi timeframes and applies the following trend analysis to determine bullish/bearish strength:
Strong Bullish = when both Fast and Slow Kagi are below the current price and Slow is less than or equal to Fast Kagi.
Moderate Bullish = when both Fast and Slow Kagi are below the current price and Slow is greater than Fast Kagi.
Neutral = when current price is between the Fast and Slow Kagi.
Moderate Bearish = when both Fast and Slow Kagi are above the current price and Slow is less than Fast Kagi.
Strong Bearish = when both Fast and Slow Kagi are above the current price and Slow greater than or equal to Fast Kagi.
In addition, the indicator adds a Trigger Kagi that you can optionally use as a faster Kagi to see more confirmation of trend within the Fast/Slow Kagi combination. It is not used in the bullish/bearish comparison analysis but is simply informative in confirming the trend with a smaller timeframe than the Fast Kagi.
How does it compare to other scripts in the Public Library?
This indicator makes use of the security() function and applies the best-practices as provided by the PineCoders' script called `security()` revisited so that the indicator will not repaint when you refresh the chart or re-open it at a later date. In addition, at the time of initial publishing, this indicator is the only publicly available indicator that combines multiple time-based Kagi lines to offer a simple trend analysis status for short-term or long-term traders.
What does it do and how does it do it?
When applied to the chart for the first time, the default settings will work to produce Kagi lines from the beginning of the chart history up to the real-time bar. All three Kagi lines will default to the current chart's timeframe, therefore it is expected that you open the settings and adjust the Fast and Slow Kagi settings to provide the full effects of the indicator's features. The example chart above is using a 1-Hour chart with a Fast Kagi of 1 day (ATR(6)), a Slow Kagi of 1-Week (ATR(6)) and a Trigger Kagi of 6-Hours (ATR(14)). These settings are not universal for all markets; thus, it will require trial and error adjustments to tune the indicator to the specific market you are evaluating.
Lastly, the example chart above is illustrating how this indicator could be used with the 3Commas DCA Bot Strategy to provide entry and exit signals to simulate a bot's performance using the powerful Strategy Tester within TradingView to further evaluate the indicators influence on hypothetical trading conditions. The indicator provides a plot data point called "Kagi Bullish/Bearish Signal" that can be used in other chart strategies as a signal provider. The following is the meaning of the numeric signal value for this data point:
Strong Bullish = 2
Moderate Bullish = 1
Neutral = 0
Moderate Bearish = -1
Strong Bearish = -2
Enjoy! 😊👍
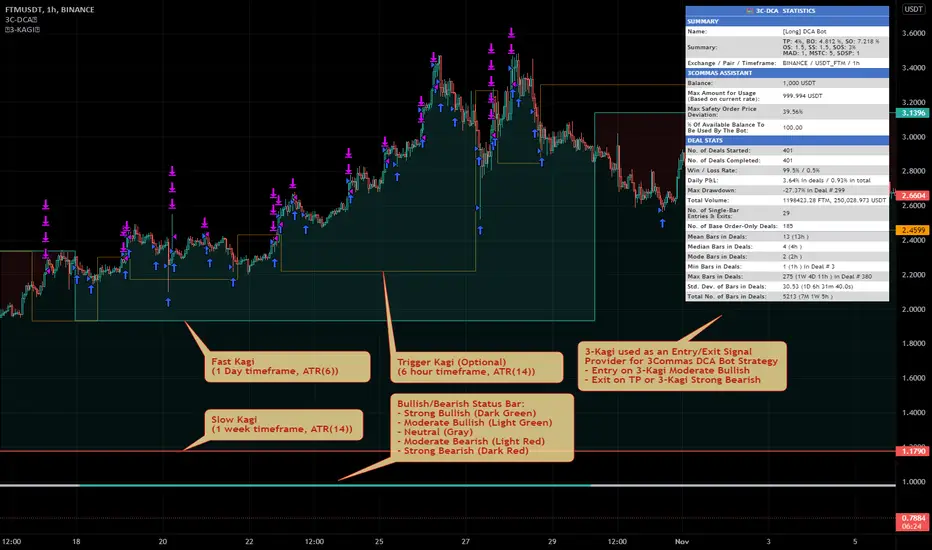
ATR and IV Volatility TableThis is a volatility tool designed to get the daily bottom and top values calculated using a daily ATR and IV values.
ATR values can be calculated directly, however for IV I recommend to take the values from external sources for the asset that you want to trade.
Regarding of the usage, I always recommend to go at the end of the previous close day of the candle(with replay function) or beginning of the daily open candle and get the expected values for movements.
For example for 26April for SPX, we have an ATR of 77 points and the close of the candle was 4296.
So based on ATR for 27 April our TOP is going to be 4296 + 77 , while our BOT is going to be 4296-77
At the same time lets assume the IV for today is going to be around 25% -> this is translated to 25 / (sqrt (252)) = 1.57 aprox
So based on IV our TOP is going to be 4296 + 4296 * 0.0157 , while our BOT is going to be 4296 - 4296 * 0.0157
I found out from my calculations that 80-85% of the times these bot and top points act as an amazing support and resistence points for day trading, so I fully recommend you to start including them into your analysis.
If you have any questions let me know !

High Frequency Day Trading IndicatorMentioned Indicator uses RSI, Stoch RSI, SMA, EMA, SMMA, Double EMA to check for quick buying and selling areas for Day Trading.
For utilizing the tool, you'll need to wait for a Possible Trend Reversal (Represented by Triangle) and a confirmation to go Long by using a combination of Moving Averages which are then represented by circular dots on chart upon Bar Closure.
For Stop Loss once can simply place a Stop below/above the last Low/High respectively.
This trading Indicator is only recommended for high frequency trading on smaller time frames if you're using a highly volatile Coin/Asset Class.
Disclaimer: Please use this indicator in Test Environment to get a hold of concepts of this indicator. We do not advise using 100% capital for each order, as a matter of fact, we only recommend a risk of upto 1% on each position so Risk to Reward is maintained in proper sense. Please use Stops with all indicators and do not ever use an indicator without stop losses to save your capital.
NOTE: Indicator can be developed further to be used Trading Bots such as 3commas, Autoview, Wunderbit Bot, and Trailing Crypto Bots. For configuration of Automation Bots, you can contact us here on tradingview itself! :)