Smart Bottom SignalThis indicator is used to find temporary bottoms that are validated with a subsequent candle that closes above the high. The indicator is based on elliott wave theory and tries to signal entries on wave lows. It triggers off of code from " TD D-Wave" 0, 2, 4, A, and C bull wave lows by finding a candle with a close higher that the high of the lowest wave candle or the high of a bullish candle that first breaks above the 8EMA. Green arrows will plot on close indicating that the indicator was triggered.
There are 3 options for display of plots provided:
ShowSmartSigs - This is defaulted to true (display) and allows users to toggle the green arrow alert plots on/off that appear below the candle when triggered.
ShowOnOffPlots - This is logic I use to signal a downturn/upturn and is indicated by red/green arrows appearing above the trigger candle.
ShowBounceSigs - This is defaulted to false and would show as an orange arrow under a candle where a bullish candle first climbs above the 8EMA when ShowOnOffPlots is signaling a downturn and SlowtSochastics is below 21. The SlowStochastics settings are adjustable on the settings screen and default to 21,3.
Alerts Available:
"Smart Buy Bounce" - This alert fires when the ShowSmartSigs signal is triggered.
"Buy Bounce" - This alert fires when the ShowBounceSigs signal is triggered.
"Turn Off Bots"/"Turn On Bots" - This alert fires when the ShowOnOffPlots signals are triggered. I use this to turn off shorter timeframe (15m-1H) bots during a prolonged price drop.
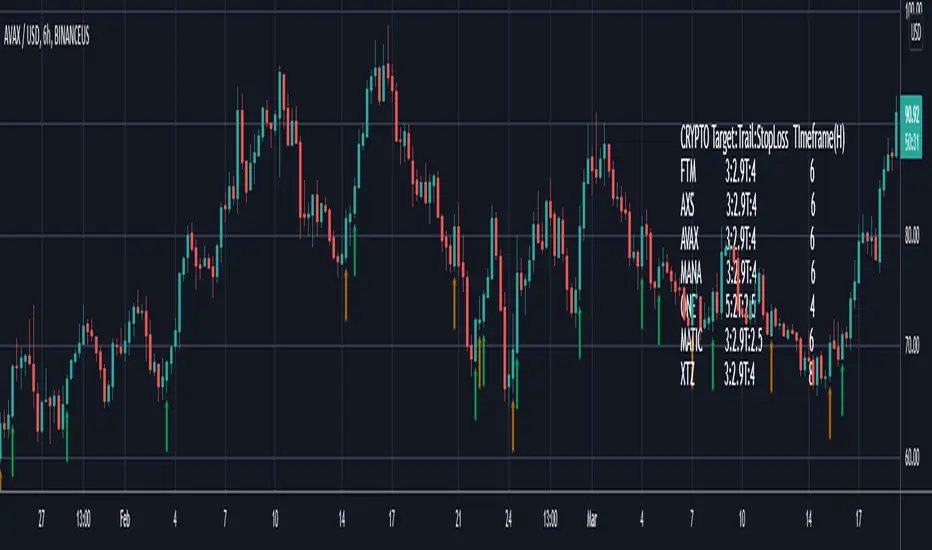
This is an early prototype that is filtered to the following tested cryptos against the specified chart timeframes and using the expressed target/trail/stoploss logic.
CRYPTO Target:Trail:StopLoss TImeframe(H)
FTM 3:2.9T:4 6
AXS 3:2.9T:4 6
AVAX 3:2.9T:4 6
MANA 3:2.9T:4 6
ONE 5:2T:2.5 4
MATIC 3:2.9T:2.5 6
XTZ 3:2.9T:4 8
Search in scripts for "bot"
TrendsThe Trends indicator is created for trend trading and (Bitsgap) crypto bots of crypto assets over longer time periods.
Works best for 4h, Daily and Weekly candles (even Monthly), but unsuitable for hourly candles and day trading.
This indicator shows you if a crypto pair is in a Bear, Bull or Sideways market.
The idea is to simplify decision making when to sell or buy, or what pairs to use with trading bots.
Stick to the rule of not having bots in a Bear trend!
- Blue = Bull trend
- Red = Bear trend
- Green = Sideways trend - which can be profitable with trading bots

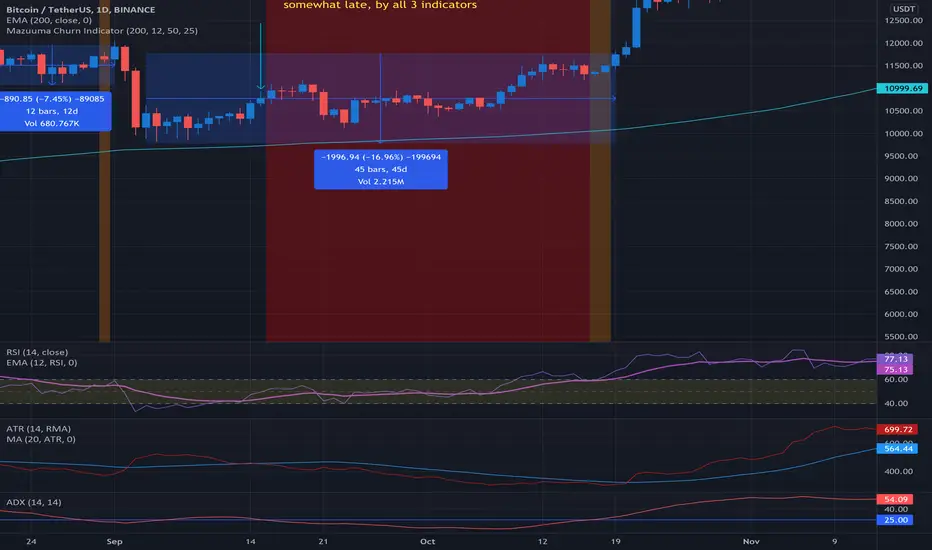
Mazuuma Churn IndicatorThis indicator was specifically made to confirm a periode of sideways movement (churn) on Bitcoin. It can probably be used for other cryptocurrencies as well. I use it on the daily timeframe.
Yellow means "Unconfirmed".
Orange means "Partially Confirmed".
Red means "Confirmed"
The indicator is not perfect, so use your common sense.
Churn starts when at least 2 of the conditions below are met (use also your common sense):
1. ATR < MA 20 on ATR
2. Distance to EMA 200 must be ≤ 16% at “Open churn”
3. EMA 12 on RSI between 40 and 60
4. ADX < 25
The above are weighted. Meaning no 1 has most significance. The numbers can be tweaked.
Reversal coming
* The indicators above break out, especially the ATR
* Color shift of the Heikin Ashi candle on weekly timeframe
* Engulfing candle on weekly timeframe
Because of the offset of the EMA 200, the precision of the Churn predictor can be off after a VERY big spike up or down, e.g. dec 2017. After such a spike use your common sense.
Personally I use this for bot trading, i.e. turn off trend following bots when in sideways market and use grid bots or other means of trading instead.
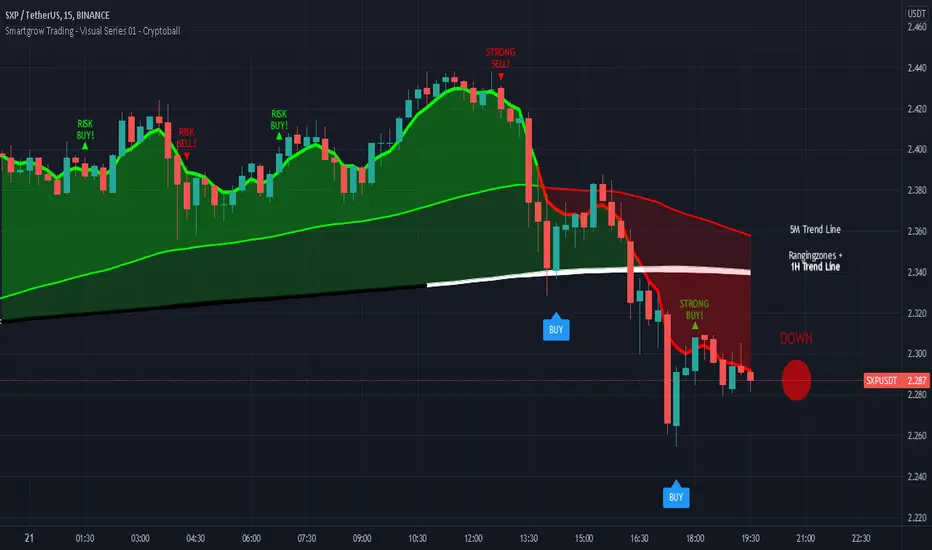
Smartgrow Trading - Visual Series - CryptoballWelcome to our Tradingview buy signal indicator with visual support.
We develop signals which have been specially developed for crypto trading bots. We will publish new indicators at regular intervals.
At the moment our all-in-one indicator includes the following indicators:
- "Crypto Bot Signal 01 - Optimized RSI Momentum"
- "Trading Bot Buy Signal 02 - MTF Stochastic"
- "Trading Bot Buy Signal 03 - MTF StochRSI"
- "Smartgrow Trading - Bearish Power Signals"
The basic idea of this all-in-one indicator is to decrease the needed number of alarms and to provide an all-in-one script for our users trading long direction only. We only include indicators which are relatively robust against false breakouts, even if these can of course never be avoided. These signals alone occur relatively rare, but you can set an alarm up on different pairs simultaneously. The strategy can only be used in 5 min chart and in crypto pairs. It wasnt tested in Forex etc. but feel free to test it.
The main idea behind the signals is to identify strong oversold areas as these have great potential to move in the other direction again. To determine this, we use custom oversold indicators to create buy signals. You could automate these buy signals but we suggest to use these instructions instead:
If an alarm is triggered it is showing points with a strong reversal chance for long signals. We recommend watching the chart closely and finding a good entry point. For visual support, we have visualized the basic trend in color on the one hand. If the 5 minute trend line is above the 1 hour trend line , then there is an upward trend which is marked with a corresponding note. If the 5 minute trend line is below the 1 hour trendline, then there is a downward trend. If you only want to look at the trend line of the 5 minute chart, deactivate the 1 hour trendline in the settings. When the 5 period Exponential Moving Average is higher then the 90 period Exponential Moving Average then the area between them is colored in green, otherwise in red. The same is the case when the 5 period Exponential Moving Average is higher then the 1 hour trendline.
As a second visual support, we have marked volatile zones in the market with the colors black and white. The color black generally denotes a market with low volatility and entry into these areas is therefore not recommended or involves risks. To show potential entry points based on market momentum we added note signs showing either buy or sell spots based on crossovers. If a crossover is within an area of low volatility we marked it as risk buy. if a crossover is within an area of higher volatility we marked it as a strong buy.
To find a good point to exit a trade we added also note signs showing possible sell spots. When these occure an crossover in momentum has allready occured and a potential trend reserval may occur. You could also use this indicator in combination with oversold indicators like RSI or Stochastic to see potential reversal spots when a market is oversold. As a last helper we implemented the Cryptoball on the right side of the chart to vizualize the currently price movement. Therefore it is looking only a few candles back to show you the smoothed price direction. When the color of the indicator is switching from green to red it is a sign that a smaller price drop may occure amd indicates a possible sell.
We sell this indicator so it is invite only. But of cause you can test the single indicators before buying.
If there are questions, write them into the comments or contact us directly over the direct message. Happy Trading!
[ADOL_]ARVIS 4 Whale
ENG) The fourth version of ARVIS BOT This is an upgraded version of ARVIS 4. ARVIS4 🐳(Whale)
- Lighten ARVIS 4 The ARVIS 4 is a bit heavy to compensate for the slow loading, and combines the standards of the new TD .
- By upgrading the coastline, the trend-following notation was changed to be legible, and the signal generation was processed as a background to make it simple.
- Sales statistics output has been added. It enters at the average of the opening and closing prices, and closes at the closing price. As it is liquidated at the closing price, when the bot is driven
It is possible to prevent the situation from entering the section where the signal appears and disappears.
principle)
Features of the new core logic:
- You can set an alert for the TD indicator that could not be set before. TD indicators are numbered 1-9 in Settings - Appearance.
- Setup: Numbers floating above (below) the candle, in ascending and descending order (=sequence) from 1 to 9. Compare with previous candles.
That principle is the part of reasoning that no one explains. I think regularity reflects the theory of the Fibonacci sequence.
The Fibonacci sequence is a number in the golden ratio that makes up nature.
option)
- The indicator plotting range indicates the range in which to display the indicator.
- Setting is for shoreline and breakwater, and is set to the optimum value. It can be used as a basis for support/resistance by breaking through shorelines and breakwaters.
- In Big Trend, the trend judgment standard and trend length are displayed. The trend judgment criteria and trend length based on ICHIMOKU determine the uptrend and the downtrend long.
"You can see the guide by hovering the mouse over ⓘ in the indicator."
- Volume above the average trading volume determines the power of the candle.
- Mark the flow of the stochastic on the candle. Added more filtering of the moving average by augmenting the existing one.
SMA , EMA , HMA , RMA , WMA , VWMA can be selected from the options.
- Added ARVIS 3 version of HTF signal. It is displayed with a light green and red background.
- Real long and real short are key signals. It is displayed on a dark green and red background.
- Fixed an error and signal location where the swing-based heart shot and heart long did not appear at the intersection.
- Super Swing has been added. SS is indicated along the trend direction by the square ( ■ ) at the top.
Principle of core function (Example of picture explanation)
time frame)
- Available in all timeframes.
alarm)
- You can set up alerts for setup, down long, up short, real long, real short, and heart.
trading method)
- Follow the signals Real Long🥝 Short🍅 , Heart Long💚 Short❤ It depends on the color of the background.
- After entering L and S, 9🎯 can be used as a split blade position.
- Follow the downtrend📈🛐 uphill short📉🛐 as the trend criterion. You can change the settings.
- When you select theme 1 in SC , you can use it like Heikin Ashi, and when you select theme 3, you can find overbought and oversold.
reference)
You are solely responsible for all trading decisions and investments you make.
How to use)
It is set to be available only to invited users. When invited, tap Add Indicator to Favorites at the bottom of the indicator.
If you click the indicator at the top of the chart screen and look at the left tab, there is a Favorites tab. Add an indicator by clicking the indicator name in the Favorites tab.
----------------------------------------------------------------------------------------------------------------------------------------------------------------------------------------------------------------
KOR) ARVIS BOT의 네번째 버전 ARVIS 4의 업그레이드 버전입니다. ARVIS4 🐳(Whale)
- ARVIS 4를 경량화합니다. ARVIS 4가 다소 무거워 로딩이 느려지는 부분을 보완하고, 새로운 TD의 기준을 결합합니다.
- 해안선을 업그레이드 하여 추세를 따르는 표기를 가독성 있게 변경하고, 시그널 발생을 배경으로 처리하여 심플하게 구성하였습니다.
- 매매통계 출력이 추가되었습니다. 시가와 종가의 평균으로 진입하며, 종가로 청산합니다. 종가로 청산하므로, 봇구동시
신호가 떴다가 사라지는 구간에 진입이 되버리는 사태를 방지할 수 있게 됩니다.
원리)
새로운 핵심적인 로직의 기능 :
- 기존에 설정할 수 없었던, TD지표의 얼러트를 설정할 수 있습니다. TD 지표는 설정 - 모습에서 1~9까지의 숫자로 나타납니다.
- 셋업 : 캔들위(아래)에 플로팅 되는 숫자로 1~9까지의 오름차순, 내림차순 (=시퀀스)으로 구성됩니다. 4개이전의 캔들과 비교합니다.
해당 원리는 아무도 설명해주지 않는 추론의 부분입니다. 규칙성에는 피보나치 수열의 이론이 반영되어 있다고 봅니다.
피보나치 수열이란 자연을 이루는 황금비율의 숫자로 1.1.2.3.5.8.13.21.34.55.89... n번째와 n+1번째 숫자의 합이 n+2번째가 됩니다.
옵션)
- 지표 플로팅 범위는 지표를 표시할 범위를 나타냅니다.
- Setting은 해안선과 방파제에 관한 설정이며, 최적값으로 설정되어 있습니다. 해안선과 방파제를 돌파, 지지/저항의 기준으로 활용가능합니다.
- Big Trend에서는 추세판단 기준과 추세길이가 표시됩니다. ICHIMOKU기반으로 만들어진 추세판단 기준과 추세길이는 오름숏과 내림롱을 결정합니다.
"지표내 ⓘ 위에 마우스를 올리면 안내를 볼 수 있습니다."
- 거래량 평균이상의 Volume을 캔들의 힘을 가려냅니다.
- 스토캐스틱의 흐름을 캔들에 표기합니다. 기존의 것을 보강하여 더 많은 이평선의 필터링을 추가하였습니다.
SMA , EMA , HMA , RMA, WMA , VWMA 를 옵션에서 선택가능합니다.
- ARVIS 3 버전의 HTF 시그널을 추가하였습니다. 옅은 초록색과 빨간색 배경으로 표시됩니다.
- 리얼 롱, 리얼숏은 핵심적인 시그널이 됩니다. 진한 초록색과 빨간색 배경으로 표시됩니다.
- 스윙 기준의 하트숏과 하트롱이 교차로 출현하지 못하는 오류와 신호 위치를 수정하였습니다.
- Super Swing이 추가되었습니다. SS는 상단의 스퀘어( ■ ) 로 추세 방향에 따라 표시됩니다.
핵심기능의 원리 그림 설명 예시)
타임프레임)
- 모든 시간프레임에서 사용가능합니다.
알람)
- 셋업과 내림롱, 오름숏, 리얼롱, 리얼숏, Heart 에 얼러트를 설정할 수 있습니다.
매매방법)
- Real Long🥝 Short🍅 , Heart Long💚 Short❤ 신호를 따르십시오. 배경의 색상에 따릅니다.
- L, S에 진입후 9🎯 을 분할 익절 자리로 활용할 수 있습니다.
- 내림롱📈🛐 오름숏📉🛐 을 추세 기준으로 따르십시오. 설정값을 변경할 수 있습니다.
- SC에서 테마1을 선택시 하이킨 아시 처럼 사용가능하며, 테마3을 선택시 과매수, 과매도를 찾을 수 있습니다.
참고)
귀하가 내리는 모든 거래 결정과 투자에 관한 것은 전적으로 귀하의 책임입니다.
사용방법)
초대된 사용자만 사용할 수 있도록 설정이 되어있습니다. 초대를 받을 경우, 지표 하단의 즐겨찾기에 인디케이터 넣기를 누릅니다.
차트화면 상단에 지표를 눌러서 왼쪽탭에 보면 즐겨찾기 탭이 있습니다. 즐겨찾기 탭에서 지표이름을 눌러서 지표를 추가합니다.

Multi VWAPMulti VWAP indicator for Wick Hunter
For when you are running out of indicator slots
Can configure each set for Setting 1/2/3, or for Binance bot 1/Binance bot 2/Bybit bot, etc.
By honeybadger, built on original code by STP Todd (see indicator "Wick Hunter VWAP")

Theft Indicator - BUY/SELL AlertsWhat is our indicator?
Theft Indicator - Buy & Sell Alert System is our first published script that shows price action on a certain period of time (We Use ATR indicator). We take pride in enabling trading to become easier for the experienced and the non-experienced traders around the globe. Buy & Sell alerts will be fired once a conditions in our algo is met.
Does it Repaint?
Our indicator does NOT re-paint. Although while setting an alert it may pop up the repaint alert, please take into consideration that once a signal is fired on a "CLOSED BAR", our signal will never disappear, they do not repaint.
What Markets is it usable with?
You can use it in any market, Forex, Stocks, Crypto, Indices. We recommend high time frames but you can also use it on the 1 minute chart if you are a scalper and a risk taker. All time frames are profitable, not all trades. But the Majority is profitable. We will soon add a backtest strategy for it, there is no ETA on it tho.
How to use:
Simple plug and play it to your chart, in addition to a few other indicators we will recommend to you (we still have not published them yet), and this will confirm your trades. You can also connect TV alerts with a bot and let it run. Please be aware that SLIPPAGE time is important, If you run a bot on this indicator you HAVE to know that the buy/sell price will be on the bar AFTER the Candle close (For example: the BUY/SELL alert is on a candle, the buy/sell your bot or you will execute WILL be in the following candle depending on your trading system. Theft Indicator - Buy/Sell Alerts work best with higher time frames, however it works on smaller time frames, we recommend 15 mins, 30 mins, 1hr, 4hr. It just depends on your trading style. Please contact us if you do not understand how to use it.
How are the Buy/Sell Alerts fired?
We use the simple ATR (Average True Range) indicator. However we have modified the indicator to fit our trading system. Check below for a definition of what ATR is:
What is Average True Range - ATR?
The average true range (ATR) is a technical analysis indicator that measures market volatility by decomposing the entire range of an asset price for that period. Specifically, ATR is a measure of volatility introduced by market technician J. Welles Wilder Jr. The true range indicator is taken as the greatest of the following: current high less the current low; the absolute value of the current high less the previous close; and the absolute value of the current low less the previous close. The average true range is then a moving average, generally using 14 days, of the true ranges.
Why is our indicator special and different from the normal ATR indicators?
We have modified the mathematical equation and changed it slightly to give more accurate signals, we do not promise all trades are profitable, the use of this indicator is up to your own judgement and liability. We believe that we have an indicator like no other ATR because of our algo that is different from the normal ATR calculation.
P.S: This is not financial advice, we are just sharing our indicator that we know has good results, and it will take time for people in -ve profiles to recover losses and for the profiting to be more profitable.
You can contact me for more information about the indicator, Goodluck :)

DayTrade - XBTUSD 5m [ALERTSETUP]Plug & Play indicator for BITMEX:XBTUSD in 5 minute timeframe for Manual or Automated Day Trading.
Built upon Cyatophilum Scalping Bot
Backtest below show results over 2 weeks, calculated with a 0.075 % commission fee and using 100% of equity on each trade from 10 000$ inital capital.
> Get access to the Cyatophilum Indicators <
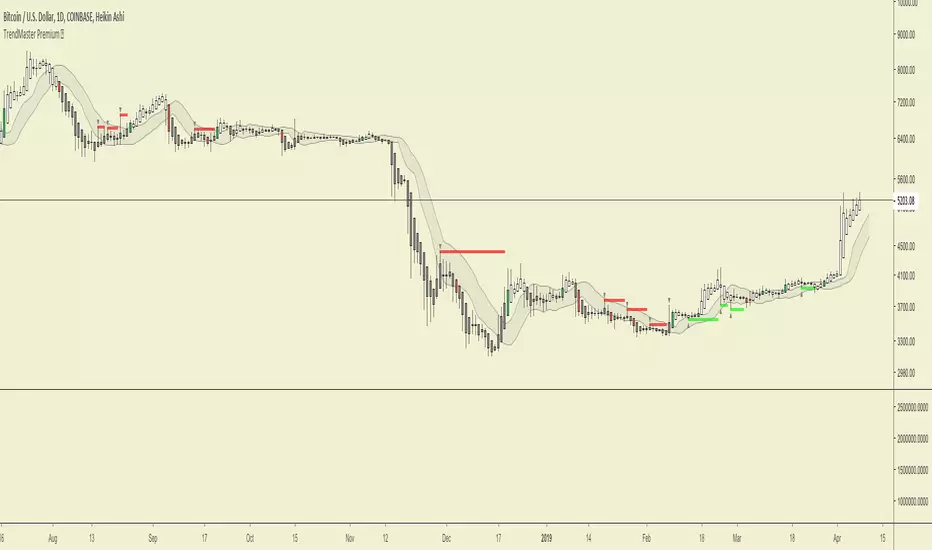
Trends in Black and White'Trends in Black and White' is now rolling out to all of our Pro Community members
What is it for? This is a simple visual indicator designed to help users identify long or short bias. It does not provide direct entries and exits but can be used effectively in combination with Trendmaster Premium and other technical analysis methods.
How do i get access?
This indicator is available as a free extra to all of our Pro community members only.
All of our packages are listed below.
- Premium - $50 - This gives you access to the TrendMaster Premium TradingView indicator (www.tradingview.com), the TrendMaster Premium Binance signal bots and the Premium Discord channels.
- Premium+ - $75 or $25 for existing Premium users - All the benefits of the Premium package, but with added signal bots for Bittrex, Bitfinex and Kucoin exchanges.
- Pro - $100 or $50 for existing Premium users/$25 for existing Premium+ users -Access to 'Trendmaster Premium' and 'Trends in Black and White' indicators. All the benefits of the Premium+ package, but with added signal bots for D1 and H4 Ichimoku TK cross and Ichimoku cloud breakout for Binance.
The mandatory Legal bit:
@IchimokuScholar and @Crypto_C00kie wish you the best of luck in achieving your trading goals. Please apply appropriate risk management.
Any form of trading has large potential rewards but also large potential risks. The Purchaser must be aware of those risks and be willing to accept them. Don't trade with money that you, the Purchaser cannot afford to lose. No representation is being made that you are guaranteed positive results. The past performance of any trading methodology is not necessarily indicative of future results. Trading involves high risks. @TrendmasterTM, @IchimokuScholar or @Crypto_C00kie are NOT responsible for any trades that you, the Purchaser take. All trades taken are entirely at the Purchasers own risk. Refunds are neither offered nor implied.

TrendMaster Premium ©Trendmaster Premium©
We are proud to release the final version of Trendmaster Premium©. This indicator is the result of months of development between @TrendmasterTM and @Crypto_C00kie.
Trendmaster Premium© is a Trend following system that provide entries, exits and stop loss placement. It is extremely simple to follow and we have experienced outstanding results.
When purchasing Trendmaster Premium© you will receive access to the indicator suite and access to our private members discord group.
Discord: The discord channel is a place where traders can discuss ideas and share content.
It includes
Bots – The discord channel currently has two bots that constantly scan Binance for signals. They will alert you by notification of any BTC pair that has printed a signal candle. Currently the bots report D1 and H4 signals as these are the time frames the indicator is designed for. These are designed to alert you to possible trades and should NOT be blindly traded from.
Chat – Several chat servers offering educational resources, guidance on how to use the indicator and chart/idea sharing.
The mandatory Legal bit:
@IchimokuScholar and @Crypto_C00kie wish you the best of luck in achieving your trading goals. Please apply appropriate risk management.
Any form of trading has large potential rewards but also large potential risks. The Purchaser must be aware of those risks and be willing to accept them. Don't trade with money that you, the Purchaser cannot afford to lose. No representation is being made that you are guaranteed positive results. The past performance of any trading methodology is not necessarily indicative of future results. Trading involves high risks. Neither @TrendmasterTM or @Crypto_C00kie are responsible for any trades that you, the Purchaser take. All trades taken are entirely at the Purchasers own risk. Refunds are neither offered nor implied.
Study_v8- Used with Autoview… Longs / Margin TradingInvite only…
FREE Access until my bot is built (Target Date…. May 2018).
Only allowing 20 people to use.
Cost will be 10% of any profits made. Minimum account balance being traded must be $1,000.
After my bot is built, this script will ONLY be used with my bot and all access on here (Trading View) will be removed after the final sell trigger is completed!
****Can be used for just Longs.. or for Margin Trading.****
For Longs only.. Settings and Alert condition examples found here:
drive.google.com
For Margin trading... Settings and Alert condition examples found here:
drive.google.com

Quicksilver Institutional Trend [1H] The "God Candle" Catcher Most retail traders fail because they lack institutional tooling.
The Quicksilver Institutional Trend is designed to keep you in the trade during massive expansion moves and keep you out during the chop. It replaces "guessing" with a structured, math-based Trend Cloud.
THE LOGIC (Institutional Engine):
Visual Trend Cloud: A dynamic ribbon that identifies the dominant 1H market regime.
Momentum Filter (ADX): The bars change color based on Trend Strength.
Bright Green/Red: High Momentum (Institutional Volume). Stay in the trade.
Dark Green/Red: Low Momentum. Prepare to exit.
Liquidity Zones: Automatically draws Support & Resistance lines at recent institutional pivot points.
👨💻 NEED A CUSTOM BOT?
Stop trading manually. We can convert YOUR specific strategy into an automated algorithm.
Quicksilver Algo Systems specializes in building custom solutions for:
TradeLocker Studio (Python)
TradingView (Pine Script)
cTrader (C#)
MetaTrader 4/5 (MQL)
We don't just sell indicators; we engineer automated execution systems tailored to your exact risk parameters.
🚀 HOW TO HIRE US:
If you have a strategy you want automated, we are currently accepting new custom development projects.
Contact the Lead Developer directly:
📧 Email: quicksilveralgo@gmail.com
(Include "Custom Bot Request" in the subject line for priority review).
🔥 UNLOCK THE NEXT INDICATOR:
We are releasing our "Sniper Scalper" logic next week.
Hit the BOOST (Rocket) Button 🚀 above.
Click FOLLOW on our profile.
Comment "QAS" below if you want to be notified.
Disclaimer: Trading involves substantial risk. Educational purposes only.

JFX Smart ORBJFX Smart ORB is a complete visual trading framework built around the classic
Opening Range Breakout (ORB) concept, enhanced with:
Fixed position sizing (lots)
Automatic Martingale-style size increase after full SL only
A full, event-based alert system for entries, targets, stops, and break-even exits
All of that, plus a clean dual-language HUD (AR/EN) directly on your chart.
What JFX Smart ORB Does
🔹 Smart Opening Range (ORB)
Automatically defines the opening range via:
Fixed timeframe (e.g., 30 minutes), or
Custom session window (e.g., 09:30–09:45) with configurable time zone (UTC-5, etc.).
Plots ORH / ORL and the midline, and shades the OR building zone for visual clarity.
🔹 Regime Detection (Context)
Background shading tells you where price is trading:
📈 Green: Above ORH (bullish regime)
📉 Red: Below ORL (bearish regime)
🔵 Neutral: Inside the OR range
This gives you an instant read on context before you even think about entries.
🔹 Trade Logic & Multi-Target Management
Automatic entry when:
Price breaks ORH for long trades
Price breaks ORL for short trades
Stop loss on the opposite side of the range.
Targets calculated in R-multiples:
TP1 = 0.5R
TP2 = 1R
TP3 = 2R
Position is split across TP1 / TP2 / TP3 according to user-defined percentages, normalized automatically.
💰 Fixed Size + Martingale After Loss Only
Inputs:
Capital ($) – for display/analysis
Base Position Size (lots) – your standard trade size
Contract per 1.00 lot – to convert price movement to P/L in dollars
If a trade hits a full stop loss before TP1, the indicator:
Doubles the position size for the next trade (Martingale factor).
If the trade hits any profit (TP1, TP2, TP3) or closes at Break-Even, the:
Martingale factor resets back to 1× (base size).
Everything is tracked and shown on the chart: current trade size, P/L per trade, and net P/L.
🧠 Session Protection & Inner-Range Logic
Optional session block:
After a strong winning trade (e.g., TP2 or TP3), you can block any further trades for the rest of the ORB session to avoid overtrading.
Inner-range logic after TP1:
Prevents immediate re-entry in the same direction after a BE exit from TP1.
Waits for price to return into a defined inner range around the OR midline, filtering out random noise.
📊 On-Chart HUD / Stats (AR & EN)
The built-in info panel shows in real time:
Session status:
✅ Trading enabled
🚫 Trading disabled until a new ORB
⏳ Waiting for two bars back inside the range
Current price regime (Above ORH / Below ORL / Inside OR).
Entry price, stop loss, TP1, TP2.
Total trades, losing trades, and win rate.
Counts of TP1 / TP2 / TP3 hits.
Reported capital, current position size (lots).
Current trade P/L and total net P/L in dollars.
🔔 Full Alert System (Ready for Webhooks/Bots)
The indicator generates per-bar event flags that feed into alertcondition() so you can build any alert setup you want (pop-up, email, SMS, webhook, bot, EA, etc.).
Available alerts:
Buy Entry: JFX_ORB_BUY_ENTRY
Sell Entry: JFX_ORB_SELL_ENTRY
Stop Loss Hit: JFX_ORB_SL_HIT
TP1 Hit: JFX_ORB_TP1
TP2 Hit: JFX_ORB_TP2
TP3 Hit: JFX_ORB_TP3
Break-Even Exit: JFX_ORB_BE_EXIT
Simply create alerts in TradingView based on these conditions and messages, or plug them into your automation via webhooks.
Who Is JFX Smart ORB For?
Day traders and scalpers who like structured ORB strategies instead of random entries.
Traders who want clear, rule-based entries, well-defined stops and multi-target exits.
Anyone looking to combine ORB + position management + Martingale logic + Alerts in a single, professional tool.
Disclaimer:
This indicator is a professional analysis and trade-management tool, not a guarantee of profit.
Always test on demo first and adapt the position sizing and Martingale behavior to your own risk management and trading plan.

HMS FVG Precision Engine⭐ HMS FVG Precision Engine — Official Description (Short & Professional)
HMS FVG Precision Engine is an advanced Fair Value Gap–based smart entry system designed for high-precision trading.
It automatically detects clean FVG zones, confirms them using multi-timeframe trend filters, and generates accurate LONG/SHORT signals with real-time alerts.
This tool is optimized for both manual and automated trading, including webhook-based bot execution.
It focuses on precision entries, multi-level trend validation, and clean chart visualization to help traders find high-probability setups without noise.
Key Features:
Smart FVG detection with precision filters
Multi-TF trend confirmation (5m–1H)
Automatic LONG & SHORT entry signals
TP1 / TP2 / TP3 and SL logic with alert support
Webhook-friendly alert format for bots
Lightweight, fast, and non-repainting
Clean, optimized visual markers
Perfect for scalping, day trading, and algorithmic entries.

ADX Breakout Enhanced Signal🥋 Trading Dojo – ADX Breakout Enhanced Signal
This indicator combines the trend-strength power of the ADX with dynamic breakout-based signals, designed for traders who want more frequent and higher-probability entries on timeframes like 1 hour.
The core logic focuses on:
📌 1. Trend Strength Detection with ADX
The indicator evaluates whether the market is showing a strong directional trend using an optimized ADX.
When ADX rises above the configured threshold, the system interprets that price has enough momentum to validate an entry.
📌 2. Breakout Entry Logic
It identifies points where price breaks recent highs or lows, confirming the start or continuation of movement.
This breakout-based approach produces more entries than traditional ADX strategies alone.
📌 3. Clear and Simple Signals
🟩 Long when price breaks a recent high with strong trend confirmation.
🟥 Short when price breaks a recent low with strong trend confirmation.
📌 4. Built-In Automated Alerts
The indicator automatically generates JSON alerts ready for use with automation tools such as trading bots, webhooks, BingX, 3Commas, Discord bots, and more.
🎯 Purpose of the Indicator
To provide more frequent, well-distributed, and momentum-validated entries, while maintaining simplicity and speed — perfect for real-time decision-making.
Perfect For:
Intraday trading
1h, 30m, and 15m timeframes
Breakout-based strategies
Automated trading systems

ICT Smart Money Trading Suite PRO [SwissAlgo]ICT SMC Trading Suite Pro
Structure Detection. Imbalance Tracking. Trade Planning. Contextual Alerts.
Why This Integrated System Was Built
The ICT/SMC methodology requires tracking multiple analytical components simultaneously - a process prone to manual errors, time inefficiency, and visual clutter . This indicator consolidates these elements into a single, unified system , providing rules-based validation for experienced ICT traders who may struggle with execution speed, consistency, and manual calculations.
-----------------------------------------------------------------
What This Indicator Does
ICT/SMC methodology involves tracking multiple analytical components simultaneously. This indicator consolidates them into a single system.
Common challenges when applying ICT manually:
1️⃣ Structure Identification
Determining which pivots qualify as external (macro) structure versus internal (micro) structure requires consistent rules. Inconsistent structure identification affects the detection of the relevant trading range for entries , Change of Character (ChoCH) , and Break of Structure (BoS) . Accurate structure identification is paramount ; a faulty reading invalidates the entire ICT thesis for the current swing. While no automated system can replace human judgment, the indicator provides you with a rules-based starting point for structural analysis. The key goal is to help you find and map the relevant structural leg to focus on.
2️⃣ Chart Organization
Drawing Fibonacci retracements, Fair Value Gaps, Order Blocks, and other imbalances manually creates visual complexity that can obscure the analysis. The indicator addresses this by striving to show all imbalances in a consistent, unified, and understandable visual way , using color coding and z-order layering to maintain clarity even when multiple components are active.
3️⃣ Imbalance Tracking
ICT methodology requires monitoring a vast array of institutional footprints : Fair Value Gaps (FVG), Order Blocks (OB), Breaker Blocks (BB), Liquidity Pools (LP), Volume Imbalances, Wick Imbalances, and Kill Zone ranges. Tracking all these simultaneously and manually monitoring their mitigation status is highly time-intensive and prone to oversight . The indicator constantly scans and tracks all key imbalance types for you, automatically updating their status and creating a dynamic, real-time visual heatmap of unmitigated institutional inefficiency.
4️⃣ Trade Calculation
Determining structure-based Stop Loss (SL) placement, calculating multiple Take Profit (TP) levels with accurate position-sizing splits, and computing the final blended Risk-to-Reward (R:R) ratio involves multiple time-sensitive, manual calculations per setup . The indicator automates this entire trade calculation process for you, instantly providing the necessary pricing (entry, SL, TP), sizing, and performance projections, and mitigating the risk of execution error .
5️⃣ Condition Monitoring
ICT setups often require specific technical conditions to align: price reaching discount Fibonacci levels (0.618-0.882 for shorts, 0.118-0.382 for longs), EMA crossovers confirming momentum, or structural shifts (ChoCH/BoS). Identifying these moments requires continuous chart observation across multiple assets and timeframes.
This indicator includes an alert system that monitors these technical conditions and sends notifications when they occur (real-time). The alert system is designed to minimize spam. This allows traders to review potential setups on demand rather than through continuous observation - particularly relevant for those monitoring multiple instruments or trading sessions outside their local timezone.
-----------------------------------------------------------------
Intended Use
This indicator is designed for traders who:
♦ Apply ICT/SMC methodology - Familiarity with concepts such as Fair Value Gaps, Order Blocks, Liquidity Pools, market structure, and discount/premium zones is assumed. The indicator does not teach these concepts but provides tools to apply them.
♦ Trade on intraday to swing timeframes - The structure detection and Fibonacci zone mapping work across multiple timeframes. Recommended primary timeframe: 1H (adjustable based on trading approach).
♦ Prefer systematic entry planning - The trade calculation feature computes stop loss, take profit levels, and risk-to-reward ratios based on structure and Fibonacci positioning. Suitable for traders who use defined entry criteria.
♦ Monitor multiple instruments or sessions - The alert functionality notifies when specific technical conditions occur (discount zone entries, EMA crossovers, structure changes), reducing the need for continuous manual monitoring.
♦ Use trade execution platforms - The trade summary table displays pre-formatted values (entry, SL, TP levels with quantity splits) that can be manually input into trading platforms or bot services like 3Commas.
-----------------------------------------------------------------
How To Use
Step 1: Structure Analysis
The indicator automatically detects external and internal market structure using pivot analysis. Structure lines are color-coded: red for bearish structure, green for bullish. External pivots are marked with larger triangles, internal pivots with smaller markers. The pivot length parameters (default: 20/20) can be adjusted in settings to align with your structural analysis approach and the asset you are analyzing.
Step 2: Define Your Trading Zone
Use the "Start Swing" and "End Swing" date inputs to mark the beginning and end of the (external) structural leg you wish to analyze. The indicator calculates Fibonacci retracement levels based on these points and color-codes the zones:
* Green zones: Discount area (0.618-0.882 for bearish / 0.118-0.382 for bullish)
* Yellow zones: Premium area (0.786-1.0 for bearish / 0.0-0.214 for bullish)
* Red zones: Extension area beyond structure (potential fake-out zones)
Step 3: Review Imbalances
The indicator identifies and displays multiple imbalance types:
🔥 Volume imbalances (from displacement candles based on PVSRA methodology)
🔥 Fair Value Gaps (FVG)
🔥 Order Blocks (OB) and Breaker Blocks (BB)
🔥 Liquidity Pools (LP) at equal highs/lows
🔥 Wick imbalances (exceptional wick formations)
🔥 Kill Zone liquidity from specific trading sessions (Asian, London, NY AM)
Volume Imbalances
Fair Value Gaps
Order Blocks
Liquidity Pools
Wick Imbalances
Kill Zone Imbalances
According to ICT methodology, imbalances act as price magnets - areas where price tends to return for mitigation. When multiple imbalances overlap at the same price level, this creates a confluence zone with a higher probability of price reaction .
Imbalances are displayed as gray boxes , creating a visual heatmap of institutional inefficiencies. When imbalances overlap, the zones appear darker due to layering, and labels combine to show confluence (e.g., "FVG + OB" or "Vol + LP").
Heatmap of Imbalances
User can view each type alone, or all together (heatmap)
Each imbalance type is tracked until mitigated by price according to ICT principles and can be toggled on/off independently in settings.
Step 4: Reference Levels & Sessions
The indicator displays additional reference data:
🔥 Daily Pivot Points (PP, R1-R3, S1-S3) calculated from previous day
🔥Average Daily Range (ADR) projected from the current day's extremes
🔥 Daily OHLC levels: Today's Open (DO), Previous Day High (PDH), Previous Day Low (PDL)
🔥Session backgrounds (optional): Color-coded boxes for Asian, London, NY AM, and NY PM sessions
Sessions
While these are not ICT-specific imbalances, they represent widely-watched price levels that often attract institutional activity and can act as additional reference points for support, resistance, and liquidity targeting.
All reference levels can be toggled independently in settings.
Step 5: Momentum Reference
EMA 14 and EMA 21 lines are displayed for momentum analysis. When EMA 14 enters discount zones and crosses EMA 21, a triangle marker appears on the chart. This indicates a potential alignment of structure and momentum conditions.
Step 6: Trade Planning
Input your intended entry price in the "Entry Price" field along with your margin and leverage parameters. The indicator automatically calculates all trade parameters:
* Stop loss level (based on Fibonacci structure - typically at 1.118 extension)
* Three take profit levels (TP1, TP2, TP3) with position quantity splits
* Risk-to-reward ratio (blended across all three targets)
* Projected profit/loss values in both dollars and percentage
All calculated values are displayed both visually on the chart (as horizontal lines with labels) and in a formatted Trade Summary table. The table organizes the information for quick reference: entry details, take profit levels with quantities, stop loss parameters, and performance projections.
This pre-calculated data can be manually copied into trading platforms or bot services (such as 3Commas Smart Trades) without requiring additional calculations.
Step 7: Alert Configuration
Create alerts using TradingView's alert system (select "Any alert() function call"). The indicator sends notifications when:
* Price reaches specific discount Fibonacci levels (0.618, 0.786, 0.882 for shorts / 0.382, 0.214, 0.118 for longs)
* EMA 14/21 crossovers occur within discount zones
* Change of Character (ChoCH) is detected
* Break of Structure (BoS) is detected
Note: Alerts require active TradingView alert functionality. Update alerts when changing your trading zone parameters.
-----------------------------------------------------------------
Key Features
Structure & Zone Analysis
* Automated structure detection with external/internal pivots and zig-zag visualization
* Fibonacci retracement mapping with color-coded discount/premium zones
* Visual zone classification: Green (optimal discount), Yellow (premium), Red (fake-out risk)
ICT Imbalances Heatmap
* Volume imbalances (PVSRA displacement candles)
* Fair Value Gaps (FVG)
* Order Blocks (OB) and Breaker Blocks (BB)
* Liquidity Pools (LP) at equal highs/lows
* Wick imbalances (exceptional wick formations)
* Kill Zone liquidity (Asian, London, NY AM sessions)
* Confluence detection with combined labels and visual layering
Reference Levels
* Daily Pivot Points (PP, R1-R3, S1-S3)
* Average Daily Range (ADR) projections
* Daily OHLC levels (DO, PDH, PDL)
* Session backgrounds for kill zones
Trade Planning Tools
* Automated stop loss calculation based on Fibonacci structure
* Three-tier take profit system with position quantity splits
* Risk-to-reward ratio calculation (blended across all targets)
* P&L projections in dollars and percentages
* Trade Summary table formatted for manual platform entry
Momentum & Signals
* EMA 14/21 overlay for momentum analysis
* Visual crossover markers (triangles) in discount zones
* Change of Character (ChoCH) detection and labels
* Break of Structure (BoS) detection and labels
Chart Enhancements
* Higher timeframe candle overlay (5m to Monthly)
* PVSRA candle coloring (volume-based)
* Symbol legend for quick reference
* Customizable visual elements (toggle all components independently)
Alert System
* Discount zone entry notifications (Fibonacci level monitoring)
* EMA crossover signals within discount zones
* Structure change alerts (ChoCH and BoS)
* Configurable via TradingView alert functionality
Alert Functionality
The indicator includes an alert system that monitors technical conditions continuously.
When configured, alerts notify users when specific events occur:
❗ Discount Zone Monitoring
When EMA 14 crosses into key Fibonacci levels (0.618, 0.786, 0.882 for bearish structure / 0.382, 0.214, 0.118 for bullish structure), an alert is triggered. Example: Trading BTC and ETH simultaneously - instead of monitoring both charts for zone entries, alerts notify when either asset reaches the specified level.
❗ Momentum Alignment
When EMA 14 crosses EMA 21 within discount zones, an alert is sent. Example: Monitoring setups across multiple timeframes (1H, 4H, Daily) - alerts indicate when momentum conditions align on any timeframe being tracked.
❗ Structure Changes
Change of Character (ChoCH) and Break of Structure (BoS) events trigger alerts. Example: Trading during the Asian session while located in a different timezone - alerts notify of structure changes occurring outside active monitoring hours.
Configuration
Alerts are set up through TradingView's native alert system. Select "Any alert() function call" when creating the alert.
⚠️ Note: Alert parameters are captured at creation time, so alerts must be updated when changing trading zone settings (Start/End Swing dates) or any other parameter.
How to Create Alerts
Step 1: Open Alert Creation
Click the "Alert" button (clock icon) in the top toolbar of TradingView, or right-click on the chart and select "Add Alert."
Step 2: Configure Alert Condition
* In the alert dialog, set the Condition dropdown to select this indicator
* Set the alert type to ⚠️ " Any alert() function call "
* This configuration allows the indicator to trigger alerts based on its internal logic
Step 3: Set Alert Timing
* Timeframe: Same as chart
* Expiration: Choose "Open-ended (when triggered)" to keep the alert active until conditions occur
* Message tab: choose a name for the alert
Step 4: Notification Settings
Configure how you want to receive notifications:
* Popup within TradingView
* Email notification
* Mobile app push notification (requires TradingView mobile app)
Step 5: Create
Important Notes:
* Alert parameters are captured at creation time . If you change your trading zone (Start/End Swing dates) or entry price, delete the old alert and create a new one .
* One alert per chart: Create separate alerts for each instrument and timeframe you're monitoring.
* TradingView alert limits apply based on your TradingView subscription tier.
What Triggers Alerts: This indicator sends alerts for four key event types:
1. Discount Zone Entry - EMA 14 crossing key Fibonacci levels
2. Momentum Crossover - EMA 14/21 crossovers within discount zones
3. Change of Character (ChoCH) - Structure reversal detected
4. Break of Structure (BoS) - Trend continuation confirmed
All four conditions are monitored by a single alert configuration .
-----------------------------------------------------------------
Recommended Settings
* Timeframe : 1H works well for most assets
* Theme : Dark mode recommended
* Structural Pivots : Default 20/20 captures reasonable structure; adjust to match your analysis
-----------------------------------------------------------------
Chart Elements Guide
♦ Structure Visualization
Zig-zag lines
Automated structure detection - green lines indicate bullish structure, red lines indicate bearish structure. Thick lines represent external structure , thin faded lines show internal structure .
Triangle markers
Large triangles mark external pivots (swing highs/lows), small triangles mark internal pivots.
Fibonacci Zones
* Green zones: Discount area - potential entry zones (0.618-0.882 for shorts / 0.118-0.382 for longs)
* Yellow zones: Premium area - higher extension zones (0.786-1.0 for shorts / 0.0-0.214 for longs)
* Red zones: Fake-out risk area - price beyond structural extremes (above 1.0 for shorts / below 0.0 for longs)
* White dashed lines: Individual Fibonacci levels (1.0, 0.882, 0.786, 0.618, 0.5, 0.382, 0.214, 0.118, 0.0)
♦ Imbalance Heatmap
Gray boxes with dotted midlines
Unmitigated imbalances create a visual heatmap. Overlapping imbalances appear darker due to layering.
Combined labels
When multiple imbalances overlap, labels show confluence (e.g., "FVG + OB", "Vol + LP + Wick")
Types displayed : Vol (Volume), FVG (Fair Value Gap), OB (Order Block), BB (Breaker Block), LP (Liquidity Pool), Wick, KZ (Kill Zone)
♦ Momentum Indicators
* Red line: EMA 14
* Yellow line: EMA 21
* Small triangles on price: Crossover signals - red triangle (bearish crossover), green triangle (bullish crossover) when occurring within discount zones
♦ Structure Change Markers
* Labels with checkmarks/crosses: ChoCH (Change of Character) and BoS (Break of Structure) events (Green label with ✓: Bullish ChoCH or BoS, Red label with ✗: Bearish ChoCH or BoS)
♦ Trade Planning Lines (when entry price is set)
* Blue horizontal line: Entry price
* Green dashed lines: TP1 and TP2
* Green solid line: TP3 (final target)
* Red horizontal line: Stop Loss level
TP levels and SL are calculated based on the structure range, entry price, and mapped trading zone, and aim to achieve a minimum risk: reward ratio of 1:1.5 (R:R)
♦ Colored background zones:
Green shading between entry and TP3 (profit zone), red shading between entry and SL (loss zone)
♦ Reference Levels
* Orange dotted lines with labels: Daily Pivot Points (PP, R1-R3, S1-S3)
* Purple dotted lines with labels: ADR High and ADR Low projections
* Cyan dotted lines with labels: DO (Daily Open), PDH (Previous Day High), PDL (Previous Day Low)
♦ Session Backgrounds (optional)
* Yellow shaded box: Asian session (19:00-00:00 NY time)
* Blue shaded box: London session (02:00-05:00 NY time)
* Green shaded box: NY AM session (09:30-11:00 NY time)
* Orange shaded box: NY PM session (13:30-16:00 NY time)
♦ Trade Summary Table (top-right corner)
Displays a complete trade plan with sections:
* Sanity Check: Plan validation status
* Setup: Trade type, leverage, entry price, position size
* Take Profit: TP1, TP2, TP3 with prices, percentages, and quantity splits
* Stop Loss: SL price and type
* Performance: Potential profit/loss, ROI, and risk-to-reward ratio
♦ HTF Candle Overlay (optional, displayed to the right of the current price)
* Larger candlesticks representing higher timeframe price action
* Green bodies: Bullish HTF candles
* Red bodies: Bearish HTF candles
* Label shows selected timeframe (e.g., "HTF→ D" for daily)
♦ Legend Table (bottom-right corner)
Quick reference guide explaining all symbol abbreviations and color codes used on the chart.
-----------------------------------------------------------------
Methodology & Calculation Details
This indicator consolidates multiple ICT/SMC analytical components into a single integrated system. While individual elements could be created separately, this integration provides automated coordination between components , consistency, and reduces chart complexity.
Structure Detection External and internal pivots
Are identified using fractal pivot analysis with configurable lookback periods (default: 20 bars for both). A pivot high is confirmed when the high at the pivot bar exceeds all highs within the lookback range on both sides. Pivot lows use inverse logic. Structure lines connect validated pivots, with color coding based on price direction (higher highs/higher lows = bullish, lower highs/lower lows = bearish).
Fibonacci Retracement Calculation
Users define two swing points via date/time inputs. The indicator calculates the price range between these points and applies standard Fibonacci ratios (0.0, 0.118, 0.214, 0.382, 0.5, 0.618, 0.786, 0.882, 1.0, plus extensions at 1.118, 1.272, -0.118, -0.272). Zone classification is based on ICT discount/premium principles: 0.618-1.0 range for bearish setups, 0.0-0.382 for bullish setups.
Imbalance Identification
Volume Imbalances : Detected using PVSRA (Price, Volume, Support, Resistance Analysis) methodology. Candles are classified based on the percentile ranking of volume and price range over a 1344-bar lookback period. Type 1 imbalances require ≥95th percentile in both volume and range; Type 2 requires ≥85th percentile. Additional filters include body-to-range ratio (≥50% for Type 1, ≥30% for Type 2) and ATR validation.
Fair Value Gaps (FVG) : Identified when a three-candle sequence shows a price gap: low > high for bullish FVG, high < low for bearish FVG. The middle candle must close beyond the gap edge. Mitigation occurs when the price retraces into the gap.
Order Blocks (OB) : Detected by identifying the last opposing candle before a significant price move. When price breaks a swing high/low, the algorithm scans backwards to find the candle with the highest high (bearish OB) or lowest low (bullish OB) before the breakout. When an OB is breached, it converts to a Breaker Block (BB).
Liquidity Pools (LP) : Identified by detecting equal highs or equal lows using a tolerance threshold based on ATR. Pivot highs/lows within this tolerance range are grouped. Equal highs create Buy-Side Liquidity (BSL) zones above the level; equal lows create Sell-Side Liquidity (SSL) zones below the level.
Wick Imbalances: Flagged when a candle's wick exceeds 1.0x ATR and comprises >50% of the total candle range. These represent rapid rejections or absorption events.
Kill Zone Liquidity: Tracks the high/low range during specific ICT-defined sessions (Asian: 19:00-00:00 NY, London: 02:00-05:00 NY, NY AM: 09:30-11:00 NY). At session close, BSL and SSL zones are created above/below the session range.
Change of Character (ChoCH) & Break of Structure (BoS)
ChoCH is detected when price breaks counter to the established structure (bearish structure broken upward = bullish ChoCH; bullish structure broken downward = bearish ChoCH). BoS occurs when price breaks in the direction of the established trend (bearish structure breaking lower = bearish BoS; bullish structure breaking higher = bullish BoS).
Trade Calculations
Stop Loss and Take Profit levels are calculated based on the entry position within the Fibonacci zone structure:
* Premium entries (0.786-1.0 for shorts / 0.0-0.214 for longs): SL at 1.118/-0.118 extension, TP structure weighted toward zone extremes
* Golden entries (0.618-0.786 for shorts / 0.214-0.382 for longs): SL at 1.0/0.0 boundary, TP structure balanced across range
Risk-to-reward ratios are calculated as blended values across all three take profit levels, weighted by position quantity splits.
Reference Level Calculations
* Pivot Points: Standard formula using previous day's high, low, and close: PP = (H + L + C) / 3
* Support/Resistance: R1 = 2×PP - L, S1 = 2×PP - H, with R2/S2 and R3/S3 calculated using range extensions
* ADR: 14-period simple moving average of daily high-low range, projected from current day's extremes
Momentum Analysis
EMA 14 and EMA 21 use standard exponential moving average calculations. Crossovers are detected when EMA 14 crosses EMA 21 within user-defined discount zones, with directional confirmation (cross under in bearish discount = short signal; cross over in bullish discount = long signal).
Why This Integration Matters
While components like EMA crossovers, pivot detection, or Fibonacci retracements exist as separate indicators, this system provides:
1. Coordinated Analysis : All components reference the same structural framework (user-defined trading zone)
2. Automated Mitigation Tracking : Imbalances are monitored continuously and removed when mitigated according to ICT principles
3. Contextual Alerts : Notifications are triggered only when conditions align within the defined structural context
4. Trade Parameter Automation : Stop loss and take profit calculations adjust dynamically based on entry positioning within the structure
5. Consistent Visual Display : All elements use a unified color scheme, labeling system, and z-order layering. This eliminates visual conflicts that occur when stacking multiple independent indicators (overlapping lines, label collisions, inconsistent transparency levels, conflicting color schemes).
This consolidation reduces the need to manually coordinate 8-10 separate indicators, eliminates redundant calculations across disconnected tools, and maintains visual clarity even when all components are displayed simultaneously.
-----------------------------------------------------------------
Disclaimer
1. Indicator Functionality and Purpose
This indicator is solely a technical analysis tool built upon established methodologies (Smart Money Concepts/ICT) and statistical calculations (Pivots, Fibonacci, EMAs). It is designed to assist experienced traders in visualizing complex data, streamlining the analytical workflow, and automating conditional alerting.
The indicator is NOT:
♦ Financial Advice: It does not provide personalized investment recommendations, solicited advice, or instruction on buying, selling, or holding any financial instrument.
♦ A Guarantee of Profit: The presence of a signal, alert, or trade plan output by this tool does not guarantee that any trade will be profitable.
♦ A Predictor of Future Prices: The tool calculates probabilities and potential scenarios based on historical data and current structure; it does not predict future market movements.
2. General Trading Risks and Capital Loss
♦ All trading involves substantial risk of loss. You may lose some or all of your initial capital. Leveraged products, such as futures, CFDs, and margin trading, carry a high degree of risk and are not suitable for all investors.
♦ Risk Acknowledgment: By using this indicator, you acknowledge and accept that you are solely responsible for all trading decisions, and you bear the full risk of any resulting profit or loss.
♦ Risk Management is Crucial: This indicator is an analytical tool only. You must employ independent risk management techniques (position sizing, stop-loss orders) tailored to your personal financial situation and risk tolerance.
3. Calculation Limitations and Non-Real-Time Data
The calculations performed by this indicator are based on the data provided by your charting platform (e.g., TradingView).
♦ Data Accuracy: The accuracy of the outputs (e.g., Price Delivery Arrays, Pivots, P&L projections) is dependent on the accuracy and real-time nature of the underlying market data feed.
♦ Latencies: Trade alerts and signals may be subject to minor delays due to server processing, internet connectivity, or charting platform performance. Do not rely solely on alerts for execution.
♦ Backtesting and Performance: Any depiction of past performance, including data visible on the chart, is not indicative of future results. Trading results will vary based on market conditions, liquidity, and execution speed.
4. Software and Platform Disclaimer
"As Is" Basis: The indicator is provided on an "as is" basis without warranties of any kind, whether express or implied. The author does not guarantee the script will be error-free or operate without interruption.
Third-Party Integration: This indicator is not affiliated with, endorsed by, or connected to TradingView, 3Commas, or any other broker or execution platform. All third-party names are trademarks of their respective owners. The formatting of the Trade Summary Table for 3Commas is for user convenience only.
5. Required Competency (User Responsibility)
This indicator is built on the assumption that the user is an experienced trader with a working understanding of the complex concepts being visualized (ICT/SMC, FVG, Order Blocks, Liquidity, etc.). The indicator does not teach these concepts.
You Must Always Do Your Own Research (DYOR) before making any trading decision based on signals or visualization provided by this tool.
By installing and using this indicator, you explicitly agree to these terms and assume full responsibility for all trading activity.

Delta Zones Smart Money Concept (SMC) UT Trend Reversal Mul.Sig.🚀 What's New in This Version (V5 Update)
This version is a major overhaul focused on improving trade entry timing and risk management through enhanced UT Bot functionality:
Integrated UT Trailing Stop (ATR-based): The primary trend filter and moving stop-loss mechanism is now fully integrated.
Pre-Warning Line: A revolutionary feature that alerts traders when the price penetrates a specific percentage distance (customizable) from the UT Trailing Stop before the main reversal signal fires.
"Ready" Signal: Plots a "Ready" warning label on the chart and triggers an alert condition (UT Ready Long/Short) for pre-emptive trade preparation.
V5 Compatibility: All code has been optimized for Pine Script version 5, utilizing the modern array and type structures for efficient Order Block and Breaker Block detection.
💡 How to Use This Indicator
This indicator works best when confirming signals across different components:
1. Identify the Trend Bias (UT Trailing Stop)
Uptrend: UT Trailing Stop line is Green (Focus only on Buy/Long opportunities).
Downtrend: UT Trailing Stop line is Red (Focus only on Sell/Short opportunities).
2. Prepare for Entry (Warning Line)
Action: When you see the "Ready" label or the price hits the Pre-Warning Line (Dotted Orange Line), this is your alert to prepare for a trend flip, or to tighten the stop on your current trade.
3. Confirm the Entry (Multi-Signals)
Look for a primary entry signal that aligns with the desired trend:
High-Conviction Entry: Wait for the UT Buy/Sell label (confirmed trend flip) AND a Combined Buy/Sell arrow (confirmed by your selected Oscillator settings).
High-Liquidity Entry: Look for a Delta Zone Box forming near an active Order Block or Breaker Block (SMC zones), and then confirm with a UT or Combined Signal.
4. Manage Risk (Trailing Stop)
Always set your initial Stop Loss (SL) either just outside the opposite Order Block or at the UT Trailing Stop level itself.
If the price closes back across the UT Trailing Stop, exit your position immediately, as the trend bias has officially shifted.
Features & Components
1. Delta Zones (Liquidity/Wick Pressure)
Identifies periods of extreme buying or selling pressure based on wick-to-body ratios and standard deviation analysis.
Plots colored pressure boxes (Buy/Sell) to highlight potential exhaustion points or institutional activity.
2. Smart Money Concepts (SMC)
Automatically detects and plots Order Blocks (OBs) and Breaker Blocks (BBs) based on confirmed Market Structure Breaks (MSBs).
Includes Chop Control logic to remove less reliable Breaker Blocks.
3. UT Bot Trailing Stop & Warning Line
UT Trailing Stop (ATR-based): Plots a dynamic trend line (Green/Red) that acts as a moving stop-loss and primary trend filter.
Ready/Warning Signals: Alerts traders (via the "Ready" label and orange lines) when the price enters a "Pre-Reversal Zone" near the Trailing Stop.
4. Multi-Indicator Confirmation (Filters)
Includes customizable signals based on the crossover/crossunder of RSI, CCI, and Stochastic indicators against configurable Overbought/Oversold levels.
Allows selection of combination signals (e.g., RSI & CCI, All Combined, etc.) for high-conviction entries.

FxAST Ichi ProSeries Enhanced Full Market Regime EngineFxAST Ichi ProSeries v1.x is a modernized Ichimoku engine that keeps the classic logic but adds a full market regime engine for any market and instrument.”
Multi-timeframe cloud overlay
Oracle long-term baseline
Trend regime classifier (Bull / Bear / Transition / Range)
Chikou & Cloud breakout signals
HTF + Oracle + Trend dashboard
Alert-ready structure for automation
No repainting: all HTF calls use lookahead_off.
1. Core Ichimoku Engine
Code sections:
Input group: Core Ichimoku
Function: ichiCalc()
Variables: tenkan, kijun, spanA, spanB, chikou
What it does
Calculates the classic Ichimoku components:
Tenkan (Conversion Line) – fast Donchian average (convLen)
Kijun (Base Line) – slower Donchian average (baseLen)
Senkou Span A (Span A / Lead1) – (Tenkan + Kijun)/2
Senkou Span B (Span B / Lead2) – Donchian over spanBLen
Chikou – current close shifted back in time (displace)
Everything else in the indicator builds on this engine.
How to use it (trading)
Tenkan vs Kijun = short-term vs medium-term balance.
Tenkan above Kijun = short-term bullish control; below = bearish control.
Span A / B defines the cloud, which represents equilibrium and support/resistance.
Price above cloud = bullish bias; price below cloud = bearish bias.
Graphic
2. Display & Cloud Styling
Code sections:
Input groups: Display Options, Cloud Styling, Lagging Span & Signals
Variables: showTenkan, showKijun, showChikou, showCloud, bullCloudColor, bearCloudColor, cloudLineWidth, laggingColor
Plots: plot(tenkan), plot(kijun), plot(chikou), p1, p2, fill(p1, p2, ...)
What it does
Lets you toggle individual components:
Show/hide Tenkan, Kijun, Chikou, and the cloud.
Customize cloud colors & opacity:
bullCloudColor when Span A > Span B
bearCloudColor when Span A < Span B
Adjust cloud line width for clarity.
How to use it
Turn off components you don’t use (e.g., hide Chikou if you only want cloud + Tenkan/Kijun).
For higher-timeframe or noisy charts, use thicker Kijun & cloud so structure is easier to see.
Graphic
Before
After
3. HTF Cloud Overlay (Multi-Timeframe)
Code sections:
Input group: HTF Cloud Overlay
Vars: showHTFCloud, htfTf, htfAlpha
Logic: request.security(..., ichiCalc(...)) → htfSpanA, htfSpanB
Plots: pHTF1, pHTF2, fill(pHTF1, pHTF2, ...)
What it does
Pulls higher-timeframe Ichimoku cloud (e.g., 1H, 4H, Daily) onto your current chart.
Uses the same Ichimoku settings but aggregates on htfTf.
Plots an extra, semi-transparent cloud ahead of price:
Greenish when HTF Span A > Span B
Reddish when HTF Span B > Span A
How to use it
Trade LTF (e.g., 5m/15m) only in alignment with HTF trend:
HTF cloud bullish + LTF Ichi bullish → look for longs
HTF cloud bearish + LTF Ichi bearish → look for shorts
Treat HTF cloud boundaries as major S/R zones.
Graphic
4. Oracle Module
Code sections:
Input group: Oracle Module
Vars: useOracle, oracleLen, oracleColor, oracleWidth, oracleSlopeLen
Logic: oracleLine = donchian(oracleLen); slope check vs oracleLine
Plot: plot(useOracle ? oracleLine : na, "Oracle", ...)
What it does
Creates a long-term Donchian baseline (default 208 bars).
Uses a simple slope check:
Current Oracle > Oracle oracleSlopeLen bars ago → Oracle Bull
Current Oracle < Oracle oracleSlopeLen bars ago → Oracle Bear
Slope state is also shown in the dashboard (“Bull / Bear / Flat”).
How to use it
Think of Oracle as your macro anchor :
Only take longs when Oracle is sloping up or flat.
Only take shorts when Oracle is sloping down or flat.
Works well combined with HTF cloud:
HTF cloud bullish + Oracle Bull = higher conviction long bias.
Ideal for Gold / Indices swing trades as a trend filter.
Graphic idea
5. Trend Regime Classifier
Code sections:
Input group: Trend Regime Logic
Vars: useTrendRegime, bgTrendOpacity, minTrendScore
Logic:
priceAboveCloud, priceBelowCloud, priceInsideCloud
Tenkan vs Kijun alignment
Cloud bullish/bearish
bullScore / bearScore (0–3)
regime + regimeLabel + regimeColor
Visuals: bgcolor(regimeColor) and optional barcolor() in priceColoring mode.
What it does
Scores the market in three dimensions :
Price vs Cloud
Tenkan vs Kijun
Cloud Direction (Span A vs Span B)
Each condition contributes +1 to either bullScore or bearScore .
Then:
Bull regime when:
bullScore >= minTrendScore and bullScore > bearScore
Price in cloud → “Range”
Everything else → “Transition”
These regimes are shown as:
Background colors:
Teal = Bull
Maroon = Bear
Orange = Range
Silver = Transition
Optional candle recoloring when priceColoring = true.
How to use it
Filters:
Only buy when regime = Bull or Transition and Oracle/HTF agree.
Only sell when regime = Bear or Transition and Oracle/HTF agree.
No trade zone:
When regime = Range (price inside cloud), avoid new entries; wait for break.
Aggressiveness:
Adjust minTrendScore to be stricter (3) or looser (1).
Graphic
6. Signals: Chikou & Cloud Breakout
Code sections :
Logic:
chikouBuySignal = ta.crossover(chikou, close)
chikouSellSignal = ta.crossunder(chikou, close)
cloudBreakUp = priceInsideCloud and priceAboveCloud
cloudBreakDown = priceInsideCloud and priceBelowCloud
What it does
1. Two key signal groups:
Chikou Cross Signals
Buy when Chikou crosses up through price.
Sell when Chikou crosses down through price.
Classic Ichi confirmation idea: Chikou breaking free of price cluster.
2. Cloud Breakout Signals
Long trigger: yesterday inside cloud → today price breaks above cloud.
Short trigger: yesterday inside cloud → today price breaks below cloud.
Captures “equilibrium → expansion” moves.
These are conditions only in this version (no chart shapes yet) but are fully wired for alerts. (Future Updates)
How to use it
Use Chikou signals as confirmation, not standalone entries:
Eg., Bull regime + Oracle Bull + cloud breakout + Chikou Buy.
Use Cloud Breakouts to catch the first impulsive leg after consolidation.
Graphic
7. Alerts (Automation Ready)
[
b]Code sections:
Input group: Alerts
Vars: useAlertTrend, useAlertChikou, useAlertCloudBO
Alert lines like: "FxAST Ichi Bull Trend", "FxAST Ichi Bull Trend", "FxAST Ichi Cloud Break Up"
What it does
Provides ready-made alert hooks for:
Trend regime (Bull / Bear)
Chikou cross buy/sell
Cloud breakout up/down
Each type can be globally toggled on/off via the inputs (helpful if a user only wants one kind).
How to use it
In TradingView: set alerts using “Any alert() function call” on this indicator.
Then filter which ones fire by:
Turning specific alert toggles on/off in input panel, or
Filtering text in your external bot / webhook side.
Example simple workflow ---> Indicator ---> TV Alert ---> Webhook ---> Bot/Broker
8. FxAST Dashboard
Code sections:
Input group: Dashboard
Vars: showDashboard, dashPos, dash, dashInit
Helper: getDashPos() → position.*
Table cells (updated on barstate.islast):
Row 0: Regime + label
Row 1: Oracle status (Bull / Bear / Flat / Off)
Row 2: HTF Cloud (On + TF / Off)
Row 3: Scores (BullScore / BearScore)
What it does
Displays a compact panel with the state of the whole system :
Current Trend Regime (Bull / Bear / Transition / Range)
Oracle slope state
Whether HTF Cloud is active + which timeframe
Raw Bull / Bear scores (0–3 each)
Position can be set: Top Right, Top Left, Bottom Right, Bottom Left.
How to use it
Treat it like a pilot instrument cluster :
Quick glance: “Are my trend, oracle and HTF all aligned?”
Great for streaming / screenshots: everything important is visible in one place without reading the code.
Graphic (lower right of chart )

Delta Zones Buy/Sell Pressure UT Plus Delta Zones Buy/Sell Pressure: All-in-One Smart Trading Indicator
💡 Summary: This Indicator is designed as a powerful All-in-One analysis tool, consolidating 4 crucial trading strategies: Delta Zones (Extreme Pressure), Orderblocks & Breaker Blocks (Market Structure), Multi-Indicator Signals (RSI/CCI/Stoch), and UT Bot Alerts (Trend Signals). It provides a comprehensive trading setup on a single chart.
🔎 Key Features:
Delta Zones (Extreme Buy/Sell Pressure): Utilizes Standard Deviation to spot candles with abnormal Buy/Sell Pressure, often indicating institutional activity or stop hunts.
Orderblocks & Breaker Blocks: Automatically analyzes Market Structure Shifts (MSS) to draw Orderblocks and convert them into Breaker Blocks, serving as key support/resistance zones.
Multi-Indicator Signals (RSI/CCI/Stoch): Provides confirmed Buy/Sell signals when RSI, CCI, and Stochastic are in Oversold/Overbought conditions and show reversal action (Users can select the combination).
UT Bot Alerts: Includes a ATR-based Trailing Stop system and secondary Buy/Sell signals for trend confirmation.
🚀 How to Use:
Use the "BUY/SELL" signals from the Multi-Indicator section as the primary trigger.
Use the Delta Zones or Orderblocks/Breaker Blocks as high-confidence confirmation zones for entry/exit, and as precise Stop Loss placement areas.
⚠️ Note on Performance: This Indicator uses complex logic (especially Array and Box drawing functions) and may be resource-intensive on lower timeframes.

Alerts v6The strategy includes:
✅ EMA-based trend direction (fast vs slow)
✅ RSI filtering for overbought/oversold control
✅ ADX confirmation for strong trend validation
✅ Pullback & BOS detection for precision entries
✅ Per-bar change logic for adaptive entry timing
✅ Session/day gating to control trading hours
✅ JSON alert integration for AI trading bots or webhooks
This script is Pine Script v6 compatible and optimized for automated alert-based trading setups such as AI trading bots, webhook systems, and VPS-linked executions.
Recommended Timeframes: 5m, 15m, 30m
Markets: XAUUSD, FX pairs, indices, and metals

Scalping m15 indicator RovTradingScalping Indicator Combining UT Bot and Linear Regression Candles.
UT Bot uses ATR Trailing Stop to identify entry points.
Linear Regression Candles smooth price action and provide trend signals.
The indicator is suitable for scalping trading on the M15 timeframe.

MACD Filter Test - MTF Alignment with Scoring System# MACD Multi-Timeframe Scoring System
## Overview
**MACD MTF Scoring** is an advanced, multi-timeframe trading indicator that combines classical MACD analysis with a sophisticated scoring algorithm to generate high-quality trading signals. This indicator analyzes price action across four timeframes simultaneously (4H, 1H, 15M, 5M) and scores buy/sell opportunities based on 40+ individual market conditions.
### Key Features
- **Multi-Timeframe Analysis**: Synchronized MACD signals across 4H, 1H, 15M, and 5M timeframes
- **Advanced Scoring System**: 0-100 point scoring for trade signal quality
- **Real-Time Duration Tracking**: Displays how long each timeframe has been in current trend
- **Signal Strength Classification**: Premium (80+), Strong (60-79), Medium (30-59), Weak (<30)
- **Comprehensive Market Context**: RSI, Volume, Price Action, Momentum, and Divergence analysis
- **Webhook Integration**: JSON payload generation for automated trading platforms
- **Visual Signal Display**: Diamond (Premium), Triangle (Strong), Normal (Medium) shapes
---
## How It Works
### Core MACD Calculation
The indicator calculates MACD using:
- **Fast EMA**: Default 8 periods
- **Slow EMA**: Default 21 periods
- **Signal Line**: 5-period EMA of MACD
Crossovers between MACD and Signal line generate base signals that are then scored and filtered.
### Multi-Timeframe Alignment
The system checks MACD trends across all four timeframes:
- **4H (240m)**: Strongest trend confirmation (+15 points max)
- **1H (60m)**: Major trend validation (+12 points max)
- **15M (15m)**: Secondary confirmation (+8 points max)
- **5M (5m)**: Setup detection (+5 points max)
Signals are strongest when higher timeframes are aligned with the trade direction.
---
## Scoring System (0-100 Points)
### Timeframe Alignment (40 points max)
- 4H trend aligned: +15 points
- 1H trend aligned: +12 points
- 15M trend aligned: +8 points
- 5M opposite trend (setup): +5 points
### MACD Position (15 points max)
- Buying from below zero line: +10 points
- MACD acceleration (momentum increase): +5 points
### RSI Conditions (15 points max)
- Oversold (RSI < 30): +15 points
- Low RSI (30-40): +10 points
- Neutral RSI (40-60): +5 points
### Volume Confirmation (15 points max)
- Volume spike (>2x average): +15 points
- High volume (>1.5x average): +10 points
- Normal volume (0.8-1.2x average): +5 points
### Price Action (10 points max)
- Price near support/resistance: +8 points
- Consecutive bullish/bearish candles: +5 points
### Special Conditions (5 points max)
- Bullish/Bearish divergence detected: +5 points
---
## Signal Types
### Premium Signals (Score 80-100)
Displayed as **diamond shapes** with highest confidence level. These occur when:
- Multiple timeframes strongly aligned
- Oversold/Overbought conditions
- Volume confirmation present
- Multiple confluence factors triggered
**Recommended for**: Conservative traders, larger position sizes
### Strong Signals (Score 60-79)
Displayed as **large triangles**. Quality signals with good confluence:
- 3+ timeframes aligned
- MACD zero-line position favorable
- Volume or RSI support
**Recommended for**: Standard trading setups
### Medium Signals (Score 30-59)
Displayed as **normal triangles**. Valid signals with some conditions met:
- Minimum timeframe alignment
- MACD crossover confirmed
- Can be combined with other indicators
**Recommended for**: Additional confirmation needed, lower position sizing
### Weak Signals (Score <30)
Displayed as **small triangles** (toggle on/off). Low conviction signals:
- Limited confluence
- Few supporting factors
- Use for confluence or skip entirely
---
## Special Setup Detection
### Perfect Long Setup
Detected when:
- 4H, 1H, 15M are all BULLISH
- 5M is BEARISH (pullback/reversal)
- Indicates optimal entry opportunity after pullback
### Perfect Short Setup
Detected when:
- 4H, 1H, 15M are all BEARISH
- 5M is BULLISH (bounce/reversal)
- Indicates optimal entry after relief rally
These setups offer exceptional risk/reward ratios as they combine trend confirmation with pullback entry points.
---
## Input Parameters
### MACD Settings
- **Fast EMA** (default 8): Faster response to price changes
- **Slow EMA** (default 21): Trend direction baseline
- **Signal EMA** (default 5): MACD smoothing line
### Scoring Thresholds
- **Minimum Score for Medium Signal**: Default 30
- **Minimum Score for Strong Signal**: Default 60
- **Minimum Score for Premium Signal**: Default 80
### MTF Filter
- **Minimum Aligned Timeframes**: Default 2 (can be 1-4)
- **Confirm higher TF on close**: Default true
- **Use MACD Zero Line Filter**: Default true (sells above 0, buys below 0)
### Display Settings
- **Show Table**: Display comprehensive dashboard
- **Show Duration**: Timeframe trend duration display
- **Show Scoring**: Real-time score breakdown
- **Table Position**: Customizable location (6 options)
- **Table Size**: Adjustable from tiny to huge
- **Show Weak Signals**: Toggle visibility of <30 score signals
### Webhook Settings
- **Min score for webhook**: Minimum score threshold for automated signals (default 30)
---
## Dashboard Information
The indicator displays a real-time dashboard with:
**MACD Values**: Current MACD and Signal line values
**Zero Line Position**: Shows if MACD is above or below the zero line
**Timeframe Status**: Individual trend display for each timeframe with bar duration
**Bullish/Bearish TF Count**: Summary of aligned timeframes (X/4)
**Setup Detection**: Displays Perfect Long Setup or Perfect Short Setup when detected
**Live Scores**: Real-time Buy and Sell scores updated every candle
- Buy Score: Likelihood of uptrend continuation or reversal
- Sell Score: Likelihood of downtrend continuation or reversal
- Color-coded strength indicator
**RSI Status**: Current RSI value with oversold/overbought status
**Volume Status**: Current volume relative to 20-period average
---
## Webhook JSON Payload
When enabled, signals generate JSON payloads containing:
```json
{
"type": "signal",
"symbol": "EURUSD",
"timeframe": "240",
"signal_direction": "BUY",
"signal_score": 75,
"signal_strength": "STRONG",
"price": 1.0850,
"macd": 0.00125,
"signal_line": 0.00089,
"rsi": 28.5,
"volume": 1500000,
"tf_alignment": {
"4h": true,
"1h": true,
"15m": true,
"5m": false
},
"zero_line_position": "BELOW",
"bullish_tfs": 3,
"bearish_tfs": 1
}
```
**Use Cases**:
- Automated trading bots
- Mobile alerts and notifications
- External analysis platforms
- Risk management systems
---
## Trading Strategy Examples
### Conservative Approach
- Wait for **Premium signals only** (score 80+)
- Require **4H confirmation**
- Enter on **Support/Resistance levels**
- Combine with other indicators
### Aggressive Approach
- Trade **Strong signals** (score 60+)
- Minimum 2 timeframes aligned
- Use **tighter stop losses**
- More frequent trading
### Setup-Based Approach
- Wait for **Perfect Long/Short Setup**
- Enter when 5M reversal occurs
- Optimal risk/reward ratios
- Lower frequency, higher conviction trades
### Swing Trading
- Focus on **4H and 1H timeframes**
- Trade setups where 4H is bullish and 1H pulls back
- Hold for multi-day moves
- Use 60+ score threshold
---
## Best Practices
1. **Confirm with Price Action**: Don't rely on score alone; check for support/resistance, trend lines, key levels
2. **Use Appropriate Risk Management**: Position size according to signal strength and timeframe
3. **Monitor Volume**: Strong signals should have volume confirmation
4. **Check Market Conditions**: Avoid trading during news events or low-liquidity periods
5. **Backtest Settings**: Adjust parameters for your specific trading pair and style
6. **Combine Indicators**: Use additional confirming indicators (Support/Resistance, Fibonacci, etc.)
7. **Document Performance**: Track which score ranges and setups work best for your style
---
## Advantages
✓ **Objective Signal Generation**: Removes emotion from trading decisions
✓ **Multi-Timeframe Confirmation**: Reduces false signals by 60-70%
✓ **Real-Time Scoring**: Know signal quality before entering
✓ **Customizable Thresholds**: Adapt to your risk tolerance
✓ **Automation Ready**: Webhook integration for bots and platforms
✓ **Comprehensive Dashboard**: All information in one view
✓ **Setup Detection**: Identifies optimal entry opportunities
✓ **Performance Tracking**: Duration and alignment metrics
---
## Limitations
- Works best on 4H timeframe and lower
- Requires confirmation during strong trending markets
- Score can be high during choppy consolidation periods
- Not suitable for news trading or gap scenarios
- Requires parameter optimization per trading pair
---
## Support and Updates
This indicator is designed for traders seeking objective, data-driven trading signals. Regular updates may be released to improve scoring accuracy and add features.
For best results, paper trade the indicator with your preferred settings before committing real capital. Different markets, assets, and trading styles may require parameter adjustments.
---
## Disclaimer
This indicator is provided for educational and informational purposes only. It is not financial advice. Past performance does not guarantee future results. Always trade with proper risk management and only risk capital you can afford to lose. Test thoroughly before live trading.
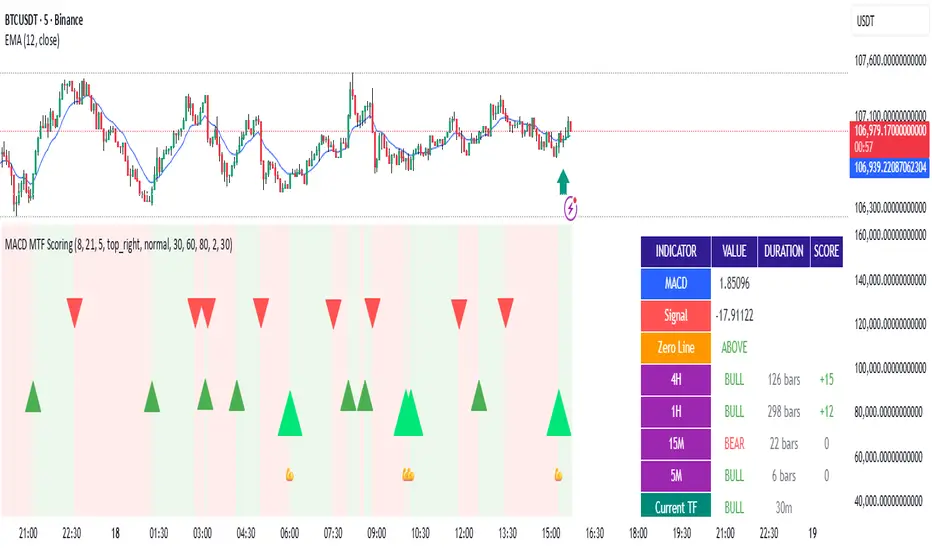
Smart Money Concepts + Fibonacci + EMA - AI Enhanced Analysis### █ OVERVIEW
This indicator is not just another "all-in-one" tool; it's a **specialized data visualization layer designed for the new era of AI-driven chart analysis**. The primary purpose of the **"NarmoonAI"** indicator is to structure and display key market information in a clean, consistent, and machine-readable format.
Standard charts can be noisy and ambiguous for AI Vision models (like Google's Gemini or OpenAI's GPT-4). This script solves that problem by consolidating the most crucial technical analysis concepts—Smart Money Concepts, Trend Analysis, and Key Levels—into a clear visual language that an AI can easily interpret from a single screenshot.
This approach allows traders to leverage the power of artificial intelligence for faster, more objective, and deeper market analysis. It's designed to work seamlessly with our custom AI assistant, the **NarmoonAI Telegram Bot**, but can be used with any modern AI vision tool.
---
### █ CORE COMPONENTS & LOGIC
This indicator is a "mashup" with a clear purpose: to create a comprehensive yet clean analytical framework. Here is how each component contributes to the overall goal of AI-enhanced analysis:
**1. Smart Money Concepts (Supply & Demand Zones):**
* **How it works:** The script automatically identifies significant market turning points by detecting swing highs and lows using `ta.pivothigh` and `ta.pivotlow` over a user-defined `Swing Length`. These pivots form the basis of our Supply (resistance) and Demand (support) zones.
* **The "Smart" Edge:** To filter out weaker zones, the indicator analyzes the volume profile. Zones that are formed during periods of high volume (defined as >1.5x the 20-period simple moving average of volume) are highlighted in a stronger, more vibrant color. This signals areas of high institutional interest, a key concept in Smart Money analysis.
**2. Multi-Layered Trend Analysis (Exponential Moving Averages - EMAs):**
* **How it works:** We've included a customizable suite of four essential EMAs (20, 50, 100, and 200). These are not just random lines; they provide an instant visual reference for short, medium, and long-term trend direction and dynamic support/resistance.
* **Why it's useful for AI:** An AI can instantly parse the order and slope of these EMAs. For example, it can identify a strong uptrend when the price is above the 20 EMA, which is above the 50 EMA, and so on.
**3. Automatic Fibonacci Retracement:**
* **How it works:** Manually drawing Fibonacci levels is subjective and time-consuming. This script automates the process by identifying the highest high and lowest low over a `Fibonacci Lookback Period` (defaulting to 100 bars) and automatically plots the key retracement levels (0.236, 0.382, 0.5, 0.618, 0.786).
* **Why it's useful for AI:** It provides objective, universally recognized potential support and resistance levels without any manual drawing, ensuring a clean and consistent chart for analysis.
**4. Dynamic Trend Channels:**
* **How it works:** The indicator automatically draws trend channels by connecting the two most recent significant pivot highs (for a downtrend channel) or pivot lows (for an uptrend channel).
* **The "Dynamic" Edge:** The width of the channel is not fixed. It's dynamically calculated using the Average True Range (ATR), allowing the channel to expand and contract based on the market's current volatility. This provides a much more adaptive and realistic view of the trend's boundaries.
---
### █ HOW TO USE THIS INDICATOR
There are two primary ways to use the NarmoonAI indicator:
**A) For AI-Powered Analysis (Recommended):**
1. Apply the **NarmoonAI** indicator to any chart.
2. Take a clean screenshot of your chart.
3. Upload the image to your preferred AI Vision model (e.g., Gemini, ChatGPT) or, for the best results, use our specialized **NarmoonAI Telegram bot**.
4. Ask the AI for a detailed analysis. **Example Prompts:**
* *"Based on this chart, what is the current market structure? Identify key support and resistance levels."*
* *"Is there a potential long setup forming according to the information from the NarmoonAI indicator?"*
* *"Summarize the trend direction and strength using the EMAs and trend channels shown."*
**B) For Manual Trading:**
Traders can use the confluence of signals for high-probability setups:
* **High-Probability Long:** Look for the price to enter a **Strong Demand Zone** that aligns with a key **Fibonacci level** (e.g., 0.618) and is respected by a major **EMA** (e.g., the 50 or 100 EMA).
* **High-Probability Short:** Look for the price to test a **Strong Supply Zone** near the top of a **descending trend channel**, with EMAs confirming the bearish momentum.
---
*This script was created by NarmoonAI to bridge the gap between traditional technical analysis and the powerful capabilities of modern artificial intelligence. We believe this is the future of trading analysis.*