Real Relative Strength Breakout & BreakdownReal Relative Strength Breakout & Breakdown Indicator
What It Does
Identifies high-probability trading setups by combining:
Technical Breakouts/Breakdowns - Price breaking support/resistance zones
Real Relative Strength (RRS) - Volatility-adjusted performance vs benchmark (SPY)
Key Insight: The strongest signals occur when price action contradicts market direction—breakouts during market weakness or breakdowns during market strength show exceptional buying/selling pressure.
Real Relative Strength (RRS) Calculation
RRS measures outperformance/underperformance on a volatility-adjusted basis:
Power Index = (Benchmark Price Move) / (Benchmark ATR)
RRS = (Stock Price Move - Power Index × Stock ATR) / Stock ATR
RRS (smoothed) = 3-period SMA of RRS
Interpretation:
RRS > 0 = Relative Strength (outperforming)
RRS < 0 = Relative Weakness (underperforming)
Signal Types
🟢 Large Green Triangle (Premium Long)
Condition: Breakout + RRS > 0
Meaning: Stock breaking resistance WHILE outperforming benchmark
Best when: Market is weak but stock breaks out anyway = exceptional strength
Use: High-conviction long entries
🔵 Small Blue Triangle (Standard Breakout)
Condition: Breakout + RRS ≤ 0
Meaning: Breaking resistance but underperforming benchmark
Typical: "Rising tide lifts all boats" scenario during market rally
Use: Lower conviction—may just be following market
🟠 Large Orange Triangle (Premium Short)
Condition: Breakdown + RRS < 0
Meaning: Stock breaking support WHILE underperforming benchmark
Best when: Market is strong but stock breaks down anyway = severe weakness
Use: High-conviction short entries
🔴 Small Red Triangle (Standard Breakdown)
Condition: Breakdown + RRS ≥ 0
Meaning: Breaking support but outperforming benchmark
Typical: Stock falling less than market during selloff
Use: Lower conviction—may recover when market does
Why Large Triangles Matter
Large signals show divergence = genuine institutional flow:
Stock breaking out while market falls → Aggressive buying despite headwinds
Stock breaking down while market rallies → Aggressive selling despite tailwinds
These setups reveal where real conviction lies, not just momentum-following behavior.
Quick Settings
RRS: 12-period lookback, 3-bar smoothing, vs SPY
Breakouts: 5-period pivots, 200-bar lookback, 3% zone width, 2 minimum tests
Search in scripts for "breakout"

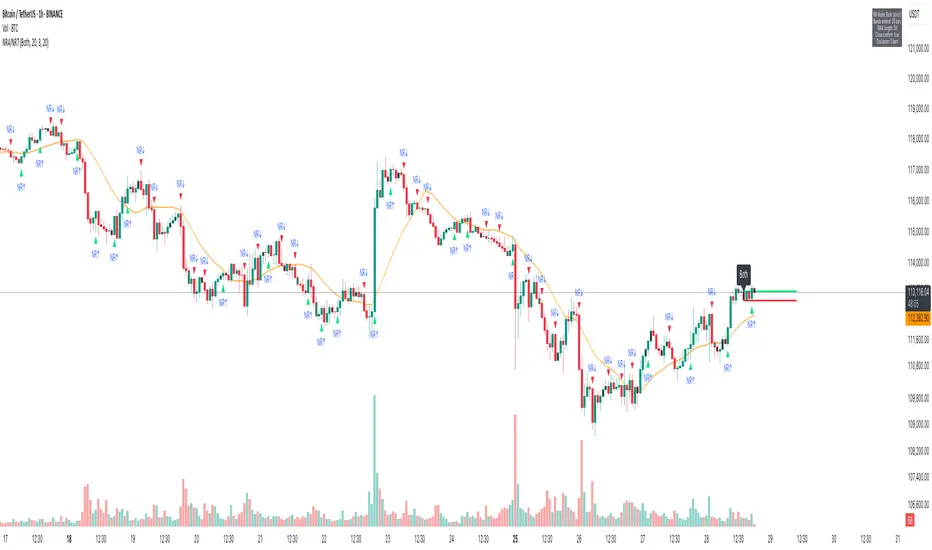
NR4/NR7 Volatility Squeeze & BreakoutsNR4/NR7 Volatility Squeeze & Breakouts
Concept
Markets often move in cycles of contraction → expansion.
The NR4 and NR7 patterns are well-known volatility contraction signals:
• NR4 : The current bar has the narrowest range (high–low) of the last 4 bars.
• NR7 : The current bar has the narrowest range of the last 7 bars.
• When both conditions align, it signals a strong volatility squeeze.
Such bars often precede s harp breakout moves , making them valuable for breakout and risk-framed trading setups.
How It Works
This script detects NR4 and NR7 bars in real time and adds several features for practical trading use:
Bar Highlighting:
• Teal = NR4, Purple = NR7, Orange = Both.
Breakout Levels:
• The High and Low of the most recent NR bar are projected forward as breakout bands.
Breakout Signals:
• Optional markers when price crosses above/below the NR High/Low.
• Configurable “close confirmation” and cooldown period to avoid duplicate signals.
SMA Filter (adjustable, default 20):
• Plotted on the chart to help traders frame bias and trend context.
Alerts:
• “NR Bar Formed”
• “Bullish Breakout”
• “Bearish Breakout”
How to Use
1. Identify Contraction:
• Watch for NR4/NR7 colored bars.
2. Plan Expansion:
• Use the High/Low of the bar as breakout reference.
3. Add Filters:
• SMA slope/position can add directional context.
• Combine with volume, VWAP, or support/resistance for stronger signals.
4. Risk Management:
• Many traders use the opposite side of the NR bar as stop placement.
Why It’s Useful
Unlike generic breakout systems, this script:
• Focuses on specific, researched volatility patterns (NR4/NR7), not just random breakouts.
• Provides a visual and systematic framework for detecting contraction → expansion phases.
• Integrates both classic price-action logic (narrow ranges) and a trend filter (SMA).
• Offers flexible alerts and cooldown so traders can adapt it to different styles (scalping, swing, intraday).
Important
This is an educational tool. It does not guarantee profitable trades. Always combine with your own market analysis and risk management.
Opening Range BreakoutOpen Range Breakout (ORB) – Trading Strategy Documentation
Definition:
The Open Range Breakout (ORB) is a short-term trading strategy that identifies the price range established during the initial period of market opening (typically the first 15 to 60 minutes) and uses the high and low of that range as key reference levels for potential breakout entries.
Components:
Open Range High: The highest price traded during the defined opening period.
Open Range Low: The lowest price traded during the same period.
Breakout Trigger: A price move above the Open Range High or below the Open Range Low, signaling potential continuation momentum.
How It Works:
Define the Opening Period: Select a time window (e.g., 30 minutes) at market open to establish the initial range.
Identify Range Boundaries: Record the high and low prices during this period.
Monitor for Breakout: Watch for price to break and close above the Open Range High (bullish breakout) or below the Open Range Low (bearish breakout).
Enter Trade: Enter long on a confirmed break above the Open Range High, or short on a break below the Open Range Low. Entry may be triggered on a retest of the broken level or with volume confirmation.
Set Stop-Loss and Target:
Stop-loss: Placed just inside the open range (e.g., below the high for long, above the low for short).
Profit target: Based on volatility (e.g., ATR multiple) or support/resistance levels.
Key Assumptions:
Early price action reflects initial market sentiment.
A breakout from this range indicates strong directional momentum likely to continue.
Best Conditions:
High liquidity markets (e.g., major indices, large-cap stocks).
Volatile or news-driven trading sessions.
Used primarily in intraday trading.
Limitations:
Prone to false breakouts during low-volume or choppy markets.
Requires strict risk management due to reliance on timing and confirmation.
Conclusion:
The ORB strategy capitalizes on early market momentum by trading breakouts from the initial price range. Its effectiveness depends on precise range definition, timely execution, and disciplined risk control.

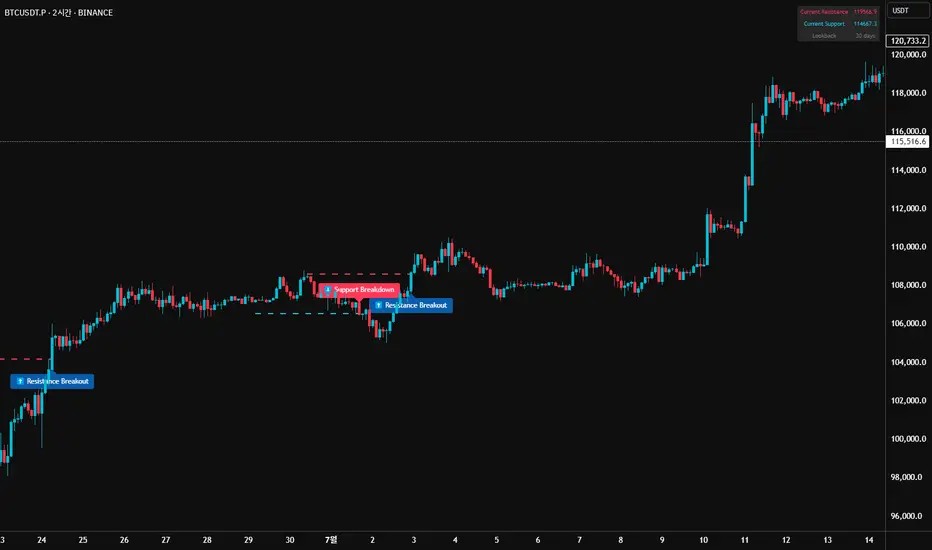
52SIGNAL RECIPE Market Structure Reversal Signals═══ 52SIGNAL RECIPE Market Structure Reversal Signals ═══
◆ Overview
52SIGNAL RECIPE Market Structure Reversal Signals is a technical indicator designed to detect structural changes in price charts and identify potential trend reversals. By tracking highs and lows over a specified period, this indicator provides clear visual signals when significant price breakouts occur, helping traders capture directional changes in the market early.
─────────────────────────────────────
◆ Key Features
• Structural Reversal Detection: Provides potential trend change signals when price breaks through recent N-day highs/lows
• Duplicate Signal Prevention: Filters out consecutive signals in the same direction
• Intuitive Visualization: Clearly distinguishes bullish/bearish reversal signals by color and position on the chart
• Confirmed Bar Based: Generates signals only after bars are completely closed, enhancing reliability
• Customizable Settings: Adjustable tracking period to optimize for various market environments and timeframes
─────────────────────────────────────
◆ Technical Foundation
■ Market Structure Analysis Principle
• High/Low Tracking: Identifies previous highs (LH) and lows (HL) over the specified period
• Structural Breakout: Interprets as structural change when closing price breaks above previous high or below previous low
• Confirmed Bar Verification: Minimizes false signals by generating signals only after the current bar has completely closed
■ Signal Filtering Mechanism
• Signal State Tracking: Prevents duplicate signals by tracking the direction of the last generated signal
• Directional Change Focus: Suppresses signals in the same direction until an opposite signal occurs
• Noise Reduction: Focuses only on important level breakouts, eliminating unnecessary signals
─────────────────────────────────────
◆ Practical Applications
■ Trend Reversal Point Identification
• Bullish Trend Starting Point:
▶ When bullish reversal signal occurs after a downtrend
▶ When upward momentum is confirmed by breaking previous high
• Bearish Trend Starting Point:
▶ When bearish reversal signal occurs after an uptrend
▶ When downward momentum is confirmed by breaking below previous low
• Range Breakout Detection:
▶ Potential trend formation signals when breaking upper/lower boundaries in a ranging market
■ Trading Strategy Application
• Trend Following Strategy:
▶ Consider buy entry when bullish reversal signal occurs
▶ Consider sell entry when bearish reversal signal occurs
• Reversal Trading:
▶ Signals occurring at support/resistance levels provide high-probability entry points
▶ Reversal signals in overbought/oversold conditions strengthen trend reversal possibility
• Risk Management:
▶ Consider closing or reducing positions when opposite signals occur
▶ Set precise stop-loss points by combining with key technical levels
─────────────────────────────────────
◆ Advanced Setting Options
■ Tracking Period (N-day) Adjustment
• Short-term Setting: 10-15 days (sensitive signals, quick reaction, suitable for short-term trading)
• Medium-term Setting: 20-30 days (balanced signals, general trend detection, recommended default)
• Long-term Setting: 40-50 days (strong filtering, detects only major trend reversals, suitable for long-term investment)
■ Timeframe Optimization
• Daily Chart: 20-30 day setting (medium-term trend change detection)
• 4-Hour Chart: 30-40 setting (short-term swing trading signals)
• Hourly Chart: 40-50 setting (intraday trend change detection)
• Intraday Chart: 10-20 setting (scalping and short-term trading)
■ Market Type Adjustment
• High Volatility Markets: Higher N values (30-50) to filter noise
• Trending Markets: Medium N values (20-30) to capture only major reversals
• Ranging Markets: Lower N values (10-20) to capture range-bound movements
─────────────────────────────────────
◆ Synergy with Other Indicators
• Moving Averages: Signal strength enhanced when Market Structure Reversal Signals align with key moving average crossovers
• RSI: Market Structure Reversal Signals occurring at overbought/oversold levels increase reversal probability
• Volume Indicators: Market Structure Reversal Signals accompanied by high volume enhance reliability
• Fibonacci Levels: Market Structure Reversal Signals occurring at key Fibonacci levels provide important turning points
• Channel Indicators: Powerful breakout confirmation when price channel upper/lower breakthroughs coincide with Market Structure Reversal Signals
─────────────────────────────────────
◆ Conclusion
52SIGNAL RECIPE Market Structure Reversal Signals objectively identifies structural changes in the market and clearly visualizes potential trend reversal points. Its simple yet powerful approach of detecting directional changes through recent N-day high/low breakouts provides flexibility applicable to various market environments and trading styles. The duplicate signal prevention mechanism and confirmed bar-based signal generation greatly enhance signal quality and reliability. When combined with other technical indicators, synergy effects can be maximized, providing traders with a valuable tool to capture market turning points early.
─────────────────────────────────────
※ Disclaimer: Past performance does not guarantee future results. Always use appropriate risk management strategies.
═══ 52SIGNAL RECIPE Market Structure Reversal Signals ═══
◆ 개요
52SIGNAL RECIPE Market Structure Reversal Signals는 가격 차트의 구조적 변화를 감지하여 잠재적인 추세 반전을 식별하는 기술적 지표입니다. 이 지표는 최근 N일 동안의 고점과 저점을 추적하여 의미 있는 가격 돌파가 발생할 때 명확한 시각적 신호를 제공함으로써, 트레이더가 시장의 방향성 변화를 조기에 포착할 수 있도록 도와줍니다.
─────────────────────────────────────
◆ 주요 특징
• 구조적 반전 탐지: 가격이 최근 N일 고점/저점을 돌파할 때 잠재적 추세 변화 신호 제공
• 중복 신호 방지: 동일한 방향의 신호가 연속으로 반복되지 않도록 필터링
• 직관적인 시각화: 상승/하락 반전 신호를 차트 상에서 색상과 위치로 명확히 구분
• 확정 봉 기반: 봉이 완전히 종료된 후에만 신호 생성하여 신뢰도 향상
• 사용자 정의 설정: 추적 기간을 조정하여 다양한 시장 환경과 타임프레임에 최적화 가능
─────────────────────────────────────
◆ 기술적 기반
■ 시장 구조 분석 원리
• 고점/저점 추적: 지정된 기간 동안의 이전 고점(LH)과 저점(HL) 식별
• 구조적 돌파: 종가가 이전 고점을 상향 돌파하거나 이전 저점을 하향 돌파할 때 구조적 변화로 해석
• 확정 봉 검증: 현재 봉이 완전히 종료된 후에만 신호 생성하여 오신호 최소화
■ 신호 필터링 메커니즘
• 신호 상태 저장: 마지막 생성된 신호의 방향을 추적하여 동일 방향 신호 중복 방지
• 방향성 전환 초점: 반대 방향 신호가 발생할 때까지 동일 방향 신호 억제
• 노이즈 감소: 중요 수준 돌파에만 집중하여 불필요한 신호 제거
─────────────────────────────────────
◆ 실용적 응용
■ 추세 전환점 식별
• 상승 추세 시작점:
▶ 하락 추세 후 상승 반전 신호 발생 시
▶ 이전 고점 돌파로 상승 모멘텀 확인 시
• 하락 추세 시작점:
▶ 상승 추세 후 하락 반전 신호 발생 시
▶ 이전 저점 이탈로 하락 모멘텀 확인 시
• 범위 돌파 감지:
▶ 횡보 시장에서 상/하 경계 돌파 시 잠재적 추세 형성 신호
■ 트레이딩 전략 적용
• 추세 추종 전략:
▶ 상승 반전 신호 발생 시 매수 진입 고려
▶ 하락 반전 신호 발생 시 매도 진입 고려
• 반전 트레이딩:
▶ 지지/저항 수준에서 반전 신호 발생 시 높은 확률의 진입점 제공
▶ 과매수/과매도 상태에서의 반전 신호는 추세 전환 가능성 강화
• 리스크 관리:
▶ 반대 방향 신호 발생 시 포지션 종료 또는 축소 고려
▶ 주요 기술적 수준과 결합하여 정밀한 손절점 설정 가능
─────────────────────────────────────
◆ 고급 설정 옵션
■ 추적 기간(N일) 조정
• 단기 설정: 10-15일 (민감한 신호, 빠른 반응, 단기 트레이딩에 적합)
• 중기 설정: 20-30일 (균형 잡힌 신호, 일반적 추세 감지, 기본 권장)
• 장기 설정: 40-50일 (강한 필터링, 주요 추세 전환만 감지, 장기 투자에 적합)
■ 타임프레임별 최적화
• 일봉 차트: 20-30일 설정 (중기 추세 변화 감지)
• 4시간 차트: 30-40 설정 (단기 스윙 트레이딩 신호)
• 시간봉 차트: 40-50 설정 (일중 추세 변화 감지)
• 일중 차트: 10-20 설정 (스캘핑 및 단기 거래)
■ 시장 유형별 조정
• 변동성 높은 시장: 높은 N값 (30-50) 설정으로 노이즈 필터링
• 추세 시장: 중간 N값 (20-30) 설정으로 주요 반전만 포착
• 횡보 시장: 낮은 N값 (10-20) 설정으로 범위 내 움직임 포착
─────────────────────────────────────
◆ 다른 지표와의 시너지
• 이동평균선: Market Structure Reversal Signals 신호와 주요 이동평균선 교차 지점이 일치할 때 신호 강화
• RSI: 과매수/과매도 수준에서의 Market Structure Reversal Signals 신호는 반전 가능성 높임
• 볼륨 지표: 높은 볼륨과 함께 발생하는 Market Structure Reversal Signals 신호는 신뢰도 향상
• 피보나치 레벨: 주요 피보나치 레벨에서 발생하는 Market Structure Reversal Signals 신호는 중요한 전환점 제공
• 채널 지표: 가격 채널의 상단/하단 돌파와 Market Structure Reversal Signals 신호 일치 시 강력한 돌파 확인
─────────────────────────────────────
◆ 결론
52SIGNAL RECIPE Market Structure Reversal Signals는 시장의 구조적 변화를 객관적으로 식별하여 잠재적인 추세 전환점을 명확하게 시각화합니다. 최근 N일 고점/저점 돌파를 통해 방향성 변화를 감지하는 단순하면서도 강력한 접근 방식은 다양한 시장 환경과 트레이딩 스타일에 적용할 수 있는 유연성을 제공합니다. 중복 신호 방지 메커니즘과 확정 봉 기반 신호 생성은 신호의 품질과 신뢰성을 크게 향상시킵니다. 다른 기술적 지표와 결합하여 사용할 때 시너지 효과를 극대화할 수 있으며, 트레이더에게 시장의 전환점을 조기에 포착할 수 있는 귀중한 도구를 제공합니다.
─────────────────────────────────────
※ 면책 조항: 과거 성과가 미래 결과를 보장하지 않습니다. 항상 적절한 리스크 관리 전략을 사용하세요.
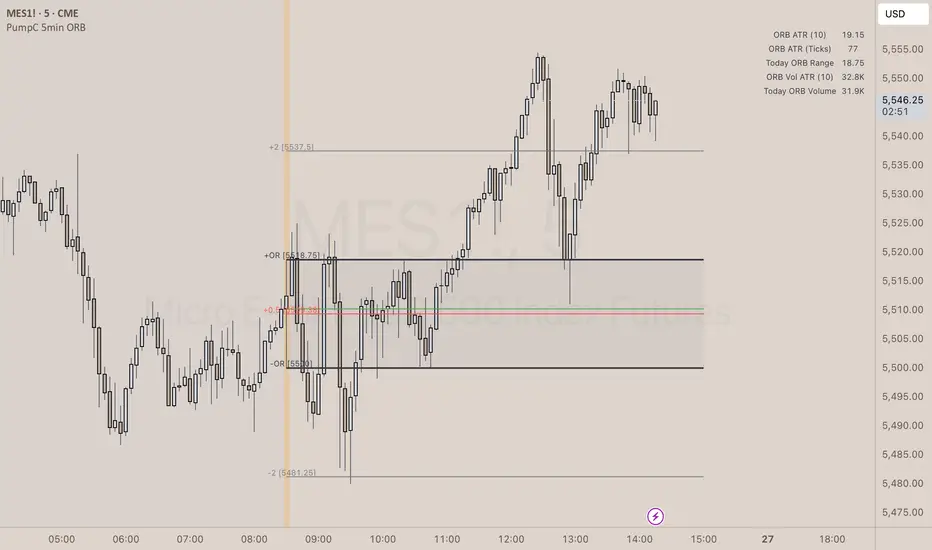
PumpC Opening Range Breakout (ORB) 5min Range📄 PumpC ORB 5-Minute Opening Range Breakout Indicator
✨ Overview
The PumpC ORB 5-Minute Opening Range Breakout indicator captures early session price action by tracking the high, low, and open of a defined 5-minute window at market open (customized for Futures or Stocks).
It plots breakout levels, extension targets, average range calculations, volume tracking, and provides visual and table-based data summaries.
This indicator is designed for traders seeking a complete, clean visualization of Opening Range Breakouts (ORB) with flexible customization.
⚙️ Main Features
Opening Range Box (ORB Box) Draws a box around the high and low of the first 5-minute session (8:30–8:35 ET for Futures, 9:30–9:35 ET for Stocks). Box extends from the session open to the session close (4:00 PM ET). Option to enable/disable historical boxes. Box color and opacity are customizable. Core ORB Levels Open Level: Plots the open price of the 5-minute ORB window. ORB Levels: Plots breakout levels at multiples: +0.5x the range +1.5x the range (customizable factor) Each level has independent color settings and visibility toggles. Option to show or hide historic extension levels. Table Display Compact table in the top-right corner showing: ORB ATR (average range) ORB ATR in ticks Today's ORB range ORB Volume ATR (average volume during ORB) Today's ORB Volume Volume is formatted automatically into "K" (thousands) or "M" (millions) for readability. Background Highlights After the ORB window closes: Blue highlight if today's ORB range is greater than the 10-day ATR average. Orange highlight if today's ORB range is smaller than the 10-day ATR average. Helps quickly assess relative strength or weakness compared to historical behavior. Alerts Breakout Confirmations: Fires when price closes above ORB High or below ORB Low. Fallout Traps: Alerts when price wick crosses ORB High/Low but closes back inside the range. Alerts use clean titles and simple messages for easy identification.
🔧 Inputs and Customization
Mode Toggle: Choose between Futures (8:30 ET open) or Stocks (9:30 ET open). Show/Hide Labels: Control label visibility for ORB and extension levels. Line Width Control: Customize thickness for ORB lines and extension levels. ORB Level Level Visibility: Independently enable or disable each extension line. Table Appearance: Customize table background color, font color, and padding. ORB Box Settings: Customize box color and control whether historical boxes are drawn.
📚 How to Use
Select Mode: Choose Futures or Stocks depending on your instrument. Observe the Opening Range: Focus on the ORB High and ORB Low during the first 5 minutes after the open. Monitor Breakouts: Breakout alerts will fire when price closes outside the ORB range, signaling potential continuation. Watch for Fallout Traps: Fallout alerts signal when price briefly wicks above/below but closes back inside the ORB range. Use Table Metrics: Instantly compare today's ORB range and volume versus historical averages to assess session strength or weakness.
🛡️ Notes
Best used on the 1-minute or 5-minute chart for intraday trading. Ensure your TradingView chart time zone is set to New York for correct functioning. Alerts must be manually configured after adding the indicator to your chart.
Bullish and Bearish Breakout Alert for Gold Futures PullbackBelow is a Pine Script (version 6) for TradingView that includes both bullish and bearish breakout conditions for my intraday trading strategy on micro gold futures (MGC). The strategy focuses on scalping two-legged pullbacks to the 20 EMA or key levels with breakout confirmation, tailored for the Apex Trader Funding $300K challenge. The script accounts for the Daily Sentiment Index (DSI) at 87 (overbought, favoring pullbacks). It generates alerts for placing stop-limit orders for 175 MGC contracts, ensuring compliance with Apex’s rules ($7,500 trailing threshold, $20,000 profit target, 4:59 PM ET close).
Script Requirements
Version: Pine Script v6 (latest for TradingView, April 2025).
Purpose:
Bullish: Alert when price breaks above a rejection candle’s high after a two-legged pullback to the 20 EMA in a bullish trend (price above 20 EMA, VWAP, higher highs/lows).
Bearish: Alert when price breaks below a rejection candle’s low after a two-legged pullback to the 20 EMA in a bearish trend (price below 20 EMA, VWAP, lower highs/lows).
Context: 5-minute MGC chart, U.S. session (8:30 AM–12:00 PM ET), avoiding overbought breakouts above $3,450 (DSI 87).
Output: Alerts for stop-limit orders (e.g., “Buy: Stop=$3,377, Limit=$3,377.10” or “Sell: Stop=$3,447, Limit=$3,446.90”), quantity 175 MGC.
Apex Compliance: 175-contract limit, stop-losses, one-directional news trading, close by 4:59 PM ET.
How to Use the Script in TradingView
1. Add Script:
Open TradingView (tradingview.com).
Go to “Pine Editor” (bottom panel).
Copy the script from the content.
Click “Add to Chart” to apply to your MGC 5-minute chart .
2. Configure Chart:
Symbol: MGC (Micro Gold Futures, CME, via Tradovate/Apex data feed).
Timeframe: 5-minute (entries), 15-minute (trend confirmation, manually check).
Indicators: Script plots 20 EMA and VWAP; add RSI (14) and volume manually if needed .
3. Set Alerts:
Click the “Alert” icon (bell).
Add two alerts:
Bullish Breakout: Condition = “Bullish Breakout Alert for Gold Futures Pullback,” trigger = “Once Per Bar Close.”
Bearish Breakout: Condition = “Bearish Breakout Alert for Gold Futures Pullback,” trigger = “Once Per Bar Close.”
Customize messages (default provided) and set notifications (e.g., TradingView app, SMS).
Example: Bullish alert at $3,377 prompts “Stop=$3,377, Limit=$3,377.10, Quantity=175 MGC” .
4. Execute Orders:
Bullish:
Alert triggers (e.g., stop $3,377, limit $3,377.10).
In TradingView’s “Order Panel,” select “Stop-Limit,” set:
Stop Price: $3,377.
Limit Price: $3,377.10.
Quantity: 175 MGC.
Direction: Buy.
Confirm via Tradovate.
Add bracket order (OCO):
Stop-loss: Sell 175 at $3,376.20 (8 ticks, $1,400 risk).
Take-profit: Sell 87 at $3,378 (1:1), 88 at $3,379 (2:1) .
Bearish:
Alert triggers (e.g., stop $3,447, limit $3,446.90).
Select “Stop-Limit,” set:
Stop Price: $3,447.
Limit Price: $3,446.90.
Quantity: 175 MGC.
Direction: Sell.
Confirm via Tradovate.
Add bracket order:
Stop-loss: Buy 175 at $3,447.80 (8 ticks, $1,400 risk).
Take-profit: Buy 87 at $3,446 (1:1), 88 at $3,445 (2:1) .
5. Monitor:
Green triangles (bullish) or red triangles (bearish) confirm signals.
Avoid bullish entries above $3,450 (DSI 87, overbought) or bearish entries below $3,296 (support) .
Close trades by 4:59 PM ET (set 4:50 PM alert) .

MACD Crossover Breakout Rays with VWAP & Breakout ConfirmationOverview
This script is designed to highlight potential strong breakout moves by combining MACD crossovers, VWAP confirmation, and price action breakouts. It helps traders identify momentum shifts and filter high-probability trade setups.
How It Works
1. MACD Crossover Detection
- The script detects bullish crossovers (MACD line crossing above the signal line) and bearish crossovers (MACD line crossing below the signal line).
- A horizontal ray is drawn at the high (bullish) or low (bearish) of the crossover candle.
2. Multi-Timeframe MACD Confirmation
- A secondary MACD crossover is checked on a lower timeframe (default: 5 minutes) to confirm the strength of the move.
- The script ensures alignment between the primary and lower timeframe MACD crossovers before signaling a strong move.
3. VWAP Confirmation
- A bullish breakout is valid only if the price is above the VWAP.
- A bearish breakout is valid only if the price is below the VWAP.
4. Breakout Validation
- The script waits for price action confirmation—a breakout is only valid when a candle closes above (bullish) or below (bearish) the horizontal ray.
- Once confirmed, the ray color changes to blue to signal a strong move.
5. Label Alerts for Strong Moves
- When all conditions align, the script prints "STRONG 💪 MOVE" above or below the breakout candle.
- The previous label is automatically removed to keep the chart clean.
Customization Options
- MACD Settings: Adjust fast/slow lengths and signal smoothing.
- Lower Timeframe Confirmation: Choose a different timeframe for multi-timeframe MACD validation.
- VWAP Filtering: Ensure breakouts align with volume-weighted trends.
- Ray Length & Colors: Customize the horizontal ray length, width, and colors.
- Breakout Confirmation Window: Adjust how many bars to check for MACD alignment.
Best Use Cases
✅ Identifying high-probability breakouts with trend confirmation.
✅ Filtering out false signals by requiring multi-timeframe agreement.
✅ Helping traders stay in momentum-driven moves with strong confirmation.
⚠ Note: This script is for educational purposes only and does not constitute financial advice. Always conduct your own analysis before making trading decisions.

Mark Minervini + Pocket Pivot Breakout
MARK MINERVINI + POCKET PIVOT BREAKOUT INDICATOR
The Mark Minervini + Pocket Pivot Breakout indicator is a versatile tool designed for technical analysis. It combines principles from Mark Minervini’s trading strategy with Pocket Pivot Breakout patterns. This custom indicator highlights potential breakout opportunities based on specific criteria, helping traders identify stocks that meet both the trend-following conditions of Minervini’s methodology and the momentum-driven Pocket Pivot Breakout setup.
---------------------------------------------------------------------------------------------------------------------
MARK MINERVINI CRITERIA
The indicator evaluates the stock based on Minervini’s set of rules, which include:
Price above key moving averages:
Close > EMA50
Close >= EMA150
Close >= EMA200
EMA crossovers:
EMA50 > EMA150
EMA50 > EMA200
EMA150 >= EMA200
Price relative to 52-week range:
Close > 30% of 52-week low
Close within 25% of 52-week high
EMA200 relative to one month ago:
EMA200 > EMA200 one month ago
IMPORTANCE OF THIS TEMPLATE
How to Pinpoint Stage 2
As I’ve stated, history clearly shows that virtually every superperformance stock was in a definite uptrend before experiencing its big advances. In fact, 99 percent of superperformance stocks traded above their 200-day moving averages before their huge advance, and 96 percent traded above their 50-day moving averages.
I apply the Trend Template criteria (see below) to every single stock I’m considering. The Trend Template is a qualifier. If a stock doesn’t meet the Trend Template criteria, I don’t consider it. Even if the fundamentals are compelling, the stock must be in a long-term uptrend—as defined by the Trend Template—for me to consider it as a candidate. Without identifying a stock’s trend, investors are at risk of going long when a stock is in a dangerous downtrend, going short during an explosive uptrend, or tying up capital in a stock lost in a sideways neglect phase. It’s important to point out that a stock must meet all eight of the Trend Template criteria to be considered in a confirmed stage 2 uptrend.- By MARK MINERVINI
---
POCKET PIVOT VOLUME & GAP-UP DETECTION
1. Pocket Pivot Volume
The Pocket Pivot Volume indicator displays a blue arrow below the candle if:
- The stock's price rises more than 3% from the open.
- The day's volume exceeds the highest red volume of the past 10 days (as per the 'Pocket Pivot' concept by Gil Morales & Chris Kacher).
If only one condition is met, no arrow appears.
How to Use:
- Use the blue arrow as a buy signal when a stock breaks out from a proper base (e.g., cup & handle, Darvas box).
- For existing positions, it signals a continuation buy opportunity.
- Avoid entries if the stock is too extended from the 10-day moving average (10MA).
---
2. Gap-Up Detection (>0.5%)
A blue candle appears when a stock gaps up by more than 0.5% from the previous close. This indicator is off by default and can be enabled in settings.
How to Use:
- A strong close on a gap-up day indicates strength.
- Use it alongside proper base breakouts from tight consolidations.
- Avoid entries if the stock is extended from the 10MA.
---
Precautions & Key Points
- Avoid long entries in weak market conditions or below the 200MA.
- Prioritize fundamentally strong stocks with solid earnings, margins, and sales growth.
- Buy breakouts from well-formed bases for optimal setups.
----------------------------------------------------------------------------------------------------------------
CUSTOMIZABLE TABLE DISPLAY
Displays a table with the results of the Minervini conditions (whether each condition is met or not).
The table can be customized to show the title, position (top, center, bottom), and other visual features.
Mini Mode : When enabled, the table only displays the title when all conditions are met.
BACKGROUND CANDLE HIGHLIGHT
The chart background will be highlighted in a custom color whenever all of the Mark Minervini conditions are satisfied. (Adjust the transparency and color in setting)
This provides a quick visual cue of potential trades.
ALERTS
Alerts are set up for the following conditions:
Mark Minervini Passed: When all of Mark Minervini’s conditions are met.
Pocket Pivot Breakout: When a Pocket Pivot pattern is detected.
Gap-Up Alert: When a gap-up bar appears on the chart.
CUSTOMIZABLE INPUTS
TABLE CUSTOMIZATION
Vertical Position: Choose from "Top", "Center", or "Bottom".
Horizontal Position: Choose from "Left", "Center", or "Right".
MINI MODE
Enable or disable Mini Mode to show only the table title when all conditions are met.
CANDLE HIGHLIGHT COLOR
Select a custom color to highlight candles that meet all the conditions.
POCKET PIVOT SETTINGS
Barsize: Adjust the minimum percentage change for considering a green day.
Pocket Pivot Lookback Days: Specify the number of days to look back for Pocket Pivot patterns.
Gap-up Bar: Option to detect gap-up bars.
Gap-up Value: Set the minimum gap percentage to trigger a gap-up condition.
CONCLUSION
This indicator combines technical analysis with a specific focus on Mark Minervini’s strategies and Pocket Pivot breakouts, providing a comprehensive tool for traders looking for growth stocks with momentum. It offers flexibility in terms of display, customization, and alerts, allowing traders to tailor it to their specific trading style.

Time-Weighted Price Action IndicatorThe Time-Weighted Price Action Indicator is a simple yet effective tool designed to detect consolidation zones based on time duration and highlight potential reversal points using a contrarian breakout logic. Instead of following traditional breakout strategies, this indicator aims to capitalize on false breakouts and reversal entries.
How It Works
• The indicator identifies a price range (zone) using a configurable lookback period.
• If the price remains within this range for a specified number of bars (threshold), a consolidation zone is confirmed.
• Once a breakout or breakdown from this zone occurs, the indicator triggers a reversed signal — suggesting a potential reversal instead of a trend-following entry.
• Support and resistance levels are marked visually, and BUY/SELL labels are plotted when price re-enters the zone, indicating potential exhaustion or traps.
Key Features
• ✅ Time-based consolidation detection
• ✅ Contrarian signal logic (Buy at breakdowns, Sell at breakouts)
• ✅ Dynamic zone plotting with support/resistance visualization
• ✅ Auto-reset after each breakout for fresh zone detection
• ✅ Visual labels and alerts for BUY/SELL signals
How to Use
• Ideal for range-bound markets or identifying trap zones around support/resistance.
• Use in conjunction with volume, momentum, or trend filters to refine entries.
• Can complement mean reversion strategies or be used as a signal confirmation tool.
Why This Combination?
This approach blends time-based consolidation logic with a contrarian price action perspective, offering traders a different lens to analyze markets. Instead of blindly following breakouts, it highlights areas where price rejections and false breakouts often occur — common in algorithm-driven markets.
Why It’s Worth Using
This indicator helps you stay ahead of trap zones, identify reversal spots, and understand price behavior in consolidation zones — a critical edge, especially in sideways or choppy markets. It adds context to price movement, helping traders avoid common breakout failures.
Note:
• No performance guarantees or exaggerated claims.
• No solicitation or promotional language used.
• This is a free, open-source educational tool meant to aid price action understanding.

TrendPredator ESThe TrendPredator Essential (ES)
Stacey Burke, a seasoned trader and mentor, developed his trading system over the years, drawing insights from influential figures such as George Douglas Taylor, Tony Crabel, Steve Mauro, and Robert Schabacker. His popular system integrates select concepts from these experts into a consistent framework. While powerful, it is highly discretionary, requiring significant real-time analysis, which can be challenging for novice traders.
The TrendPredator ES indicator supports this approach by automating the essential analysis required to trade the system effectively and incorporating a mechanical bias and multi-timeframe concept.
It provides value to traders by significantly reducing the time needed for session preparation and offering relevant chart analysis and signals for live trading through real-time updates and a unique consolidated table format.
The Stacey Burke Master Pattern
Inspired by Taylor’s 3-day cycle and Steve Mauro’s work with “Beat the Market Maker,” Burke’s system views markets as cyclical, driven by the manipulative patterns of market makers. These patterns often trap traders at the extremes of moves above or below significant levels with peak formations, then reverse to utilize their liquidity, initiating the next phase. Breakouts away from these traps often lead to range expansions, as described by Tony Crabel and Robert Schabacker. After multiple consecutive breakouts, especially after the psychological number three, overextension might develop. A break in structure may then lead to reversals or pullbacks. Burke’s system is designed to track these cycles on the daily timeframe and provides signals and trade setups to navigate along them.
Bias Logic and Multi-Timeframe Concept
The indicator covers the basic signals of his system:
- First Red Day (FRD): Bearish break in structure, signalling weak longs in the market.
- First Green Day (FGD): Bullish break in structure signalling weak shorts in the markt.
- Three Days of Longs (3DL): Overextension signalling potential weak longs in the market.
- Three Days of Shorts (3DS): Overextension signalling potential weak shorts in the market.
- Inside Day (ID): Contraction, signalling potential impulsive reversal or range expansion move.
It enhances the original system by introducing:
Structured Bias Logic:
Tracks bias by following how price trades concerning the last previous candle high or low that was hit. For example if the high was hit, we are bullish above and bearish below.
- Bullish state: Breakout (BO), Fakeout Low (FOL)
- Bearish state: Breakdown (BD), Fakeout High (FOH)
Multi-Timeframe Perspective:
- Tracks all signals across H4, H8, D, W, and M timeframes, to look for alignment and follow trends and momentum in a mechanical way.
The indicator monitors the bias and signals of the system across all relevant timeframes and automates the related graphical chart analysis to generate the information needed for the trader to identify key setups. Additional to the SB pattern, the system helps to identify the higher timeframe situation and follow the moves driven by other timeframe traders.
Example: Full Bullish Cycle on the Daily Timeframe with Signals
- The Trap/Peak Formation
The market breaks down from a previous day’s and maybe week’s low—potentially after multiple breakdowns—but fails to move lower and pulls back up to form a peak formation low and closes as a first green day.
Signal: Bullish daily and weekly fakeout low; three consecutive breakdown days (1W Curr FOL, 1D Curr FOL, BO 3S).
- Pullback and Consolidation
The next day pulls further up after first green day signal, potentially consolidates inside the previous day’s range.
Signal: Fakeout low and first green day closing as an inside day (1D Curr IS, Prev FOL, First G).
- Range Expansion/Trend
The following day breaks up through the previous day’s high, launching a range expansion away from the trap.
Signal: Bullish daily breakout of an inside day (1D Curr BO, Prev IS).
- Overextension
After multiple consecutive breakouts, the market reaches a state of overextension, signalling a possible reversal or pullback.
Signal: Three days of breakout longs (1D Curr BO, Prev BO, BO 3L).
Note: This is only one possible scenario; there are many variations and combinations.
Example Chart: Full Bullish Cycle with Correlated Signals
Note: The signals shown along the move are manually added illustrations. The indicator shows these in realtime in the table at the bottom right. This is only one possible scenario; there are many variations and combinations.
Due to the fractal nature of markets, this cycle can be observed across timeframes. The strongest setups show multi-timeframe alignment. For example, a peak formation and potential reversal on the daily timeframe has high probability and follow-through if it also aligns with bearish signals on higher timeframes (e.g., weekly/monthly BD/FOH) and confirmation on lower timeframes (H4/H8 FOH/BD). With this perspective the system enables the trader to follow the trend and momentum and identify rollover points in a very differentiated way.
Detailed Features and Options
1. Historic Highs and Lows
Displays historic highs and lows per timeframe for added context, enabling users to track sequences over time.
Timeframes: H4, H8, D, W, M
Options: Customize for timeframes shown, number of historic candles per timeframe, colors, formats, and labels.
2. Previous High and Low Extensions
Displays extended previous levels (high, low, and close) for each timeframe to assess how price trades relative to these levels.
H4: P4H, P4L, P4C
H8: P8H, P8L, P8C
Daily: PDH, PDL, PDC
Weekly: PWH, PWL, PWC
Monthly: PMH, PML, PMC
Options: Fully customizable for timeframes shown, colors, formats, and labels.
3. Breach Lines
Tracks live market reactions (e.g., breakouts or fakeouts) per timeframe for the last previous high or low that was hit, highlighting these levels originating at the breached candle to indicate bias (color-coded).
Red: Bearish below
Green: Bullish above
H4: 4FOL, 4FOH, 4BO, 4BD
H8: 8FOL, 8FOH, 8BO, 8BD
D: dFOL, dFOH, dBO, dBD
W: wFOL, wFOH, wBO, wBD
M: mFOL, mFOH, mBO, mBD
Options: Fully customizable for timeframes shown, colors, formats, and labels.
4. Multi-Timeframe Table
Provides a real-time view of system signals, including:
Current Timeframe (Curr): Bias states.
- Breakout (green BO): Bullish after breaking above the previous high.
- Fakeout High (red FOH): Bearish after breaking above the previous high but pulling back down.
- Breakdown (red BD): Bearish after breaking below the previous low.
- Fakeout Low (green FOL): Bullish after breaking below the previous low but pulling back up.
- Inside (IS): Price trading neutral inside the previous range, taking the previous bias (color indicates the previous bias).
Previous Timeframe (Prev): Tracks last candle bias state and transitions dynamically.
- Bias for last candle: BO, FOH, BD, FOL in respective colors.
- Inside bar (yellow IS): Indicated as standalone signal.
Note: Also previous timeframes get constantly updated in real time to track the bias state in relation to the level that was hit. This means a BO can still lose the level and become a FOH, and vice versa, and a BD can still become a FOL, and vice versa. This is critical to see for example if traders that are trapped in that timeframe with a FOH or FOL are released. An inside bar stays fixed, though, since no level was hit in that timeframe.
Breakouts (BO): Breakout count 3 longs and 3 shorts.
- 3 Longs (red 3L): Bearish after three breakouts without hitting a previous low.
- 3 Shorts (green 3S): Bullish after three breakdowns without hitting a previous high.
First Countertrend Close (First): Tracks First Red or Green Day.
- First Green (G): After two consecutive red closes.
- First Red (R): After two consecutive green closes.
Options: Customizable font size and label colors.
Overall Options:
Toggle single feature groups on/off.
Customize H8 open/close time as an offset to UTC to be provider independent.
Colour settings for dark or bright backgrounds.
Using the Indicator for Trading
The automated analysis provided by the indicator can be used for thesis generation in preparation for a session as well as for live trading, leveraging the real-time updates. It is recommended to customize the settings accordingly, such as hiding the lower timeframes for thesis generation to keep the charts clean.
1. Setup Identification:
Follow the bias of daily and H8 timeframes. A setup always requires alignment of these.
Setup Types:
- Trend Trade: Trade in alignment with the previous day’s trend.
Example: Price above the previous day’s high → Focus on long setups (dBO, H8 FOL) until overextension or reversal signs appear (H8 BO 3L, First R).
- Reversal Trade: Identify reversal setups when lower timeframes show rollovers after higher timeframe weakness.
Example: Price below the previous day’s high after FOH → Look for reversal signals at the current high of day (H8 FOH, BO 3L, First R).
2. Context Assessment:
Evaluate alignment of higher timeframes (e.g., Month/Week, Week/Day). More alignment → Stronger setups. Conflicting situations → Setups invalidated.
3. Entry Confirmation:
Confirm entries based on H8 and H4 alignment and candle closes (e.g., M15 or M5 close after entering setup zone as confirmation).
Example Chart for Reversal Trade:
1. Setup Identification: FOH continuation after BO 3L overextension, confirmed by H8 FOH, First R.
2. Context Assessment: Month in FOL with bearish First R; Week in BO but bearishly overextended with BO 3L.
3. Entry Confirmation: H4 BD, M5 close.
Further recommendations:
- Higher timeframe context: TPO or volume profile indicators can be used to gain an even better overview.
- Entry confirmation: Momentum indicators like VWAP, Supertrend, or EMA are helpful for increasing precision. Additionally, tracking lower timeframe fakeouts can provide powerful confluence.
- Late session trading: Entries later in the session, such as during the 3rd hour of the NY session, offer better analysis and follow-through on setups.
Limitations:
Data availability using TradingView has its limitations. The indicator leverages only the real-time data available for the specific timeframe being used. This means it cannot access data from timeframes lower than the one displayed on the chart. For example, if you are on a daily chart, it cannot use H8 data. Additionally, on very low timeframes, the historical availability of data might be limited, making higher timeframe signals unreliable.
To address this, the indicator automatically hides the affected columns in these specific situations, preventing false signals.
Disclaimer
This indicator is for educational purposes only and does not guarantee profits.
None of the information provided shall be considered financial advice.
The indicator does not provide final buy or sell signals but highlights zones for potential setups.
Users are fully responsible for their trading decisions and outcomes.

Support and Resistance Breakouts By RICHIESupport and resistance are fundamental concepts in technical analysis used to identify price levels on charts that act as barriers, preventing the price of an asset from getting pushed in a certain direction. Here’s a detailed description of each and how breakout strategies are typically used:
Support
Support is a price level where a downtrend can be expected to pause due to a concentration of demand. As the price of an asset drops, it hits a level where buyers tend to step in, causing the price to rebound.
Support Level Identification: Support levels are identified by looking at historical data where prices have repeatedly fallen to a certain level but have then rebounded.
Strength of Support: The more times an asset price hits a support level without breaking below it, the stronger that support level is considered to be.
Resistance
Resistance is a price level where an uptrend can be expected to pause due to a concentration of selling interest. As the price of an asset increases, it hits a level where sellers tend to step in, causing the price to drop.
Resistance Level Identification: Resistance levels are identified by looking at historical data where prices have repeatedly risen to a certain level but have then fallen back.
Strength of Resistance: The more times an asset price hits a resistance level without breaking above it, the stronger that resistance level is considered to be.
Breakouts
A breakout occurs when the price moves above a resistance level or below a support level with increased volume. Breakouts can be significant because they suggest a change in supply and demand dynamics, often leading to strong price movements.
Breakout Above Resistance: Indicates a bullish market sentiment. Traders often interpret this as a sign to enter a long position (buy).
Breakout Below Support: Indicates a bearish market sentiment. Traders often interpret this as a sign to enter a short position (sell).
Breakout Trading Strategies
Confirmation: Wait for a candle to close beyond the support or resistance level to confirm the breakout.
Volume: Increased volume on a breakout adds credibility, suggesting that the price move is supported by strong buying or selling interest.
Retest: Sometimes, after a breakout, the price will return to the breakout level to test it as a new support or resistance. This retest offers another entry point.
Stop-Loss: Place stop-loss orders just below the resistance (for long positions) or above the support (for short positions) to limit potential losses in case of a false breakout.
Take-Profit: Identify target levels for taking profits. These can be set based on previous support/resistance levels or using tools like Fibonacci retracements.

Daily Pivots with Fakeout Protection█ OVERVIEW
The "Daily Pivots with Fakeout Protection" indicator is a powerful tool designed to help traders identify potential price breakouts and pivot levels on daily charts. This indicator calculates and displays daily pivot points along with breakout lines that are adjusted to provide a certain level of protection against fakeouts, which are false price movements that can mislead traders.
█ FEATURES
• Pivot Timeframe Selection: You can choose the timeframe for the pivot calculations. The default is set to daily (D), but you have the flexibility to select other timeframes as well.
• Fakeout Protection: A percentage-based parameter allows you to define the amount of protection you want against fakeouts. This helps filter out potentially unreliable breakouts.
• Bullish and Bearish Signals: The indicator distinguishes between bullish and bearish conditions by comparing the closing price to the daily high and low.
• Breakout Signals: Triangular symbols (upward and downward) appear below and above bars to signal potential breakout points. These are based on the closing price crossing the adjusted breakout lines.
• Visual Representation: Pivot points, daily high, and daily low are plotted on the chart, with distinctive line styles and colors for easy identification.
• Background Highlighting: The background color of the chart changes when a new period begins, helping you quickly recognize the start of a new trading day.
• Color-Coded Zones: The indicator colors the background around the closing price differently based on whether the market is bullish (green) or bearish (red).
█ HOW TO USE
1 — Apply the "Daily Pivots with Fakeout Protection" indicator to your TradingView chart.
2 — Customize the parameters like pivot timeframe and fakeout protection percentage according to your trading preferences.
3 — Watch for the triangular breakout symbols that appear above and below bars, indicating potential breakout points.
4 — Keep an eye on the pivot points, daily high, and daily low lines to understand price levels relevant to the current trading day.
5 — Use the background color changes to quickly identify the beginning of a new trading day and any potential shifts in market sentiment.
Note:
• This indicator is designed for daily charts but can be adjusted to work with other timeframes as well.
• Be cautious of relying solely on breakout signals; consider using additional technical and fundamental analysis for confirmation.
Start integrating the "Daily Pivots with Fakeout Protection" indicator into your trading strategy to enhance your ability to identify breakouts and pivot levels more effectively.

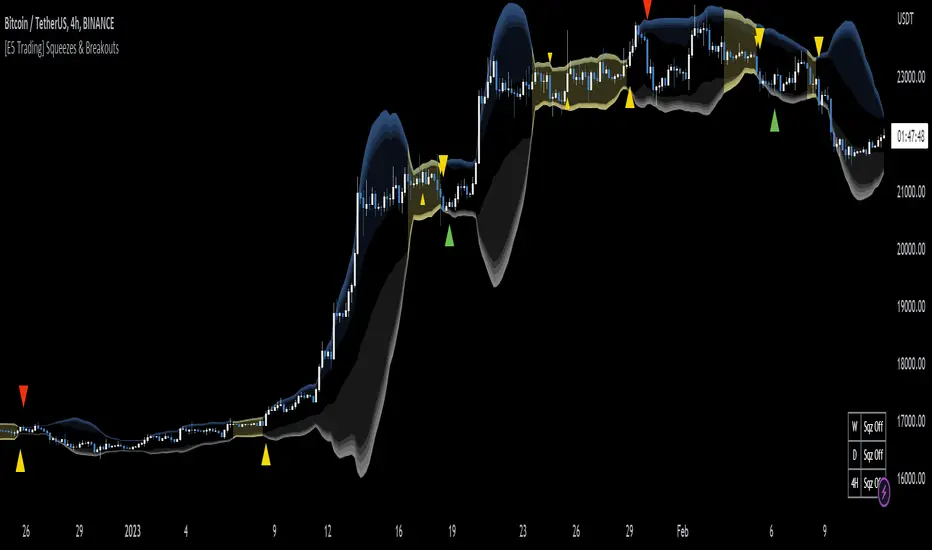
[E5 Trading] Squeezes & BreakoutsE5 Trading Squeezes & Breakouts is a powerful indicator that works well on all timeframes with proper risk management.
Squeezes occur when an asset's price volatility falls to statistically low levels.
Breakouts from the squeeze are typically violent and potentially highly profitable if the trader can get in the trade early and catch the breakout in the right direction.
E5 Trading Squeezes & Breakouts was built to help traders take advantage of these squeeze play opportunities.
Squeezes Visualization
This indicator lets traders know whenever price action is in a squeeze for any asset on any timeframe.
Volatility bands display on the chart along with colored squeeze bands and channel fills.
Toggle (Squeeze Bands) to display "the squeeze" when price action is in a low-volatility range. Default (On).
The color setting of the squeeze bands controls the color of the channel fill and the squeeze table in the lower-right corner of the chart.
Volatility Bands
Gradient shading represents reversal zones based on Bollinger Bands (BB).
The likelihood of price reversion towards the mean (i.e., basis) increases the further price action pushes into the darker shaded zones.
The middle area inside the shaded bands (i.e., same color as chart background) is the Keltner channel.
The Keltner channel is another volatility-based method used to identify breakouts and mean reversion trading opportunities.
Keltner channel boundaries calculate using the exponential moving average (EMA) and average true range (ATR).
Toggle (Volatility Basis) to display the basis line (i.e., mean) of the volatility bands. Default (Off).
Squeeze Table
The Squeeze Table appears in the lower right-hand corner of each chart when the indicator is turned on.
The squeeze table displays the squeeze status on the current timeframe plus the commonly used higher timeframes for each asset.
The squeeze table will indicate “Sqz On” next to the respective timeframe whenever a squeeze is occurring. The timeframes available in the squeeze table are 5m, 15m, 1H, 4H, D, and W.
Squeeze Early Entry & Breakout Signals
Squeeze Early Entry and Breakout Signals can only occur once price action has started a squeeze.
Pay attention to assets that are currently in a squeeze and be ready to take action because explosive price moves are coming soon!
Traders should use a stop-loss on every trade because squeeze fake-outs occur; however, the upside potential of squeeze breakouts that work out can be massive.
Preserve capital with good risk management and ride the winners.
Squeeze Early Entry
Toggle (Squeeze Early Entry) to display long and short trade entry signals that offer a clue about the potential squeeze breakout direction.
These early entry signals provide traders with an opportunity to start building a position while in a low-volatility squeeze in anticipation of a violent breakout.
Note: Squeeze Early Entry signals may not result from every squeeze.
Squeeze Breakout
These signals flag when the price breaks out of a statistically low-volatility period.
This is either the beginning of a potentially massive move or a nasty fake-out, which is why traders MUST use a stop-loss on every trade.
Toggle (Squeeze Breakout) to display long and short squeeze breakout trade entry signals. Default (On).
Note: Squeeze Breakout signals may not result from every squeeze.
Trendlines with Breaks [LuxAlgo]The trendlines with breaks indicator return pivot point based trendlines with highlighted breakouts. Users can control the steepness of the trendlines as well as their slope calculation method.
Trendline breakouts occur in real-time and are not subject to backpainting. Trendlines can however be subject to repainting unless turned off from the user settings.
The indicator includes integrated alerts for trendline breakouts.
🔶 USAGE
Any valid trendlines methodology can be used with the indicator, users can identify breakouts in order to infer future price movements.
The calculation method of the slope greatly affects the trendline's behaviors. By default, an average true range is used, returning a more constant slope amongst trendlines. Other methods might return trendlines with significantly different slopes.
Stdev makes use of the standard deviation for the slope calculation, while Linreg makes use of the slope of a linear regression.
The above chart shows the indicator using "Stdev" as a slope calculation method. The chart below makes use of the "Linreg" method.
By default trendlines are subject to backpainting, and as such are offset by length bars in the past. Disabling backpainting will not offset the trendlines.
🔶 SETTINGS
Length: Pivot points period
Slope: Slope steepness, values greater than 1 return a steeper slope. Using a slope of 0 would be equivalent to obtaining levels.
Slope Calculation Method: Determines how the slope is calculated.
Backpaint: Determine whether trendlines are backpainted, that is offset to past.

DepthHouse - ATR BandsDepthHouse ATR Bands works very similar to the well-known Bollinger Bands.
However, these bands are calculated slightly different.
Instead of using the standard deviation formula, ATR Bands determines the size of the bands based on the average range.
How to use:
The bands tighten while the markets’ range becomes lower, and widens as its' range becomes broader. Giving the indicator a loaded spring effect.
A break outside of the bands in either direction usually indicates a breakout.
All 3 bands serve as possible support and/or resistance. Meaning breaks back into the bands could indicate a reversal, or end of the breakout.
This indicator is completely customizable, so compiling multiple sized bands on top of each other may create a strong competitive edge.
This indicator is free until January,1st 2018 – see how to get below
--
DepthHouse's ATR Bands is 1 of 3 indicators that will be available for purchase via subscription come Jan 2018.
This indicator package will come with the following 3 indicators:
:: MaxADX ::
::Premium oscillator to help spot forming trends and reversals.
:: MaxADX Signals ::
::Taking MaxADX a step farther by creating an overlay that show possible trend strengthening and reversals via bar colors and shapes.
:: ATRBands ::
::Like Bollinger Bands , this indicator is uses to help spot breakouts, and overbought/sold areas.
--
How to get:
To qualify for the trial period which ends January, 1st 2018, please go to the link on my profile and click subscribe!
You will then be sent directions for your account to be added to the whitelist.
If you have already subscribed to one of my previous indicators, you will be added to the list shortly
Likes and comments are so very much appreciated!

Price Action [BreakOut] InternalKey Features and Functionality
Support & Resistance (S/R): The script automatically identifies and draws support and resistance lines based on a user-defined "swing period." These lines are drawn from recent pivot points, and users can customize their appearance, including color, line style (solid, dashed, dotted), and extension (left, right, or both). The indicator can also display the exact price of each S/R level.
Trendlines: It draws trendlines connecting pivot highs and pivot lows. This feature helps visualize the current trend direction. Users can choose to show only the newest trendlines, customize their length and style, and select the source for the pivot points (e.g., candle close or high/low shadow).
Price Action Pivots: This is a core component that identifies and labels different types of pivots based on price action: Higher Highs (HH), Lower Highs (LH), Higher Lows (HL), and Lower Lows (LL). These pivots are crucial for understanding market structure and identifying potential trend changes. The script marks these pivots with shapes and can display their price values.
Fractal Breakouts: The script identifies and signals "fractal breakouts" and "breakdowns" when the price closes above a recent high pivot or below a recent low pivot, respectively. These signals are visually represented with up (⬆) and down (⬇) arrow symbols on the chart.
Customization and Alerts: The indicator is highly customizable. You can toggle on/off various features (S/R, trendlines, pivots, etc.), adjust colors, line styles, and text sizes. It also includes an extensive list of alert conditions, allowing traders to receive notifications for:
Price Crossovers: When the close price crosses over or under a support or resistance level.
Trendline Breaks: When the price breaks above an upper trendline or below a lower trendline.
Fractal Breaks: When a fractal breakout or breakdown occurs.

GrayZone Sniper [CHE] — Breakout Validation System GrayZone Sniper — Breakout Validation System
Trade only the clean breakouts. Detect the sideways “gray zone,” wait for a confirmed breach, and act only when momentum (TFRSI) and range expansion (Mean Deviation) align. Clear long/short triggers, one-shot exit signals, and persistent levels keep your manual trading disciplined and repeatable.
Why it boosts manual trading
* No guesswork: Grey box marks consolidation; you trade the validated break.
* Fewer fakeouts: Triggers require momentum + volatility—not just a wick through a level.
* Rules > bias: Optional close-only signals stop intrabar noise.
* Built-in exits: One-shot LS/SS (Long/Short Stop) when conditions degrade.
* Actionable visuals: Gray-zone boxes, persistent highs/lows, and a smooth T3 trendline.
What it does (short + precise)
1. Maps consolidation as a gray box (running high/low while state is neutral).
2. Validates breakouts only when:
* Mean Deviation filter says current range expands vs. its own baseline, and
* TFRSI momentum is above 50 + deadzone (long) or below 50 − deadzone (short), and
* Price closes beyond the last gray high/low (optional close-only).
→ You get L (long) or S (short).
3. Manages exits with a smooth T3 trendline plus MD trend: when MD weakens and T3 turns against the prior side, you get a single LS/SS stop signal.
4. Extends structure: Last gray-zone H/L can persist as right-extended levels for retests/targets.
5. Ready for alerts: Prebuilt alert conditions for L, S, LS, SS.
Signals at a glance
* L – Long Trigger (validated breakout up)
* S – Short Trigger (validated breakout down)
* LS – Long Stop (exit hint for open long)
* SS – Short Stop (exit hint for open short)
Why TFRSI + Mean Deviation is a killer combo
They measure different, complementary things—and that reduces correlated errors.
* Mean Deviation (MD) = range expansion filter. It checks whether current absolute deviation of Typical Price from its SMA (|TP − SMA(TP)|) is greater than its own historical mean deviation baseline. In plain English: *is the market actually moving beyond its usual wiggle?* If not, most breakouts are noise.
* TFRSI = directional momentum around a 50 baseline, normalized and smoothed to react fast while avoiding raw RSI twitchiness.
* Synergy:
* MD confirms there’s energy (volatility regime has expanded).
* TFRSI confirms where that energy points (bull or bear).
* Requiring both gives you high-quality, directional expansion—the exact condition that tends to produce follow-through, while filtering the classic “thin break, immediate snap-back.”
Result: Fewer trades, better quality. You skip most range breaks without momentum or momentum pops without real expansion.
Inputs & Functions (clean overview)
Core: TFRSI & MD
* TFRSI Length (`tfrsiLen`, default 6): Longer = smoother, slower.
* TFRSI Smoothing (`tfrsiSignalLen`, default 2): SMA on TFRSI for cleaner signals.
* Mean Deviation Period (`mdLen`, default 20): Baseline for expansion filter.
* Use classical MD (`useTaDev`, default off):
* Off: MD vs current SMA (warning-free internal baseline).
* On: Classical `ta.dev` implementation.
* TFRSI Deadzone ± around 50 (`tfrsiDeadzone`, default 1.0): Wider deadzone = stricter momentum confirmation (less chop).
Triggers & Logic
* Trigger only on bar close (`fireOnCloseOnly`, default on): Confirmed signals only; no intrabar flicker.
* Reset gray bounds after trigger (`resetGrayBoundsAfterTrigger`, default on): Clears last gray H/L once a trade triggers.
* Auto-deactivate on neutral (`autoDeactivateOnNeutral`, default off): Strict disarm when state flips back to neutral.
Gray-Zone Boxes
* Show boxes (`showGrayBoxes`, default on): Draws the neutral consolidation box.
* Max boxes (`maxGrayBoxes`, default 10): How many historic boxes to keep.
* Transparency (`boxFillTransp`/`boxBorderTransp`, defaults 85/30): Visual tuning.
Trendline (T3)
* T3 Length (`t3Length`, default 3): Smoothing depth (higher = smoother).
* T3 Volume Factor (`t3VolumeFactor`, default 0.7): Controls responsiveness of the T3 curve.
Persistent Levels
* Persist gray H/L (`saveGrayLevels`, default on): Extend last gray high/low to the right.
* Max saved level pairs (`maxSavedGrayLvls`, default 1): How many H/L pairs to keep.
* Reset levels on trigger (`resetLevelsOnTrig`, default off): Clean slate after new trigger.
Debug & Visuals
* Show debug markers (`showDebugMarkers`, default on): Display L/S/LS/SS in the pane.
* Show legend (`showLegend`, default on): Compact legend (top-right).
How to trade it (practical)
1. Keep close-only on. Let the market finish the candle.
2. Wait for a clean gray box. Let the range define itself.
3. Take only L/S triggers where MD filter passes and TFRSI confirms.
4. Use persistent levels for retests/partials/targets.
5. Respect LS/SS. When expansion fades and T3 turns, exit without debate.
Tuning tips:
* More chop? Increase `tfrsiDeadzone` or `mdLen`.
* Want faster entries? Slightly reduce `t3Length` or deadzone, but expect more noise.
* Works across assets/timeframes (crypto/FX/indices/equities).
Bottom line
GrayZone Sniper enforces a simple, robust rule: Don’t touch the market until it breaks a defined range with real expansion and aligned momentum. That’s why TFRSI + Mean Deviation is hard to beat—and why your manual breakout trades get cleaner, calmer, and more consistent.
Disclaimer:
The content provided, including all code and materials, is strictly for educational and informational purposes only. It is not intended as, and should not be interpreted as, financial advice, a recommendation to buy or sell any financial instrument, or an offer of any financial product or service. All strategies, tools, and examples discussed are provided for illustrative purposes to demonstrate coding techniques and the functionality of Pine Script within a trading context.
Any results from strategies or tools provided are hypothetical, and past performance is not indicative of future results. Trading and investing involve high risk, including the potential loss of principal, and may not be suitable for all individuals. Before making any trading decisions, please consult with a qualified financial professional to understand the risks involved.
By using this script, you acknowledge and agree that any trading decisions are made solely at your discretion and risk.
Enhance your trading precision and confidence with Triple Power Stop (CHE)! 🚀
Happy trading
Chervolino
SONIC R BREAK FINAL (VER5)
Purpose: Capture breakouts through Support/Resistance (S/R) zones based on Pivot and filter signals using EMA 34 (High/Low/Close), EMA 89, volume, and candle structure. Includes a Higher Timeframe (H4) RSI risk warning (visual only, does not block entries).
How it works
S/R zones from Pivot
Draws Resistance and Support using ta.pivothigh/ta.pivotlow with Left/Right Bars.
S/R lines are locked with offset to reduce repaint.
EMA trend filters
EMA34 High/Low/Close build a “EMA 34 band”.
EMA89 works as the main trend filter.
Trend conditions:
Long: close above all EMA34 High/Low/Close and EMA89.
Short: close below all EMA34 High/Low/Close and EMA89.
Volume filter (optional)
Signal valid only if Volume > SMA(Volume, n).
Wick filter
Each wick (upper/lower) ≤ 50% of candle range to avoid weak breakouts.
Higher TF RSI risk (H4)
Fetches RSI from a higher timeframe (default H4).
If RSI exceeds threshold, breakout labels turn gray (risk warning only).
Anti-repeat mechanism
Each new pivot resets trigger.
Each S/R level triggers only once until the next pivot is formed.
Signals & Alerts
Label “B” (green) below candle: breakout above Resistance, valid EMA/Volume/Wick conditions.
Label “S” (red) above candle: breakout below Support, valid EMA/Volume/Wick conditions.
Gray labels = H4 RSI risk warning.
Unified alert: “S/R Breakout (Unified)” with message B=Buy, S=Sell, Gray=Risk.
Parameters
Show Breaks: toggle breakout detection.
Left/Right Bars: pivot sensitivity.
Require Volume > Average + Volume MA Length: volume filter.
Use H4 RSI Risk Warning: enable higher TF RSI check.
RSI Length, Higher TF (minutes), RSI thresholds for Buy/Sell risk.
Usage tips
Prioritize trades in the same direction as EMA89 and EMA34 trend.
Works on M5 to H4; best combined with RSI H4 when trading M15/M30.
Place SL behind the S/R just broken, TP by fixed RR or EMA trailing.
Increase Left/Right Bars for stronger zones and less noise in sideways markets.
Notes
Pivot still has repaint element (mitigated by offset).
This indicator is not financial advice. Always combine with proper risk management.
Version
Clean v4: added wick ≤50% filter, H4 RSI risk coloring, volume filter, anti-repeat pivot trigger, unified alert, EMA34 H/L/C background shading.
OBR 15min Session Opening Range Breakout + Volume Trend DeltaQuick Overview
This Pine Script plots the opening range for London and New York sessions, highlights breakout levels, draws previous session pivots, and offers a live volume delta table for trend confirmation.
Session Opening Range
- Captures the high/low of the first 15 minutes (configurable) for both London & NY sessions.
- Fills the range area with adjustable semi‑transparent colors.
- Optional alerts fire on breakout above the high or below the low.
Previous Session Levels
- Automatically draws previous day’s High, Low, Open and previous 4‑hour High/Low.
- Helps identify key S/R zones as price approaches ORB breakouts.
Volume Trend Delta
- Uses a CMO‑weighted moving average and ATR bands to detect trend state.
- Accumulates bullish vs. bearish volume during each trend.
- Displays Bull Vol, Bear Vol, and Delta % in a movable table for quick strength checks.
How to Use
1. Let the opening range complete (first 15 min).
2. Look for price closing above/below the ORB—enter long on an upside break, short on a downside break.
3. Check the Volume Delta table: positive delta confirms buying strength; negative delta confirms selling pressure.
4. Use previous day/4h levels as additional support/resistance filters.
Settings & Customization
- ORB Duration & Session Times (London/NY), fill colors, and toggles.
- Enable/disable Previous Day & 4H levels.
- Trend Period, Momentum Window, and Delta table position/size.
- Pre‑built alert conditions for all ORB breakouts.
Developer Notes
- Fully commented for easy adjustments.
- Modular sections: ORB, previous levels, trend delta, and alerts.
- No external libraries—pure Pine Script v6.
Tip
Combine ORB breakouts with Volume Delta and prior session pivots to filter false signals and trade stronger, more reliable moves.

Disparity Index with Volatility ZonesDisparity Index with Volatility Zones
is a momentum oscillator that measures the percentage difference between the current price and its simple moving average (SMA). This allows traders to identify overbought/oversold conditions, assess momentum strength, and detect potential trend reversals or continuations.
🔍 Core Concept:
The Disparity Index (DI) is calculated as:
DI = 100 × (Price − SMA) / SMA
A positive DI indicates the price is trading above its moving average (potential bullish sentiment), while a negative DI suggests the price is below the average (potential bearish sentiment).
This version of the Disparity Index introduces a dual-zone volatility framework, offering deeper insight into the market's current state.
🧠 What Makes This Version Unique?
1. High Volatility Zones
When DI crosses above +1.0% or below –1.0%, it often indicates the start or continuation of a strong trend.
Sustained readings beyond these thresholds typically align with trending phases, offering opportunities for momentum-based entries.
A reversal back within ±1.0% after exceeding these levels can suggest a shift in momentum — similar to how RSI exits the overbought/oversold zones before reversals.
These thresholds act as dynamic markers for breakout confirmation and potential trend exhaustion.
2. Low Volatility Zones
DI values between –0.5% and +0.5% define the low-volatility zone, shaded for visual clarity.
This area typically indicates market indecision, sideways price action, or consolidation.
Trading within this range may favor range-bound or mean-reversion strategies, as trend momentum is likely limited.
The logic is similar to interpreting a flat ADX, tight Bollinger Bands, or contracting Keltner Channels — all suggesting consolidation.
⚙️ Features:
Customizable moving average length and input source
Adjustable thresholds for overbought/oversold and low-volatility zones
Optional visual fill between low-volatility bounds
Clean and minimal chart footprint (non-essential plots hidden by default)
📈 How to Use:
1. Trend Confirmation:
A break above +1.0% can be used as a bullish continuation signal.
A break below –1.0% may confirm bearish strength.
Long periods above/below these thresholds support trend-following entries.
2. Reversal Detection:
If DI returns below +1.0% after exceeding it, bullish momentum may be fading.
If DI rises above –1.0% after falling below, bearish pressure may be weakening.
These shifts resemble overbought/oversold transitions in oscillators like RSI or Stochastic, and can be paired with divergence, volume, or price structure analysis for higher reliability.
3. Sideways Market Detection:
DI values within ±0.5% indicate low volatility or a non-trending environment.
Traders may avoid breakout entries during these periods or apply range-trading tactics instead.
Observing transitions out of the low-volatility zone can help anticipate breakouts.
4. Combine with Other Indicators:
DI signals can be enhanced using tools like MACD, Volume Oscillators, or Moving Averages.
For example, a DI breakout beyond ±1.0% supported by a MACD crossover or volume spike can help validate trend initiation.
This indicator is especially powerful when paired with Bollinger Bands:
A simultaneous price breakout from the Bollinger Band and DI moving beyond ±1.0% can help identify early trend inflection points.
This combination supports entering positions early in a developing trend, improving the efficiency of trend-following strategies and enhancing decision-making precision.
It also helps filter false breakouts when DI fails to confirm the move outside the band.
This indicator is designed for educational and analytical purposes and works across all timeframes and asset classes.
It is particularly useful for traders seeking a clear framework to identify momentum strength, filter sideways markets, and improve entry timing within a larger trading system.

Pre-London High-Low Breakout IndicatorOverview
The Pre-London High-Low Breakout Indicator helps traders identify breakout opportunities at the London session open. It marks the high and low one hour before London opens (5 PM - 6 PM AEST) and incorporates a 200 SMA filter to confirm trade direction. The indicator also provides real-time breakout markers for precise entries.
How the Indicator Works
1. Pre-London High & Low Identification (5 PM - 6 PM AEST)
The indicator tracks the highest and lowest price levels within this period.
These levels act as key breakout zones once London opens.
The high and low remain visible until 12 AM AEST for reference.
2. 200 SMA as a Trend Filter
A 200 SMA (yellow, thick line) is plotted to filter breakout trades.
Only long (buy) trades are valid if price is above the 200 SMA.
Only short (sell) trades are valid if price is below the 200 SMA.
3. Real-Time Breakout Confirmation
Buy Signal (Green Diamond):
Price breaks above the pre-London high.
Price is above the 200 SMA.
Sell Signal (Red Diamond):
Price breaks below the pre-London low.
Price is below the 200 SMA.
No signal appears if the breakout is against the SMA trend, reducing false trades.
How to Use the Indicator Properly
Step 1: Identify the Pre-London Range (5 PM - 6 PM AEST)
Observe price movements and note the session high & low.
Do not take trades within this period—wait for a clear breakout.
Step 2: Wait for a Breakout After 6 PM AEST
A breakout must occur beyond the session high or low.
The breakout should be clear and decisive, not hovering around the range.
Step 3: Confirm with the 200 SMA
If price is above the 200 SMA, only buy signals are valid.
If price is below the 200 SMA, only sell signals are valid.
If a breakout occurs against the SMA, ignore it.
Step 4: Enter the Trade and Manage Risk
Enter the trade after the breakout candle closes.
Set stop-loss just inside the pre-London range to minimize risk.
Take profit using a 1:2 or 1:3 risk-reward ratio, or trail the stop.
Why This Strategy Works
Pre-London Liquidity Grab: Institutional traders set positions before the London open, making this range significant.
Trend Confirmation with SMA: Reduces false breakouts by filtering trades in the direction of the trend.
Real-Time Breakout Detection: Green and red diamond markers highlight valid breakouts that meet all conditions.
Final Notes
If price breaks out but quickly reverses, it may be a false breakout—avoid impulsive trades.
The indicator works best when combined with other confluences such as volume analysis or key support/resistance levels.
Alerts can be added to notify traders when a valid breakout occurs.
This setup is ideal for traders looking for a structured, rule-based approach to trading London session breakouts with a strong trend confirmation mechanism.

Line Break Chart StrategyHello All!
We should not pass this year without a gift!
My last publication in 2024 is Complete Line Break Chart Strategy with many features!
What is Line Break Chart?
" Line Break is a Japanese chart style that disregards time intervals and only focuses on price movements, similar to the Kagi and Renko chart styles. Line Break charts form a series of up and down bars (referred to as lines). Up lines represent rising prices, and down lines represent falling prices. New confirmed lines only form on the chart when closing prices break the range covered by previous lines. Users can control the number of past lines used in the calculation via the "Number of Lines" input in the chart settings. The typical "Number of Lines" setting is 3, meaning the chart forms a new up line when the closing price is above the high prices of the last three lines, and it forms a new down line when the closing price is below the past three lines' low prices. If the current price is higher, it is an up line and if it is lower, it is a down line. If the current closing price is the same or the move in the opposite direction is not large enough to warrant a reversal, l then no new line is draw n" by Tradingview. You can find it here
Now let's start examining the features of the indicator:
By using Line break reversals it shows trend on the main chart. You can create alert .
Moreover, you can decide which trade should be taken by using Risk Management in the indicator. You can set the " Maximum Risk " and then if the risk is more than you set then the trade is not taken. When trend changed it checks the distance between reversal level and open price and compare it with the Maximum Risk
Breakout:
It can find breakouts and shows on the chart. You can create alert for breakouts
It can show breakouts on the main chart:
Flip-Flops:
Upon looking at set of price break charts, the trader will notice that there are instances when uptrend blocks is followed by one reversal block, and then by a reversal to a series of uptrend blocks. The opposite is also possible: a series of downtrend blocks is followed by one reversal box and then by an immediate reversal to downtrend. This price action is called a " Flip-Flop ". This structure usually produces trend continuation signal. when we see this then we better use Buy/Sell stop order. lets see this on the chart:
Temporal Sequence Table:
Sequence frequency shows the frequency distribution of the number of sequential highs and the number of sequential lows that have been generated. This is quite important to the trader who is seeking to join a trend or put on a trade when the price break reverses into a new trend direction. For example, if the pattern over the past year has been that there never were more than nine consecutive high closes, it would make sense not to enter a position late into the sequence of new high closes.
also you can see market structure. I have tried to formalize it and show it under the table. so you can understand if it's choppy market.
"Number of Lines" has very important role. While using low time frames such seconds/minutes time frame you may want to choose higher number of lines such 5,6. ( this may minimize the risk of a whipsaw )
Gaps feature:
You can set Gaps on/off. if Gaps on then you can see how long it takes for each box
Reversal and Continuation Probability:
The script calculated Reversal level and Continuation probability of the trend by using Sequence frequency.
It also shows unconfirmed box and current closing price level:
Last but not least it has Overlay option for all items, and can show all items in the main chart!
P.S. I added alerts :)
Wish you all a happy new year!
Enjoy!

Salman Indicator: Multi-Purpose Price ActionSalman Indicator: Multi-Purpose Price Action Tool for Pin Bars, Breakouts, and VWAP Anchoring
This indicator provides a comprehensive suite of price action insights, designed for active traders looking to identify key market structures and potential reversals. The script incorporates a Quarterly VWAP for trend bias, marks pin bars for possible reversal points, highlights outside bars for volatility signals, and indicates simple breakouts and pivot-level breaks. Customizable settings allow for flexibility in various trading styles, with default settings optimized for daily charts.
Outside Bars : Represented by an ⤬ symbol on the chart, these indicate bars where the current high is greater than the previous bar’s high, and the low is lower than the previous bar’s low, signaling high volatility and potential market reversals.
Pin Bars : Denoted by a small dot at the top or bottom of a candle’s wick, these are crucial signals of potential reversal areas. Pin bars are identified based on the percentage length of their shadows, with adjustable strictness in settings.
Quarterly VWAP : The light blue line on the chart represents the VWAP (Volume-Weighted Average Price), which is anchored to the Quarterly period by default. The VWAP acts as a directional bias filter, helping you to determine underlying market trends. This period, source, and offset are fully adjustable in the script’s settings.
Simple Breaks : Hollow candles on the chart indicate "simple breaks," defined when the current bar closes above the previous high or below the previous low. This is an effective way to highlight directional momentum in the market.
Bonus Pivot Breaks : The tilde symbol ~ appears when the price closes above or below prior pivot high/low levels, helping traders spot significant breakout or breakdown points relative to recent pivots.
Alerts
Simple Breaks : Alerts you when a breakout occurs beyond the previous bar’s high or low. Pin Bars : Notifies you of potential reversal points as indicated by bullish or bearish pin bars. Outside Bars : Triggers an alert whenever an outside bar is detected, indicating possible volatility changes.
How to Use
VWAP for Trend Bias : Use the Quarterly VWAP line to gauge overall market trend, with settings that allow adjustment to daily, weekly, monthly, or even larger time frames.
Pin Bars for Reversal Potential : Look for the dot markers on candle wicks, where the strictness of the pin bar detection can be adjusted via settings to match your trading preference.
Simple and Pivot Breaks for Momentum : Watch for hollow candles and the tilde symbol ~ as indicators of potential breakout momentum and pivot break levels, respectively.
This script can serve traders on multiple timeframes, from daily to weekly and beyond. The flexible configuration allows for adjustments in VWAP anchoring and pin bar criteria, providing a tailored fit for individual trading strategies.
