XRPBTC long : BTCUSD shortIt will be an index using the price delivered by Bitfinex exchanges. It is a very simple indicator, but it is a recommended index for those who want to see XRP while keeping the risk of price fluctuation of BTC down. The code is simple and you can use XRP in the same way by changing it to another alto. There is a big gap in the prices of BTC and XRP, so we adjust the values so that the indicators are easy to see.
Search in scripts for "btc期权交割时间"

Relative Estimated Price REP by KIVANÇ fr3762Relative Estimated Price (REP) Indicator shows the estimated price calculated if the tickerid made the same value changes (in %) during a certain period.
The default value of the lookback period is 50.
In the given XRPUSD chart you can see that XRPUSD has a value of 0.26480 and the RPC indicator shows the value of 0.38099.
This means that XRP would be 0.38099USD if it was fully made the same percentage moves with BTC , we can say that XRP is RELATIVELY cheap according to BTC price moves.
Conversely XRP would be RELATIVELY expensive if the last value of REP was lower then current XRP price.
users can choose the relative base price in calculation of REP between 1-5 which are:
1=BTCUSD, 2=ETHUSD, 3=EURTRY(Euro/Turkish Lira), 4=USDTRY (Dollar/Turkish Lira), 5=BIST100 (Istanbul Stock Exchange)
I personally advise you to use this indicator for daily charts in Tradingview to have more accurate estimated prices because of the website's calculation.
Developed by KIVANÇ

[NG] Indicator - Altcoin Alpha - v1(Created for Client)
Alpha (Unique price action of asset) indicator for ALTcoins implementation, taking `BINANCE:BTCUSDT` as the market reference. Can be improved by adding more BTC charts from more sources, so as to get a unified chart of BTC for market representation.
Set `alpha period` to a value, wherein you want to see the unique price action of the asset. For short term trend, a value of 24 is good for `1H` charts (1 day), and value of 168 is good for long term trends on `1H` charts (1 week trend).
Corresponding values of `beta period` should be `168` (1 week for 1 day alpha) and `720` (1 month for 1 week alpha period).
You can set `alpha` and `beta` period as per your requirements.
Regards,

TSP Volume Change Big Small// Better Display of Volume change
// green candle : Big volume change
// red Candle : Small volume change
// Default for BTC m5
// Big volume are limited up to $limup% 5%
// Pump : Volume over $limgreen% 2%
// Flat : Very Small Volume under $limdo% 0.2%
// Adjust based on volatility / TF
// BTC/USD 1h : 4,2,0.25

Quote asset VolumeVolume expressed in quote asset units. For pair DOGE/BTC the volume is shown in BTC, instead of DOGE.
Values are imprecise, because each candle's price is calculated as (O+H+L+C)/4, instead of a weighted average one, which I couldn't obtain.
Noro's Trend MAs Strategy v1.8Trade strategy which uses only 2 MA.
The slow MA (blue) is used for definition of a trend
The fast MA (red) is used for an entrance to the transaction
For:
- For H1
- For crypto/fiat or crypto/crypto
- Good for "BTC/USD", "ETH/USD", "ETH/BTC"
Recomended:
Long = true (if it is profitable as a result of backtests)
Short = true (if it is profitable as a result of backtests)
Stops = false
Stop, % = any
OHLC4 = any
Use Fast MA = true
Fast MA Period = 5
Slow MA Period = 21
Bars Q = (2 for "bitcoin/fiat" or 1 for "crypto/fiat" or 0 for "crypto/crypto")
In the new version 1.8
- The second PriceChannel is added
- Profit became more
- Losses became less
- The unnecessary types of MA are removed

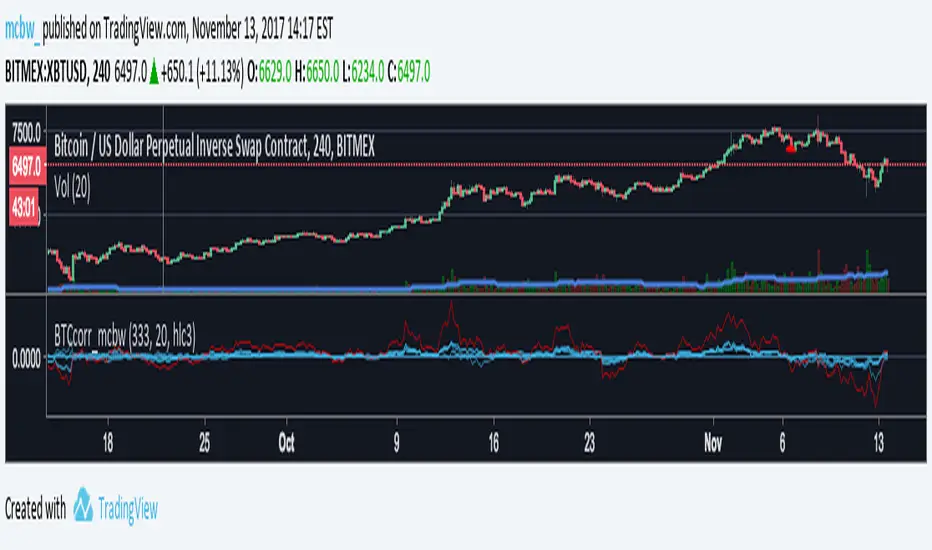
Bitcoin momentum correlation This is a pretty simple indicator, it measures the momentum of bitcoin as compared to usd,eur,eth,dash, and ltc, which you can see in all of the blue lines. If the red line is above zero then it means the overall value of btc is going up, opposite for down. The Ema_window controls how smooth the signal is. If you shorten the Ema_window parameter and open this on higher timeframe btc charts then the zero crossing gives pretty solid signals, despite being pretty choppy. A good way to interpret this is that if all the blue lines are moving in the same direction at once without disagreement, then the value of bitcoin has good momentum.
Mildly more technically:
Momentum is measured in the first derivative of an EMA for each ticker. To normalize the different values against each other they are all divided by their local maximums, which can be chosen in the parameter window, but shouldn't make a huge difference. All the checked values are then summed, as shown in the red line. To include a value into the red line simply keep it checked. Take a look at the script, it's kind of easy on the eyes.
It's pretty handy to look at, but doesn't seem too worthwhile to pursue much further. If someone wants much more out of the script then feel free to message me.
Remember rules #1 & #2
Don't lose money.
Happy trading
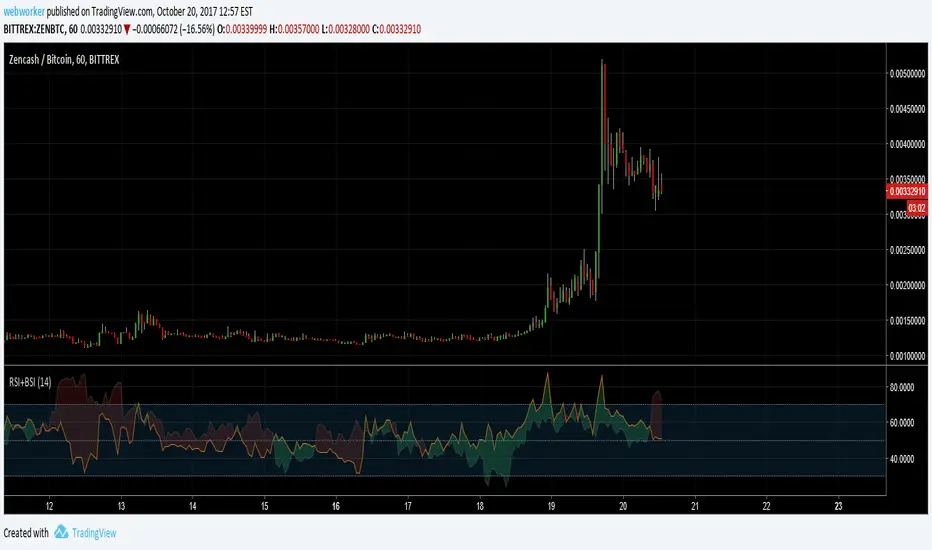
RSI+BSIThis script simply plots the current instruments RSI as well as Bitcoin's RSI from bitfinex. Helpful to identify when an alt is performing stronger than BTC or if BTC is dragging the alt down.
Volume Conversion IndicatorVolume Conversion Indicator
The volume conversion indicator is much like the in-built volume indicator. This particular volume indicator allows you to find out how much of something has been traded in a given timeframe.
This is done by multiplying volume by the average price at that point.
What does this mean?
Well, say, for example, you were watching DGB/BTC (DigiByte/Bitcoin). Instead of the volume being displayed in the amount of DGB traded, the amount of BTC traded is displayed instead.
Feel free to comment... Hope this helps :D

Indicator: Schaff Trend Cycle (STC)Another new indicator for TV community :)
STC detects up and down trends long before the MACD. It does this by using the same exponential moving averages (EMAs), but adds a cycle component to factor instrument cycle trends. STC gives more accuracy and reliability than the MACD.
More info: www.investopedia.com
Feel free to "Make mine" this chart and use the indicator in your charts. Appreciate any feedback on how effective this is for your instrument (I have tested this only with BTC).
For people trading BTC:
-------------------------------
Try 3/10 or 9/30 for MACD (fastLength/slowLength). They seem to catch the cycles better than the defaults. :)

VWAP Multi-Timeframe Pro [Eˣ]🎯 VWAP MULTI-TIMEFRAME PRO - The Institution's Favorite Indicator on Steroids
The Volume Weighted Average Price (VWAP) is the most widely used indicator by institutional traders, market makers, and professional desks worldwide. While most traders only monitor the Daily VWAP, professionals track multiple timeframes simultaneously to identify high-probability support/resistance zones. This indicator brings institutional-grade multi-timeframe VWAP analysis to your chart.
═══════════════════════════════════════
⚡ WHAT MAKES THIS SPECIAL
═══════════════════════════════════════
• 5 SIMULTANEOUS TIMEFRAMES: Daily, Weekly, Monthly, Quarterly, and Yearly VWAPs all visible at once
• STANDARD DEVIATION BANDS: Statistical overbought/oversold zones (similar to Bollinger Bands for VWAP)
• REAL-TIME POSITION ANALYSIS: Live table showing price position relative to each VWAP with percentage distance
• SMART CROSS DETECTION: Automatic visual markers when price crosses key VWAP levels
• OVERALL BIAS INDICATOR: Instant bullish/neutral/bearish reading based on VWAP alignment
• FULLY CUSTOMIZABLE: Colors, widths, bands, labels - tailor everything to your style
• COMPREHENSIVE ALERTS: Get notified for crosses, band touches, and key level interactions
═══════════════════════════════════════
📚 UNDERSTANDING VWAP
═══════════════════════════════════════
What is VWAP?
VWAP calculates the average price weighted by volume. Unlike simple moving averages, VWAP gives more weight to price levels where significant volume occurred. This makes it the "true average price" that institutions use to evaluate whether they're getting good fills.
Why Institutions Love VWAP:
- Algorithmic traders use VWAP as a benchmark for execution quality
- Market makers use VWAP to determine fair value
- Large funds use VWAP to minimize market impact when entering/exiting positions
- Banks and brokers measure trading performance against VWAP
The Multi-Timeframe Edge:
When multiple timeframe VWAPs align or converge, they create powerful support/resistance zones where institutions are likely to defend positions or enter new ones.
═══════════════════════════════════════
📊 HOW TO READ THE INDICATOR
═══════════════════════════════════════
VWAP LINES:
- BLUE = Daily VWAP (resets each day)
- PURPLE = Weekly VWAP (resets each week)
- ORANGE = Monthly VWAP (resets each month)
- RED = Quarterly VWAP (resets each quarter) - optional
- MAROON = Yearly VWAP (resets each year) - optional
PRICE POSITION:
- Price ABOVE VWAP = Bullish territory, buyers in control
- Price BELOW VWAP = Bearish territory, sellers in control
- Price AT VWAP = Equilibrium, decision point
STANDARD DEVIATION BANDS:
- Upper Band = Potential resistance, overbought zone
- Lower Band = Potential support, oversold zone
- 1st Band (solid dots) = 1 standard deviation (68% of price action)
- 2nd Band (crosses) = 2 standard deviations (95% of price action)
CROSS MARKERS:
- Triangles = Daily VWAP crosses
- Diamonds = Weekly VWAP crosses
- Squares = Monthly VWAP crosses
POSITION TABLE:
Shows real-time data for each active VWAP:
- Value = Current VWAP price level
- Position = Whether price is above (▲) or below (▼) with percentage distance
- Bias = Overall market sentiment based on VWAP alignment
═══════════════════════════════════════
💡 TRADING STRATEGIES
═══════════════════════════════════════
STRATEGY 1: MEAN REVERSION (Best for ranging markets)
1. Wait for price to reach upper or lower standard deviation bands
2. Look for reversal signals (candlestick patterns, divergence, etc.)
3. Enter trade expecting price to return to VWAP
4. Target = Opposite band or VWAP itself
5. Stop = Beyond the band or previous swing high/low
Example: Price reaches lower daily band + bullish engulfing → Buy, target daily VWAP
STRATEGY 2: TREND FOLLOWING (Best for trending markets)
1. Identify trend direction using higher timeframe VWAPs
2. Only take trades in direction of higher TF VWAPs
3. Enter on pullbacks to lower TF VWAP
4. Use VWAP as dynamic trailing stop
Example: Price above Weekly + Monthly VWAP (bullish) → Wait for pullback to Daily VWAP → Buy with stop below Daily VWAP
STRATEGY 3: CONFLUENCE ZONES (High probability setups)
1. Look for areas where multiple VWAPs converge (within 0.5-1%)
2. These create strong support/resistance zones
3. Trade bounces off confluence zones or breakouts through them
4. More VWAPs converging = stronger level
Example: Daily, Weekly, and Monthly VWAP all at $100 → Very strong support/resistance
STRATEGY 4: VWAP CROSSES (Momentum shifts)
1. Watch for price crossing multiple VWAPs simultaneously
2. Cross above multiple VWAPs = Bullish momentum shift
3. Cross below multiple VWAPs = Bearish momentum shift
4. Confirm with volume spike for stronger signal
Example: Price crosses above Daily + Weekly VWAP on high volume → Strong buy signal
STRATEGY 5: INSTITUTIONAL POSITIONING (For swing/position traders)
1. Focus on Weekly and Monthly VWAPs
2. These are where large institutions defend positions
3. Look for price action respect at these levels
4. Failed breaks often lead to explosive moves in opposite direction
Example: Price tests Monthly VWAP 3 times and bounces → Strong buy zone
═══════════════════════════════════════
⚙️ SETTINGS GUIDE
═══════════════════════════════════════
TIMEFRAMES SECTION:
- Toggle each timeframe on/off based on your trading style
- Customize colors to match your chart theme
- Adjust line widths for better visibility (1-5)
BANDS SECTION:
- Show Standard Deviation Bands: Enable/disable bands
- Band Multiplier: Default 1.0 (1 std dev). Increase to 1.5 or 2.0 for wider bands in volatile markets
- Band Transparency: Adjust visibility (higher = more transparent)
- Show 2nd Band Level: Enable 2 standard deviation bands for extreme zones
- 2nd Band Multiplier: Default 2.0 (2 std dev)
DISPLAY SECTION:
- Show VWAP Labels: Display D/W/M/Q/Y labels on right side of chart
- Mark VWAP Crosses: Show visual markers when price crosses VWAPs
- Show Price Position Table: Display real-time position analysis table
═══════════════════════════════════════
🎨 RECOMMENDED SETTINGS BY TRADING STYLE
═══════════════════════════════════════
DAY TRADERS / SCALPERS:
- Enable: Daily + Weekly VWAP
- Band Multiplier: 1.0
- Chart Timeframe: 1min, 5min, 15min
- Focus: Quick mean reversion plays off Daily VWAP and bands
SWING TRADERS:
- Enable: Daily + Weekly + Monthly VWAP
- Band Multiplier: 1.0 - 1.5
- Chart Timeframe: 1H, 4H, Daily
- Focus: Trade in direction of Weekly/Monthly, enter at Daily VWAP
POSITION TRADERS / INVESTORS:
- Enable: Weekly + Monthly + Quarterly VWAP
- Band Multiplier: 1.5 - 2.0
- Chart Timeframe: Daily, Weekly
- Focus: Major support/resistance at Monthly/Quarterly levels
═══════════════════════════════════════
🔔 ALERT SETUP GUIDE
═══════════════════════════════════════
This indicator includes 8 alert conditions:
VWAP CROSS ALERTS:
1. Price Crossed Above Daily VWAP - Potential bullish momentum
2. Price Crossed Below Daily VWAP - Potential bearish momentum
3. Price Crossed Above Weekly VWAP - Stronger bullish signal
4. Price Crossed Below Weekly VWAP - Stronger bearish signal
5. Price Crossed Above Monthly VWAP - Major trend shift signal
6. Price Crossed Below Monthly VWAP - Major trend shift signal
BAND ALERTS:
7. Price Reached Upper Band - Potential overbought, watch for reversal
8. Price Reached Lower Band - Potential oversold, watch for reversal
How to Set Alerts:
1. Click the "Alert" button (clock icon) at top of chart
2. Select "VWAP Multi-Timeframe Pro" from Condition dropdown
3. Choose your desired alert condition
4. Set alert name and notification preferences
5. Click "Create"
Pro Tip: Set multiple alerts for different conditions to catch all opportunities. For example, set alerts for both Daily and Weekly crosses to catch both short-term and intermediate-term setups.
═══════════════════════════════════════
💎 ADVANCED TIPS & TRICKS
═══════════════════════════════════════
1. THE VWAP MAGNET EFFECT
Price tends to gravitate back toward VWAP, especially during the first hour of trading. Use this for quick scalps: when price deviates significantly from Daily VWAP in the morning, it often returns by mid-session.
2. OPENING RANGE + VWAP
Combine VWAP with opening range high/low. When price breaks opening range while above VWAP = strong bullish setup. Breaking opening range while below VWAP = strong bearish setup.
3. VWAP RECLAIM/LOSS
- "Reclaiming VWAP" (price moves back above after being below) = bullish signal
- "Losing VWAP" (price moves back below after being above) = bearish signal
These often mark intraday trend changes.
4. MULTI-TIMEFRAME ALIGNMENT
When Daily, Weekly, AND Monthly VWAPs all point in same direction (all above or all below price), it indicates very strong trend. Trade WITH this alignment, not against it.
5. VWAP ANCHORING
Note where each VWAP resets:
- Daily = Midnight
- Weekly = Monday open
- Monthly = 1st of month
- Quarterly = Jan 1, Apr 1, Jul 1, Oct 1
- Yearly = January 1st
The first few days after a reset can show directional bias for the entire period.
6. VOLUME CONFIRMATION
VWAP crosses are more reliable when accompanied by above-average volume. A cross on low volume may be a false signal.
7. BAND WALK
In strong trends, price can "walk the bands" - staying near upper band in uptrends or lower band in downtrends. Don't blindly fade these; wait for actual reversal signals.
8. CONFLUENCE WITH OTHER INDICATORS
Combine VWAP with:
- Support/Resistance levels
- Fibonacci retracements
- Moving averages
- Volume profile levels
When VWAP aligns with other technical levels, the zone becomes even more significant.
═══════════════════════════════════════
⚠️ IMPORTANT NOTES & LIMITATIONS
═══════════════════════════════════════
VWAP RESETS:
VWAP is a cumulative calculation that resets at the start of each new period. This is standard VWAP behavior, not a bug. When you see a VWAP "jump" at midnight (Daily) or Monday open (Weekly), this is normal.
EXTENDED HOURS:
If your chart includes extended hours data, VWAP will include that data. For stocks, you may want to use regular hours only for cleaner VWAP levels.
LOW VOLUME PERIODS:
During very low volume periods (pre-market, holidays), VWAP may be less reliable as it can be easily skewed by a few large trades.
CRYPTO MARKETS:
Since crypto trades 24/7, Daily VWAP resets at midnight UTC (or your chart's timezone). Weekly VWAP resets Monday 00:00 UTC.
NOT A STANDALONE SYSTEM:
While VWAP is powerful, it should be part of a complete trading system including risk management, proper position sizing, and confirmation from other technical factors.
═══════════════════════════════════════
📈 MARKET-SPECIFIC USAGE
═══════════════════════════════════════
STOCKS / EQUITIES:
VWAP is most powerful in liquid stocks. Focus on Daily and Weekly VWAP. Institutional traders heavily use VWAP for large orders. Best during regular market hours.
CRYPTO:
Works excellent in major pairs (BTC, ETH) due to 24/7 volume. Use Daily for intraday, Weekly for swing trades. Be aware of timezone for VWAP reset.
FOREX:
Less commonly used but still effective in major pairs during liquid sessions (London/NY overlap). Focus on Daily and Weekly timeframes.
FUTURES / INDICES:
Highly effective in ES, NQ, and other liquid futures. Institutions use VWAP extensively. All timeframes relevant depending on trading style.
═══════════════════════════════════════
🎓 LEARNING RESOURCES
═══════════════════════════════════════
To deepen your understanding of VWAP:
- Study how market makers use VWAP for order execution
- Research "VWAP algorithms" used by institutional traders
- Practice identifying VWAP respect vs. rejection on historical charts
- Paper trade VWAP strategies before using real capital
- Observe how VWAP behaves in different market conditions (trending vs. ranging)
═══════════════════════════════════════
✨ FINAL THOUGHTS
═══════════════════════════════════════
VWAP Multi-Timeframe Pro brings institutional-grade analysis to retail traders. By monitoring multiple timeframes simultaneously, you can see the same levels that big money is watching and make more informed trading decisions.
Remember: VWAP is a tool, not a crystal ball. Use it as part of a comprehensive trading plan with proper risk management. The best traders use VWAP to understand WHERE institutions are positioned and HOW price is behaving relative to fair value.
This is a free, professional-grade indicator with no ads, no upsells, and no gimmicks. If you find it valuable, please give it a like and follow for more quality indicators and trading tools.
Happy trading, and may your VWAPs always be in your favor! 🎯
---
Disclaimer: This indicator is for educational purposes. Past performance does not guarantee future results. Always practice proper risk management and never risk more than you can afford to lose.

ICT Order Block Identifier [Eˣ]📦 Order Block Identifier - Free Indicator
Overview
The Order Block Identifier automatically detects and displays institutional order blocks on your charts - the exact zones where banks, hedge funds, and market makers place their orders. Based on ICT (Inner Circle Trader) concepts, this indicator helps you trade alongside smart money by identifying where institutions are likely to defend their positions and where price often finds support or resistance.
━━━━━━━━━━━━━━━━━━━━━━━━━━━━
🎯 What This Indicator Does
Detects Order Blocks:
• 🟢 Bullish Order Blocks (OB+) - Last bearish candle before strong bullish move
• 🔴 Bearish Order Blocks (OB-) - Last bullish candle before strong bearish move
• Automatically identifies institutional buying/selling zones
• Tracks up to 30 order blocks simultaneously
• Works on all timeframes and instruments
Smart Features:
• Auto-Timeframe Adjustment - Optimizes detection for 1min to Weekly charts
• Active Block Highlighting - Shows which OB price is approaching (🎯)
• Mitigation Tracking - Knows when blocks are "used" and no longer valid
• ATR-Based Detection - Adapts to each instrument's volatility
• Strength Filtering - Choose Low/Medium/High to control sensitivity
Visual Display:
• Clean boxes extending from order block to current price
• Color-coded: Green (bullish), Red (bearish), Gray (mitigated)
• OB+ / OB- labels for quick identification
• Active blocks highlighted with 🎯 emoji
• Distance indicator showing how far price is from nearest OB
Statistics Panel:
• Count of active bullish and bearish order blocks
• Market bias based on OB balance
• Distance to nearest order block
• Real-time status updates
━━━━━━━━━━━━━━━━━━━━━━━━━━━━
📚 Understanding Order Blocks
What Are Order Blocks?
Order blocks are the "footprints" left behind by institutional traders (banks, hedge funds, market makers) when they enter large positions. Because institutions can't fill massive orders at once without moving the market, they:
1. Place orders gradually over time
2. Leave zones where their buy/sell orders are concentrated
3. Defend these zones when price returns
4. Create reliable support and resistance levels
The ICT Concept:
Developed by Michael Huddleston (Inner Circle Trader), order block theory states that:
• The last opposite-colored candle before a strong move contains institutional orders
• Price often returns to test these zones before continuing
• These zones act as strong support (bullish OB) or resistance (bearish OB)
• Smart money defends their positions at these levels
Why Order Blocks Work:
• Unfilled Orders: Institutions may still have pending orders in the block
• Position Defense: They protect their entries by adding to positions
• Stop Placement: Retail stops cluster near these zones (liquidity for institutions)
• Market Structure: Price respects these levels due to order flow dynamics
━━━━━━━━━━━━━━━━━━━━━━━━━━━━
🟢 Bullish Order Blocks Explained
How They Form:
1. Price is consolidating or declining
2. Institutions begin accumulating (buying)
3. A strong bullish move erupts
4. The last bearish candle before this move = Bullish Order Block
5. This candle represents where institutions were buying aggressively
Why The Last Bearish Candle?
• Institutions absorbed all selling pressure at this level
• Their buy orders filled as price was declining
• When price returns, they defend this zone with more buying
• It becomes a demand zone / support level
Trading Bullish Order Blocks:
Setup:
• Wait for price to retrace back to bullish OB (green box)
• Look for rejection/reversal pattern (pin bar, engulfing, etc.)
• Enter long when price bounces from the OB zone
• Stop loss: Below the order block
• Target: Recent high or opposite order block
Best Scenarios:
• OB aligns with other support (trendline, fibonacci, round number)
• First touch of OB (unmitigated) has highest probability
• Occurs during high-volume sessions (London/NY)
• Trend is bullish on higher timeframe
Example Trade:
• Bullish OB forms at $50,000 (last red candle before rally)
• Price rallies to $52,000 then retraces
• Price drops back to $50,100 (touching OB)
• Bullish pin bar forms on the OB
• Enter long at $50,200, stop at $49,800
• Target: $52,000+ (previous high)
━━━━━━━━━━━━━━━━━━━━━━━━━━━━
🔴 Bearish Order Blocks Explained
How They Form:
1. Price is consolidating or rising
2. Institutions begin distributing (selling)
3. A strong bearish move erupts
4. The last bullish candle before this move = Bearish Order Block
5. This candle represents where institutions were selling aggressively
Why The Last Bullish Candle?
• Institutions absorbed all buying pressure at this level
• Their sell orders filled as price was rising
• When price returns, they defend this zone with more selling
• It becomes a supply zone / resistance level
Trading Bearish Order Blocks:
Setup:
• Wait for price to retrace back to bearish OB (red box)
• Look for rejection/reversal pattern (shooting star, bearish engulfing)
• Enter short when price rejects from the OB zone
• Stop loss: Above the order block
• Target: Recent low or opposite order block
Best Scenarios:
• OB aligns with other resistance (trendline, fibonacci, round number)
• First touch of OB (unmitigated) has highest probability
• Occurs during high-volume sessions (London/NY)
• Trend is bearish on higher timeframe
Example Trade:
• Bearish OB forms at $48,000 (last green candle before drop)
• Price drops to $46,000 then retraces
• Price rallies back to $47,900 (touching OB)
• Bearish engulfing forms at the OB
• Enter short at $47,800, stop at $48,200
• Target: $46,000- (previous low)
━━━━━━━━━━━━━━━━━━━━━━━━━━━━
📊 How To Use This Indicator
Strategy 1: Order Block Retest (Classic)
Best For: Swing trading, capturing reversals
Timeframes: 15min, 1H, 4H, Daily
Win Rate: 60-70% (first touch)
Entry Rules:
1. Identify unmitigated order block (bright color, not gray)
2. Wait for price to return to the OB zone
3. Look for price action confirmation:
• Bullish OB: Pin bar, bullish engulfing, hammer
• Bearish OB: Shooting star, bearish engulfing, doji
4. Enter in the direction of the OB
5. Stop loss: Beyond the opposite side of OB (20-30 pips)
6. Target: 2-3R or opposite OB
Example:
• Bullish OB at $100-$102
• Price drops to $101.50 (enters OB)
• Bullish pin bar forms with low at $100.80
• Enter long at $102 (OB high), stop at $99.50
• Risk: $2.50, Target: $107.50 (3R)
Strategy 2: Break & Retest
Best For: Trend trading, breakout confirmation
Timeframes: 5min, 15min, 1H
Win Rate: 65-75%
Entry Rules:
1. Price breaks through an order block
2. Wait for pullback to the broken OB
3. The OB now acts as support (if broken up) or resistance (if broken down)
4. Enter when price respects the flipped OB
5. Stop: Inside the OB zone
6. Target: Next OB or structure level
Why It Works: Broken OBs flip polarity - support becomes resistance and vice versa
Strategy 3: Multi-Timeframe Confirmation
Best For: High-probability setups
Timeframes: Combine 1H + 4H or 15min + 1H
Win Rate: 70-80%
Entry Rules:
1. Identify order block on higher timeframe (4H or Daily)
2. Switch to lower timeframe (1H or 15min)
3. Wait for lower TF order block to form within higher TF OB
4. Trade the lower TF OB in direction of higher TF OB
5. Stop: Below lower TF OB
6. Target: Edge of higher TF OB or beyond
Why It Works: Alignment across timeframes = institutional consensus
Strategy 4: Order Block to Order Block
Best For: Range trading, swing entries
Timeframes: 1H, 4H
Win Rate: 55-65%
Entry Rules:
1. Identify both bullish OB below and bearish OB above
2. Price is ranging between these OBs
3. Enter long at bullish OB, target bearish OB
4. Enter short at bearish OB, target bullish OB
5. Stop: Beyond the trading OB
6. Exit at opposite OB
Why It Works: Price moves from one institutional zone to another
Strategy 5: Mitigation Fade
Best For: Aggressive scalping
Timeframes: 5min, 15min
Win Rate: 50-60% (higher risk)
Entry Rules:
1. Price approaches an order block
2. Instead of bouncing, price breaks through (mitigates it)
3. Enter immediately in direction of breakout
4. Stop: Back inside the mitigated OB
5. Quick target: 1-1.5R
Why It Works: When OB fails, it often leads to strong continuation
━━━━━━━━━━━━━━━━━━━━━━━━━━━━
⚙️ Settings Explained
Core Settings
Auto-Adjust for Timeframe (Default: ON)
• Automatically optimizes detection for current chart timeframe
• 1min: 3 bars lookback
• 5min: 4 bars lookback
• 15min: 5 bars lookback
• 1H: 6 bars lookback
• 4H: 8 bars lookback
• Daily+: 10-12 bars lookback
• Recommended: Keep ON for best results
Manual Detection Length (Default: 5)
• Only used when Auto-Adjust is OFF
• Number of bars to look back for the "last opposite candle"
• Lower (2-4): More sensitive, more blocks, more noise
• Higher (6-10): Less sensitive, fewer blocks, higher quality
• Recommended: Use Auto-Adjust instead
Display Settings
Show Bullish/Bearish Order Blocks
• Toggle each type on/off independently
• Customize colors for each OB type
• Tip: Match colors to your chart theme
Max Order Blocks to Display (Default: 10)
• Limits how many OBs are shown at once
• Lower (5-8): Cleaner chart, only recent blocks
• Higher (15-30): More historical context
• Recommended: 8-12 for most trading
Show Order Block Labels (Default: ON)
• Displays "OB+" and "OB-" text on blocks
• Shows 🎯 on active (nearest) block
• Turn OFF for minimal chart appearance
• Recommended: Keep ON for clarity
Extend Blocks (bars) (Default: 50)
• How far to extend OB boxes to the right
• Lower (20-30): Shorter boxes, less clutter
• Higher (100+): Longer boxes, easier to see
• Blocks auto-extend until mitigated or limit reached
• Recommended: 40-60 bars
Filters
Block Strength Filter (Default: Medium)
• Controls how strong a move must be to create an OB
• Low: 0.5x ATR move required - Many blocks, more noise
• Medium: 1x ATR move required - Balanced quality/quantity
• High: 1.5x ATR move required - Only strongest institutional moves
• Recommended for beginners: High
• Recommended for experienced: Medium
• Recommended for scalpers: Low
Min Block Size % (Default: 0.1)
• Minimum size of OB as percentage of price
• Filters out tiny, insignificant blocks
• Crypto: 0.1-0.3%
• Forex: 0.05-0.15%
• Stocks: 0.1-0.5%
• Adjust based on instrument volatility
Advanced Settings
Show Mitigated Blocks (Default: OFF)
• When ON: Shows gray boxes for "used" order blocks
• When OFF: Blocks disappear after mitigation
• Use ON: For learning and analysis
• Use OFF: For clean, active trading
Highlight Active Block (Default: ON)
• Highlights the nearest order block to current price
• Active block shown with 🎯 emoji and brighter color
• Helps focus on most relevant trading opportunity
• Recommended: Keep ON
━━━━━━━━━━━━━━━━━━━━━━━━━━━━
📱 Info Panel Guide
Bullish OB Count
• Number of active (unmitigated) bullish order blocks
• Higher number = More support zones below price
• Multiple bullish OBs = Strong demand structure
Bearish OB Count
• Number of active (unmitigated) bearish order blocks
• Higher number = More resistance zones above price
• Multiple bearish OBs = Strong supply structure
Bias Indicator
• ⬆ Bullish: More bullish OBs than bearish (demand > supply)
• ⬇ Bearish: More bearish OBs than bullish (supply > demand)
• ↔ Neutral: Equal OBs on both sides
• Trade in direction of bias for higher probability
Near Indicator
• Shows which OB price is closest to
• Displays distance as percentage
• Example: "Bull OB 0.85%" = Bullish OB is 0.85% below current price
• Watch for "Near" alerts to time entries
━━━━━━━━━━━━━━━━━━━━━━━━━━━━
📱 Alert Setup
This indicator includes 4 alert types:
1. Price Entering Bullish OB
• Fires when price touches a bullish order block
• Action: Watch for bounce/reversal pattern
• High-probability long setup developing
2. Price Entering Bearish OB
• Fires when price touches a bearish order block
• Action: Watch for rejection/reversal pattern
• High-probability short setup developing
3. New Bullish OB Detected
• Fires when a new bullish order block forms
• Action: Mark the zone for future retest
• New demand zone identified
4. New Bearish OB Detected
• Fires when a new bearish order block forms
• Action: Mark the zone for future retest
• New supply zone identified
To Set Up Alerts:
1. Click "Alert" button (clock icon)
2. Select "Order Block Identifier"
3. Choose your alert condition
4. Configure notification method
5. Click "Create"
Pro Tip: Set "Price Entering" alerts to catch trading opportunities in real-time
━━━━━━━━━━━━━━━━━━━━━━━━━━━━
💎 Pro Tips & Best Practices
✅ DO:
• First touch is best - Unmitigated OBs have highest win rate (60-70%)
• Wait for confirmation - Don't buy/sell just because price touched OB
• Use multiple timeframes - Higher TF OBs are stronger than lower TF
• Combine with structure - OB + trendline/support = high probability
• Trade with the bias - More bullish OBs = favor longs
• Respect mitigation - Once OB is mitigated, it's less reliable
• Use proper stop loss - Always place stops beyond the OB zone
• Consider session timing - OBs work best during London/NY sessions
⚠️ DON'T:
• Don't blindly buy/sell at OBs - Wait for confirmation
• Don't ignore mitigation - Gray blocks are much weaker
• Don't trade every OB - Quality over quantity
• Don't fight strong trends - OBs can be run through in strong momentum
• Don't use alone - Combine with price action, support/resistance
• Don't expect 100% win rate - Even best OBs fail sometimes (30-40% of time)
• Don't overtrade - Wait for A+ setups with confluence
🎯 Best Timeframes By Trading Style:
• Scalpers: 1min, 5min (quick OB touches)
• Day Traders: 5min, 15min, 1H (balanced view)
• Swing Traders: 1H, 4H, Daily (major institutional zones)
• Position Traders: 4H, Daily, Weekly (strongest OBs)
🔥 Best Instruments:
• Excellent: Forex major pairs (EUR/USD, GBP/USD), BTC, ETH, ES, NQ
• Good: Gold, Oil, Major indices, Large-cap stocks
• Moderate: Altcoins, small-cap stocks (more noise)
• Avoid: Very low liquidity instruments (OBs less reliable)
⏰ Best Times To Trade OBs:
• London Session (03:00-12:00 EST): Highest OB respect rate
• NY Session (08:00-17:00 EST): Strong OB reactions
• London-NY Overlap (08:00-12:00 EST): Best probability
• Asian Session: Lower probability, wait for London
━━━━━━━━━━━━━━━━━━━━━━━━━━━━
🎓 Advanced Order Block Concepts
Order Block Flips (Polarity Change)
When price breaks through an OB and closes beyond it:
• Bullish OB that's broken becomes bearish (support becomes resistance)
• Bearish OB that's broken becomes bullish (resistance becomes support)
• Trading: Watch for retest of broken OB from opposite side
Order Block Refinement
When multiple OBs form at similar level:
• Later OB "refines" or "replaces" the earlier one
• Use the most recent OB as the active zone
• Older OBs become less relevant
Order Block Clusters
Multiple OBs stacked close together:
• Creates a "super zone" of institutional interest
• Higher probability of reversal
• Wider zone for entries (more room for confirmation)
Fair Value Gaps + Order Blocks
When OB aligns with Fair Value Gap:
• Extremely high probability setup
• Price is drawn to fill the gap AND test the OB
• Double confluence = institutional magnet
Order Block Mitigation Types
• Full Mitigation: Price fully enters and closes inside OB
• Partial Mitigation: Price wicks into OB but closes outside
• False Mitigation: Quick touch then immediate rejection
• Partial/false mitigation = OB still somewhat valid
━━━━━━━━━━━━━━━━━━━━━━━━━━━━
📈 Common Order Block Patterns
Pattern 1: The Perfect Retest
• OB forms during strong move
• Price continues 100-200+ pips
• Price retraces back to OB
• Clean bounce with confirmation candle
• Highest probability pattern
Pattern 2: The Double Tap
• Price tests OB, bounces weakly
• Price tests same OB again
• Second test produces stronger reaction
• Second touch often better entry
Pattern 3: The Fake-Out
• Price breaks through OB
• Immediately reverses back
• "Stop hunt" or liquidity grab
• Enter after price reclaims OB
Pattern 4: The Ladder
• Multiple OBs stacked like stairs
• Price steps from one OB to next
• Each OB provides support/resistance
• Trade OB-to-OB movements
Pattern 5: The Failed OB
• Price crashes through OB without pause
• OB completely invalidated
• Often signals strong momentum
• Don't fight it, trade the breakout
━━━━━━━━━━━━━━━━━━━━━━━━━━━━
🚀 What Makes This Different?
Unlike basic support/resistance indicators, Order Block Identifier:
• ICT Methodology - Based on proven institutional concepts
• Auto-Timeframe Optimization - Works perfectly on all timeframes
• ATR-Based Detection - Adapts to each instrument's volatility
• Mitigation Tracking - Knows when blocks are no longer valid
• Active Block Highlighting - Shows most relevant opportunity
• Smart Filtering - Only shows high-quality institutional zones
• Visual Clarity - Clean, professional appearance
• Real-Time Updates - Blocks update as price action develops
Based On Professional Concepts:
• ICT Smart Money Concepts (SMC)
• Institutional order flow analysis
• Market maker behavior patterns
• Supply and demand zone theory
━━━━━━━━━━━━━━━━━━━━━━━━━━━━
📈 Upgrade Your Trading Arsenal
This free indicator gives you institutional-level order block analysis. Want more?
🔥 Check out my premium scripts for:
• Automated entries at order blocks with confirmation
• Fair Value Gap detection combined with OBs
• Multi-timeframe order block strategies
• Breaker blocks and advanced ICT concepts
• Complete smart money trading systems
• And much more...
👉 Visit my profile to trade like institutions!
━━━━━━━━━━━━━━━━━━━━━━━━━━━━
📝 Important Notes
• Order blocks are high-probability zones, not guarantees
• Always use confirmation (price action patterns)
• First touch of OB is most reliable (60-70% win rate)
• Mitigated blocks are much weaker (30-40% win rate)
• Works best during high-volume sessions
• Combine with proper risk management (1-2% risk per trade)
• Not all OBs are created equal - look for confluence
• Practice on demo before trading live
• Past performance doesn't guarantee future results
Learning Curve:
• Week 1-2: Learn to identify OBs and wait for retests
• Week 3-4: Practice entry confirmation and risk management
• Month 2-3: Combine with other analysis (MTF, structure, FVGs)
• Month 3+: Develop personal OB trading system
Disclaimer: For educational purposes only. Order block trading requires practice and proper risk management. Always do your own research.
━━━━━━━━━━━━━━━━━━━━━━━━━━━━
🙏 Support This Work
If this indicator helps you trade with institutions:
• ⭐ Give it a thumbs up
• 💬 Share your best order block trades in comments
• 🔔 Follow for more free ICT/SMC tools
• 🚀 Share with traders learning smart money concepts
Questions about order blocks? Drop a comment and I'll explain!
━━━━━━━━━━━━━━━━━━━━━━━━━━━━
Developed with ❤️ for traders who want to see what institutions see
━━━━━━━━━━━━━━━━━━━━━━━━━━━━
Version History
• v1.0 - Initial release with auto-timeframe detection and ATR-based strength filtering

Trend Gazer: Unified ICT Trading System with Signals# Trend Gazer User Guide (English)
## 📖 Table of Contents
1. (#about-this-indicator)
2. (#quick-start-guide-3-steps)
3. (#detailed-usage)
4. (#settings-customization)
5. (#why-combine-multiple-features)
6. (#faq)
---
## About This Indicator
**Trend Gazer** is an integrated trading system designed to read institutional order flow like professional traders.
### 🎯 3 Problems This Indicator Solves
#### ❌ Problem 1: Too Many Indicators = Information Overload
```
Normal: RSI + MACD + Moving Average + Bollinger Bands... → Cluttered chart
Solution: All integrated into ONE indicator → Clean & Clear
```
#### ❌ Problem 2: Single Indicators Give False Signals
```
Normal: Enter based on RSI alone → Frequent stop-outs
Solution: Structure × Zone × Momentum multi-angle confirmation → Higher win rate
```
#### ❌ Problem 3: Unclear Entry Timing
```
Normal: Know the trend but don't know WHERE to enter
Solution: LS Bounce Signal shows EXACT entry points
```
---
## Quick Start Guide (3 Steps)
### 🚀 STEP 1: Confirm Trend Direction
**Look for CHoCH (Change of Character)**
```
📍 (1.CHoCH) label = Uptrend starting
📍 (a.CHoCH) label = Downtrend starting
```
**Important**: Wait for CHoCH! No direction without it.
---
### 🎯 STEP 2: Find Entry Points
**Wait for LS Bounce Signal (green/red labels)**
```
🟢 "Long@ HL only" label → LONG (buy) candidate
🔴 "Short@ LH only" label → SHORT (sell) candidate
```
**Label text color meaning**:
- **White text**: Clean trend (high confidence)
- **Yellow text**: Trend transition (moderate caution)
---
### 🛡️ STEP 3: Final Confirmation with Bar Color
**Bar color shows market state**
```
🔴 Red bar: BUY zone (buying is favored)
🟢 Green bar: SELL zone (selling is favored)
⚪ White bar: Neutral (wait and see)
```
---
## Detailed Usage
### 📊 Understanding the Chart
#### 1. Labels (Market Structure Changes)
```
(1.CHoCH) / (a.CHoCH) : Trend reversal
(2.SiMS) / (b.SiMS) : Momentum confirmation
(3.BoMS) / (c.BoMS) : Trend continuation
```
#### 2. Boxes (Institutional Order Zones)
```
📦 Blue boxes: Bullish OB (buy orders accumulated)
📦 Red boxes: Bearish OB (sell orders accumulated)
📦 Black transparent boxes: Liquidity Sweep
```
**How to use Order Blocks**:
- Function as support/resistance
- Signals within OB have higher reliability
- Use for stop-loss placement
#### 3. Lines (Trends and Support/Resistance)
```
━━━ Red lines: EMA20, EMA50, EMA100 (short to mid-term trends)
━━━ Blue lines: 60min NPR/BB bands (support/resistance)
```
#### 4. Bar Colors (Filter 6)
```
Bar color = Real-time market state
🔴 Red: Buying is favored
🟢 Green: Selling is favored
⚪ White: Neutral
```
---
### 🎯 Practical Trading Flow
#### 📍 Preparation Phase
```
1. Open chart (recommended: 5min or 15min)
2. Add Trend Gazer to chart
3. Start in observation mode (don't enter yet)
```
#### 📍 Entry Decision
```
✅ CHoCH confirms direction → Uptrend starting
✅ LS Bounce Signal "Long@ HL only" appears
→ Entry point candidate
✅ Bar turns red → Market supports buying
→ Entry decision 🎯
✅ Place stop below nearest Order Block (blue box)
```
#### 📍 Exit Decision
```
🔴 Opposite LS Bounce Signal "Short@ LH only" appears
→ Consider taking profit
🔴 Bar turns green
→ Potential trend reversal, review position
🔴 Stop loss hit
→ Exit with loss
```
---
### 💡 Tips for Higher Win Rate
#### ✅ DO's
```
1. Enter AFTER CHoCH appears
2. Prioritize white-text LS Bounce Signals
3. Check higher timeframe (1H or Daily) trend
4. Emphasize signals within Order Blocks
5. Use bar color as final confirmation
```
#### ❌ DON'Ts
```
1. Enter before CHoCH → No clear direction
2. Enter only on yellow text → Unstable transition period
3. Ignore bar color → Trading against market state
4. Don't check Order Blocks → Unclear support/resistance
5. Enter same direction consecutively → Overtrading
```
---
## Settings Customization
### 🔧 How to Open Settings
```
1. Right-click on indicator name on chart
2. Select "Settings..."
3. Settings panel opens
```
---
### 📋 Recommended Setting Profiles
#### 🔰 Beginner Settings (Simple)
**Goal**: Reduce noise, show only important signals
```
【FILTERS】
✅ Bonus Filter: ON
✅ Filter 6 (OB/BB/NPR Zone Filter): ON
❌ Direction Filter: OFF
❌ Liquidation Reversal Filter: OFF
❌ ICT Market Structure Filter: OFF
❌ EMA Trend Filter: OFF
❌ OB/FVG Filter 1: OFF
❌ OB/FVG Filter 2: OFF
【SIGNALS】
✅ Signal 0 (Bonus): ON
✅ Signal 1 (VWC Change): ON
✅ Signal 2 (Liq Rev): ON
❌ Signal 3 (LS): OFF (complex alone)
❌ Signal 4 (LS Break): OFF
❌ Signal 5 (OB+LS NPR): OFF
❌ Signal 6 (OB+LS EMA): OFF
【LS BOUNCE SIGNAL】
✅ Exclude EMA50 from touch detection: OFF
❌ Only show when EMA fills are mixed: OFF
```
**What happens with this setup**:
- Only Bonus (black background) signals display
- LS Bounce Signals clearly visible
- Noisy signals filtered out
---
#### 💪 Intermediate Settings (Balanced)
**Goal**: Enable key filters for better accuracy
```
【FILTERS】
✅ Bonus Filter: ON
✅ Filter 6 (OB/BB/NPR Zone Filter): ON
✅ ICT Market Structure Filter: ON
❌ Direction Filter: OFF
❌ Liquidation Reversal Filter: OFF
❌ EMA Trend Filter: OFF
❌ OB/FVG Filter 1: OFF
❌ OB/FVG Filter 2: OFF
【SIGNALS】
✅ Signal 0 (Bonus): ON
✅ Signal 1 (VWC Change): ON
✅ Signal 2 (Liq Rev): ON
✅ Signal 3 (LS): ON
❌ Signal 4 (LS Break): OFF
❌ Signal 5 (OB+LS NPR): OFF
❌ Signal 6 (OB+LS EMA): OFF
【LS BOUNCE SIGNAL】
✅ Exclude EMA50 from touch detection: OFF
❌ Only show when EMA fills are mixed: OFF
```
**What happens with this setup**:
- Signals only after CHoCH (trend confirmed)
- Filter 6 changes bar colors
- Liquidity Sweeps also displayed
---
#### 🚀 Advanced Settings (Full Utilization)
**Goal**: Master all features
```
【FILTERS】
✅ Bonus Filter: ON
✅ Filter 6 (OB/BB/NPR Zone Filter): ON
✅ ICT Market Structure Filter: ON
✅ Direction Filter: ON
✅ EMA Trend Filter: ON
❌ Liquidation Reversal Filter: OFF (optional)
✅ OB/FVG Filter 1: ON
✅ OB/FVG Filter 2: ON
【SIGNALS】
✅ All ON
【LS BOUNCE SIGNAL】
✅ Exclude EMA50 from touch detection: ON (reduce EMA50 noise)
✅ Only show when EMA fills are mixed: ON (show only transition zones)
```
**What happens with this setup**:
- Fewer signals (precision-focused)
- Multiple confirmations greatly reduce false signals
- Only signals confirmed by trend, momentum, and zones
---
### 🎨 Display Customization
#### Change Label Size
```
【BUY/SELL SIGNAL APPEARANCE】
→ "BUY/SELL Label Size"
→ Choose from: tiny / small / normal / large / huge
Recommended: small (default)
```
#### Order Block Display Settings
```
【ORDER BLOCK (OB) SETTINGS】
✅ Show Current TF OB: Current timeframe OB
✅ Show 1min OB: 1-minute OB
✅ Show 5min OB: 5-minute OB
✅ Show 15min OB: 15-minute OB
Recommended: Only 15min OB ON (simple)
```
#### Liquidity Sweep Display
```
【LIQUIDITY SWEEPS SETTINGS】
→ "Sweep Length": Sensitivity (small=frequent, large=selective)
→ "Sweep Option": Standard / Maximum
Recommended: Length=40, Option=Standard
```
#### NPR/BB Bands Display
```
【NPR (NON-REPAINT STDEV) SETTINGS】
✅ Display 60min NPR Bands: 60-minute support/resistance
❌ Display Current TF NPR Bands: Current timeframe (optional)
Recommended: Only 60min ON
```
---
### ⚙️ Advanced Settings
#### Fine-tune Filter 6
```
【FINAL FILTERS】
→ "Enable Filter 6 (OB/BB/NPR Zone Filter)"
When ON:
- Bars color-coded red/green/white
- Behavior at OB, NPR/BB touches controlled
```
#### LS Bounce Signal Adjustments
```
【LS BOUNCE SIGNAL】
→ "Exclude EMA50 from touch detection"
OFF: Detect NPR/BB/EMA50 (all 3)
ON: Detect NPR/BB only (exclude EMA50)
→ "Only show when EMA fills are mixed"
OFF: Show all LS Bounce Signals
ON: Show only transition zone signals (yellow text)
```
#### MTF (Multi-Timeframe) Control
```
【ORDER BLOCK (OB) SETTINGS】
→ "Disable MTF on 1hr+ Charts"
ON: Disable MTF on 1H+ (save memory)
OFF: MTF enabled on all timeframes
Recommended: ON (unnecessary on larger timeframes)
```
---
### 🎯 Purpose-Based Configuration Guide
#### 🔍 Goal 1: Reduce Signal Count
```
✅ Bonus Filter: ON
✅ ICT Market Structure Filter: ON
✅ Filter 6: ON
✅ All Signals OFF, only Signal 0 ON
```
#### 🔍 Goal 2: Get More Signals
```
❌ All Filters OFF
✅ All Signals ON
```
#### 🔍 Goal 3: Trend Following Only
```
✅ ICT Market Structure Filter: ON
✅ Direction Filter: ON
✅ EMA Trend Filter: ON
```
#### 🔍 Goal 4: Counter-Trend Trading
```
✅ LS Bounce Signal: ON
✅ Filter 6: ON
❌ ICT Market Structure Filter: OFF
```
#### 🔍 Goal 5: Day Trading (5-15min charts)
```
✅ Show 15min OB: ON
✅ Display 60min NPR Bands: ON
✅ LS Bounce Signal: ON
❌ Show 1min/5min OB: OFF
```
#### 🔍 Goal 6: Scalping (1-5min charts)
```
✅ Show 5min OB: ON
✅ Show 15min OB: ON
✅ Display 60min NPR Bands: ON
✅ All Signals: ON
```
---
### 💾 Saving and Loading Settings
#### Save Settings
```
1. Click "..." in top-right of Settings screen
2. Select "Save as default"
→ Same settings auto-applied next time
```
#### Reset Settings
```
1. Click "..." in top-right of Settings screen
2. Select "Reset settings"
→ Return to default settings
```
---
## Why Combine Multiple Features?
### 🎯 Problem: Single Indicator Limitations
Common trader problems:
```
❌ RSI alone → Trade against trend, lose
❌ Moving Average alone → Late entry timing
❌ Support/Resistance alone → Caught by false breakouts
```
**Markets are complex**. One angle isn't enough.
---
### 💡 Solution: Multi-Angle Integrated Approach
#### 1️⃣ Structure × Zone × Momentum
```
📐 Structure (ICT CHoCH)
→ "Which direction is likely?"
📦 Zone (OB/NPR/BB)
→ "Where will price react?"
💨 Momentum (EMA/VWC)
→ "Is there momentum now?"
```
**When all 3 align = Highest win-rate timing**
---
#### 2️⃣ Multi-Timeframe Analysis
```
Big picture: Confirm Daily direction
Medium-term: Check 1H Order Blocks
Short-term: Time entry on 5min
```
**Short-term entries aligned with higher timeframes = Better win rate**
---
#### 3️⃣ Understanding Liquidity
```
🎣 Institutional strategy:
1. Intentionally move price opposite to stop out retail
2. Then, move in real direction
💡 Liquidity Sweep = Visualize this "trap"
→ Read institutional order flow
```
---
### 🧠 Integration Examples
#### Case 1: RSI Alone vs Integrated System
**Scenario**: RSI at 30 (oversold)
```
❌ RSI-only decision:
→ "Buy!"
→ But downtrend continues, loss 😢
✅ Trend Gazer:
CHoCH check → Still downtrend ❌
Order Block → In Bearish OB ❌
LS Bounce → SHORT signal only ❌
→ Skip or SHORT
→ Avoid loss ✅
```
**Result**: Multiple filters block wrong entry
---
#### Case 2: LS Bounce Signal 2-Stage Logic
**Scenario**: Price touches 60min NPR lower band
```
🔍 Traditional method:
Touched → Buy!
→ But price continues down 😢
✅ Trend Gazer:
Stage 1: NPR touch + red bar → Flag ON
Stage 2: EMA20 crosses above EMA50 → Confirm bounce
→ Now "Long@ HL only" displays
→ Entry → Success ✅
```
**Result**: Not just "touch" but "touch + bounce confirmation" improves accuracy
---
### 🎓 Progressive Learning Design
This indicator is designed for **beginners to advanced**:
```
📖 Beginner (Month 1):
Use only CHoCH + LS Bounce Signal
→ Learn trend and entry points
📖 Intermediate (Months 2-3):
Add Order Block + Bar Color
→ Learn support/resistance and filtering
📖 Advanced (Month 6+):
Master all features
→ Read institutional order flow
```
**Ultimate goal**: Indicator becomes confirmation tool. Your market sense becomes primary.
---
### 🔬 Technical Advantages
#### 1. Non-Repaint STDEV (NPR)
```
Normal Bollinger Bands:
→ Past data changes (repaints)
→ Inaccurate backtesting
NPR:
→ Past data doesn't change (non-repaint)
→ Reliable verification possible
```
#### 2. 2-Stage Signal Logic
```
Traditional: Condition met → Immediate signal
→ Many false signals
Trend Gazer: Condition1 → Flag ON → Condition2 → Signal
→ Confirmation step improves accuracy
```
#### 3. Alternating Filter
```
Problem: Same-direction signals spam
→ Overtrading
Solution: LONG → SHORT → LONG alternating only
→ Prevent unnecessary entries
```
---
### 💎 Conclusion: Why Integration?
```
Single indicator = "Partial truth"
Integrated system = "3D market perspective"
```
**Markets are multifaceted**. One angle isn't enough.
Trend Gazer **integrates multiple screens pros watch simultaneously into ONE**,
allowing beginners to read charts with institutional perspective.
---
## FAQ
### ❓ Q1: Which timeframe is best?
**A**: Depends on trading style
```
Scalping: 1min ~ 5min
Day Trading: 5min ~ 15min
Swing: 1H ~ 4H
```
**Important**: LS Bounce Signal only works on 30min and below.
---
### ❓ Q2: Too many signals, confused
**A**: Enable filters
```
【Recommended Settings】
✅ Bonus Filter: ON
✅ Filter 6: ON
✅ ICT Market Structure Filter: ON
→ Show only Signal 0
```
This significantly reduces signal count.
---
### ❓ Q3: No CHoCH appearing, what to do?
**A**: Wait or check higher timeframe
```
Method 1: Wait for CHoCH (recommended)
Method 2: Check higher timeframe (e.g., Daily) for trend
Method 3: Disable ICT Filter (not recommended)
```
**When trend is unclear, sitting out is also strategy**.
---
### ❓ Q4: LS Bounce Signal not appearing
**A**: Checkpoints
```
1. Are you on 30min or below chart?
→ Doesn't show on 1H+
2. Are NPR/BB bands displayed?
→ Check Settings "Display 60min NPR Bands"
3. Is EMA50 excluded?
→ If "Exclude EMA50" is ON, EMA50 signals won't show
```
---
### ❓ Q5: Bar color not changing?
**A**: Check Filter 6
```
Settings → FINAL FILTERS
→ Confirm "Enable Filter 6 (OB/BB/NPR Zone Filter)" is ON
If ON but still not changing:
→ Current price may be outside OB/NPR/BB zones
```
---
### ❓ Q6: Too many Order Blocks, hard to see
**A**: Narrow down displayed OBs
```
Settings → ORDER BLOCK (OB) SETTINGS
Recommended:
❌ Show Current TF OB: OFF
❌ Show 1min OB: OFF
❌ Show 5min OB: OFF
✅ Show 15min OB: ON (only this)
```
---
### ❓ Q7: How to improve win rate?
**A**: Thorough multiple confirmations
```
Checklist:
✅ CHoCH appeared
✅ LS Bounce Signal (white text)
✅ Bar color matches (red bar=LONG, green bar=SHORT)
✅ Signal within Order Block
✅ Aligns with higher timeframe trend
Enter ONLY when all align
```
---
### ❓ Q8: Want to practice on demo
**A**: Recommended practice method
```
Week 1: Observation only
→ Watch signals and chart movement
→ Resist entering
Weeks 2-3: Keep records
→ Screenshot when signal appears
→ Record subsequent movement
Week 4+: Start demo trading
→ Start with small amounts
→ Continue keeping records
```
---
### ❓ Q9: Are there alert features?
**A**: Yes, multiple alerts available
```
Setup method:
1. Right-click indicator on chart
2. Select "Add Alert..."
3. Choose from:
- ANY ALERT: BUY/SELL Signals
- BUY ONLY ALERT
- SELL ONLY ALERT
- MS UP / MS DOWN
- BAR COLOR: RED / LIME
- LS BOUNCE: LONG / SHORT Signal
```
---
### ❓ Q10: Works on other markets?
**A**: Yes, works on all markets
```
✅ Cryptocurrency (BTC, ETH, etc.)
✅ Forex (EUR/USD, USD/JPY, etc.)
✅ Stocks (individual stocks, indices)
✅ Futures (oil, gold, etc.)
```
Works on any market with price and volume data.
---
## 📋 Disclaimer
### ⚠️ Important Notice
This indicator is for **educational and informational purposes only**.
```
❌ NOT investment advice
❌ Does NOT guarantee profits
❌ Past results do NOT guarantee future performance
```
### Risk Warning
```
⚠️ Trading involves substantial risk
⚠️ Only trade with funds you can afford to lose
⚠️ Practice extensively on demo account before live trading
⚠️ Make your own informed decisions and act at your own risk
```
---
## 📞 Support
### Feedback & Questions
Feel free to ask questions in TradingView comments section.
### Bug Reports
Please report with specific details (timeframe, symbol, screenshots).
---
**Author**: rasukaru666
**License**: Mozilla Public License 2.0
**Last Updated**: December 2025
**Version**: Latest
---
**Thank you for using Trend Gazer!**
**Happy Trading! 📈**
---------------

Trend Strength Meter [Eˣ]📊 Trend Strength Meter - Free Indicator
Overview
The Trend Strength Meter quantifies market momentum with a simple 0-100 score. No more guessing if a trend is strong or weak - this indicator gives you an objective, numerical measurement of trend strength that combines trend direction, momentum, volatility, and moving average alignment into one clear reading.
━━━━━━━━━━━━━━━━━━━━━━━━━━━━
🎯 What This Indicator Does
Quantifies Trend Strength:
• Measures trend on a scale from -100 (extreme bearish) to +100 (extreme bullish)
• Combines 4 key components: Trend Direction, Momentum, Volatility, MA Alignment
• Provides objective measurement instead of subjective interpretation
• Works on all timeframes and instruments
Visual Display:
• Green Histogram Bars = Bullish strength (0 to +100)
• Red Histogram Bars = Bearish strength (0 to -100)
• Smooth Overlay Line = Trend direction (filters noise)
• Triangle Markers = Trend reversals (zero-line crosses)
• Background Zones = Visual strength categories
Multi-Timeframe Analysis:
• See strength readings from 3 timeframes simultaneously
• Identify when trends align across multiple timeframes
• "ALIGNED" indicator shows when all timeframes agree
• Spot divergences between timeframes
Clean & Professional:
• Minimal clutter, maximum clarity
• Compact info panel in top-right corner
• No overwhelming indicators or text
• Easy to read at a glance
━━━━━━━━━━━━━━━━━━━━━━━━━━━━
📊 Understanding The Strength Scale
Bullish Readings (0 to +100)
+75 to +100 - VERY STRONG BULL
• Extremely powerful uptrend
• All components aligned bullishly
• Best time for aggressive long positions
• Trend likely to continue
• Strategy: Hold longs, avoid shorts
+50 to +75 - STRONG BULL
• Strong uptrend with good momentum
• High probability of continuation
• Quality long setups
• Pullbacks are buying opportunities
• Strategy: Enter longs on dips
+25 to +50 - BULL
• Moderate bullish trend
• Decent upward momentum
• Trend following longs work
• Watch for weakening signals
• Strategy: Ride the trend, trail stops
+10 to +25 - WEAK BULL
• Weak bullish bias
• Trend may be exhausting
• Lower probability setups
• Consider taking profits
• Strategy: Caution, reduce position sizes
-10 to +10 - NEUTRAL
• No clear trend
• Choppy, range-bound market
• Conflicting signals
• Low probability for trend trades
• Strategy: Stay flat or trade ranges
Bearish Readings (0 to -100)
-10 to -25 - WEAK BEAR
• Weak bearish bias
• Trend may be exhausting
• Lower probability setups
• Consider taking profits on shorts
• Strategy: Caution, reduce position sizes
-25 to -50 - BEAR
• Moderate bearish trend
• Decent downward momentum
• Trend following shorts work
• Watch for weakening signals
• Strategy: Ride the trend down, trail stops
-50 to -75 - STRONG BEAR
• Strong downtrend with momentum
• High probability of continuation
• Quality short setups
• Bounces are selling opportunities
• Strategy: Enter shorts on rallies
-75 to -100 - VERY STRONG BEAR
• Extremely powerful downtrend
• All components aligned bearishly
• Best time for aggressive short positions
• Trend likely to continue
• Strategy: Hold shorts, avoid longs
━━━━━━━━━━━━━━━━━━━━━━━━━━━━
📊 How To Use This Indicator
Basic Usage
1. Check Current Strength
• Look at the histogram height and color
• Read the exact number in the info panel
• Note the status label (STRONG BULL, WEAK BEAR, etc.)
• Higher absolute value = stronger trend
2. Watch For Reversals
• Triangle markers appear when strength crosses zero
• 🟢 Green triangle up = Bullish reversal signal
• 🔴 Red triangle down = Bearish reversal signal
• These mark potential trend changes
3. Monitor Multi-Timeframe Alignment
• Check if all timeframes show same direction
• "✓ ALIGNED" = All timeframes agree (high confidence)
• "✗ Mixed" = Timeframes disagree (lower confidence)
• Aligned trends have higher probability
4. Observe Strength Changes
• Rising strength = Trend strengthening
• Falling strength = Trend weakening
• Strength near extremes (+75/-75) = Potential exhaustion
• Strength near zero = Indecision/consolidation
━━━━━━━━━━━━━━━━━━━━━━━━━━━━
💡 Trading Strategies
Strategy 1: Trend Following
Best For: Capturing major moves
Timeframes: 1H, 4H, Daily
Rules:
1. Wait for strength to reach +50 or higher (or -50 or lower)
2. Check MTF alignment - all timeframes should agree
3. Enter on pullbacks in the direction of strength
4. Hold position while strength remains above +25 (or below -25)
5. Exit when strength crosses back to weak zone or reverses
Example - Long Setup:
• Strength crosses above +50 = Strong bull trend
• All MTF readings positive and aligned
• Wait for minor pullback to support
• Enter long with stop below recent swing low
• Hold while strength stays above +25
• Exit if strength drops below +10 or reverses to negative
Strategy 2: Reversal Trading
Best For: Catching trend changes early
Timeframes: 15min, 1H, 4H
Rules:
1. Watch for strength to reach extreme levels (+75 or -75)
2. Look for divergence (price new high/low but strength declining)
3. Wait for zero-line cross (triangle marker appears)
4. Enter in direction of new trend
5. Use tight stops since you're catching early
Example - Bullish Reversal:
• Strength at -80 (very strong bear)
• Price makes new low but strength only at -70 = Divergence
• Green triangle appears = Zero-line cross
• Enter long on confirmation
• Stop below recent swing low
• Target: Strength reaching +50
Strategy 3: Avoid Bad Trades
Best For: Improving win rate
Timeframes: All
Rules:
• DON'T trade when strength is between -10 and +10 (neutral zone)
• DON'T go long when strength is negative
• DON'T go short when strength is positive
• DON'T trade against MTF alignment
• DO wait for clear strength readings
Why It Works: Most losses come from trading in choppy markets or against the trend
Strategy 4: Position Sizing Based On Strength
Best For: Risk management
Timeframes: All
Rules:
• Strength +75 to +100 or -75 to -100 = Full position size (2-3% risk)
• Strength +50 to +75 or -50 to -75 = Normal position (1.5-2% risk)
• Strength +25 to +50 or -25 to -50 = Reduced position (1% risk)
• Strength -10 to +10 = No trades or minimal size (0.5% risk)
Why It Works: Bigger positions in stronger trends, smaller in weak trends
━━━━━━━━━━━━━━━━━━━━━━━━━━━━
⚙️ Settings Explained
Multi-Timeframe Analysis
• Toggle ON/OFF the MTF readings in the info panel
• Turn OFF for cleaner display if you only trade one timeframe
Timeframe 1, 2, 3 (Default: 15min, 1H, 4H)
• Choose which timeframes to analyze
• For day trading: Use 5min, 15min, 1H
• For swing trading: Use 1H, 4H, Daily
• For position trading: Use 4H, Daily, Weekly
• Higher timeframes show bigger picture trends
MA Length (Default: 20)
• Moving average period for trend direction component
• Lower values (10-15): More responsive, more signals
• Higher values (25-50): Smoother, fewer signals
• Recommended: 20 for most styles
ATR Length (Default: 14)
• Period for measuring volatility
• Standard setting works well for most markets
• Recommended: Keep at 14
RSI Length (Default: 14)
• Period for momentum measurement
• Standard setting works well for most markets
• Recommended: Keep at 14
Show Trend Labels on Chart
• Toggle ON to display "BULL" / "BEAR" text at reversals
• Keep OFF for cleaner chart (default)
• Useful when backtesting to see historical signals
Show Reversal Signals
• Toggle triangle markers at zero-line crosses
• Keep ON to catch trend changes
• Turn OFF if you only care about current strength
━━━━━━━━━━━━━━━━━━━━━━━━━━━━
🎓 How The Calculation Works
The indicator measures 4 components, each worth 25 points (total = 100):
1. Trend Direction (25 points)
• Compares price to moving average
• Checks if MA is rising or falling
• Perfect score: Price above rising MA
• Minimum score: Price below falling MA
2. Momentum (25 points)
• Uses RSI to measure momentum strength
• RSI > 70 = Maximum bullish points
• RSI < 30 = Maximum bearish points
• RSI near 50 = Neutral points
3. Volatility Alignment (25 points)
• Checks if price moves align with volatility
• Strong moves in trending direction = High score
• Weak moves or counter-trend = Low score
• Uses ATR to measure volatility
4. Moving Average Alignment (25 points)
• Checks EMA 8, 21, and 55 positioning
• Perfect bullish: 8 > 21 > 55 above price
• Perfect bearish: 8 < 21 < 55 below price
• Misaligned = Reduced score
Final Score = Sum of all 4 components (-100 to +100)
━━━━━━━━━━━━━━━━━━━━━━━━━━━━
📱 Info Panel Guide
Current
• Shows exact strength number for current timeframe
• Color-coded background (green = bullish, red = bearish)
• Larger number for quick visibility
Status
• Text description of current trend state
• Examples: "STRONG BULL", "WEAK BEAR", "NEUTRAL"
• Quick interpretation without looking at number
Timeframe Readings
• Shows strength for each selected timeframe
• Color-coded for quick reading
• Compare to spot divergences
MTF Alignment
• ✓ ALIGNED = All timeframes show same direction (high confidence)
• ✗ Mixed = Timeframes disagree (proceed with caution)
• Most reliable trades happen when aligned
━━━━━━━━━━━━━━━━━━━━━━━━━━━━
📱 Alert Setup
This indicator includes 4 alert types:
1. Bullish Reversal
• Triggers when strength crosses from negative to positive
• Potential trend change from bearish to bullish
• Early warning of new uptrend
2. Bearish Reversal
• Triggers when strength crosses from positive to negative
• Potential trend change from bullish to bearish
• Early warning of new downtrend
3. Very Strong Bull
• Triggers when strength reaches +75 or higher
• Extreme bullish conditions
• Aggressive long opportunity
4. Very Strong Bear
• Triggers when strength reaches -75 or lower
• Extreme bearish conditions
• Aggressive short opportunity
To Set Up Alerts:
1. Click "Alert" button (clock icon)
2. Select "Trend Strength Meter"
3. Choose your alert type
4. Configure notifications
5. Click "Create"
━━━━━━━━━━━━━━━━━━━━━━━━━━━━
💎 Pro Tips & Best Practices
✅ DO:
• Trust the extremes - Readings above +75 or below -75 are highly reliable
• Wait for alignment - Best trades happen when MTF shows "ALIGNED"
• Use with price action - Combine with support/resistance for entries
• Respect the neutral zone - Avoid trading when strength is -10 to +10
• Scale position size - Bigger positions in stronger trends
• Watch for divergence - Price new high but strength declining = Warning
• Follow the trend - Don't fight strong readings (±50 or more)
⚠️ DON'T:
• Don't trade neutral readings - Wait for clear strength above ±25
• Don't fade extremes - Very strong trends (+75/-75) can stay extreme
• Don't ignore MTF - Mixed timeframes = Lower probability
• Don't overtrade - Wait for quality setups with good strength
• Don't use alone - Combine with support/resistance and risk management
• Don't expect perfection - Even strong trends can reverse suddenly
🎯 Best Timeframes:
• Scalping: 1min, 5min (fast readings, quick changes)
• Day Trading: 5min, 15min, 1H (balanced view)
• Swing Trading: 1H, 4H, Daily (stable trends)
• Position Trading: 4H, Daily, Weekly (major trends)
🔥 Best Markets:
• Trending markets (crypto, indices, commodities)
• High liquidity instruments (BTC, ES, NQ, EUR/USD)
• Avoid on low-volume stocks or exotic pairs
⏰ Works Best When:
• Market has clear direction
• Good volatility (not too choppy, not too quiet)
• Multiple timeframes aligned
• Away from major news events
━━━━━━━━━━━━━━━━━━━━━━━━━━━━
🚀 What Makes This Different?
Unlike subjective trend analysis, the Trend Strength Meter:
• Objective Measurement - No guessing, exact numerical score
• Multi-Component - Combines 4 factors, not just one indicator
• Multi-Timeframe - See alignment across timeframes instantly
• Clean Visual - Professional display, easy to interpret
• Actionable - Clear signals for entries, exits, and position sizing
• Universal - Works on all timeframes and instruments
• Proven Components - Based on trend, momentum, volatility, MA alignment
Perfect For:
• Trend followers who want confirmation
• Swing traders seeking high-probability setups
• Risk managers wanting to size positions properly
• Anyone tired of subjective "is this trend strong?" questions
━━━━━━━━━━━━━━━━━━━━━━━━━━━━
📈 Common Patterns To Watch
Pattern 1: The Steady Climb
• Strength gradually rises from +25 to +50 to +75
• Indicates building momentum
• Trade: Hold longs, add on pullbacks
Pattern 2: The Quick Spike
• Strength jumps from 0 to +75 in few bars
• Indicates explosive momentum
• Trade: Enter quickly, but expect pullback
Pattern 3: The Exhaustion
• Strength at +80, price new high, strength drops to +70
• Bearish divergence forming
• Trade: Take profits, prepare for reversal
Pattern 4: The Whipsaw
• Strength oscillates between +10 and -10
• Choppy, range-bound market
• Trade: Stay flat, wait for breakout
Pattern 5: The False Breakout
• Strength briefly crosses +50 then drops back
• Weak momentum, trend not confirmed
• Trade: Wait for sustained strength above +50
━━━━━━━━━━━━━━━━━━━━━━━━━━━━
📈 Upgrade Your Trading System
This free indicator quantifies trend strength objectively. Want more?
🔥 Check out my premium scripts for:
• Automated entry and exit signals with trend confirmation
• Advanced multi-timeframe strategy systems
• Dynamic position sizing based on trend strength
• Backtested performance with statistics
• Complete trading solutions
• And much more...
👉 Visit my profile for professional-grade trading tools!
━━━━━━━━━━━━━━━━━━━━━━━━━━━━
📝 Important Notes
• This indicator measures trend strength, not direction alone
• Strong readings don't guarantee continuation (manage risk)
• Always use with proper stop losses
• Combine with support/resistance analysis
• Test on demo before live trading
• Past performance doesn't guarantee future results
• Adjust settings to match your trading style
Disclaimer: For educational purposes only. Trading involves substantial risk. Always do your own research and never risk more than you can afford to lose.
━━━━━━━━━━━━━━━━━━━━━━━━━━━━
🙏 Support This Work
If this indicator helps your trading:
• ⭐ Give it a thumbs up
• 💬 Share your best strength-based trades in comments
• 🔔 Follow for more free professional tools
• 🚀 Share with traders who need objective trend analysis
Questions about trend strength? Drop a comment and I'll help!
━━━━━━━━━━━━━━━━━━━━━━━━━━━━
Developed with ❤️ for traders who want objective, quantified analysis
━━━━━━━━━━━━━━━━━━━━━━━━━━━━
Version History
• v1.0 - Initial release with 4-component strength calculation and MTF analysis

ProCrypto OI Candles (auto symbol) — by ruben_procryptoProCrypto OI Candles (Auto Symbol) visualizes Open Interest in a clear and intuitive way by converting OI data into candles and a smooth trendline.
The script automatically detects the correct OI symbol based on the chart you are viewing, so there is no need to manually change OI tickers when switching between assets.
🔹 Key Features
Automatic Symbol Detection
The indicator automatically selects the appropriate Open Interest data source for the asset on your chart (BTC, SOL, ADA, DOGE, etc.).
OI Candles
Open Interest is displayed as candles to show whether market participation is increasing or decreasing on each bar.
Multi-exchange Support
Users can choose OI data from Binance, Bybit, or OKX. Any combination is supported.
Smooth OI Trendline
An optional EMA-based OI line provides a clear view of the underlying trend in trader activity.
Delta Bars (optional)
Highlights whether Open Interest expanded or contracted within the candle.
🔹 How to Interpret OI
Typical relationships between price and OI:
Price ↑ + OI ↑ → Trend continuation likely
New positions entering the market.
Price ↑ + OI ↓ → Short squeeze / weak move
Shorts closing, not new longs opening.
Price ↓ + OI ↑ → New shorts entering
Often signals bearish pressure.
Price ↓ + OI ↓ → Longs closing
Can indicate capitulation or consolidation.
These concepts help traders understand the strength or weakness behind a price move.
🔹 Inputs
Choose exchange(s) for OI data
Adjust candle opacity
Enable/disable OI line
Smoothing length for OI line
Optional delta bars
Range lookback for line offset
All settings are customizable to suit different styles of analysis.
🔹 Notes
Some assets may not have Open Interest data available on all exchanges.
The indicator uses standard TradingView data sources via request.security().
No trading signals are generated; this script is a visualization tool only.
🔹 Author
Created by ruben_procrypto for traders who analyze liquidity, Open Interest, and market participation.

YM Ultimate SNIPER v8.1# YM Ultimate SNIPER v8.1 - SNIPER STRICT EDITION
## 🎯 CHANGELOG: What's New in v8.1
### The Problem We Fixed
**GOD MODE was handing out awards like participation trophies.** Too many wicky, indecisive candles were getting GOD MODE status just because they had enough confluence points. A GOD MODE candle should show **CLEAR DOMINANCE** - fat body, minimal adverse wick, consistent pressure throughout formation.
---
## 🔥 MAJOR CHANGES
### 1. CANDLE DOMINANCE INDEX (CDI) - NEW METRIC
The CDI quantifies "who won the candle" on a 0-10 scale:
```
CDI COMPONENTS:
├── Body Score (0-4 pts): How fat is the body?
├── Adverse Wick Score (0-3 pts): How small is the wick against direction?
├── Favorable Wick Score (0-2 pts): Clean entry side?
└── Closing Strength (0-1 pt): Did it close near the extreme?
CDI RATINGS:
├── 8.0+ = 🔥 DOMINANT (ideal for GOD MODE)
├── 6.0-7.9 = ✓✓ STRONG
├── 4.0-5.9 = ✓ ACCEPTABLE
└── <4.0 = WEAK (not GOD MODE worthy)
```
### 2. STRICT GOD MODE GATES (6 GATES)
**Score alone no longer qualifies for GOD MODE.** Now a candle must pass ALL 6 gates:
| Gate | Requirement | Default |
|------|-------------|---------|
| **1. Score** | Must meet GOD MODE threshold | ≥9.0 |
| **2. Body** | Body ratio must be "fat" | ≥70% |
| **3. Adverse Wick** | Wick against direction must be small | ≤20% |
| **4. Delta** | Buy/sell dominance must be strong | ≥70% |
| **5. Session** | Must be in active session (configurable) | LDN/NY/PWR |
| **6. Pressure** | Intrabar pressure must be consistent | Same side dominated early AND late |
**If ANY gate fails, GOD MODE is DENIED** - even with a 10/10 score!
### 3. 30-BAR SIGNAL DISPLAY LIMIT
**Past signals are now hidden.** Only the last 30 bars show tier markers, sweeps, and absorption signals. This keeps the chart clean and focused on recent action.
```
WHAT'S HIDDEN AFTER 30 BARS:
├── Tier signals (S/A/B/Z)
├── GOD MODE markers
├── Liquidity sweep diamonds
├── Absorption crosses
└── Stop/Target lines
WHAT ALWAYS SHOWS:
├── FVG/IFVG zones (structural)
├── Order Blocks (structural)
├── Session markers (context)
└── Session background colors
```
**Configurable:** Change "Show Signals: Last N Bars" in settings (10-100)
### 4. PRESSURE CONSISTENCY TRACKING
New intrabar analysis that tracks if the **same side dominated throughout the candle**:
```
CANDLE FORMATION ANALYSIS:
├── First Half: Who dominated? (earlyBuyVol vs earlySellVol)
├── Second Half: Who dominated? (lateBuyVol vs lateSellVol)
└── Consistent? = Same side won BOTH halves
PRESSURE CONSISTENT = Buyers dominated early AND late
OR Sellers dominated early AND late
PRESSURE MIXED = Buyers dominated early, sellers late
OR Sellers dominated early, buyers late
```
**GOD MODE requires consistent pressure** when intrabar analysis is enabled.
### 5. GOD MODE DENIAL REASON IN TABLE
When a candle scores 9.0+ but fails a gate, the table now shows **WHY**:
```
DENIAL REASONS:
├── "DENIED: WICK" = Adverse wick too large (>20%)
├── "DENIED: DELTA" = Delta dominance too weak (<70%)
├── "DENIED: SESSION" = Not in active session
├── "DENIED: VOLUME" = Volume below 1.5x
└── "DENIED: PRESSURE" = Mixed pressure during formation
```
---
## 📊 NEW TABLE SECTIONS
### CANDLE QUALITY Section (NEW)
```
══ CANDLE QUALITY ══
Body | 78% | FAT
Adv Wick | 12% | CLEAN
CDI | 8.2/10 | 🔥
```
### INTRABAR Section (UPDATED)
```
══ INTRABAR ══
IB Data | 12 bars | ✓
IB Delta | 74% BUY | 🔥
Pressure | CONSISTENT | ✓ ← NEW
```
---
## ⚙️ NEW SETTINGS
### CANDLE DOMINANCE (v8.1) Group
```
GOD MODE: Min Body Ratio = 0.70 (body must be 70%+ of range)
GOD MODE: Max Adverse Wick = 0.20 (wick against direction ≤20%)
GOD MODE: Min Delta Dominance = 0.70 (70%+ buy/sell dominance)
GOD MODE: Min Intrabar Delta = 0.68 (intrabar delta ≥68%)
GOD MODE: Require Active Session = ON
GOD MODE: Require 1.5x+ Volume = ON
```
### SIGNAL DISPLAY (v8.1) Group
```
Show Signals: Last N Bars = 30
Show Historical FVG/OB Zones = ON (zones always visible)
```
---
## 🎯 PRACTICAL IMPACT
### Before v8.1 (Too Many False GOD MODE)
```
Candle: 35 point move, score 9.2, BUT:
- Body only 55% of range (thin)
- Upper wick 35% (buyers got pushed back hard)
- Intrabar showed mixed pressure
RESULT: GOD MODE ⚡ (WRONG!)
```
### After v8.1 (Strict GOD MODE)
```
Same candle: Score 9.2, but:
- Gate 2 FAILED: Body 55% < 70% required
- Gate 3 FAILED: Wick 35% > 20% allowed
- Gate 6 FAILED: Pressure inconsistent
RESULT: DENIED: WICK (Correct - this was a fake-out candle)
```
---
## 🏆 THE NEW GOD MODE STANDARD
A TRUE GOD MODE candle must show:
1. **HIGH SCORE** (≥9.0) - Multiple confluence factors aligned
2. **FAT BODY** (≥70%) - Clear directional commitment
3. **CLEAN WICKS** (≤20% adverse) - Minimal pushback
4. **STRONG DELTA** (≥70%) - One side clearly dominated
5. **IN SESSION** - Institutional participation
6. **CONSISTENT PRESSURE** - Same side controlled throughout
**Translation:** *"Institutions stepped in with size, pushed hard in one direction, and never let up. No hesitation, no give-back. This is a candle that means business."*
---
## 📈 YM/MYM OPTIMIZATION NOTES
The default settings are tuned for YM's characteristics:
- Lower volatility than NQ/GC/BTC → Tighter gates work better
- 50 pts for S-Tier is already conservative
- 70% body ratio filters out the indecisive noise
- Session requirement is crucial - YM moves on institutional flow
### Low Volume Conditions
The strict gates actually **help** in low volume:
- Wicky candles (common in low vol) get filtered
- Pressure consistency catches fake moves
- CDI prevents thin-body noise from triggering
---
## 🚀 QUICK START
1. Apply v8.1 to your 5-minute YM chart
2. Set intrabar to "1" (1-minute) or "100T" (tick)
3. Watch the CANDLE QUALITY section in the table
4. GOD MODE will now be RARE - but TRUSTWORTHY
5. Check the DENIAL reason if score is 9+ but no ⚡
---
*v8.1 SNIPER STRICT EDITION - "Fat Candles Only"*
*© Alexandro Disla*
