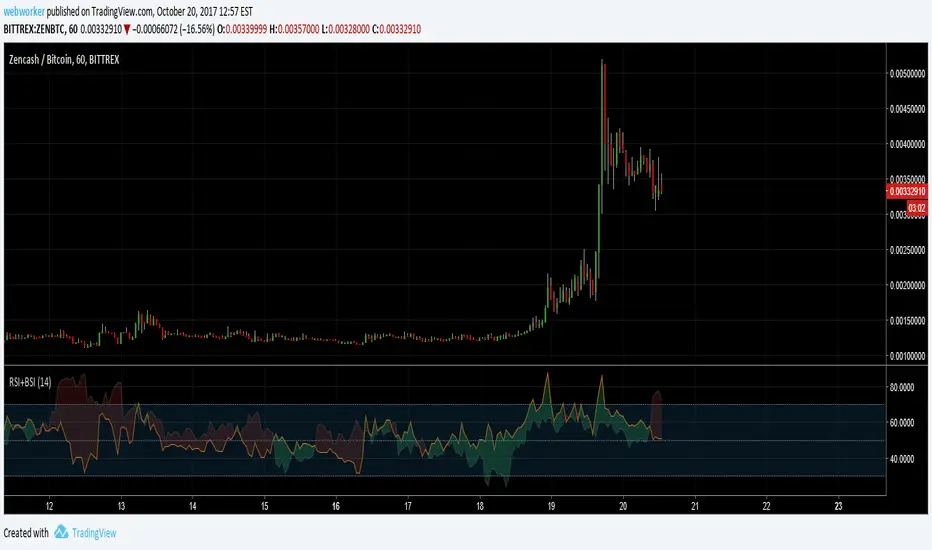
RSI+BSIThis script simply plots the current instruments RSI as well as Bitcoin's RSI from bitfinex. Helpful to identify when an alt is performing stronger than BTC or if BTC is dragging the alt down.
Search in scripts for "btc走势预测"
Volume Conversion IndicatorVolume Conversion Indicator
The volume conversion indicator is much like the in-built volume indicator. This particular volume indicator allows you to find out how much of something has been traded in a given timeframe.
This is done by multiplying volume by the average price at that point.
What does this mean?
Well, say, for example, you were watching DGB/BTC (DigiByte/Bitcoin). Instead of the volume being displayed in the amount of DGB traded, the amount of BTC traded is displayed instead.
Feel free to comment... Hope this helps :D

Indicator: Schaff Trend Cycle (STC)Another new indicator for TV community :)
STC detects up and down trends long before the MACD. It does this by using the same exponential moving averages (EMAs), but adds a cycle component to factor instrument cycle trends. STC gives more accuracy and reliability than the MACD.
More info: www.investopedia.com
Feel free to "Make mine" this chart and use the indicator in your charts. Appreciate any feedback on how effective this is for your instrument (I have tested this only with BTC).
For people trading BTC:
-------------------------------
Try 3/10 or 9/30 for MACD (fastLength/slowLength). They seem to catch the cycles better than the defaults. :)

ProCrypto OI Candles (auto symbol) — by ruben_procryptoProCrypto OI Candles (Auto Symbol) visualizes Open Interest in a clear and intuitive way by converting OI data into candles and a smooth trendline.
The script automatically detects the correct OI symbol based on the chart you are viewing, so there is no need to manually change OI tickers when switching between assets.
🔹 Key Features
Automatic Symbol Detection
The indicator automatically selects the appropriate Open Interest data source for the asset on your chart (BTC, SOL, ADA, DOGE, etc.).
OI Candles
Open Interest is displayed as candles to show whether market participation is increasing or decreasing on each bar.
Multi-exchange Support
Users can choose OI data from Binance, Bybit, or OKX. Any combination is supported.
Smooth OI Trendline
An optional EMA-based OI line provides a clear view of the underlying trend in trader activity.
Delta Bars (optional)
Highlights whether Open Interest expanded or contracted within the candle.
🔹 How to Interpret OI
Typical relationships between price and OI:
Price ↑ + OI ↑ → Trend continuation likely
New positions entering the market.
Price ↑ + OI ↓ → Short squeeze / weak move
Shorts closing, not new longs opening.
Price ↓ + OI ↑ → New shorts entering
Often signals bearish pressure.
Price ↓ + OI ↓ → Longs closing
Can indicate capitulation or consolidation.
These concepts help traders understand the strength or weakness behind a price move.
🔹 Inputs
Choose exchange(s) for OI data
Adjust candle opacity
Enable/disable OI line
Smoothing length for OI line
Optional delta bars
Range lookback for line offset
All settings are customizable to suit different styles of analysis.
🔹 Notes
Some assets may not have Open Interest data available on all exchanges.
The indicator uses standard TradingView data sources via request.security().
No trading signals are generated; this script is a visualization tool only.
🔹 Author
Created by ruben_procrypto for traders who analyze liquidity, Open Interest, and market participation.

YM Ultimate SNIPER v8.1# YM Ultimate SNIPER v8.1 - SNIPER STRICT EDITION
## 🎯 CHANGELOG: What's New in v8.1
### The Problem We Fixed
**GOD MODE was handing out awards like participation trophies.** Too many wicky, indecisive candles were getting GOD MODE status just because they had enough confluence points. A GOD MODE candle should show **CLEAR DOMINANCE** - fat body, minimal adverse wick, consistent pressure throughout formation.
---
## 🔥 MAJOR CHANGES
### 1. CANDLE DOMINANCE INDEX (CDI) - NEW METRIC
The CDI quantifies "who won the candle" on a 0-10 scale:
```
CDI COMPONENTS:
├── Body Score (0-4 pts): How fat is the body?
├── Adverse Wick Score (0-3 pts): How small is the wick against direction?
├── Favorable Wick Score (0-2 pts): Clean entry side?
└── Closing Strength (0-1 pt): Did it close near the extreme?
CDI RATINGS:
├── 8.0+ = 🔥 DOMINANT (ideal for GOD MODE)
├── 6.0-7.9 = ✓✓ STRONG
├── 4.0-5.9 = ✓ ACCEPTABLE
└── <4.0 = WEAK (not GOD MODE worthy)
```
### 2. STRICT GOD MODE GATES (6 GATES)
**Score alone no longer qualifies for GOD MODE.** Now a candle must pass ALL 6 gates:
| Gate | Requirement | Default |
|------|-------------|---------|
| **1. Score** | Must meet GOD MODE threshold | ≥9.0 |
| **2. Body** | Body ratio must be "fat" | ≥70% |
| **3. Adverse Wick** | Wick against direction must be small | ≤20% |
| **4. Delta** | Buy/sell dominance must be strong | ≥70% |
| **5. Session** | Must be in active session (configurable) | LDN/NY/PWR |
| **6. Pressure** | Intrabar pressure must be consistent | Same side dominated early AND late |
**If ANY gate fails, GOD MODE is DENIED** - even with a 10/10 score!
### 3. 30-BAR SIGNAL DISPLAY LIMIT
**Past signals are now hidden.** Only the last 30 bars show tier markers, sweeps, and absorption signals. This keeps the chart clean and focused on recent action.
```
WHAT'S HIDDEN AFTER 30 BARS:
├── Tier signals (S/A/B/Z)
├── GOD MODE markers
├── Liquidity sweep diamonds
├── Absorption crosses
└── Stop/Target lines
WHAT ALWAYS SHOWS:
├── FVG/IFVG zones (structural)
├── Order Blocks (structural)
├── Session markers (context)
└── Session background colors
```
**Configurable:** Change "Show Signals: Last N Bars" in settings (10-100)
### 4. PRESSURE CONSISTENCY TRACKING
New intrabar analysis that tracks if the **same side dominated throughout the candle**:
```
CANDLE FORMATION ANALYSIS:
├── First Half: Who dominated? (earlyBuyVol vs earlySellVol)
├── Second Half: Who dominated? (lateBuyVol vs lateSellVol)
└── Consistent? = Same side won BOTH halves
PRESSURE CONSISTENT = Buyers dominated early AND late
OR Sellers dominated early AND late
PRESSURE MIXED = Buyers dominated early, sellers late
OR Sellers dominated early, buyers late
```
**GOD MODE requires consistent pressure** when intrabar analysis is enabled.
### 5. GOD MODE DENIAL REASON IN TABLE
When a candle scores 9.0+ but fails a gate, the table now shows **WHY**:
```
DENIAL REASONS:
├── "DENIED: WICK" = Adverse wick too large (>20%)
├── "DENIED: DELTA" = Delta dominance too weak (<70%)
├── "DENIED: SESSION" = Not in active session
├── "DENIED: VOLUME" = Volume below 1.5x
└── "DENIED: PRESSURE" = Mixed pressure during formation
```
---
## 📊 NEW TABLE SECTIONS
### CANDLE QUALITY Section (NEW)
```
══ CANDLE QUALITY ══
Body | 78% | FAT
Adv Wick | 12% | CLEAN
CDI | 8.2/10 | 🔥
```
### INTRABAR Section (UPDATED)
```
══ INTRABAR ══
IB Data | 12 bars | ✓
IB Delta | 74% BUY | 🔥
Pressure | CONSISTENT | ✓ ← NEW
```
---
## ⚙️ NEW SETTINGS
### CANDLE DOMINANCE (v8.1) Group
```
GOD MODE: Min Body Ratio = 0.70 (body must be 70%+ of range)
GOD MODE: Max Adverse Wick = 0.20 (wick against direction ≤20%)
GOD MODE: Min Delta Dominance = 0.70 (70%+ buy/sell dominance)
GOD MODE: Min Intrabar Delta = 0.68 (intrabar delta ≥68%)
GOD MODE: Require Active Session = ON
GOD MODE: Require 1.5x+ Volume = ON
```
### SIGNAL DISPLAY (v8.1) Group
```
Show Signals: Last N Bars = 30
Show Historical FVG/OB Zones = ON (zones always visible)
```
---
## 🎯 PRACTICAL IMPACT
### Before v8.1 (Too Many False GOD MODE)
```
Candle: 35 point move, score 9.2, BUT:
- Body only 55% of range (thin)
- Upper wick 35% (buyers got pushed back hard)
- Intrabar showed mixed pressure
RESULT: GOD MODE ⚡ (WRONG!)
```
### After v8.1 (Strict GOD MODE)
```
Same candle: Score 9.2, but:
- Gate 2 FAILED: Body 55% < 70% required
- Gate 3 FAILED: Wick 35% > 20% allowed
- Gate 6 FAILED: Pressure inconsistent
RESULT: DENIED: WICK (Correct - this was a fake-out candle)
```
---
## 🏆 THE NEW GOD MODE STANDARD
A TRUE GOD MODE candle must show:
1. **HIGH SCORE** (≥9.0) - Multiple confluence factors aligned
2. **FAT BODY** (≥70%) - Clear directional commitment
3. **CLEAN WICKS** (≤20% adverse) - Minimal pushback
4. **STRONG DELTA** (≥70%) - One side clearly dominated
5. **IN SESSION** - Institutional participation
6. **CONSISTENT PRESSURE** - Same side controlled throughout
**Translation:** *"Institutions stepped in with size, pushed hard in one direction, and never let up. No hesitation, no give-back. This is a candle that means business."*
---
## 📈 YM/MYM OPTIMIZATION NOTES
The default settings are tuned for YM's characteristics:
- Lower volatility than NQ/GC/BTC → Tighter gates work better
- 50 pts for S-Tier is already conservative
- 70% body ratio filters out the indecisive noise
- Session requirement is crucial - YM moves on institutional flow
### Low Volume Conditions
The strict gates actually **help** in low volume:
- Wicky candles (common in low vol) get filtered
- Pressure consistency catches fake moves
- CDI prevents thin-body noise from triggering
---
## 🚀 QUICK START
1. Apply v8.1 to your 5-minute YM chart
2. Set intrabar to "1" (1-minute) or "100T" (tick)
3. Watch the CANDLE QUALITY section in the table
4. GOD MODE will now be RARE - but TRUSTWORTHY
5. Check the DENIAL reason if score is 9+ but no ⚡
---
*v8.1 SNIPER STRICT EDITION - "Fat Candles Only"*
*© Alexandro Disla*

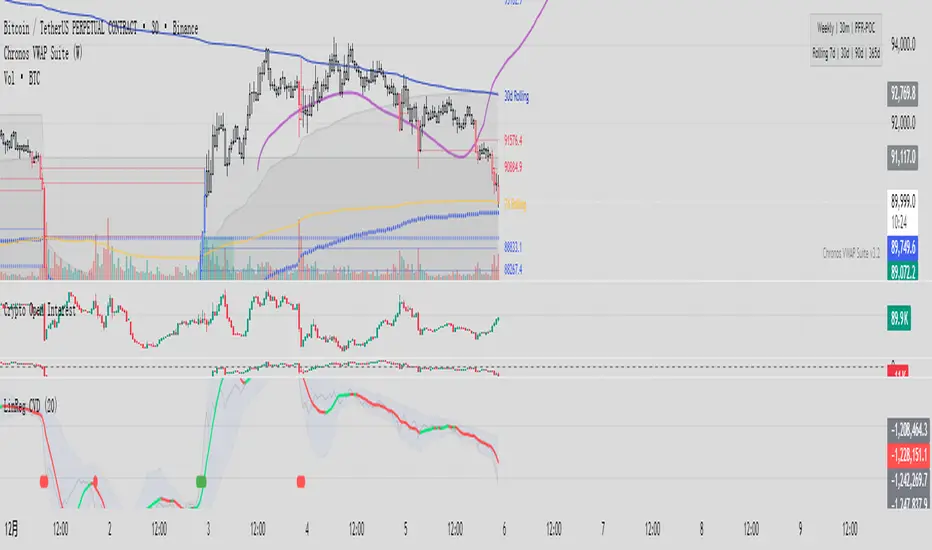
Linear Regression CVDHere is the complete user manual and introduction for the Linear Regression CVD indicator in English. You can save this as your documentation for your trading system.
📊 Linear Regression CVD – Trader’s Manual
1. Introduction
Core Concept:
Standard Cumulative Volume Delta (CVD) indicators are often noisy and jagged, making it difficult to decipher the true direction of capital flow. This indicator applies a Linear Regression algorithm to smooth out the CVD data and adds a Standard Deviation Channel. It is designed to answer two critical questions:
What is the "True Trend" of the money flow? (Filtering out noise)
Is the market sentiment currently overheated? (Using the channel to spot extremes)
Best Markets:
Crypto Perpetual Futures (e.g., BTCUSDT.P) — Highly Recommended.
Stocks & Forex (Must have volume data).
Timeframes:
Scalping: 1m, 5m, 15m (To catch rapid capital inflows/outflows).
Swing Trading: 1H, 4H (To identify the dominant direction of "Smart Money").
2. Visual Guide
When you load the indicator, you will see the following elements:
A. The Main Line (Linear Regression)
Appearance: A smooth, thick line.
Meaning: The average trend of capital flow.
Color Logic:
🟢 Green: Money flow is trending UP (Buyers are dominant).
🔴 Red: Money flow is trending DOWN (Sellers are dominant).
B. The Raw Line (Gray Hairline)
Appearance: A thin, jagged gray line fluctuating around the main line.
Meaning: The Raw, Real-time CVD. It calculates the volume delta (Close vs. Open) for every single candle without smoothing.
C. The Channel (Blue Background)
Appearance: A blue shaded area around the main line.
Meaning: The "Normal Volatility Range."
Calculated based on 2 Standard Deviations (2σ) from the Linear Regression.
If the Gray Line stays inside this channel, the market is stable/balanced.
D. The Signal Dots
🟢 Green Dot (Upside Extension): The Raw CVD has broken above the upper channel.
Meaning: Extreme Greed / Aggressive Buying / FOMO.
🔴 Red Dot (Downside Extension): The Raw CVD has broken below the lower channel.
Meaning: Extreme Fear / Panic Selling / Capitulation.
3. Trading Strategies
Strategy 1: Trend Confirmation
The basic "Follow the Money" approach.
Bullish Signal (Long):
Price is making Higher Highs.
CVD Main Line turns Green and slopes upward.
Action: Confirms that the price rise is backed by real volume. Hold or Add to Longs.
Bearish Signal (Short):
Price is making Lower Lows.
CVD Main Line turns Red and slopes downward.
Action: Confirms that sellers are in control. Hold Shorts.
Strategy 2: Divergence (High Win Rate)
Finding disagreements between "Price" and "Money Flow".
Bearish Divergence (Top Signal):
Price makes a Higher High.
CVD Main Line makes a Lower High (or fails to break out).
Meaning: Price is rising, but buying effort is fading (Exhaustion) or Limit Sellers are absorbing the buy orders (Absorption).
Action: Look for Short entries.
Bullish Divergence (Bottom Signal):
Price makes a Lower Low.
CVD Main Line makes a Higher Low.
Meaning: Price is dropping, but selling pressure is drying up, or Smart Money is absorbing sell orders via limit buy orders.
Action: Look for Long entries.
Strategy 3: Mean Reversion (Extreme Extensions)
Using the Red/Green dots to fade extremes.
Long Opportunity (Bounce):
Price crashes rapidly.
Cluster of Red Dots appears at the bottom.
Meaning: Panic selling has peaked (Capitulation). The market is oversold on a volume basis.
Action: Wait for a candle reversal pattern, then Long for a bounce.
Short Opportunity (Pullback):
Price pumps vertically.
Cluster of Green Dots appears at the bottom.
Meaning: Retail traders are chasing the pump (FOMO). Buying power is overextended.
Action: Wait for momentum to stall, then Short.
4. Important Limitations & Notes
Data Source Accuracy:
TradingView Standard Volume is an approximation (Close vs. Open logic).
It is not perfect "Tick Data" (like professional Orderflow software), but it is 90% accurate for trend analysis on 1H/4H charts.
Tip: Always use Perpetual Contract charts (e.g., BTCUSDT.P) for Crypto, not Spot charts, to get the correct volume data.
The "Extension" Trap:
Do not Short just because you see a Green Dot. In a strong parabolic bull run, you will see many Green Dots in a row while price keeps flying.
These dots indicate velocity, not necessarily a reversal. Always look for resistance levels or divergence before fading the move.
Settings:
Default Length: 20.
For faster signals: Try 10 or 14.
For smoother trends: Try 50.
5. Pre-Trade Checklist
Before entering a trade, check the Linear CVD:
Color: Is the CVD Line Green or Red? Does it match my trade direction?
Slope: Is the CVD accelerating or flattening out?
Divergence: Did price break a level, but CVD failed to follow? (Fakeout warning).
Extremes: Are there Red/Green dots appearing? If yes, am I chasing a trade too late?
这是一套完整的线性回归 CVD (Linear Regression CVD) 指标的使用说明书和简介。你可以把它保存下来,作为你的交易系统参考文档。
📊 线性回归 CVD (Linear Regression CVD) —— 交易员手册
1. 指标简介 (Introduction)
核心理念:
普通的 CVD(累积成交量差)往往噪音很大,线条锯齿状严重,导致交易者难以看清真正的资金流向趋势。本指标通过线性回归算法 (Linear Regression) 对 CVD 进行平滑处理,并结合标准差通道 (Standard Deviation Channel),试图解决两个核心问题:
资金流向的真实趋势是什么?(排除噪音)
当前的情绪是否过热?(通过通道判定)
适用市场:
加密货币合约 (BTC, ETH 等永续合约) —— 效果最佳
股票、外汇 (需有成交量数据)
适用周期:
日内短线:1分钟、5分钟、15分钟(捕捉快速的资金进出)。
趋势波段:1小时、4小时(判断主力资金的大方向)。
2. 视觉元素说明 (Visual Guide)
当你加载指标后,你会看到以下几个部分:
A. 彩色主线 (The LinReg Line)
形态:一条平滑的粗线。
含义:资金流向的**“平均趋势”**。
颜色:
🟢 绿色:资金流向趋势向上(买盘主导)。
🔴 红色:资金流向趋势向下(卖盘主导)。
B. 灰色背景细线 (Raw CVD)
形态:一条充满锯齿的灰色细线,在主线周围波动。
含义:原始的、实时的累积成交量。它反应了当下的每一根K线的实际买卖差额。
C. 蓝色背景通道 (The Channel)
形态:包裹在主线周围的深蓝色带状区域。
含义:“正常波动范围”。
基于线性回归的 2倍标准差计算。
如果灰色细线在通道内运行,说明市场情绪稳定,多空力量均衡。
D. 信号点 (The Dots)
🟢 绿点 (底部出现):原始 CVD 向上突破了通道上轨。代表极度贪婪 / 抢筹。
🔴 红点 (底部出现):原始 CVD 向下跌破了通道下轨。代表极度恐慌 / 抛售。
3. 实战交易策略 (Trading Strategies)
策略一:趋势确认 (Trend Following)
这是最基础的顺势用法。
做多信号:
价格处于上升趋势(如在均线之上)。
CVD 主线由红变绿,且持续向上倾斜。
操作:这确认了价格的上涨有真金白银的买盘支持,可以持有或加仓。
做空信号:
价格处于下降趋势。
CVD 主线由绿变红,且持续向下倾斜。
操作:确认卖盘主导,价格下跌是健康的。
策略二:背离交易 (Divergence) —— 胜率最高的用法
寻找“主力资金”与“价格”不一致的地方。
顶背离 (看跌):
价格创出了新高 (Higher High)。
CVD 主线却没有创新高,或者形成更低的高点 (Lower High)。
含义:价格在涨,但买入的资金在减少。这通常是主力在通过限价单悄悄出货,或者是买盘枯竭。
操作:准备做空,或多单止盈。
底背离 (看涨):
价格创出了新低 (Lower Low)。
CVD 主线却形成了更高的低点 (Higher Low)。
含义:价格在跌,但卖出的资金在减少,或者有大资金在底部通过挂单吸筹 (Absorption)。
操作:准备做多,或空单止盈。
策略三:极端情绪反转 (Mean Reversion)
利用红绿点判断短期的超买超卖。
做多机会 (反弹):
价格快速下跌,甚至暴跌。
指标底部出现密集的红点 (Downside Extension)。
含义:恐慌盘被杀出来了 (Capitulation),市场短期内无可再卖。
操作:等待K线出现反转形态(如长下影线)后尝试博反弹。
做空机会 (回调):
价格快速拉升(垂直上涨)。
指标底部出现密集的绿点 (Upside Extension)。
含义:大量的散户在追涨 (FOMO),透支了买盘动能。
操作:等待上涨停滞后尝试做空。
4. 关键注意事项 (Limitations)
数据源区别:
TradingView 的普通 Volume 是基于 K 线的近似计算(Close > Open 算买,Close < Open 算卖)。
这与专业的 Orderflow 软件(如 Exocharts)使用的逐笔 Tick 数据有一定误差,但在 1小时/4小时 级别上,趋势方向基本一致。
建议:如果你是做合约,请务必加载 合约图表(如 BTCUSDT.P),不要用现货图表看 CVD。
红绿点的陷阱:
不要一看到绿点就做空! 在超级大单边行情(比如牛市主升浪)中,绿点会连续出现,价格会一直涨。
红绿点必须配合 关键支撑/阻力位 使用。如果在“半空中”出现绿点,往往意味着趋势加速,而不是反转。
参数调整:
默认 LinReg Length = 20。
如果你觉得反应太慢,可以改为 10 或 14。
如果你觉得假信号太多,可以改为 50,但这会牺牲灵敏度。
5. 快速检查清单 (Checklist)
在开单前,看一眼 CVD:
颜色:CVD 是绿的还是红的?和我想做的方向一致吗?
斜率:CVD 是在加速上升/下降,还是开始变平了?
背离:价格破位了,CVD 跟着破位了吗?如果没跟,就是假突破。
极值:有没有出现红点/绿点?如果出现了,是不是应该等回调再进场?
Helix Protocol 7HELIX PROTOCOL 7
Overview
Helix Protocol 7 is an advanced trend-adaptive signal engine that dynamically adjusts its buy/sell thresholds based on real-time market regime detection. Unlike static indicators that use fixed overbought/oversold levels, Helix 7 recognizes that optimal entry and exit points shift dramatically depending on whether the market is trending strongly, ranging, or reversing.
The indicator fuses multiple analytical frameworks—momentum oscillators, trend strength metrics, volatility analysis, volume confirmation, and price structure—into a unified signal system that adapts to changing market conditions in real-time.
Core Philosophy
"Don't fight the trend—adapt to it."
In a strong uptrend, you want to buy dips early (before extreme oversold) and let winners run longer
In a downtrend, you want to sell bounces quickly and only buy true capitulation
In a neutral/ranging market, standard overbought/oversold levels apply
Helix Protocol 7 automatically detects which regime you're in and applies the appropriate thresholds.
Key Features
🔄 Trend-Adaptive Signal Thresholds
The indicator classifies markets into four states and adjusts Fisher Transform and RSI thresholds accordingly:
Trend StateDetection CriteriaBUY TriggersSELL TriggersSTRONG UPTRENDADX rising, ADX > 25, +DI > -DIFisher < 1.0, RSI < 50Fisher > 2.5, RSI > 70STRONG DOWNTRENDADX rising, ADX > 25, -DI > +DIFisher < -2.5, RSI < 25Fisher > 1.5, RSI > 60WEAK DOWNTRENDADX falling, -DI > +DIFisher < -2.5, RSI < 25Fisher > 1.5, RSI > 60NEUTRALDefault fallbackFisher < -2.0, RSI < 30Fisher > 2.0, RSI > 65
📊 Dynamic Envelope Bands
Adaptive bands that expand and contract based on:
ATR (Average True Range) - Base volatility measure
ADX (Trend Strength) - Bands widen in strong trends
Chaikin Oscillator - Volume-weighted band adjustment
🎯 Multi-Trigger Signal System
Signals can fire from multiple sources:
Trend-Based Signals - Fisher + RSI thresholds met for current regime
Band Touch Signals - Price touches upper/lower band (support/resistance)
EXTREME Signals - Price penetrates band by significant amount (bypasses cooldown)
⚡ Extreme Move Detection
When price makes an explosive move that penetrates the band by more than 30% of ATR (configurable), the signal fires with EXTREME priority and bypasses the normal cooldown period. This ensures you never miss major reversal opportunities.
📈 GXS Scoring System
A proprietary multi-factor scoring system (-1.0 to +1.0) that weighs:
Trend Strength (30%) - ADX direction and magnitude
Momentum (25%) - RSI, MACD, Stochastic, CCI, ROC consensus
Volume (20%) - OBV trend and volume surge detection
Price Structure (15%) - Band position and volatility percentile
Price Action (10%) - Bullish/bearish candle ratio
🔀 RSI Divergence Detection
Automatically detects and displays:
Regular Bullish Divergence - Price lower low + RSI higher low (reversal up)
Regular Bearish Divergence - Price higher high + RSI lower high (reversal down)
Hidden Bullish Divergence - Trend continuation signal (uptrend)
Hidden Bearish Divergence - Trend continuation signal (downtrend)
📉 BBWP Volatility Meter
Bollinger Band Width Percentile measures current volatility relative to historical norms:
LOW (< 30%) - Volatility compression, breakout imminent
MEDIUM (30-70%) - Normal market conditions
HIGH (> 70%) - Extended volatility, potential exhaustion
Visual Components
Money Line
A dynamic centerline (Linear Regression or Weighted EMA) colored by slope:
🟢 Green - Rising (bullish momentum)
🔴 Red - Falling (bearish momentum)
🟡 Yellow - Flat (consolidation)
Envelope Cloud
Shaded region between upper and lower bands, colored by Money Line slope direction for instant trend visualization.
Signal Labels
Clear entry/exit labels showing:
Price level
Trigger type (UPTREND DIP, CAPITULATION, BAND TOUCH, EXTREME, etc.)
Color coding (Green=Buy, Red=Sell, Lime=Extreme Buy, Fuchsia=Extreme Sell)
ADX Trend Bar
Bottom indicator showing trend state:
🟢 Lime - Strong Uptrend
🔴 Red - Downtrend
🟠 Orange - Weak/Transitional (ADX 15-24)
⚪ White - Ranging (ADX < 15)
🔵 Blue - Strong trend, neutral direction
Info Panel
Real-time dashboard displaying:
Current trend state
GXS Score
Active divergences
Volatility level (BBWP)
ADX value and direction
DI Spread
Fisher Transform value
RSI value
Context-sensitive BUY/SELL thresholds for current regime
Alert System
JSON Webhook Alerts (Bot-Ready)
json{
"action": "BUY",
"symbol": "BTC/USDT",
"price": "93500.00",
"trigger": "EXTREME",
"rsi": "28.5",
"fisher": "-2.31",
"adx": "32.4",
"trend_state": "STRONG DOWN"
}
Available Alert Conditions
Buy Signal / Sell Signal
Lower Band Touch / Upper Band Touch
EXTREME Lower Band / EXTREME Upper Band
Strong Uptrend Started
Downtrend Started
Neutral Trend Started
Trend State Change
Recommended Settings
Scalping (1m-5m)
Signal Cooldown: 3-5 bars
Extreme Penetration: 0.2 (more sensitive)
ADX Length: 10-12
Swing Trading (15m-4H)
Signal Cooldown: 5-8 bars
Extreme Penetration: 0.3 (default)
ADX Length: 14 (default)
Position Trading (Daily+)
Signal Cooldown: 8-12 bars
Extreme Penetration: 0.4-0.5 (less sensitive)
ADX Length: 14-20
Input Parameters
Core Settings
Money Line Type (Linear Regression / Weighted EMA)
Money Line Length
RSI Period
Fisher Period
Dynamic Bands
ATR Period & Multiplier
Adaptive Bands toggle
Chaikin Weight
Extreme Band Penetration threshold
Trend Detection
ADX Length & Slope Lookback
Strong Trend ADX Threshold
DI Spread for Neutral detection
Signal Thresholds (by Trend State)
Fully customizable Fisher/RSI/ADX levels for each regime
Separate BUY and SELL parameters
Display Options
Toggle bands, cloud, labels, panels
Cooldown period
Debug panel for troubleshooting
Best Practices
Confirm with price action - Signals are high-probability setups, not guarantees
Respect the trend state - The panel shows current thresholds for a reason
Watch for EXTREME signals - These indicate significant reversals
Use divergences as confluence - Especially powerful at band touches
Monitor volatility - Low BBWP often precedes big moves
Version: 7.0
Author: ralis24

Real Relative Strength Indicator### What is RRS (Real Relative Strength)?
RRS is a volatility-normalized relative strength indicator that shows you – in real time – whether your stock, crypto, or any asset is genuinely beating or lagging the broader market after adjusting for risk and volatility. Unlike the classic “price ÷ SPY” line that gets completely fooled by volatility regimes, RRS answers the only question that actually matters to professional traders:
“Is this ticker moving better (or worse) than the market on a risk-adjusted basis right now?”
It does this by measuring the excess momentum of your ticker versus a benchmark (SPY, QQQ, BTC, etc.) and then dividing that excess by the average volatility (ATR) of both instruments. The result is a clean, centered-around-zero oscillator that works the same way in calm markets, crash markets, or parabolic bull runs.
### How to Use the RRS Indicator (Aqua/Purple Area Version) in Practice
The indicator is deliberately simple to read once you know the rules:
Positive area (aqua) means genuine outperformance.
Negative area (purple) means genuine underperformance.
The farther from zero, the stronger the leadership or weakness.
#### Core Signals and How to Trade Them
- RRS crossing above zero → one of the highest-probability long signals in existence. The asset has just started outperforming the market on a risk-adjusted basis. Enter or add aggressively if price structure agrees.
- RRS crossing below zero → leadership is ending. Tighten stops, take partial or full profits, or flip short if you trade both sides.
- RRS above +2 (bright aqua area) → clear leadership. This is where the real money is made in bull markets. Trail stops, add on pullbacks, let winners run.
- RRS below –2 (bright purple area) → clear distribution or capitulation. Avoid new longs, consider short entries or protective puts.
- Extreme readings above +4 or below –4 (background tint appears) → rare, very high-conviction moves. Treat these like once-a-month opportunities.
- Divergence (not plotted here, but easy to spot visually): price making new highs while the aqua area is shrinking → distribution. Price making new lows while the purple area is shrinking → hidden buying and coming reversal.
#### Best Settings by Style and Asset Class
For stocks and ETFs: keep benchmark as SPY (or QQQ for tech-heavy names) and length 14–20 on daily/4H charts.
For crypto: change the benchmark to BTCUSD (or ETHUSD) immediately — otherwise the reading is meaningless. Length 10–14 works best on 1H–4H crypto charts because volatility is higher.
For day trading: drop length to 10–12 and use 15-minute or 5-minute charts. Signals are faster and still extremely clean.
#### Highest-Edge Setups (What Actually Prints Money)
- RRS crosses above zero while price is still below a major moving average (50 EMA, 200 SMA, etc.) → early leadership, often catches the exact bottom of a new leg up.
- RRS already deep aqua (+3 or higher) and price pulls back to support without RRS dropping below +1 → textbook add-on or re-entry zone.
- RRS deep purple and suddenly turns flat or starts curling up while price is still falling → hidden accumulation, usually the exact low tick.
That’s it. Master these few rules and the RRS becomes one of the most powerful edge tools you will ever use for rotation trading...

Titan AI: EWO Pro + Divergencias de VolumenBINANCE:BTCUSDT.P The indicator is only in Spanish.
Titan AI: EWO Pro is not your standard Elliott Wave Oscillator. It is a next-generation Order Flow & Volume engine designed to detect the true intent of the market. Unlike traditional oscillators that rely solely on price action, Titan EWO Pro incorporates a "Volume Efficiency" algorithm normalized via Z-Score (Standard Deviation).
This indicator is built for traders who need to see what is happening inside the candles. It answers the critical question: "Is the price moving with real institutional backing, or is it a fake-out with no volume?"
With the integrated "GOD MODE" Dashboard, you get a tactical Heads-Up Display (HUD) that translates complex mathematical data into clear, actionable signals in real-time.
💎 Key Features
Z-Score Normalized EWO:
Standard EWO indicators can vary wildly depending on the asset price (BTC vs. Forex).
Titan EWO Pro normalizes the data using Standard Deviations (Z-Score). This means a value of +2.0 represents a statistically significant extreme move, regardless of the timeframe or asset.
Volume Efficiency Algorithm:
The core calculation measures (Close - Open) / Volume. This determines how much volume was required to move the price.
High efficiency means price is moving easily (strong trend). Low efficiency means high volume but little movement (absorption/reversal).
Volume Divergences:
Automatically detects discrepancies between Price Action and Order Flow.
Bullish Divergence: Price makes a Lower Low, but Titan EWO makes a Higher Low (Accumulation).
Bearish Divergence: Price makes a Higher High, but Titan EWO makes a Lower High (Distribution).
Institutional Extremes (Reversals):
The indicator marks the +2.0 and -2.0 Standard Deviation levels.
When the histogram crosses these levels, the market is statistically overextended. Watch for Triangle Signals indicating a potential "V" reversal or exhaustion.
GOD MODE Dashboard (HUD):
A professional panel fixed to your screen (customizable position).
Trend: Displays strict Bullish (Green) or Bearish (Red) status.
Strength (Z): The exact Z-Score value.
Momentum: Tells you if the move is "Accelerating" or "Braking" (Decelerating).
Divergence: Real-time alert status.
🚀 How to Use
1. Trend Following (The Wave)
Green Bars: Look for Longs. Momentum is bullish and Order Flow supports the move.
Red Bars: Look for Shorts. Momentum is bearish.
Darker Colors: If the bars turn dark green or dark red, momentum is slowing down (Deceleration). This is a warning to tighten Stop Losses or wait for a new impulse.
2. Trading Reversals (The Extremes)
Statistical Extremes: If the histogram punches through the +2.0 or -2.0 dotted lines, the move is overextended (climax).
Triangles: Small triangles appear at the top/bottom of the chart when these extremes are hit. This is often a "Take Profit" signal or a contrarian entry point if confirmed by price action.
3. Divergences (The Smart Entry)
Look for the "Vol" circles.
A Green Circle at the bottom indicates that sellers are exhausted, but volume flow is shifting bullish.
A Red Circle at the top indicates that buyers are exhausted (price up, but volume flow down).
4. The Dashboard
Use the dashboard for confirmation.
Ideally: You want "ALCISTA" (Bullish), "ACELERANDO" (Accelerating), and a high Z-Score (> 0.5) for a strong Long trade.
⚙️ Settings
EWO Length: The lookback period for the oscillator (Default: 12).
Smoothing: Helps reduce noise in the histogram (Default: 10).
Pivot Lookback: Sensitivity for divergence detection (Default: 5).
Dashboard: You can toggle the panel ON/OFF, change its size (Tiny/Small/Normal), and move it to any corner of the chart.
Disclaimer
This tool is for educational and analytical purposes only. Trading involves risk. Always use proper risk management. Past performance does not guarantee future results.

Daily Anchored VWAPAnchors VWAP to whatever time you want instead of the usual start of session. I use it for BTC so that I can anchor around NY open instead of the night before.

AssetCorrelationLibraryLibrary "AssetCorrelationLibrary™"
detectIndicesFutures(ticker)
Detects Index Futures (NQ/ES/YM/RTY + micro variants)
Parameters:
ticker (string) : The ticker string to check (typically syminfo.ticker)
Returns: AssetPairing with secondary and tertiary assets configured
detectMetalsFutures(ticker)
Detects Metal Futures (GC/SI/HG + micro variants)
Parameters:
ticker (string) : The ticker string to check
Returns: AssetPairing with secondary and tertiary assets configured
detectForexFutures(ticker)
Detects Forex Futures (6E/6B + micro variants)
Parameters:
ticker (string) : The ticker string to check
Returns: AssetPairing with secondary and tertiary assets configured
detectEnergyFutures(ticker)
Detects Energy Futures (CL/RB/HO + micro variants)
Parameters:
ticker (string) : The ticker string to check
Returns: AssetPairing with secondary and tertiary assets configured
detectTreasuryFutures(ticker)
Detects Treasury Futures (ZB/ZF/ZN)
Parameters:
ticker (string) : The ticker string to check
Returns: AssetPairing with secondary and tertiary assets configured
detectForexCFD(ticker, tickerId)
Detects Forex CFD pairs (EUR/GBP/DXY, USD/JPY/CHF triads)
Parameters:
ticker (string) : The ticker string to check
tickerId (string) : The full ticker ID (syminfo.tickerid) for primary asset
Returns: AssetPairing with secondary and tertiary assets configured
detectCrypto(ticker, tickerId)
Detects major Crypto assets (BTC, ETH, SOL, XRP, alts)
Parameters:
ticker (string) : The ticker string to check
tickerId (string) : The full ticker ID for primary asset
Returns: AssetPairing with secondary and tertiary assets configured
detectMetalsCFD(ticker, tickerId)
Detects Metals CFD (XAU/XAG/Copper)
Parameters:
ticker (string) : The ticker string to check
tickerId (string) : The full ticker ID for primary asset
Returns: AssetPairing with secondary and tertiary assets configured
detectIndicesCFD(ticker, tickerId)
Detects Indices CFD (NAS100/SP500/DJ30)
Parameters:
ticker (string) : The ticker string to check
tickerId (string) : The full ticker ID for primary asset
Returns: AssetPairing with secondary and tertiary assets configured
detectEUStocks(ticker, tickerId)
Detects EU Stock Indices (GER40/EU50) - Dyad only
Parameters:
ticker (string) : The ticker string to check
tickerId (string) : The full ticker ID for primary asset
Returns: AssetPairing with secondary asset configured (tertiary empty for dyad)
getDefaultFallback(tickerId)
Returns default fallback assets (chart ticker only, no correlation)
Parameters:
tickerId (string) : The full ticker ID for primary asset
Returns: AssetPairing with chart ticker as primary, empty secondary/tertiary (no correlation)
applySessionModifierWithBackadjust(tickerStr, sessionType)
Applies futures session modifier to ticker WITH back adjustment
Parameters:
tickerStr (string) : The ticker to modify
sessionType (string) : The session type (syminfo.session)
Returns: Modified ticker string with session and backadjustment.on applied
applySessionModifierNoBackadjust(tickerStr, sessionType)
Applies futures session modifier to ticker WITHOUT back adjustment
Parameters:
tickerStr (string) : The ticker to modify
sessionType (string) : The session type (syminfo.session)
Returns: Modified ticker string with session and backadjustment.off applied
isTriadMode(pairing)
Checks if a pairing represents a valid triad (3 assets)
Parameters:
pairing (AssetPairing) : The AssetPairing to check
Returns: True if tertiary is non-empty (triad mode), false for dyad
getAssetTicker(tickerId)
Extracts clean ticker string from full ticker ID
Parameters:
tickerId (string) : The full ticker ID (e.g., "BITGET:BTCUSDT.P")
Returns: Clean ticker string (e.g., "BTCUSDT.P")
resolveTriad(chartTickerId, pairing)
Resolves triad asset assignments with proper inversion flags
Parameters:
chartTickerId (string) : The current chart's ticker ID (syminfo.tickerid)
pairing (AssetPairing) : The detected AssetPairing
Returns: Tuple
resolveDyad(chartTickerId, pairing)
Resolves dyad asset assignment with proper inversion flag
Parameters:
chartTickerId (string) : The current chart's ticker ID
pairing (AssetPairing) : The detected AssetPairing (dyad: tertiary is empty)
Returns: Tuple
resolveAssets(ticker, tickerId, assetType, sessionType, useBackadjust)
Main auto-detection entry point. Detects asset category and returns fully resolved config.
Parameters:
ticker (string) : The ticker string to check (typically syminfo.ticker)
tickerId (string) : The full ticker ID (typically syminfo.tickerid)
assetType (string) : The asset type (typically syminfo.type)
sessionType (string) : The session type for futures (typically syminfo.session)
useBackadjust (bool) : Whether to apply back adjustment for futures session alignment
Returns: AssetConfig with fully resolved assets, inversion flags, and detection status
resolveCurrentChart()
Simplified auto-detection using current chart's syminfo values
Returns: AssetConfig with fully resolved assets, inversion flags, and detection status
AssetPairing
Core asset pairing structure for triad/dyad configurations
Fields:
primary (series string) : The primary (chart) asset ticker ID
secondary (series string) : The secondary correlated asset ticker ID
tertiary (series string) : The tertiary correlated asset ticker ID (empty for dyad)
invertSecondary (series bool) : Whether secondary asset should be inverted for divergence calc
invertTertiary (series bool) : Whether tertiary asset should be inverted for divergence calc
AssetConfig
Full asset resolution result with mode detection and computed values
Fields:
detected (series bool) : Whether auto-detection succeeded
isTriadMode (series bool) : True if triad (3 assets), false if dyad (2 assets)
primary (series string) : The resolved primary asset ticker ID
secondary (series string) : The resolved secondary asset ticker ID
tertiary (series string) : The resolved tertiary asset ticker ID (empty for dyad)
invertSecondary (series bool) : Computed inversion flag for secondary asset
invertTertiary (series bool) : Computed inversion flag for tertiary asset
assetCategory (series string) : String describing the detected asset category
Note to potential users.
I did not really intend to make this public but i have to in order to avoid any potential compliance issues with the TradingView Moderation Team and the House Rules.
However if you are to use this library, you cannot make your code closed source / invite only as it is intellectual property. The only exception to this is if I am credited in the header of your code and i explicitly give permission to do so.
As per the TradingView house rules, you are completely FREE to do with this as you like, provided the script stays private.
Use the @fstarcapital tag to give credits
❤️ from cephxs

Trendline Breaks + Supertrend [Delta BTC-P]Trendline Breaks + Supertrend in same direct Best on 5 min

Easy Crypto Signal FREE🆓 FREE Bitcoin & Crypto Trading Indicator
Easy Crypto Signal FREE helps you make better trading decisions with real-time BUY/SELL signals based on multiple technical indicators.
✅ What you get in FREE version:
• Real-time BUY/SELL signals (green/red arrows)
• Trading SCORE (0-100%) - market strength indicator
• Works on BTC, ETH, and all major altcoins
• Optimized for 4h timeframe (works on all timeframes)
• Simple visual interface
• Basic alert system
📊 How it works:
The indicator combines RSI, MACD, EMA trends, and volume analysis to generate a composite SCORE (0-100%).
• SCORE > 65% = BUY signal 🟢
• SCORE < 35% = SELL signal 🔴
• SCORE 35-65% = WAIT (neutral zone) 🟡
⚠️ FREE Version Limitations:
• No detailed RSI values
• No MACD trend details
• No trend strength indicators
• Fixed sensitivity (65%)
• Limited customization
💎 Want the FULL PRO version?
🚀 PRO includes:
• Full RSI + MACD + Trend analysis displayed
• Customizable sensitivity (40-80%)
• Advanced alert customization
• Professional clean interface
• Volume strength indicator
• NO watermarks
• Premium support
📊 Proven Backtest Results:
• 57.1% Win Rate
• 3.36 Profit Factor (Excellent)
• +9.55% return in 3 months
• Only -2.69% Max Drawdown (Low Risk)
🔗 Get PRO version:
📈 Best practices:
1. Use on 4h timeframe for best results
2. Combine with your own analysis
3. Always set Stop Loss (5-10%)
4. Test on demo account first
5. Don't trade based on signals alone
⚠️ Risk Disclaimer:
Cryptocurrency trading involves substantial risk. This indicator is for educational purposes only and does not guarantee profits. Past performance does not indicate future results. Always do your own research and never invest more than you can afford to lose.
📧 Questions or Feedback?
Comment below or message me directly!
🌟 If you find this helpful, please give it a like and share!
v1.0 - Initial FREE release
• Basic BUY/SELL signal system
• Score indicator 0-100%
• Optimized for 4h timeframe
• Works on all crypto pairs

The Oracle: Dip & Top Adaptive Sniper [Hakan Yorganci]█ OVERVIEW
The Oracle: Dip & Top Adaptive Sniper is a precision-focused trend trading strategy designed to solve the biggest problem in swing trading: Timing.
Most trend-following strategies chase price ("FOMO"), buying when the asset is already overextended. The Oracle takes a different approach. It adopts a "Sniper" mentality: it identifies a strong macro trend but patiently waits for a Mean Reversion (pullback) to execute an entry at a discounted price.
By combining the structural strength of Moving Averages (SMA 50/200) with the momentum precision of RSI and the volatility filtering of ADX, this script filters out noise and targets high-probability setups.
█ HOW IT WORKS
This strategy operates on a strictly algorithmic protocol known as "The Yorganci Protocol," which involves three distinct phases: Filter, Target, and Execute.
1. The Macro Filter (Trend Identification)
* SMA 200 Rule: By default, the strategy only scans for buy signals when the price is trading above the 200-period Simple Moving Average. This ensures we are always trading in the direction of the long-term bull market.
* Adaptive Switch: A new feature allows users to toggle the Only Buy Above SMA 200? filter OFF. This enables the strategy to hunt for oversold bounces (dead cat bounces) even during bearish or neutral market structures.
2. The Volatility Filter (ADX Integration)
* Sideways Protection: One of the main weaknesses of moving average strategies is "whipsaw" losses during choppy, ranging markets.
* Solution: The Oracle utilizes the ADX (Average Directional Index). It will BLOCK any trade entry if the ADX is below the threshold (Default: 20). This ensures capital is only deployed when a genuine trend is present.
3. The Sniper Entry (Buying the Dip)
* Instead of buying on breakout strength (e.g., RSI > 60), The Oracle waits for the RSI Moving Average to dip into the "Value Zone" (Default: 45) and cross back up. This technique allows for tighter stops and higher Risk/Reward ratios compared to traditional breakout systems.
█ EXIT STRATEGY
The Oracle employs a dynamic dual-exit mechanism to maximize gains and protect capital:
* Take Profit (The Peak): The strategy monitors RSI heat. When the RSI Moving Average breaches the Overbought Threshold (Default: 75), it signals a "Take Profit", securing gains near the local top before a potential reversal.
* Stop Loss (Trend Invalidated): If the market structure fails and the price closes below the 50-period SMA, the position is immediately closed to prevent deep drawdowns.
█ SETTINGS & CONFIGURATION
* Moving Averages: Fully customizable lengths for Support (SMA 50) and Trend (SMA 200).
* Trend Filter: Checkbox to enable/disable the "Bull Market Only" rule.
* RSI Thresholds:
* Sniper Buy Level: Adjustable (Default: 45). Lower values = Deeper dips, fewer trades.
* Peak Sell Level: Adjustable (Default: 75). Higher values = Longer holds, potentially higher profit.
* ADX Filter: Checkbox to enable/disable volatility filtering.
█ BEST PRACTICES
* Timeframe: Designed primarily for 4H (4-Hour) charts for swing trading. It can also be used on 1H for more frequent signals.
* Assets: Highly effective on trending assets such as Bitcoin (BTC), Ethereum (ETH), and high-volume Altcoins.
* Risk Warning: This strategy is designed for "Long Only" spot or leverage trading. Always use proper risk management.
█ CREDITS
* Original Concept: Inspired by the foundational work of Murat Besiroglu (@muratkbesiroglu).
* Algorithm Development & Enhancements: Developed by Hakan Yorganci (@hknyrgnc).
* Modifications include: Integration of ADX filters, Mean Reversion entry logic (RSI Dip), and Dynamic Peak Profit taking.

Wyckoff + VSA Ultimate - Complete Market Analysis
**Wyckoff + VSA Ultimate** combines three proven methodologies into one powerful indicator:
🔷 **Wyckoff Method** - Identifies market accumulation and distribution phases
🔷 **Volume Spread Analysis** - Confirms moves with volume and price spread
🔷 **Random Walk Index** - Validates trend strength and direction
**MAIN SIGNALS:**
📊 **Wyckoff Signals** (Green = Bullish, Red = Bearish)
• SC (Selling Climax) - Major buying opportunity
• BC (Buying Climax) - Major selling opportunity
• AR (Automatic Rally) - Confirms accumulation
• DAR (Automatic Reaction) - Confirms distribution
• ST (Secondary Test) - Final test before move
📊 **VSA Patterns**
• Upthrust bars (weakness after rally)
• Reverse upthrust (strength after decline)
• No demand/supply bars
• Stopping volume
• Effort failures
**KEY FEATURES:**
✅ Multiple signal confirmation reduces false signals
✅ Real-time info table shows phase, volume, trends
✅ Dynamic stop loss levels calculated automatically
✅ Accumulation/Distribution boxes on chart
✅ Customizable filters for your trading style
✅ 12 alert conditions for all major signals
**HOW TO USE:**
For Swing Trading (4H/Daily):
1. Enable "Require VSA Confirmation"
2. Wait for SC or BC signals
3. Use displayed stop levels
4. Target next opposite phase
For Day Trading (15m/1H):
1. Enable "Require Trend Confirmation"
2. Trade only trend-aligned signals
3. Increase volume threshold to 1.5
4. Use tighter risk management
**BEST FOR:**
✅ Stocks (high volume)
✅ Forex majors
✅ Crypto (BTC, ETH)
✅ Index futures
**SETTINGS:**
Customize everything:
• RSI & Pivot parameters
• Volume & Spread analysis
• Trend periods (RWI)
• Signal filters
• Visual display options
**ALERTS:**
Pre-configured alerts for:
• All Wyckoff signals
• VSA reversals
• Strong buy/sell combinations
**Credits:** Integrates Wyckoff (faytterro) and VSA (theehoganator) methods.
**Disclaimer:** Educational purposes only. Use proper risk management. Past performance doesn't guarantee future results.
---
Pine Script™ v6
---

Viprasol Elite Flow Pro - Premium Order Flow & Trend System═══════════════════════════════════════════════════════════════
🔥 VIPRASOL ELITE FLOW PRO
Professional Order Flow & Trend Detection System
═══════════════════════════════════════════════════════════════
📊 WHAT IS THIS INDICATOR?
Viprasol Elite Flow Pro is a comprehensive trading system that combines institutional order flow analysis with adaptive trend detection. Unlike basic indicators, this tool identifies high-probability setups by analyzing where smart money is likely positioning, while filtering signals through multiple confirmation layers.
This indicator is designed for traders who want to:
✓ Identify premium (supply) and discount (demand) zones automatically
✓ Detect trend direction with adaptive cloud technology
✓ Spot high-volume rejection points before major moves
✓ Filter low-quality signals with intelligent confirmation logic
✓ Track market strength in real-time via elite dashboard
═══════════════════════════════════════════════════════════════
🎯 CORE FEATURES
═══════════════════════════════════════════════════════════════
1️⃣ ELITE TREND ENGINE
• Adaptive Moving Average system (Fast/Adaptive/Smooth modes)
• Dynamic trend cloud that expands/contracts with volatility
• Real-time trend state tracking (Bullish/Bearish/Ranging)
• Trend strength meter (0-10 scale)
• ATR-based volatility adjustments
2️⃣ ORDER FLOW DETECTION
• Automatic Premium Zone (Supply) identification
• Automatic Discount Zone (Demand) identification
• Smart zone extension - zones remain valid until broken
• Zone rejection detection with price action confirmation
• Customizable zone strength (5-30 bars lookback)
3️⃣ VOLUME INTELLIGENCE
• Volume spike detection (configurable threshold)
• Climax bar identification (exhaustion signals)
• Volume filter for signal validation
• Institutional activity detection
4️⃣ SMART SIGNAL SYSTEM
• 3 Signal Modes: Aggressive, Balanced, Conservative
• Multi-layer confirmation logic
• Automatic profit targets (2:1 risk-reward)
• Stop loss suggestions based on ATR
• Prevents overtrading with bars-since-signal filter
5️⃣ ELITE DASHBOARD (HUD)
• Real-time trend direction and strength
• Volume status monitoring
• Active zones counter
• Market volatility gauge
• Current signal status
• 4 positioning options, compact mode available
6️⃣ PREMIUM STYLING
• 4 Professional color themes (Cyber/Gold/Ocean/Fire)
• Adjustable transparency and label sizes
• Clean, institutional-grade visuals
• Optimized for all chart types
═══════════════════════════════════════════════════════════════
📖 HOW TO USE THIS INDICATOR
═══════════════════════════════════════════════════════════════
STEP 1: TREND IDENTIFICATION
→ Green Cloud = Bullish trend - look for LONG opportunities
→ Red Cloud = Bearish trend - look for SHORT opportunities
→ Purple Cloud = Ranging - wait for breakout or fade extremes
STEP 2: ZONE ANALYSIS
→ PREMIUM (Red) zones = Potential resistance/supply areas
→ DISCOUNT (Green) zones = Potential support/demand areas
→ Price rejecting from zones = high-probability setups
STEP 3: SIGNAL CONFIRMATION
→ Wait for "LONG" or "SHORT" labels to appear
→ Check dashboard for trend strength (Moderate/Strong preferred)
→ Confirm volume status is "HIGH" or "CLIMAX"
→ Entry: Enter when label appears
→ Stop Loss: Use dotted line (1 ATR away)
→ Take Profit: Use dashed line (2 ATR away)
STEP 4: RISK MANAGEMENT
→ Never risk more than 1-2% per trade
→ Use the provided stop loss levels
→ Trail stops as price moves in your favor
→ Avoid trading during low volatility periods
═══════════════════════════════════════════════════════════════
⚙️ RECOMMENDED SETTINGS
═══════════════════════════════════════════════════════════════
FOR SCALPING (1M - 5M):
- Trend Type: Fast
- Sensitivity: 15
- Signal Mode: Aggressive
- Zone Strength: 8
FOR DAY TRADING (15M - 1H):
- Trend Type: Adaptive
- Sensitivity: 21 (default)
- Signal Mode: Balanced
- Zone Strength: 12 (default)
FOR SWING TRADING (4H - Daily):
- Trend Type: Smooth
- Sensitivity: 34
- Signal Mode: Conservative
- Zone Strength: 20
BEST MARKETS:
✓ Crypto (BTC, ETH, major altcoins)
✓ Forex (Major pairs: EUR/USD, GBP/USD)
✓ Indices (S&P 500, NASDAQ, DAX)
✓ High-liquidity stocks
═══════════════════════════════════════════════════════════════
🎓 UNDERSTANDING THE METHODOLOGY
═══════════════════════════════════════════════════════════════
This indicator is built on three core concepts:
1. ORDER FLOW THEORY
Markets move between premium (expensive) and discount (cheap) zones. Smart money accumulates in discount zones and distributes in premium zones. This indicator identifies these zones automatically.
2. ADAPTIVE TREND FOLLOWING
Unlike fixed-period moving averages, the Elite Trend Engine adjusts to current market volatility, providing more accurate trend signals in both trending and ranging conditions.
3. CONFLUENCE-BASED ENTRIES
Signals only trigger when multiple conditions align:
- Price in correct zone (premium for shorts, discount for longs)
- Trend confirmation (cloud color matches direction)
- Volume validation (spike or climax present)
- Price action strength (strong rejection candles)
This multi-layer approach dramatically reduces false signals.
═══════════════════════════════════════════════════════════════
🔔 ALERT SETUP
═══════════════════════════════════════════════════════════════
This indicator includes 5 alert types:
1. Long Signal → Triggers when buy conditions met
2. Short Signal → Triggers when sell conditions met
3. Volume Climax → Warns of pot
