Game Theory Trading StrategyGame Theory Trading Strategy: Explanation and Working Logic
This Pine Script (version 5) code implements a trading strategy named "Game Theory Trading Strategy" in TradingView. Unlike the previous indicator, this is a full-fledged strategy with automated entry/exit rules, risk management, and backtesting capabilities. It uses Game Theory principles to analyze market behavior, focusing on herd behavior, institutional flows, liquidity traps, and Nash equilibrium to generate buy (long) and sell (short) signals. Below, I'll explain the strategy's purpose, working logic, key components, and usage tips in detail.
1. General Description
Purpose: The strategy identifies high-probability trading opportunities by combining Game Theory concepts (herd behavior, contrarian signals, Nash equilibrium) with technical analysis (RSI, volume, momentum). It aims to exploit market inefficiencies caused by retail herd behavior, institutional flows, and liquidity traps. The strategy is designed for automated trading with defined risk management (stop-loss/take-profit) and position sizing based on market conditions.
Key Features:
Herd Behavior Detection: Identifies retail panic buying/selling using RSI and volume spikes.
Liquidity Traps: Detects stop-loss hunting zones where price breaks recent highs/lows but reverses.
Institutional Flow Analysis: Tracks high-volume institutional activity via Accumulation/Distribution and volume spikes.
Nash Equilibrium: Uses statistical price bands to assess whether the market is in equilibrium or deviated (overbought/oversold).
Risk Management: Configurable stop-loss (SL) and take-profit (TP) percentages, dynamic position sizing based on Game Theory (minimax principle).
Visualization: Displays Nash bands, signals, background colors, and two tables (Game Theory status and backtest results).
Backtesting: Tracks performance metrics like win rate, profit factor, max drawdown, and Sharpe ratio.
Strategy Settings:
Initial capital: $10,000.
Pyramiding: Up to 3 positions.
Position size: 10% of equity (default_qty_value=10).
Configurable inputs for RSI, volume, liquidity, institutional flow, Nash equilibrium, and risk management.
Warning: This is a strategy, not just an indicator. It executes trades automatically in TradingView's Strategy Tester. Always backtest thoroughly and use proper risk management before live trading.
2. Working Logic (Step by Step)
The strategy processes each bar (candle) to generate signals, manage positions, and update performance metrics. Here's how it works:
a. Input Parameters
The inputs are grouped for clarity:
Herd Behavior (🐑):
RSI Period (14): For overbought/oversold detection.
Volume MA Period (20): To calculate average volume for spike detection.
Herd Threshold (2.0): Volume multiplier for detecting herd activity.
Liquidity Analysis (💧):
Liquidity Lookback (50): Bars to check for recent highs/lows.
Liquidity Sensitivity (1.5): Volume multiplier for trap detection.
Institutional Flow (🏦):
Institutional Volume Multiplier (2.5): For detecting large volume spikes.
Institutional MA Period (21): For Accumulation/Distribution smoothing.
Nash Equilibrium (⚖️):
Nash Period (100): For calculating price mean and standard deviation.
Nash Deviation (0.02): Multiplier for equilibrium bands.
Risk Management (🛡️):
Use Stop-Loss (true): Enables SL at 2% below/above entry price.
Use Take-Profit (true): Enables TP at 5% above/below entry price.
b. Herd Behavior Detection
RSI (14): Checks for extreme conditions:
Overbought: RSI > 70 (potential herd buying).
Oversold: RSI < 30 (potential herd selling).
Volume Spike: Volume > SMA(20) x 2.0 (herd_threshold).
Momentum: Price change over 10 bars (close - close ) compared to its SMA(20).
Herd Signals:
Herd Buying: RSI > 70 + volume spike + positive momentum = Retail buying frenzy (red background).
Herd Selling: RSI < 30 + volume spike + negative momentum = Retail selling panic (green background).
c. Liquidity Trap Detection
Recent Highs/Lows: Calculated over 50 bars (liquidity_lookback).
Psychological Levels: Nearest round numbers (e.g., $100, $110) as potential stop-loss zones.
Trap Conditions:
Up Trap: Price breaks recent high, closes below it, with a volume spike (volume > SMA x 1.5).
Down Trap: Price breaks recent low, closes above it, with a volume spike.
Visualization: Traps are marked with small red/green crosses above/below bars.
d. Institutional Flow Analysis
Volume Check: Volume > SMA(20) x 2.5 (inst_volume_mult) = Institutional activity.
Accumulation/Distribution (AD):
Formula: ((close - low) - (high - close)) / (high - low) * volume, cumulated over time.
Smoothed with SMA(21) (inst_ma_length).
Accumulation: AD > MA + high volume = Institutions buying.
Distribution: AD < MA + high volume = Institutions selling.
Smart Money Index: (close - open) / (high - low) * volume, smoothed with SMA(20). Positive = Smart money buying.
e. Nash Equilibrium
Calculation:
Price mean: SMA(100) (nash_period).
Standard deviation: stdev(100).
Upper Nash: Mean + StdDev x 0.02 (nash_deviation).
Lower Nash: Mean - StdDev x 0.02.
Conditions:
Near Equilibrium: Price between upper and lower Nash bands (stable market).
Above Nash: Price > upper band (overbought, sell potential).
Below Nash: Price < lower band (oversold, buy potential).
Visualization: Orange line (mean), red/green lines (upper/lower bands).
f. Game Theory Signals
The strategy generates three types of signals, combined into long/short triggers:
Contrarian Signals:
Buy: Herd selling + (accumulation or down trap) = Go against retail panic.
Sell: Herd buying + (distribution or up trap).
Momentum Signals:
Buy: Below Nash + positive smart money + no herd buying.
Sell: Above Nash + negative smart money + no herd selling.
Nash Reversion Signals:
Buy: Below Nash + rising close (close > close ) + volume > MA.
Sell: Above Nash + falling close + volume > MA.
Final Signals:
Long Signal: Contrarian buy OR momentum buy OR Nash reversion buy.
Short Signal: Contrarian sell OR momentum sell OR Nash reversion sell.
g. Position Management
Position Sizing (Minimax Principle):
Default: 1.0 (10% of equity).
In Nash equilibrium: Reduced to 0.5 (conservative).
During institutional volume: Increased to 1.5 (aggressive).
Entries:
Long: If long_signal is true and no existing long position (strategy.position_size <= 0).
Short: If short_signal is true and no existing short position (strategy.position_size >= 0).
Exits:
Stop-Loss: If use_sl=true, set at 2% below/above entry price.
Take-Profit: If use_tp=true, set at 5% above/below entry price.
Pyramiding: Up to 3 concurrent positions allowed.
h. Visualization
Nash Bands: Orange (mean), red (upper), green (lower).
Background Colors:
Herd buying: Red (90% transparency).
Herd selling: Green.
Institutional volume: Blue.
Signals:
Contrarian buy/sell: Green/red triangles below/above bars.
Liquidity traps: Red/green crosses above/below bars.
Tables:
Game Theory Table (Top-Right):
Herd Behavior: Buying frenzy, selling panic, or normal.
Institutional Flow: Accumulation, distribution, or neutral.
Nash Equilibrium: In equilibrium, above, or below.
Liquidity Status: Trap detected or safe.
Position Suggestion: Long (green), Short (red), or Wait (gray).
Backtest Table (Bottom-Right):
Total Trades: Number of closed trades.
Win Rate: Percentage of winning trades.
Net Profit/Loss: In USD, colored green/red.
Profit Factor: Gross profit / gross loss.
Max Drawdown: Peak-to-trough equity drop (%).
Win/Loss Trades: Number of winning/losing trades.
Risk/Reward Ratio: Simplified Sharpe ratio (returns / drawdown).
Avg Win/Loss Ratio: Average win per trade / average loss per trade.
Last Update: Current time.
i. Backtesting Metrics
Tracks:
Total trades, winning/losing trades.
Win rate (%).
Net profit ($).
Profit factor (gross profit / gross loss).
Max drawdown (%).
Simplified Sharpe ratio (returns / drawdown).
Average win/loss ratio.
Updates metrics on each closed trade.
Displays a label on the last bar with backtest period, total trades, win rate, and net profit.
j. Alerts
No explicit alertconditions defined, but you can add them for long_signal and short_signal (e.g., alertcondition(long_signal, "GT Long Entry", "Long Signal Detected!")).
Use TradingView's alert system with Strategy Tester outputs.
3. Usage Tips
Timeframe: Best for H1-D1 timeframes. Shorter frames (M1-M15) may produce noisy signals.
Settings:
Risk Management: Adjust sl_percent (e.g., 1% for volatile markets) and tp_percent (e.g., 3% for scalping).
Herd Threshold: Increase to 2.5 for stricter herd detection in choppy markets.
Liquidity Lookback: Reduce to 20 for faster markets (e.g., crypto).
Nash Period: Increase to 200 for longer-term analysis.
Backtesting:
Use TradingView's Strategy Tester to evaluate performance.
Check win rate (>50%), profit factor (>1.5), and max drawdown (<20%) for viability.
Test on different assets/timeframes to ensure robustness.
Live Trading:
Start with a demo account.
Combine with other indicators (e.g., EMAs, support/resistance) for confirmation.
Monitor liquidity traps and institutional flow for context.
Risk Management:
Always use SL/TP to limit losses.
Adjust position_size for risk tolerance (e.g., 5% of equity for conservative trading).
Avoid over-leveraging (pyramiding=3 can amplify risk).
Troubleshooting:
If no trades are executed, check signal conditions (e.g., lower herd_threshold or liquidity_sensitivity).
Ensure sufficient historical data for Nash and liquidity calculations.
If tables overlap, adjust position.top_right/bottom_right coordinates.
4. Key Differences from the Previous Indicator
Indicator vs. Strategy: The previous code was an indicator (VP + Game Theory Integrated Strategy) focused on visualization and alerts. This is a strategy with automated entries/exits and backtesting.
Volume Profile: Absent in this strategy, making it lighter but less focused on high-volume zones.
Wick Analysis: Not included here, unlike the previous indicator's heavy reliance on wick patterns.
Backtesting: This strategy includes detailed performance metrics and a backtest table, absent in the indicator.
Simpler Signals: Focuses on Game Theory signals (contrarian, momentum, Nash reversion) without the "Power/Ultra Power" hierarchy.
Risk Management: Explicit SL/TP and dynamic position sizing, not present in the indicator.
5. Conclusion
The "Game Theory Trading Strategy" is a sophisticated system leveraging herd behavior, institutional flows, liquidity traps, and Nash equilibrium to trade market inefficiencies. It’s designed for traders who understand Game Theory principles and want automated execution with robust risk management. However, it requires thorough backtesting and parameter optimization for specific markets (e.g., forex, crypto, stocks). The backtest table and visual aids make it easy to monitor performance, but always combine with other analysis tools and proper capital management.
If you need help with backtesting, adding alerts, or optimizing parameters, let me know!
Search in scripts for "candle"

Aftershock Playbook: Stock Earnings Drift EngineStrategy type
Event-driven post-earnings momentum engine (long/short) built for single-stock charts or ADRs that publish quarterly results.
What it does
Detects the exact earnings bar (request.earnings, lookahead_off).
Scores the surprise and launches a position on that candle’s close.
Tracks PnL: if the first leg closes green, the engine automatically re-enters on the very next bar, milking residual drift.
Blocks mid-cycle trades after a loss until the next earnings release—keeping the risk contained to one cycle.
Think of it as a sniper that fires on the earnings pop, reloads once if the shot lands, then goes silent until the next report.
Core signal inputs
Component Default Purpose
EPS Surprise % +0 % / –5 % Minimum positive / negative shock to trigger longs/shorts.
Reverse signals? Off Quick flip for mean-reversion experiments.
Time Risk Mgt. Off Optional hard exit after 45 calendar days (auto-scaled to any TF).
Risk engine
ATR-based stop (ATR × 2 by default, editable).
Bar time stop (15-min → Daily: Have to select the bar value ).
No pyramiding beyond the built-in “double-tap”.
All positions sized as % of equity via Strategy Properties.
Visual aids
Yellow triangle marks the earnings bar.
Diagnostics table (top-right) shows last Actual, Estimate, and Surprise %.
Status-line tool-tips on every input.
Default inputs
Setting Value
Positive surprise ≥ 0 %
Negative surprise ≤ –5 %
ATR stop × 2
ATR length 50
Hold horizon 350 ( 1h timeframe chart bars)
Back-test properties
Initial capital 10 000
Order size 5 % of equity
Pyramiding 1 (internal re-entry only)
Commission 0.03 %
Slippage 5 ticks
Fills Bar magnifier ✔ · On bar close ✔ · Standard OHLC ✔
How to use
Add the script to any earnings-driven stock (AAPL, MSFT, TSLA…).
Turn on Time Risk Management if you want stricter risk management
Back-test different ATR multipliers to fit the stock’s volatility.
Sync commission & slippage with your broker before forward-testing.
Important notes
Works on every timeframe from 15 min to 1 D. Sweet spot around 30min/1h
All request.earnings() & request.security() calls use lookahead_off—zero repaint.
The “double-tap” re-entry occurs once per winning cycle to avoid drift-chasing loops.
Historical stats ≠ future performance. Size positions responsibly.

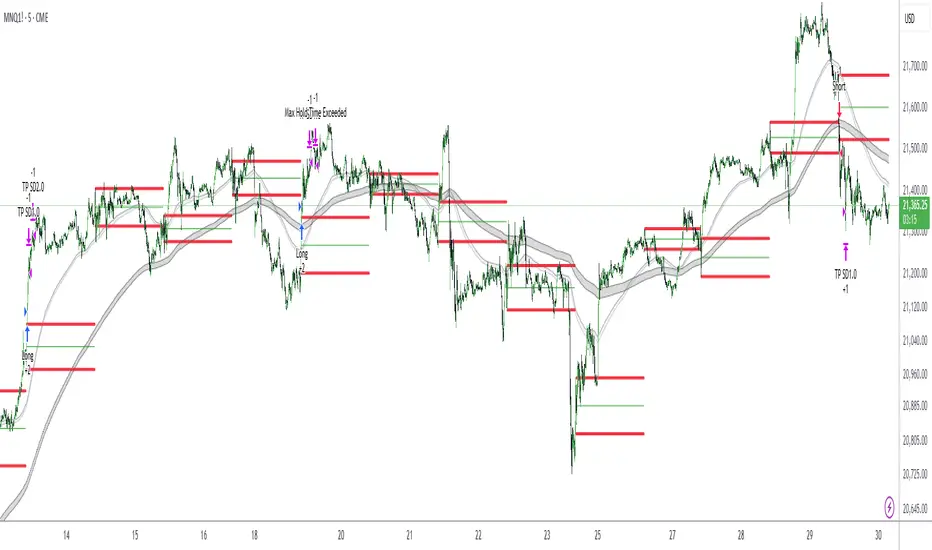
Antony.N4A -NQ ORB Quartile Str v6.3Antony.N4A – NQ ORB Quartile Strategy v6.3
A precision-engineered intraday breakout system built for the Nasdaq futures market, combining the Opening Range Breakout (ORB) logic with dynamic standard deviation targets, structural filters, and multi-layer risk management.
🧠 Key Features
Opening Range Breakout (ORB):
Automatically defines a breakout window (default: 09:30–09:45) and triggers entries when price breaks the high or low of that range.
Standard Deviation Profit Targets:
Supports SD0.5, SD1.0, SD1.5, and SD2.0 targets relative to the ORB range.
EMA Filtering (200-period):
Filters trades based on EMA direction and price position to validate breakout direction and avoid false entries.
Range Filtering:
Detects directional bias and volatility trends using smoothed range logic.
Momentum Triggering:
Validates breakout momentum and allows entries when directional momentum is positive and increasing.
⚙️ User Inputs
ORB Settings: Timeframe, session, and timezone customization
Entry Window: Define when trades are allowed to trigger
Day Filters: Enable/disable trading by weekday
SD Targets: Configure exit % and active levels (SD0.5 – SD2.0)
EMA Filter & Sensitivity
Cross Filter (Anti-chop logic)
Range Filter Parameters
Visual Toggles: ORB range, SD levels, EMA clouds
🎯 Trade Management Rules
Entry:
Triggered at the close of a 5-minute candle confirming a breakout of the ORB range.
Stop Loss:
Defined by structural invalidation (quartile boundaries & mid-range buffers).
Take Profit Strategy:
75% closed at SD1.0 level
Remaining 25% trailed to further SD2 target
SL is moved to breakeven after partial exit
Execution Controls:
No pyramiding
No re-entries (cooldown enforced)
🔧 Trading Modes
✅ Safe Mode
EMA Filter: Enabled
EMA Sensitivity: 19
Range Filter: Disabled
Ideal for conservative setups and reduced noise environments
🔥 Aggressive Mode
EMA Filter: Enabled
EMA Sensitivity: 5
Range Filter: Disabled
Suited for high-frequency setups and faster breakouts
📊 Backtest Performance (7-Month Sample)
Safe Mode:
Win Rate: 66%
Total Trades: 29
Net PnL: +21.79R (~$4,357 with R = $200)
Max Red Days: 3
Max Drawdown: -$663
Best Month: +9R, Worst Month: -2R
Aggressive Mode:
Win Rate: 63%
Total Trades: 52
Net PnL: +30R (~$6,080)
Max Red Days: 6
Max Drawdown: -$1,357
Best Month: +12R, Worst Month: -3.2R
👨💻 Developed by Antony.N4A
This tool is crafted for strategic intraday traders, system developers, and backtesters.
For access, customization, or licensing options, contact the developer directly.
Protected script. Redistribution or reuse without permission is prohibited.
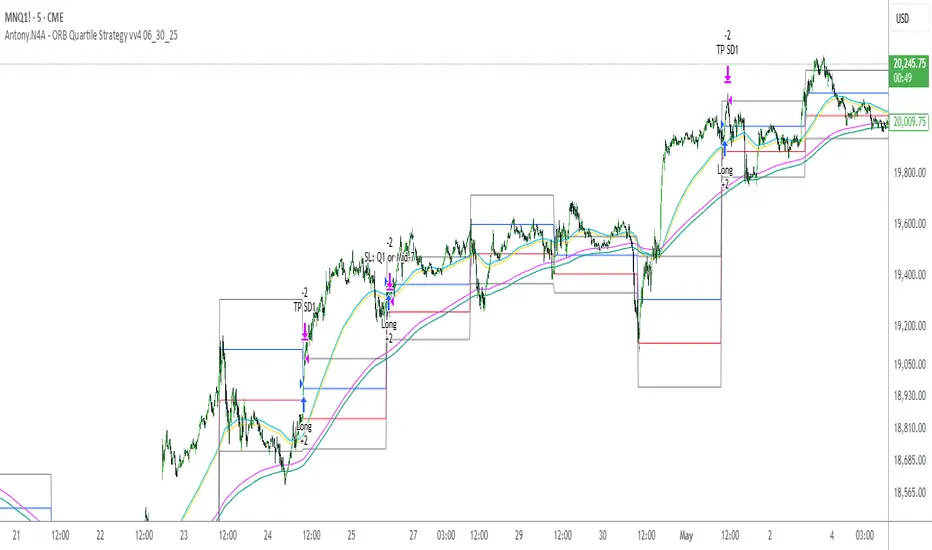
Antony.N4A - ORB Quartile Strategy vv4 06_30_25📌 Antony.N4A - ORB Quartile Strategy vv4
This script implements a fully automated Opening Range Breakout (ORB) trading strategy, engineered for precision execution within predefined market windows. It is compatible with both New York and London sessions, and integrates advanced internal logic including trend validation, breakout confirmation, position scaling, and risk-defined stop/target management.
🧠 Core Logic Overview:
ORB Range Calculation: Based on configurable session time (default: 09:30–09:45 EST)
Entry Window: Trade initiations are permitted only within a defined intraday range
Trend Validation Filters: Proprietary EMA-based mechanisms to confirm directional bias
Contract Sizing Engine: Dynamically adjusts trade size to respect a per-trade risk ceiling
Risk Parameters: Designed to cap maximum loss per trade at approximately $300–400
🎯 Trade Management Rules:
Entry:
Triggered at the close of a 5-minute candle that confirms a directional breakout of the ORB
Stop Loss:
Enforced via structural breakout invalidation levels (Quartile boundaries and mid-range buffer)
Profit Targeting:
- 75% of position is closed at the first standard deviation (SD1) level
- Remaining 25% is trailed to extended targets, with stop-loss adjusted to breakeven post-partial
No pyramiding, re-entries are limited by cooldown logic and session controls
📊 Backtest Performance (Oct 2024 – Apr 2025):
Total Trades: 36
Win Rate: 64%
Worst Losing Streak: 4 consecutive trades
Worst Month: January 2025 (-1.49R)
Net Performance: +21.5R
Strategy tested on NQ futures with NY session breakout configuration
This strategy is intended for disciplined intraday traders seeking a structured, semi-mechanical approach to volatility expansion. It is best used in high-liquidity markets and news-driven sessions.
Same high/low updateHere I made a strategy out of my indicator. So, the trigger is double low/high on 1 week candle chart.
Entrance: close of the next candle if it's low/high higher/lower than previous one. (in most cases it's precise for backtesting)
Stop loss: long:low-one tick, short:high+one tick
Take profit: ATR*Multiplier (you can tune it in properties)

Gap Down Reversal StrategyA "Gap down Reversal" is when the current days candle, opens, below the prior days close, and "finishes up" on the day with the close greater than the open. This type of price action can provide traders with favorable entry points to trade long, as anyone who was short the prior day, can get squeezed or panic out of the trade as they would see profits erode quickly from the gap down at the open.
Strategy results are shown on SHOP with 10k starting capital and 10k per trade. The strategy enters at next days close after the gap down reversal fires off, and a 5% trailing stop order is also executed. This is important to understand when experimenting with different trailing stops on different symbols and observing results to find the most viable strategy. The discretionary trader may choose to enter at the close, or at the next days open, so understand results are not calculated for those entry points.
You also may alter the start date of the strategy, so you can include, or exclude certain dates.
Experiment with different stops and symbols! More volatile symbols most likely will need looser stops and Vice Versa. Concentrate on symbols in up trends, as "the dips" usually get consistently bought in these names, but hard reversals in downtrends can happen as well.
Any questions/concerns please let me know and happy trading.

Candle Patterns Strategy V1//Modify DanyChe script to work in latest version of pinescript
//The script allows you to test popular candlestick patterns on various instruments and timeframes. In addition, you can configure risk management (if the value is zero, it means the function is disabled), and you can also specify the time of the trading session (for example, so that the positions are not transferred to the next day).
//The author is grateful to JayRogers and Phi35, their code examples helped a lot in writing the strategy.

Candle Patterns Strategy//I saw this code from DanyChe, i modify it to work on the latest version of pinescript
//The script allows you to test popular candlestick patterns on various instruments and timeframes. In addition, you can configure risk management (if the value is zero, it means the function is disabled), and you can also specify the time of the trading session (for example, so that the positions are not transferred to the next day).
//The author is grateful to JayRogers and Phi35, their code examples helped a lot in writing the strategy.
Renko Plot StrategyThis strategy lets you plot Renko open and close values, based on your preferred Renko size brick, on normal candle chart. You can use it on any timeframe, define your preferred brick size and trailing stop.

Up Down Strategy with MA Controla simple up down candle strategy with a built in MA control
alerts script:

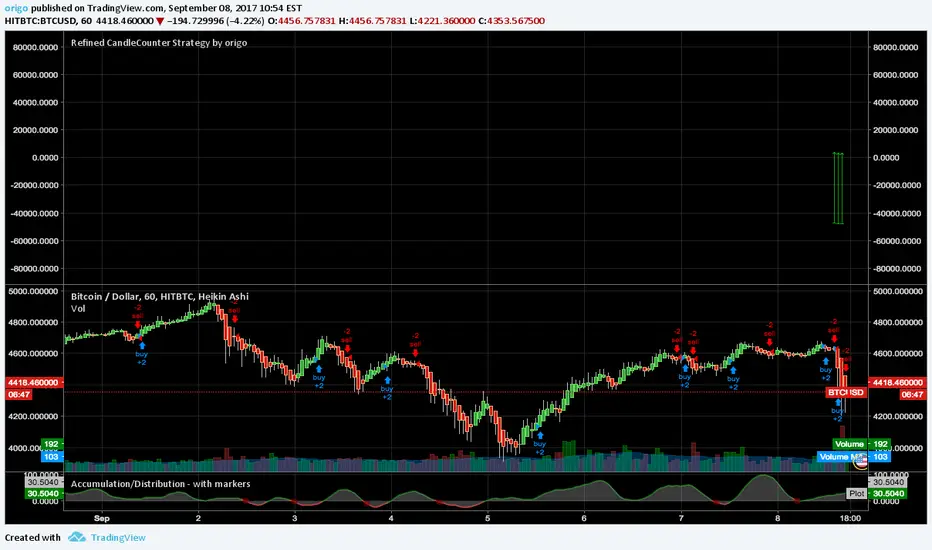
Refined CandleCounter Strategy A while ago I published a Candle Counter strategy that got quite some attention. Unfortunately it didn't work for all charts for some reason, so I decided to rewrite it. The result is, to me, astonishing. Judge for yourselves!
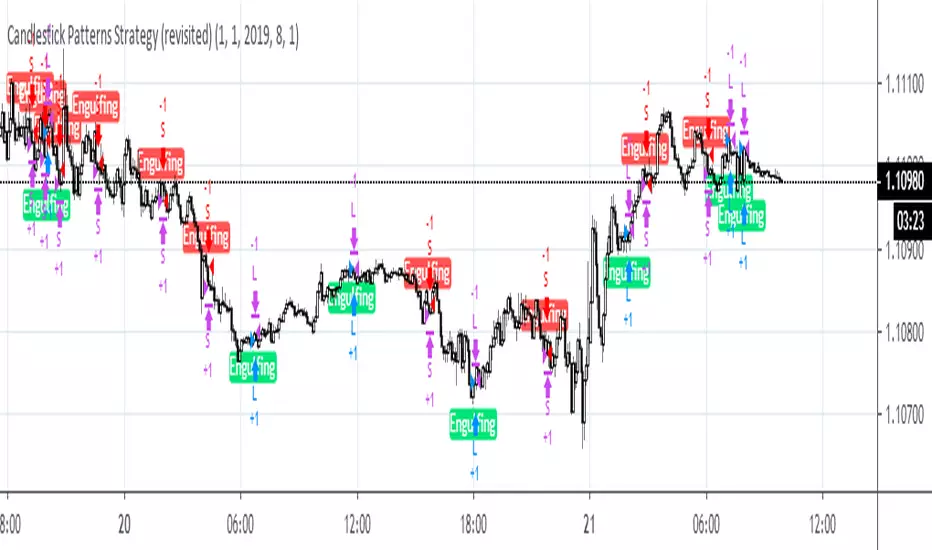
Candlestick Patterns Strategy (revisited)This strategy is used as a benchmark to see how it compares with other strategies posted by me recently. In all, the below collection of candlestick patterns appears to be one of the best among the ones that can be found here, imho.
Naresh - iJPASIMPORTANT NOTE
This strategy has been developed as a professional service. It was published only or testing and verification by the customer. As such, access cannot be granted to anyone else. Sorry about that!
Other open source scripts are available on the BacktestRookies profile.
Intra-day Japanese Candlestick Price Action Strategy
An intraday strategy which focuses on analyzing price action of the opening 3 bars to make trading decisions.
Once certain criteria are met, entry and exit targets are set and left until they are hit else we reset and start again on a new day.

Candle analysis & long/short strategy (HF) inspired by TurtleBCThis script is based on the candle meaning and a period based trading strategy

Heikinashi Simple BacktestV74: Strategy version of historical intra-bar long TF Heikin Ashi candlestick development analysis.

ORB Heikin Ashi SPY 5min Correlation StrategyOverview:
The ORB (Opening Range Breakout) strategy combined with Heikin Ashi candles and Relative Volume (RVOL) indicator aims to capitalize on significant price movements that occur shortly after the market opens. This strategy identifies breakouts above or below the opening range, using Heikin Ashi candles for smoother price visualization and RVOL to gauge the strength of the breakout.
Components:
Opening Range Breakout (ORB): The strategy starts by defining the opening range, typically the first few minutes of the trading session. It then identifies breakouts above the high or below the low of this range as potential entry points.
Heikin Ashi Candles: Heikin Ashi candles are used to provide a smoother representation of price movements compared to traditional candlesticks. By averaging open, close, high, and low prices of the previous candle, Heikin Ashi candles reduce noise and highlight trends more effectively.
Relative Volume (RVOL): RVOL compares the current volume of a stock to its average volume over a specified period. It helps traders identify abnormal trading activity, which can signal potential price movements.
Candle for correlation : In this case we are using SPY candles. It can also use different asset
Strategy Execution:
Initialization: The strategy initializes by setting up variables and parameters, including the ORB period, session timings, and Heikin Ashi candle settings.
ORB Calculation: It calculates the opening range by identifying the high and low prices during the specified session time. These values serve as the initial reference points for potential breakouts. For this we are looking for the first 30 min of the US opening session.
After that we are going to use the next 2 hours to check for breakout opportunities.
Heikin Ashi Transformation: Optionally, the strategy transforms traditional candlestick data into Heikin Ashi format for smoother visualization and trend identification.
Breakout Identification: It continuously monitors price movements within the session and checks if the current high breaches the ORB high or if the current low breaches the ORB low. These events trigger potential long or short entry signals, respectively.
RVOL Analysis: Simultaneously, the strategy evaluates the relative volume of the asset to gauge the strength of the breakout. A surge in volume accompanying the breakout confirms the validity of the signal. In this case we are looking for at least a 1 value of the division between currentVolume and pastVolume
Entry and Exit Conditions: When a breakout occurs and is confirmed by RVOL and is within our session time, the strategy enters a long or short position accordingly. It does not have a stop loss or a takie profit level, instead it will always exit at the end of the trading session, 5 minutes before
Position Sizing and Commissions: For the purpose of this backtest, the strategy allocated 10% of the capital for each trade and assumes a trading commission of 0.01$ per share ( twice the IBKR broker values)
Session End: At the end of the trading session, the strategy closes all open positions to avoid overnight exposure.
Conclusion:
The combination of ORB breakout strategy, Heikin Ashi candles, and RVOL provides traders with a robust framework for identifying and capitalizing on early trends in the market. By leveraging these technical indicators together, traders can make more informed decisions and improve the overall performance of their trading strategies. However, like any trading strategy, it's essential to backtest thoroughly and adapt the strategy to different market conditions to ensure its effectiveness over time.

Superior-Range Bound Renko - Strategy - 11-29-25 - SignalLynxSuperior-Range Bound Renko Strategy with Advanced Risk Management Template
Signal Lynx | Free Scripts supporting Automation for the Night-Shift Nation 🌙
1. Overview
Welcome to Superior-Range Bound Renko (RBR) — a volatility-aware, structure-respecting swing-trading system built on top of a full Risk Management (RM) Template from Signal Lynx.
Instead of relying on static lookbacks (like “14-period RSI”) or plain MA crosses, Superior RBR:
Adapts its range definition to market volatility in real time
Emulates Renko Bricks on a standard, time-based chart (no Renko chart type required)
Uses a stack of Laguerre Filters to detect genuine impulse vs. noise
Adds an Adaptive SuperTrend powered by a small k-means-style clustering routine on volatility
Under the hood, this script also includes the full Signal Lynx Risk Management Engine:
A state machine that separates “Signal” from “Execution”
Layered exit tools: Stop Loss, Trailing Stop, Staged Take Profit, Advanced Adaptive Trailing Stop (AATS), and an RSI-style stop (RSIS)
Designed for non-repainting behavior on closed candles by basing execution-critical logic on previous-bar data
We are publishing this as an open-source template so traders and developers can leverage a professional-grade RM engine while integrating their own signal logic if they wish.
2. Quick Action Guide (TL;DR)
Best Timeframe:
4 Hours (H4) and above. This is a high-conviction swing-trading system, not a scalper.
Best Assets:
Volatile instruments that still respect market structure:
Bitcoin, Ethereum, Gold (XAUUSD), high-volatility Forex pairs (e.g., GBPJPY), indices with clean ranges.
Strategy Type:
Volatility-Adaptive Trend Following + Impulse Detection.
It hunts for genuine expansion out of ranges, not tiny mean-reversion nibbles.
Key Feature:
Renko Emulation on time-based candles.
We mathematically model Renko Bricks and overlay them on your standard chart to define:
“Equilibrium” zones (inside the brick structure)
“Breakout / impulse” zones (when price AND the impulse line depart from the bricks)
Repainting:
Designed to be non-repainting on closed candles.
All RM execution logic uses confirmed historical data (no future bars, no security() lookahead). Intrabar flicker during formation is allowed, but once a bar closes the engine’s decisions are stable.
Core Toggles & Filters:
Enable Longs and Shorts independently
Optional Weekend filter (block trades on Saturday/Sunday)
Per-module toggles: Stop Loss, Trailing Stop, Staged Take Profits, AATS, RSIS
3. Detailed Report: How It Works
A. The Strategy Logic: Superior RBR
Superior RBR builds its entry signal from multiple mathematical layers working together.
1) Adaptive Lookback (Volatility Normalization)
Instead of a fixed 100-bar or 200-bar range, the script:
Computes ATR-based volatility over a user-defined period.
Normalizes that volatility relative to its recent min/max.
Maps the normalized value into a dynamic lookback window between a minimum and maximum (e.g., 4 to 100 bars).
High Volatility:
The lookback shrinks, so the system reacts faster to explosive moves.
Low Volatility:
The lookback expands, so the system sees a “bigger picture” and filters out chop.
All the core “Range High/Low” and “Range Close High/Low” boundaries are built on top of this adaptive window.
2) Range Construction & Quick Ranges
The engine constructs several nested ranges:
Outer Range:
rangeHighFinal – dynamic highest high
rangeLowFinal – dynamic lowest low
Inner Close Range:
rangeCloseHighFinal – highest close
rangeCloseLowFinal – lowest close
Quick Ranges:
“Half-length” variants of those, used to detect more responsive changes in structure and volatility.
These ranges define:
The macro box price is trading inside
Shorter-term “pressure zones” where price is coiling before expansion
3) Renko Emulation (The Bricks)
Rather than using the Renko chart type (which discards time), this script emulates Renko behavior on your normal candles:
A “brick size” is defined either:
As a standard percentage move, or
As a volatility-driven (ATR) brick, optionally inhibited by a minimum standard size
The engine tracks a base value and derives:
brickUpper – top of the emulated brick
brickLower – bottom of the emulated brick
When price moves sufficiently beyond those levels, the brick “shifts”, and the directional memory (renkoDir) updates:
renkoDir = +2 when bricks are advancing upward
renkoDir = -2 when bricks are stepping downward
You can think of this as a synthetic Renko tape overlaid on time-based candles:
Inside the brick: equilibrium / consolidation
Breaking away from the brick: momentum / expansion
4) Impulse Tracking with Laguerre Filters
The script uses multiple Laguerre Filters to smooth price and brick-derived data without traditional lag.
Key filters include:
LagF_1 / LagF_W: Based on brick upper/lower baselines
LagF_Q: Based on HLCC4 (high + low + 2×close)/4
LagF_Y / LagF_P: Complex averages combining brick structures and range averages
LagF_V (Primary Impulse Line):
A smooth, high-level impulse line derived from a blend of the above plus the outer ranges
Conceptually:
When the impulse line pushes away from the brick structure and continues in one direction, an impulse move is underway.
When its direction flips and begins to roll over, the impulse is fading, hinting at mean reversion back into the range.
5) Fib-Based Structure & Swaps
The system also layers in Fib levels derived from the adaptive ranges:
Standard levels (12%, 23.6%, 38.2%, 50%, 61%, 76.8%, 88%) from the main range
A secondary “swap” set derived from close-range dynamics (fib12Swap, fib23Swap, etc.)
These Fibs are used to:
Bucket price into structural zones (below 12, between 23–38, etc.)
Detect breakouts when price and Laguerre move beyond key Fib thresholds
Drive zSwap logic (where a secondary Fib set becomes the active structure once certain conditions are met)
6) Adaptive SuperTrend with K-Means-Style Volatility Clustering
Under the hood, the script uses a small k-means-style clustering routine on ATR:
ATR is measured over a fixed period
The range of ATR values is split into Low, Medium, High volatility centroids
Current ATR is assigned to the nearest centroid (cluster)
From that, a SuperTrend variant (STK) is computed with dynamic sensitivity:
In quiet markets, SuperTrend can afford to be tighter
In wild markets, it widens appropriately to avoid constant whipsaw
This SuperTrend-based oscillator (LagF_K and its signals) is then combined with the brick and Laguerre stack to confirm valid trend regimes.
7) Final Baseline Signals (+2 / -2)
The “brain” of Superior RBR lives in the Baseline & Signal Generation block:
Two composite signals are built: B1 and B2:
They combine:
Fib breakouts
Renko direction (renkoDir)
Expansion direction (expansionQuickDir)
Multiple Laguerre alignments (LagF_Q, LagF_W, LagF_Y, LagF_Z, LagF_P, LagF_V)
They also factor in whether Fib structures are expanding or contracting.
A user toggle selects the “Baseline” signal:
finalSig = B2 (default) or B1 (alternate baseline)
finalSig is then filtered through the RM state machine and only when everything aligns, we emit:
+2 = Long / Buy signal
-2 = Short / Sell signal
0 = No new trade
Those +2 / -2 values are what feed the Risk Management Engine.
B. The Risk Management (RM) Engine
This script features the Signal Lynx Risk Management Engine, a proprietary state machine built to separate Signal from Execution.
Instead of firing orders directly on indicator conditions, we:
Convert the raw signal into a clean integer (Fin = +2 / -2 / 0)
Feed it into a Trade State Machine that understands:
Are we flat?
Are we in a long or short?
Are we in a closing sequence?
Should we permit re-entry now or wait?
Logic Injection / Template Concept:
The RM engine expects a simple integer:
+2 → Buy
-2 → Sell
Everything else (0) is “no new trade”
This makes the script a template:
You can remove the Superior RBR block
Drop in your own logic (RSI, MACD, price action, etc.)
As long as you output +2 or -2 into the same signal channel, the RM engine can drive all exits and state transitions.
Aggressive vs Conservative Modes:
The input AgressiveRM (Aggressive RM) governs how we interpret signals:
Conservative Mode (Aggressive RM = false):
Uses a more filtered internal signal (AF) to open trades
Effectively waits for a clean trend flip / confirmation before new entries
Minimizes whipsaw at the cost of fewer trades
Aggressive Mode (Aggressive RM = true):
Reacts directly to the fresh alert (AO) pulses
Allows faster re-entries in the same direction after RM-based exits
Still respects your pyramiding setting; this script ships with pyramiding = 0 by default, so it will not stack multiple positions unless you change that parameter in the strategy() call.
The state machine enforces discipline on top of your signal logic, reducing double-fires and signal spam.
C. Advanced Exit Protocols (Layered Defense)
The exit side is where this template really shines. Instead of a single “take profit or stop loss,” it uses multiple, cooperating layers.
1) Hard Stop Loss
A classic percentage-based Stop Loss (SL) relative to the entry price.
Acts as a final “catastrophic protection” layer for unexpected moves.
2) Standard Trailing Stop
A percentage-based Trailing Stop (TS) that:
Activates only after price has moved a certain percentage in your favor (tsActivation)
Then trails price by a configurable percentage (ts)
This is a straightforward, battle-tested trailing mechanism.
3) Staged Take Profits (Three Levels)
The script supports three staged Take Profit levels (TP1, TP2, TP3):
Each stage has:
Activation percentage (how far price must move in your favor)
Trailing amount for that stage
Position percentage to close
Example setup:
TP1:
Activate at +10%
Trailing 5%
Close 10% of the position
TP2:
Activate at +20%
Trailing 10%
Close another 10%
TP3:
Activate at +30%
Trailing 5%
Close the remaining 80% (“runner”)
You can tailor these quantities for partial scaling out vs. letting a core position ride.
4) Advanced Adaptive Trailing Stop (AATS)
AATS is a sophisticated volatility- and structure-aware stop:
Uses Hirashima Sugita style levels (HSRS) to model “floors” and “ceilings” of price:
Dungeon → Lower floors → Mid → Upper floors → Penthouse
These levels classify where current price sits within a long-term distribution.
Combines HSRS with Bollinger-style envelopes and EMAs to determine:
Is price extended far into the upper structure?
Is it compressed near the lower ranges?
From this, it computes an adaptive factor that controls how tight or loose the trailing level (aATS / bATS) should be:
High Volatility / Penthouse areas:
Stop loosens to avoid getting wicked out by inevitable spikes.
Low Volatility / compressed structure:
Stop tightens to lock in and protect profit.
AATS is designed to be the “smart last line” that responds to context instead of a single fixed percentage.
5) RSI-Style Stop (RSIS)
On top of AATS, the script includes a RSI-like regime filter:
A McGinley Dynamic mean of price plus ATR bands creates a dynamic channel.
Crosses above the top band and below the lower band change a directional state.
When enabled (UseRSIS):
RSIS can confirm or veto AATS closes:
For longs: A shift to bearish RSIS can force exits sooner.
For shorts: A shift to bullish RSIS can do the same.
This extra layer helps avoid over-reactive stops in strong trends while still respecting a regime change when it happens.
D. Repainting Protection
Many strategies look incredible in the Strategy Tester but fail in live trading because they rely on intrabar values or future-knowledge functions.
This template is built with closed-candle realism in mind:
The Risk Management logic explicitly uses previous bar data (open , high , low , close ) for the key decisions on:
Trailing stop updates
TP triggers
SL hits
RM state transitions
No security() lookahead or future-bar access is used.
This means:
Backtest behavior is designed to match what you can actually get with TradingView alerts and live automation.
Signals may “flicker” intrabar while the candle is forming (as with any strategy), but on closed candles, the RM decisions are stable and non-repainting.
4. For Developers & Modders
We strongly encourage you to mod this script.
To plug your own strategy into the RM engine:
Look for the section titled:
// BASELINE & SIGNAL GENERATION
You will see composite logic building B1 and B2, and then selecting:
baseSig = B2
altSig = B1
finalSig = sigSwap ? baseSig : altSig
You can replace the content used to generate baseSig / altSig with your own logic, for example:
RSI crosses
MACD histogram flips
Candle pattern detectors
External condition flags
Requirements are simple:
Your final logic must output:
2 → Buy signal
-2 → Sell signal
0 → No new trade
That output flows into the RM engine via finalSig → AlertOpen → state machine → Fin.
Once you wire your signals into finalSig, the entire Risk Management system (Stops, TPs, AATS, RSIS, re-entry logic, weekend filters, long/short toggles) becomes available for your custom strategy without re-inventing the wheel.
This makes Superior RBR not just a strategy, but a reference architecture for serious Pine dev work.
5. About Signal Lynx
Automation for the Night-Shift Nation 🌙
Signal Lynx focuses on helping traders and developers bridge the gap between indicator logic and real-world automation. The same RM engine you see here powers multiple internal systems and templates, including other public scripts like the Super-AO Strategy with Advanced Risk Management.
We provide this code open source under the Mozilla Public License 2.0 (MPL-2.0) to:
Demonstrate how Adaptive Logic and structured Risk Management can outperform static, one-layer indicators
Give Pine Script users a battle-tested RM backbone they can reuse, remix, and extend
If you are looking to automate your TradingView strategies, route signals to exchanges, or simply want safer, smarter strategy structures, please keep Signal Lynx in your search.
License: Mozilla Public License 2.0 (Open Source).
If you make beneficial modifications, please consider releasing them back to the community so everyone can benefit.

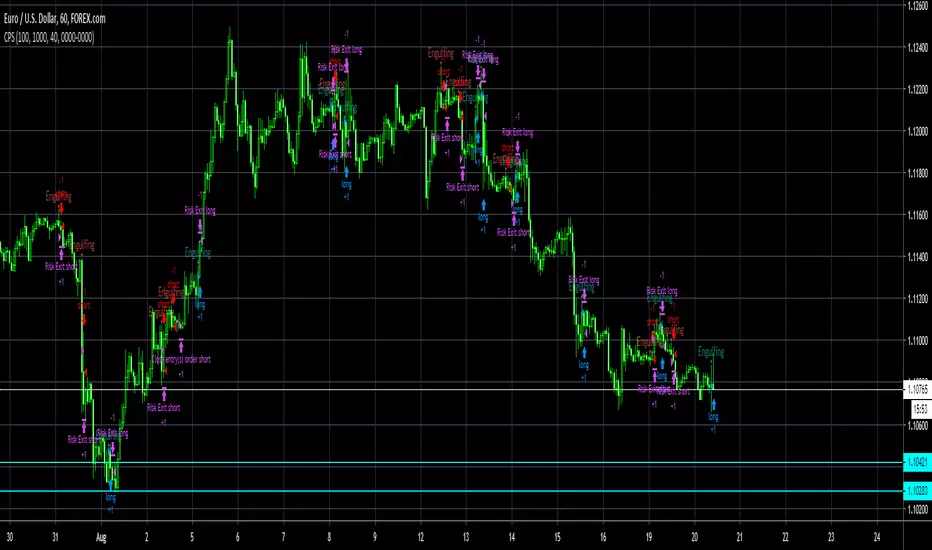
IsAlgo - Reverse Band Strategy► Overview:
The Reverse Band Strategy leverages a custom band indicator combined with a candlestick pattern for trade entries. The strategy initiates trades when a candle closes outside the bands, anticipating that the price will revert inside the bands and reach the opposite side.
► Description:
The Reverse Band Strategy is built around a sophisticated custom band indicator designed to identify potential reversal points in the market. The bands are calculated using a proprietary formula that factors in the trend's slope, the highest and lowest points within the trend, the average price movement, and the number of candles that form the trend. This advanced calculation allows for a dynamic and responsive band that adjusts to market conditions.
Once the band edges are identified, the strategy continuously monitors for candles that close outside these bands. When such a candle is detected, it signals a potential reversal, triggering an entry. The expectation is that the price will revert back inside the bands and move towards the opposite band edge.
How it Works:
Band Calculation: The strategy continuously updates the band edges using the aforementioned factors.aforementioned factors.
Signal Detection: It waits for a candle to close outside the bands.
Trade Entry: When an outside-close candle is detected, the strategy enters a trade expecting the price to revert to the opposite band edge.
Customization: Users can define the characteristics of the entry candle, such as its size relative to previous candles, to ensure it meets specific conditions before triggering a trade.
↑ Long Trade Example:
The entry candle closes below the lower band, indicating a potential upward reversal. The strategy enters a long position expecting the price to move towards the upper band.
↓ Short Trade Example:
The entry candle closes above the upper band, signaling a potential downward reversal. The strategy enters a short position anticipating the price to revert towards the lower band.
► Features and Settings:
⚙︎ Band Customization: Adjust band length, smoothness, and minimum distance to fit different market conditions and trading styles.
⚙︎ Entry Candle: Customize criteria such as candle size, body, and relative position to previous candles to ensure precise entry signals.
⚙︎ Trading Session: This feature allows users to define specific trading hours during which the strategy should operate, ensuring trades are executed only during preferred market periods.
⚙︎ Trading Days: Users can specify which days the strategy should be active, offering the flexibility to avoid trading on specific days of the week.
⚙︎ Backtesting: Enables a backtesting period during which the strategy can be tested over a selected start and end date. This feature can be deactivated if not needed.
⚙︎ Trades: Configure trade direction (long, short, or both), position sizing (fixed or percentage-based), maximum number of open trades, and trade limitations per day or based on band.
⚙︎ Trades Exit: Set profit/loss limits, specify trade duration, or exit based on band reversal signals.
⚙︎ Stop Loss: Various stop-loss methods are available, including a fixed number of pips, ATR-based, or using the highest or lowest price points within a specified number of previous candles. Additionally, trades can be closed after a specific number of candles move in the opposite direction of the trade.
⚙︎ Break Even: This feature adjusts the stop loss to a break-even point once certain conditions are met, such as reaching predefined profit levels, to protect gains.
⚙︎ Trailing Stop: The trailing stop feature adjusts the stop loss as the trade moves into profit, securing gains while potentially capturing further upside.
⚙︎ Take Profit: Up to three take-profit levels can be set using various methods, such as a fixed amount of pips, ATR, or risk-to-reward ratios based on the stop loss. Alternatively, users can specify a set number of candles moving in the direction of the trade.
⚙︎ Alerts: The strategy includes a comprehensive alert system that informs the user of all significant actions, such as trade openings and closings. It supports placeholders for dynamic values like take-profit levels and stop-loss prices.
⚙︎ Dashboard: A visual display provides detailed information about ongoing and past trades on the chart, helping users monitor the strategy's performance and make informed decisions.
► Backtesting Details:
Timeframe: 30-minute GBPUSD chart
Initial Balance: $10,000
Order Size: 5000 units
Commission: 0.02%
Slippage: 5 ticks

PowerZone Trading StrategyExplanation of the PowerZone Trading Strategy for Your Users
The PowerZone Trading Strategy is an automated trading strategy that detects strong price movements (called "PowerZones") and generates signals to enter a long (buy) or short (sell) position, complete with predefined take profit and stop loss levels. Here’s how it works, step by step:
1. What is a PowerZone?
A "PowerZone" (PZ) is a zone on the chart where the price has shown a significant and consistent movement over a specific number of candles (bars). There are two types:
Bullish PowerZone (Bullish PZ): Occurs when the price rises consistently over several candles after an initial bearish candle.
Bearish PowerZone (Bearish PZ): Occurs when the price falls consistently over several candles after an initial bullish candle.
The code analyzes:
A set number of candles (e.g., 5, adjustable via "Periods").
A minimum percentage move (adjustable via "Min % Move for PowerZone") to qualify as a strong zone.
Whether to use the full candle range (highs and lows) or just open/close prices (toggle with "Use Full Range ").
2. How Does It Detect PowerZones?
Bullish PowerZone:
Looks for an initial bearish candle (close below open).
Checks that the next candles (e.g., 5) are all bullish (close above open).
Ensures the total price movement exceeds the minimum percentage set.
Defines a range: from the high (or open) to the low of the initial candle.
Bearish PowerZone:
Looks for an initial bullish candle (close above open).
Checks that the next candles are all bearish (close below open).
Ensures the total price movement exceeds the minimum percentage.
Defines a range: from the high to the low (or close) of the initial candle.
These zones are drawn on the chart with lines: green or white for bullish, red or blue for bearish, depending on the color scheme ("DARK" or "BRIGHT").
3. When Does It Enter a Trade?
The strategy waits for a breakout from the PowerZone range to enter a trade:
Buy (Long): When the price breaks above the high of a Bullish PowerZone.
Sell (Short): When the price breaks below the low of a Bearish PowerZone.
The position size is set to 100% of available equity (adjustable in the code).
4. Take Profit and Stop Loss
Take Profit (TP): Calculated as a multiple (adjustable via "Take Profit Factor," default 1.5) of the PowerZone height. For example:
For a buy, TP = Entry price + (PZ height × 1.5).
For a sell, TP = Entry price - (PZ height × 1.5).
Stop Loss (SL): Calculated as a multiple (adjustable via "Stop Loss Factor," default 1.0) of the PZ height, placed below the range for buys or above for sells.
5. Visualization on the Chart
PowerZones are displayed with lines on the chart (you can hide them with "Show Bullish Channel" or "Show Bearish Channel").
An optional info panel ("Show Info Panel") displays key levels: PZ high and low, TP, and SL.
You can also enable brief documentation on the chart ("Show Documentation") explaining the basic rules.
6. Alerts
The code generates automatic alerts in TradingView:
For a bullish breakout: "Bullish PowerZone Breakout - LONG!"
For a bearish breakdown: "Bearish PowerZone Breakdown - SHORT!"
7. Customization
You can tweak:
The number of candles to detect a PZ ("Periods").
The minimum percentage move ("Min % Move").
Whether to use highs/lows or just open/close ("Use Full Range").
The TP and SL factors.
The color scheme and what elements to display on the chart.
Practical Example
Imagine you set "Periods = 5" and "Min % Move = 2%":
An initial bearish candle appears, followed by 5 consecutive bullish candles.
The total move exceeds 2%.
A Bullish PowerZone is drawn with a high and low.
If the price breaks above the high, you enter a long position with a TP 1.5 times the PZ height and an SL equal to the height below.
The system executes the trade and exits automatically at TP or SL.
Conclusion
This strategy is great for capturing strong price movements after consolidation or momentum zones. It’s automated, visual, and customizable, making it useful for both beginner and advanced traders. Try it out and adjust it to fit your trading style!

IsAlgo - CandleWave Channel Strategy► Overview:
The CandleWave Channel Strategy uses an exponential moving average (EMA) combined with a custom true range function to dynamically calculate a multi-level price channel, helping traders identify potential trend reversals and price pullbacks.
► Description:
The CandleWave Channel Strategy is built around an EMA designed to identify potential reversal points in the market. The channel’s main points are calculated using this EMA, which serves as the foundation for the strategy’s dynamic price channel. The channel edges are determined using a proprietary true range function that measures the distance between the highs and lows of price movements over a specific period. By factoring in the maximum distance between highs and lows and averaging these values over the period, the strategy creates a responsive channel that adapts to current market conditions. The channel consists of five levels, each representing different degrees of trend tension.
The strategy continuously monitors the price in relation to the channel edges. When a candle closes outside one of these edges, it indicates a potential price reversal. This outside-close candle acts as a signal for a possible trend change, prompting the strategy to prepare for a trade entry. Upon detecting an outside-close candle, the strategy triggers an entry. The logic behind this is that when the price moves outside the defined channel, it is likely to revert back within the channel and move towards the opposite edge. The strategy aims to capitalize on this reversion by entering trades based on these signals.
Traders can adjust the channel’s length, levels, and minimum distance to tailor it to different market conditions. They can also define the characteristics of the entry candle, such as its size, body, and relative position to previous candles, to ensure it meets specific conditions before triggering a trade. Additionally, the strategy permits the specification of trading hours and days, enabling traders to focus on preferred market periods. Exit can be configured based on profit/loss limits, trade duration, and band reversal signals or other criteria.
How it Works:
Channel Calculation: The strategy continuously updates the channel edges using the EMA and true range function.
Signal Detection: It waits for a candle to close outside the channel edges.
Trade Entry: When an outside-close candle is detected, the strategy enters a trade expecting the price to revert to the opposite channel edge.
Customization: Users can define the characteristics of the entry candle, such as its size relative to previous candles, to ensure it meets specific conditions before triggering a trade.
↑ Long Trade Example:
The entry candle closes below the channel level, indicating a potential upward reversal. The strategy enters a long position expecting the price to move towards the upper levels.
↓ Short Trade Example:
The entry candle closes above the channel level, signaling a potential downward reversal. The strategy enters a short position anticipating the price to revert towards the lower levels.
► Features and Settings:
⚙︎ Channel: Adjust the channel’s length, levels, and minimum distance to suit different market conditions and trading styles.
⚙︎ Entry Candle: Customize entry criteria, including candle size, body, and relative position to previous candles for accurate signal generation.
⚙︎ Trading Session: Define specific trading hours during which the strategy operates, restricting trades to preferred market periods.
⚙︎ Trading Days: Specify active trading days to avoid certain days of the week.
⚙︎ Backtesting: backtesting for a selected period to evaluate strategy performance. This feature can be deactivated if not needed.
⚙︎ Trades: Configure trade direction (long, short, or both), position sizing (fixed or percentage-based), maximum number of open trades, and daily trade limits.
⚙︎ Trades Exit: Set profit/loss limits, specify trade duration, or exit based on band reversal signals.
⚙︎ Stop Loss: Choose from various stop-loss methods, including fixed pips, ATR-based, or highest/lowest price points within a specified number of candles. Trades can also be closed after a certain number of adverse candle movements.
⚙︎ Break Even: Adjust stop loss to break even once predefined profit levels are reached, protecting gains.
⚙︎ Trailing Stop: Implement a trailing stop to adjust the stop loss as the trade becomes profitable, securing gains and potentially capturing further upside.
⚙︎ Take Profit: Set up to three take-profit levels using methods such as fixed pips, ATR, or risk-to-reward ratios. Alternatively, specify a set number of candles moving in the trade’s direction.
⚙︎ Alerts: Comprehensive alert system to notify users of significant actions, including trade openings and closings. Supports dynamic placeholders for take-profit levels and stop-loss prices.
⚙︎ Dashboard: Visual display on the chart providing detailed information about ongoing and past trades, aiding users in monitoring strategy performance and making informed decisions.
► Backtesting Details:
Timeframe: 30-minute GBPJPY chart
Initial Balance: $10,000
Order Size: 500 units
Commission: 0.02%
Slippage: 5 ticks

IsAlgo - Manual Channel► Overview:
Manual Channel is a strategy that allows traders to manually insert channel lines and set the lines’ width. Trades are opened when the price hits one of the lines and bounces back, with the expectation that it will move towards the opposite line. This strategy offers flexibility in configuring channel lines and trading behavior.
► Description:
The Manual Channel strategy is based on the use of manually defined channel lines to guide trading decisions. Traders start by marking four key points on the chart to create the channel. The first two points share the same time but different prices, and the last two points also share the same time but different prices. This method allows traders to place the channel lines precisely based on their analysis and insights. Additionally, the strategy allows for adjusting the width of the channel lines, which acts as a buffer zone around the main lines.
Once the channel is established, the strategy continuously monitors the price movements in relation to these lines. When the price touches one of the channel lines, the strategy opens a trade with the expectation that the price will bounce back and move towards the opposite line. For example, if the price hits the lower channel line, a long trade (buy) might be opened with the anticipation that the price will rise to the upper channel line. Conversely, if the price hits the upper channel line, a short trade (sell) might be opened expecting the price to fall to the lower channel line.
The strategy offers several options for managing trades. Traders can choose to close a trade when the price reaches the opposite channel line, capturing the expected movement within the channel. Additionally, if the price breaks outside the channel, traders have the option to close trades immediately or stop further trade executions to avoid potential losses.
↑ Channel Example:
↓ Channel Example:
► Features and Settings:
⚙︎ Channel: Define the time and prices of the four main points of the channel lines, and set the lines’ width.
⚙︎ Entry Candle: Specify the minimum and maximum body size and the body-to-candle size ratio for entry candles.
⚙︎ Trading Session: Define specific trading hours during which the strategy operates, restricting trades to preferred market periods.
⚙︎ Trading Days: Specify active trading days to avoid certain days of the week.
⚙︎ Backtesting: Perform backtesting for a selected period to evaluate strategy performance. This feature can be deactivated if not needed.
⚙︎ Trades: Configure trade direction (long, short, or both), position sizing (fixed or percentage-based), maximum number of open trades, and daily trade limits.
⚙︎ Trades Exit: Set profit/loss limits, specify trade duration, or exit based on channel breaks.
⚙︎ Stop Loss: Choose from various stop-loss methods, including fixed pips, ATR-based, or highest/lowest price points within a specified number of candles. Trades can also be closed after a certain number of adverse candle movements.
⚙︎ Break Even: Adjust stop loss to break even once predefined profit levels are reached, protecting gains.
⚙︎ Trailing Stop: Implement a trailing stop to adjust the stop loss as the trade becomes profitable, securing gains and potentially capturing further upside.
⚙︎ Take Profit: Set up to three take-profit levels using methods such as fixed pips, ATR, or risk-to-reward ratios. Alternatively, specify a set number of candles moving in the trade’s direction.
⚙︎ Alerts: Comprehensive alert system to notify users of significant actions, including trade openings and closings. Supports dynamic placeholders for take-profit levels and stop-loss prices.
⚙︎ Dashboard: Visual display on the chart providing detailed information about ongoing and past trades, aiding users in monitoring strategy performance and making informed decisions.
► Backtesting Details:
Timeframe: 15-minute EURUSD chart
Initial Balance: $10,000
Order Size: 10 units
Commission: 0.05%
Slippage: 5 ticks
This strategy opens trades around a manually drawn channel, which results in a smaller number of closed trades.

J2S Backtest: 123-Stormer StrategyThis backtest presents the 123-Stormer strategy created by trader Alexandre Wolwacz "Stormer". The strategy is advocates and shared by the trader through his YouTube channel without restrictions.
Note :
This is not an investment recommendation. The purpose of this study is only to share knowledge with the community on tradingview.
What is the purpose of the strategy?
The strategy is to buy the 123-Stormer pattern at the bottom of an uptrend and sell the 123-Stormer pattern at the top of a downtrend, aiming for a short stop for a long profit target.
To which timeframe of a chart is it applicable to?
Recommended for weekly and daily charts, as the signals are more reliable, being that strategy a good option for swing and position trading.
What about risk management and success rate?
The profit target is established by the author as being twice the risk assumed. Also according to the author, the strategy is mathematically positive, reaching around 65% of success rate in tradings.
How are the trends identified in this strategy?
Two averages are plotted to indicate the trend, a fast EMA average with an 8-week close and a slow EMA average with an 80-week close.
Uptrend happens whenever the fast EMA is above the slow EMA and prices are above the fast EMA. In this case, we should start looking for a LONG entry based on the signal of the 123-Stromer pattern to buying.
On the other hand, downtrend happens when the fast EMA is below the slow EMA and prices are below the fast EMA. In this case, we should start looking for a SHORT entry based on the signal of the 123-Stromer pattern to selling.
How to identify the 123-Stormer pattern for a LONG entry?
This pattern consists of three candles. The first candle has a higher low than the second candle's low, and the third candle has a higher low than the second candle's low. In this pattern, we will buy as soon as a trade occurs above the third candle's high, placing a stop as soon as a trade occurs below the second candle's low, with profit target twice the risk assumed. In another words, the amplitude of the prices of the three candles from the third candle’s high upwards. (you can use fibonacci extension to determine your stops and profit targets).
Importantly, the low of the three candles must be above the fast EMA average and in an uptrend.
How to identify the 123-Stormer pattern for a SHORT entry?
This pattern consists of three candles. The first candle has a lower high than the second candle's high, and the third candle has a lower high than the second candle's high. In this pattern, we will sell as soon as a trade occurs below the third candle's low, placing a stop as soon as a trade occurs above the second candle's high, with profit target twice the risk assumed. In other words, the amplitude of prices of the three candles from the third candle’s low down (you can use fibonacci extension to determine your stops and profit targets).
Importantly, the high of the three candles must be below the fast average and in a downtrend.
Tips and tricks
According to the author, the best signal for both LONG or SHORT entry is when the third candle is a inside bar of second candle.
Backtest features
Backtest parameters are fully customizable. The user chooses to validate only LONG or SHORT entries, or both. It is also possible to determine the specific time period for running the backtests, as well as setting a threshold in candels for entry by the 123-Stormer pattern.
Furthermore, for validation purposes, you can choose to activate the best signal of the pattern recommended by the author of the strategy, as well as change the values of the EMA averages or even deactivate them.
Final message
Feel free to provide me with any improvement suggestions for the backtest script. Bear in mind, feel free to use the ideas in my script in your studies.

Amiya's Doji / Hammer / Spinning Top Breakout Strategy v5How it works
1. Pattern Detection (Previous Candle):
• Checks if total shadow length ≥ 2 × body.
• Checks if candle height (high − low) is between 10 and 21.5 points.
• If true → marks that candle as a potential Doji, Hammer, or Spinning Top.
2. Long Setup:
• LTP (close) crosses above previous candle high.
• Previous candle is a valid pattern candle.
• Stop Loss = 3 points below previous candle low.
• Take Profit = 5 × (high − low) of previous candle added to previous high.
3. Short Setup:
• LTP (close) crosses below previous candle low.
• Previous candle is a valid pattern candle.
• Stop Loss = 3 points above previous candle high.
• Take Profit = 5 × (high − low) of previous candle subtracted from previous low.
4. Visualization:
• Yellow background highlights pattern candles.
• Green ▲ and Red ▼ markers show entry points.
Deep yellow candles → represent Doji / Hammer / Spinning Top patterns
• Green triangle → Buy signal
• Red triangle → Sell signal
• Dotted green line + label → Target
• Dotted red line + label → Stop loss
• Gray background → Outside trading hours
• Auto close → All trades square off at 3:29 PM IST
