ORB FVG Strategy with telegram V6.1Summary
Intraday NY-session strategy with Opening-Range bias (09:30–10:00 NY), FVG entries (incl. optional HTF FVGs), momentum filters (LinReg slope & Williams %R), limit entries inside the zone, SL from FVG anchors, and TP via risk-reward. Includes session/trade caps, pending-order handling, auto-cancel at NY time, and optional Telegram webhook alerts.
Feature Overview
Opening Range & Bias: OR high/low built until 10:00 NY, then frozen. Bias from confirmed 5-minute candles (modes: Body Close, Complete Candle, Wick Only).
FVG Scanner: Bull/bear FVGs (choose wick or body gaps), min size, auto-extend, mitigation cleanup (touch or 50%).
HTF FVG (10 min): Optional – displayed after ≥ 2 consecutive FVGs; cleans up on touch/50%.
Entry/SL/TP: Entry at X% fill (+extra %) within the FVG; SL from FVG candle / FVG-1 / FVG-2 (smart) + buffer; TP via risk-reward.
Momentum Filters: LinReg slope (MLL) + Williams %R with threshold/slope filters (individually switchable).
Intrabar Mode (optional): Immediate Open/intrabar entry on touch (calc_on_every_tick=true) or classic bar-close confirmation (toggle).
Trade Management: Max trades/day, pending cap, auto-cancel at defined NY time, pause after first winner (optional).
Telegram: Programmatic alerts via alert() with Telegram-ready JSON payload.
Parameters (compact)
Group Parameter Purpose
Sessions Trading session, Opening range Trading/OR window (internal NY TZ)
Bias Body Close / Complete Candle / Wick Only Bias confirmation relative to OR
Liquidity LQ session, lookback days, cleanup points, show lines Intraday liquidity marks & cleanup
FVG Min size, wick/body, colors, extend, cleanup Detection/visualization & validity
HTF FVG (10 m) Toggle/Display/Colors Conservative HTF filter/POI
Entry Fill %, extra %, max pending, validity (bars), cancel time, intrabar switch Execution timing, order caps, auto-cancel
Stop Loss Source: Candle / -1 / -2 (smart), buffer (points) SL anchor from FVG history + safety offset
Take Profit Risk-Reward (R:R) Target calculation
Momentum LinReg length/min slope, W%R length/min slope, HUD Trend/momentum filters
Trade Mgmt Max trades/day, pause after win Daily cap / risk cooldown
Telegram Enabled, tester, interval, channel id Webhook output & test signals
Debug & Info Debug panel, rejection reasons On-chart status/diagnostics
Alerts / Telegram Webhook (Quick Setup)
Create an alert with Condition: “Any alert() function call”.
Webhook URL: api.telegram.org
Message: leave empty (the strategy provides JSON via alert() – includes chat_id, parse_mode, text).
Ensure your bot can post to the channel and the chat_id is valid.
Repainting & Backtesting
HTF series via lookahead_off on closed higher-TF candles; FVG detection on confirmed bars (barstate.isconfirmed).
Intrabar/Open entries allow earlier fills but typically cause differences between backtest and live (tick granularity/slippage, limit touch on bar OHLC).
For reproducibility, trade without intrabar (bar-close only).
Limitations
No full tick simulation; limit fills rely on bar OHLC.
Liquidity “cleanup” is rule-based (not an orderbook).
Telegram depends on correct webhook configuration.
Tips
Timeframes: M5 (intrabar)
Start with modest R:R (e.g., 1.5–2.0) and tune filters carefully.
Disclaimer
No financial advice. Past results do not guarantee future performance. Use responsibly and follow Public Library rules.
License / Credits
© 2025 Lean Trading (Lennart Pomreinke). License: MPL-2.0.
Changelog
V06.1: Intrabar switch (Open/intrabar vs bar-close), Telegram sanitizer & tester, HTF-FVG cleanup, refined pending/cancel logic, debug panel (status & rejections).
Search in scripts for "candle"

Full Regime Engine – Trend / Mean Revert / No-Trade🚀 Full Regime Engine Strategy: Trend / Mean Revert / No-Trade
This comprehensive strategy, named the Full Regime Engine, is designed to adapt its trading logic based on prevailing market conditions, classifying the market into three distinct regimes: Trend, Mean Reversion (MR), and No-Trade. It uses a combination of Average True Range (ATR) volatility ratio and the Average Directional Index (ADX) to determine the current regime, ensuring the appropriate entry and exit logic is applied.
⚙️ How the Regime Engine Works
The strategy uses two core indicators to define the market regime:
Volatility Ratio (ATR / SMA of ATR):
High Volatility Ratio (above highVolThr) suggests an active, potentially trending market.
Low Volatility Ratio (below lowVolThr) suggests a calmer, mean-reverting environment.
Average Directional Index (ADX):
High ADX (above adxTrendMin) confirms the strength of a potential trend.
Low ADX (below adxChopMax) confirms a weak, non-directional, or choppy market suitable for mean reversion.
The regimes are defined as follows:
🟢 Trend Regime: High Volatility Ratio AND High ADX.
🔵 Mean Reversion (MR) Regime: Low Volatility Ratio AND Low ADX.
⚫ No-Trade Regime: Any other condition, including outside of the defined session/time filters.
🎯 Entry and Exit Logic by Regime
The strategy employs a different entry and exit approach for each active regime:
1. Trend Regime (Pullback Entries)
Definition: The trend is established using a cross of Fast and Slow EMAs (emaFastLen and emaSlowLen).
Entry Signal: A pullback entry, where the price momentarily touches the Fast EMA and then closes back in the direction of the trend.
Long: low <= Fast EMA and close > Fast EMA (during a bullish trend).
Short: high >= Fast EMA and close < Fast EMA (during a bearish trend).
Risk Management: Uses a wider Stop Loss (slTrend) and Take Profit (tpTrend) based on ATR multiples, reflecting the expectation of larger moves in a trending market.
2. Mean Reversion Regime (VWAP Deviation Fades)
Definition: Trades the fade of extreme price movements back towards the Volume-Weighted Average Price (VWAP).
Entry Signal: Price is significantly deviated from VWAP (measured in ATR multiples mrDevATR) and shows a reversal candle.
Long (Fade Short): Price is far below VWAP (devZ < -mrDevATR) and the current candle is bullish (close > open).
Short (Fade Long): Price is far above VWAP (devZ > mrDevATR) and the current candle is bearish (close < open).
Risk Management: Uses a tighter Stop Loss (slMR) and Take Profit (tpMR) based on ATR multiples, suitable for capturing smaller moves near the mean.
⏱️ Time-Based Filters
The strategy includes robust time filters to only trade during periods with higher liquidity and predictable activity:
RTH Session Filter: Trades only within the defined "Regular Trading Hours" session (sessionStr).
Midday Filter: Optionally avoids the typically slow and choppy midday trading hours (11:00–13:00).
📊 Visuals & Customization
Background Colors: The chart background automatically colors to display the current regime: Green for Trend, Blue for Mean Revert, and Gray for No-Trade.
Plot Shapes: Distinct shapes and labels mark the raw entry signals for both Trend (Triangles) and Mean Reversion (Circles).
ATR Exits: Plots the dynamically calculated Stop Loss (Red) and Take Profit (Green) lines based on the trade's entry mode (Trend or MR).
💡 Note: This is a comprehensive engine that requires careful optimization of the input parameters for your specific instrument and timeframe. Start with the default settings and adjust the regime thresholds (ATR Ratio and ADX) and the risk/reward multiples (SL/TP) to suit your trading style.

FluxGate Daily Swing StrategySummary in one paragraph
FluxGate treats long and short as different ecosystems. It runs two independent engines so the long side can be bold when the tape rewards upside persistence while the short side can stay selective when downside is messy. The core reads three directional drivers from price geometry then removes overlap before gating with clean path checks. The complementary risk module anchors stop distance to a higher timeframe ATR so a unit means the same thing on SPY and BTC. It can add take profit breakeven and an ATR trail that only activates after the trade earns it. If a stop is hit the strategy can re enter in the same direction on the next bar with a daily retry cap that you control. Add it to a clean chart. Use defaults to see the intended behavior. For conservative workflows evaluate on bar close.
Scope and intent
• Markets. Large cap equities and liquid ETFs major FX pairs US index futures and liquid crypto pairs
• Timeframes. From one minute to daily
• Default demo in this publication. SPY on one day timeframe
• Purpose. Reduce false starts without missing sustained trends by fusing independent drivers and suppressing activity when the path is noisy
• Limits. This is a strategy. Orders are simulated on standard candles. Non standard chart types are not supported for execution
Originality and usefulness
• Unique fusion. FluxGate extracts three drivers that look at price from different angles. Direction measures slope of a smoothed guide and scales by realized volatility so a point of slope does not mean a different thing on different symbols. Persistence looks at short sign agreement to reward series of closes that keep direction. Curvature measures the second difference of a local fit to wake up during convex pushes. These three are then orthonormalized so a strong reading in one does not double count through another.
• Gates that matter. Efficiency ratio prefers direct paths over treadmills. Entropy turns up versus down frequency into an information read. Light fractal cohesion punishes wrinkly paths. Together they slow the system in chop and allow it to open up when the path is clean.
• Separate long and short engines. Threshold tilts adapt to the skew of score excursions. That lets long engage earlier when upside distribution supports it and keeps short cautious where downside surprise and venue frictions are common.
• Practical risk behavior. Stops are ATR anchored on a higher timeframe so the unit is portable. Take profit is expressed in R so two R means the same concept across symbols. Breakeven and trailing only activate after a chosen R so early noise does not squeeze a good entry. Re entry after stop lets the system try again without you babysitting the chart.
• Testability. Every major window and the aggression controls live in Inputs. There is no hidden magic number.
Method overview in plain language
Base measures
• Return basis. Natural log of close over prior close for stability and easy aggregation through time. Realized volatility is the standard deviation of returns over a moving window.
• Range basis for risk. ATR computed on a higher timeframe anchor such as day week or month. That anchor is steady across venues and avoids chasing chart specific quirks.
Components
• Directional intensity. Use an EMA of typical price as a guide. Take the day to day slope as raw direction. Divide by realized volatility to get a unit free measure. Soft clip to keep outliers from dominating.
• Persistence. Encode whether each bar closed up or down. Measure short sign agreement so a string of higher closes scores better than a jittery sequence. This favors push continuity without guessing tops or bottoms.
• Curvature. Fit a short linear regression and compute the second difference of the fitted series. Strong curvature flags acceleration that slope alone may miss.
• Efficiency gate. Compare net move to path length over a gate window. Values near one indicate direct paths. Values near zero indicate treadmill behavior.
• Entropy gate. Convert up versus down frequency into a probability of direction. High entropy means coin toss. The gate narrows there.
• Fractal cohesion. A light read of path wrinkliness relative to span. Lower cohesion reduces the urge to act.
• Phase assist. Map price inside a recent channel to a small signed bias that grows with confidence. This helps entries lean toward the right half of the channel without becoming a breakout rule.
• Shock control. Compare short volatility to long volatility. When short term volatility spikes the shock gate temporarily damps activity so the system waits for pressure to normalize.
Fusion rule
• Normalize the three drivers after removing overlap
• Blend with weights that adapt to your aggression input
• Multiply by the gates to respect path quality
• Smooth just enough to avoid jitter while keeping timing responsive
• Compute an adaptive mean and deviation of the score and set separate long and short thresholds with a small tilt informed by skew sign
• The result is one long score and one short score that can cross their thresholds at different times for the same tape which is a feature not a bug
Signal rule
• A long suggestion appears when the long score crosses above its long threshold while all gates are active
• A short suggestion appears when the short score crosses below its short threshold while all gates are active
• If any required gate is missing the state is wait
• When a position is open the status is in long or in short until the complementary risk engine exits or your entry mode closes and flips
Inputs with guidance
Setup Long
• Base length Long. Master window for the long engine. Typical range twenty four to eighty. Raising it improves selectivity and reduces trade count. Lowering it reacts faster but can increase noise
• Aggression Long. Zero to one. Higher values make thresholds more permissive and shorten smoothing
Setup Short
• Base length Short. Master window for the short engine. Typical range twenty eight to ninety six
• Aggression Short. Zero to one. Lower values keep shorts conservative which is often useful on upward drifting symbols
Entries and UI
• Entry mode. Both or Long only or Short only
Complementary risk engine
• Enable risk engine. Turns on bracket exits while keeping your signal logic untouched
• ATR anchor timeframe. Day Week or Month. This sets the structural unit of stop distance
• ATR length. Default fourteen
• Stop multiple. Default one point five times the anchor ATR
• Use take profit. On by default
• Take profit in R. Default two R
• Breakeven trigger in R. Default one R
Usage recipes
Intraday trend focus
• Entry mode Both
• ATR anchor Week
• Aggression Long zero point five Aggression Short zero point three
• Stop multiple one point five Take profit two R
• Expect fewer trades that stick to directional pushes and skip treadmill noise
Intraday mean reversion focus
• Session windows optional if you add them in your copy
• ATR anchor Day
• Lower aggression both sides
• Breakeven later and trailing later so the first bounce has room
• This favors fade entries that still convert into trends when the path stays clean
Swing continuation
• Signal timeframe four hours or one day
• Confirm timeframe one day if you choose to include bias
• ATR anchor Week or Month
• Larger base windows and a steady two R target
• This accepts fewer entries and aims for larger holds
Properties visible in this publication
• Initial capital 25.000
• Base currency USD
• Default order size percent of equity value three - 3% of the total capital
• Pyramiding zero
• Commission zero point zero three percent - 0.03% of total capital
• Slippage five ticks
• Process orders on close off
• Recalculate after order is filled off
• Calc on every tick off
• Bar magnifier off
• Any request security calls use lookahead off everywhere
Realism and responsible publication
• No performance promises. Past results never guarantee future outcomes
• Fills and slippage vary by venue and feed
• Strategies run on standard candles only
• Shapes can update while a bar is forming and settle on close
• Keep risk per trade sensible. Around one percent is typical for study. Above five to ten percent is rarely sustainable
Honest limitations and failure modes
• Sudden news and thin liquidity can break assumptions behind entropy and cohesion reads
• Gap heavy symbols often behave better with a True Range basis for risk than a simple range
• Very quiet regimes can reduce score contrast. Consider longer windows or higher thresholds when markets sleep
• Session windows follow the exchange time of the chart if you add them
• If stop and target can both be inside a single bar this strategy prefers stop first to keep accounting conservative
Open source reuse and credits
• No reused open source beyond public domain building blocks such as ATR EMA and linear regression concepts
Legal
Education and research only. Not investment advice. You are responsible for your decisions. Test on history and in simulation with realistic costs

Universal Regime Alpha Thermocline StrategyCurrents settings adapted for BTCUSD Daily timeframe
This description is written to comply with TradingView House Rules and Script Publishing Rules. It is self contained, in English first, free of advertising, and explains originality, method, use, defaults, and limitations. No external links are included. Nothing here is investment advice.
0. Publication mode and rationale
This script is published as Protected . Anyone can add and test it from the Public Library, yet the source code is not visible.
Why Protected
The engine combines three independent lenses into one regime score and then uses an adaptive centering layer and a thermo risk unit that share a common AAR measure. The exact mapping and interactions are the result of original research and extensive validation. Keeping the implementation protected preserves that work and avoids low effort clones that would fragment feedback and confuse users.
Protection supports a single maintained build for users. It reduces accidental misuse of internal functions outside their intended context which might lead to misleading results.
1. What the strategy does in one paragraph
Universal Regime Alpha Thermocline builds a single number between zero and one that answers a practical question for any market and timeframe. How aligned is current price action with a persistent directional regime right now. To answer this the script fuses three views of the tape. Directional entropy of up versus down closes to measure unanimity.
Convexity drift that rewards true geometric compounding and penalizes drag that comes from chop where arithmetic pace is high but growth is poor.
Tail imbalance that counts decisive bursts in one direction relative to typical bar amplitude. The three channels are blended, optionally confirmed by a higher timeframe, and then adaptively centered to remove local bias. Entries fire when the score clears an entry gate. Exits occur when the score mean reverts below an exit gate or when thermo stops remove risk. Position size can scale with the certainty of the signal.
2. Why it is original and useful
It mixes orthogonal evidence instead of leaning on a single family of tools. Many regime filters depend on moving averages or volatility compression. Here we add an information view from entropy, a growth view from geometric drift, and a structural view from tail imbalance.
The drift channel separates growth from speed. Arithmetic pace can look strong in whipsaw, yet geometric growth stays weak. The engine measures both and subtracts drag so that only sequences with compounding quality rise.
Tail counting is anchored to AAR which is the average absolute return of bars in the window. This makes the threshold self scaling and portable across symbols and timeframes without hand tuned constants.
Adaptive centering prevents the score from living above or below neutral for long stretches on assets with strong skew. It recovers neutrality while still allowing persistent regimes to dominate once evidence accumulates.
The same AAR unit used in the signal also sets stop distance and trail distance. Signal and risk speak the same language which makes the method portable and easier to reason about.
3. Plain language overview of the math
Log returns . The base series is r equal to the natural log of close divided by the previous close. Log return allows clean aggregation and makes growth comparisons natural.
Directional entropy . Inside the lookback we compute the proportion p of bars where r is positive. Binary entropy of p is high when the mix of up and down closes is balanced and low when one direction dominates. Intensity is one minus entropy. Directional sign is two times p minus one. The trend channel is zero point five plus one half times sign times intensity. It lives between zero and one and grows stronger as unanimity increases.
Convexity drift with drag . Arithmetic mean of r measures pace. Geometric mean of the price ratio over the window measures compounding. Drag is the positive part of arithmetic minus geometric. Drift raw equals geometric minus drag multiplier times drag. We then map drift through an arctangent normalizer scaled by AAR and a nonlinearity parameter so the result is stable and remains between zero and one.
Tail imbalance . AAR equals the average of the absolute value of r in the window. We count up tails where r is greater than aar_mult times AAR and down tails where r is less than minus aar_mult times AAR. The imbalance is their difference over their total, mapped to zero to one. This detects directional impulse flow.
Fusion and centering . A weighted average of the three channels yields the raw score. If a higher timeframe is requested, the same function is executed on that timeframe with lookahead off and blended with a weight. Finally we subtract a fraction of the rolling mean of the score to recover neutrality. The result is clipped to the zero to one band.
4. Entries, exits, and position sizing
Enter long when score is strictly greater than the entry gate. Enter short when score is strictly less than one minus the entry gate unless direction is restricted in inputs.
Exit a long when score falls below the exit gate. Exit a short when score rises above one minus the exit gate.
Thermo stops are expressed in AAR units. A long uses the maximum of an initial stop sized by the entry price and AAR and a trail stop that references the running high since entry with a separate multiple. Shorts mirror this with the running low. If the trail is disabled the initial stop is active.
Cooldown is a simple bar counter that begins when the position returns to flat. It prevents immediate re entry in churn.
Dynamic position size is optional. When enabled the order percent of equity scales between a floor and a cap as the score rises above the gate for longs or below the symmetric gate for shorts.
5. Inputs quick guide with recommended ranges
Every input has a tooltip in the script. The same guidance appears here for fast reading.
Core window . Shared lookback for entropy, drift, and tails. Start near 80 on daily charts. Try 60 to 120 on intraday and 80 to 200 for swing.
Entry threshold . Typical range 0.55 to 0.65 for trend following. Faster entries 0.50 to 0.55.
Exit threshold . Typical range 0.35 to 0.50. Lower holds longer yet gives back more.
Weight directional entropy . Starting value 0.40. Raise on markets with clean persistence.
Weight convexity drift . Starting value 0.40. Raise when compounding quality is critical.
Weight tail imbalance . Starting value 0.20. Raise on breakout prone markets.
Tail threshold vs AAR . Typical range 1.0 to 1.5 to count decisive bursts.
Drag penalty . Typical range 0.25 to 0.75. Higher punishes chop more.
Nonlinearity scale . Typical range 0.8 to 2.0. Larger compresses extremes.
AAR floor in percent . Typical range 0.0005 to 0.002 for liquid instruments. This stabilizes the math during quiet regimes.
Adaptive centering . Keep on for most symbols. Center strength 0.40 to 0.70.
Confirm timeframe optional . Leave empty to disable. If used, try a multiple between three and five of the chart timeframe with a blend weight near 0.20.
Dynamic position size . Enable if you want size to reflect certainty. Floor and cap define the percent of equity band. A practical band for many accounts is 0.5 to 2.
Cooldown bars after exit . Start at 3 on daily or slightly higher on shorter charts.
Thermo stop multiple . Start between 1.5 and 3.0 on daily. Adjust to your tolerance and symbol behavior.
Thermo trailing stop and Trail multiple . Trail on locks gains earlier. A trail multiple near 1.0 to 2.0 is common. You can keep trail off and let the exit gate handle exits.
Background heat opacity . Cosmetic. Set to taste. Zero disables it.
6. Properties used on the published chart
The example publication uses BTCUSD on the daily timeframe. The following Properties and inputs are used so everyone can reproduce the same results.
Initial capital 100000
Base currency USD
Order size 2 percent of equity coming from our risk management inputs.
Pyramiding 0
Commission 0.05 percent
Slippage 10 ticks in the publication for clarity. Users should introduce slippage in their own research.
Recalculate after order is filled off. On every tick off.
Using bar magnifier on. On bar close on.
Risk inputs on the published chart. Dynamic position size on. Size floor percent 2. Size cap percent 2. Cooldown bars after exit 3. Thermo stop multiple 2.5. Thermo trailing stop off. Trail multiple 1.
7. Visual elements and alerts
The score is painted as a subtle dot rail near the bottom. A background heat map runs from red to green to convey regime strength at a glance. A compact HUD at the top right shows current score, the three component channels, the active AAR, and the remaining cooldown. Four alerts are included. Long Setup and Short Setup on entry gates. Exit Long by Score and Exit Short by Score on exit gates. You can disable trading and use alerts only if you want the score as a risk switch inside a discretionary plan.
8. How to reproduce the example
Open a BTCUSD daily chart with regular candles.
Add the strategy and load the defaults that match the values above.
Set Properties as listed in section 6.(they are set by default) Confirm that bar magnifier is on and process on bar close is on.
Run the Strategy Tester. Confirm that the trade count is reasonable for the sample. If the count is too low, slightly lower the entry threshold or extend history. If the count is excessively high, raise the threshold or add a small cooldown.
9. Practical tuning recipes
Trend following focus . Raise the entry threshold toward 0.60. Raise the trend weight to 0.50 and reduce tail weight to 0.15. Keep drift near 0.35 to retain the growth filter. Consider leaving the trail off and let the exit threshold manage positions.
Breakout focus . Keep entry near 0.55. Raise tail weight to 0.35. Keep aar_mult near 1.3 so only decisive bursts count. A modest cooldown near 5 can reduce immediate false flips after the first burst bar.
Chop defense . Raise drag multiplier to 0.70. Raise exit threshold toward 0.48 to recycle capital earlier. Consider a higher cooldown, for example 8 to 12 on intraday.
Higher timeframe blend . On a daily chart try a weekly confirm with a blend near 0.20. On a five minute chart try a fifteen minute confirm. This moderates transitions.
Sizing discipline . If you want constant position size, set floor equal to cap. If you want certainty scaling, set a band like 0.5 to 2 and monitor drawdown behavior before widening it.
10. Strengths and limitations
Strengths
Self scaling unit through AAR makes the tool portable across markets and timeframes.
Blends evidence that target different failure modes. Unanimity, growth quality, and impulse flow rarely agree by chance which raises confidence when they align.
Adaptive centering reduces structural bias at the score level which helps during regime flips.
Limitations
In very quiet regimes AAR becomes small even with a floor. If your symbol is thin or gap prone, raise the floor a little to keep stops and drift mapping stable.
Adaptive centering can delay early breakout acceptance. If you miss starts, lower center strength or temporarily disable centering while you evaluate.
Tail counting uses a fixed multiple of AAR. If a market alternates between very calm and very violent weeks, a single aar_mult may not capture both extremes. Sweep this parameter in research.
The engine reacts to realized structure. It does not anticipate scheduled news or liquidity shocks. Use event awareness if you trade around releases.
11. Realism and responsible publication
No promises or projections of performance are made. Past results never guarantee future outcomes.
Commission is set to 0.05 percent per round which is realistic for many crypto venues. Adjust to your own broker or exchange.
Slippage is set at 10 in the publication . Introduce slippage in your own tests or use a percent model.
Position size should respect sustainable risk envelopes. Risking more than five to ten percent per trade is rarely viable. The example uses a fixed two percent position size.
Security calls use lookahead off. Standard candles only. Non standard chart types like Heikin Ashi or Renko are not supported for strategies that submit orders.
12. Suggested research workflow
Begin with the balanced defaults. Confirm that the trade count is sensible for your timeframe and symbol. As a rough guide, aim for at least one hundred trades across a wide sample for statistical comfort. If your timeframe cannot produce that count, complement with multiple symbols or run longer history.
Sweep entry and exit thresholds on a small grid and observe stability. Stability across windows matters more than the single best value.
Try one higher timeframe blend with a modest weight. Large weights can drown the signal.
Vary aar_mult and drag_mult together. This tunes the aggression of breakouts versus defense in chop.
Evaluate whether dynamic size improves risk adjusted results for your style. If not, set floor equal to cap for constancy.
Walk forward through disjoint segments and inspect results by regime. Bootstrapping or segmented evaluation can reveal sensitivity to specific periods.
13. How to read the HUD and heat map
The HUD presents a compact view. Score is the current fused value. Trend is the directional entropy channel. Drift is the compounding quality channel. Tail is the burst flow channel. AAR is the current unit that scales stops and the drift map. CD is the cooldown counter. The background heat is a visual aid only. It can be disabled in inputs. Green zones near the upper band show alignment among the channels. Muted colors near the mid band show uncertainty.
14. Frequently asked questions
Can I use this as a pure indicator . Yes. Disable entries by restricting direction to one side you will not trade and use the alerts as a regime switch.
Will it work on intraday charts . Yes. The AAR unit scales with bar size. You will likely reduce the core window and increase cooldown slightly.
Should I enable the adaptive trail . If you wish to lock gains sooner and accept more exits, enable it. If you prefer to let the exit gate do the heavy lifting, keep it off.
Why do I sometimes see a green background without a position . Heat expresses the score. A position also depends on threshold comparisons, direction mode, and cooldown.
Why is Order size set to one hundred percent if dynamic size is on . The script passes an explicit quantity percent on each entry. That explicit quantity overrides the property. The property is kept at one hundred percent to avoid confusion when users later disable dynamic sizing.
Can I combine this with other tools on my chart . You can, yet for publication the chart is kept clean so users and moderators can see the output clearly. In your private workspace feel free to add other context.
15. Concepts glossary
AAR . Average absolute return across the lookback. Serves as a unit for tails, drift scaling, and stops.
Directional entropy . A measure of uncertainty of up versus down closes. Low entropy paired with a directional sign signals unanimity.
Geometric mean growth . Rate that preserves the effect of compounding over many bars.
Drag . The positive difference between arithmetic pace and geometric growth. Larger drag often signals churn that looks active but fails to compound.
Thermo stops . Stops expressed in the same AAR unit as the signal. They adapt with volatility and keep risk and signal on a common scale.
Adaptive centering . A bias correction that recenters the fused score around neutral so the meter does not drift due to persistent skew.
16. Educational notice and risk statement
Markets involve risk. This publication is for education and research. It does not provide financial advice and it is not a recommendation to buy or sell any instrument. Use realistic costs. Validate ideas with out of sample testing and with conservative position sizing. Past performance never guarantees future results.
17. Final notes for readers and moderators
The goal of this strategy is clarity and portability. Clarity comes from a single score that reflects three independent features of the tape. Portability comes from self scaling units that respect structure across assets and timeframes. The publication keeps the chart clean, explains the math plainly, lists defaults and Properties used, and includes warnings where care is required. The code is protected so the implementation remains consistent for the community while the description remains complete enough for users to understand its purpose and for moderators to evaluate originality and usefulness. If you explore variants, keep them self contained, explain exactly what they contribute, publish in English first, and treat others with respect in the comments.
Load the strategy on BTCUSD daily with the defaults listed above and study how the score transitions across regimes. Then adjust one lever at a time. Observe how the trend channel, the drift channel, and the tail channel interact during starts, pauses, and reversals. Use the alerts as a risk switch inside your own process or let the built in entries and exits run if you prefer an automated study. The intent is not to promise outcomes. The intent is to give you a robust meter for regime strength that travels well across markets and helps you structure decisions with more confidence.
Thank you for your time to read all of this

Twisted Forex's Doji + Area StrategyTitle
Twisted Forex’s Doji + Area Strategy
Description
What this strategy does
This strategy looks for doji candles forming inside or near supply/demand areas . Areas are built from swing pivots and sized with ATR, then tracked for retests (“confirmations”). When a doji prints close to an area and quality checks pass, the strategy places a trade with the stop beyond the doji and a configurable R:R target.
How areas (zones) are built
• Swings are detected with a user-set pivot length.
• Each swing spawns a horizontal area centered at the pivot price with half-height = zoneHalfATR × ATR .
• Duplicates are de-duplicated by center distance (ATR-scaled).
• Areas fade when broken beyond a buffer or after an optional age (expiry).
• Retests are recorded when price touches and then bounces away from the area; repeated reactions increase the zone’s “strength”.
Signal logic (summary)
Doji detection: strict or loose body criteria with optional minimum wick fractions and ATR-scaled minimum range.
Proximity: price must be inside/near a supply or demand area (proxATR × ATR).
Side resolution: overlap is resolved by (a) which side price penetrates more, (b) fast/slow EMA trend, or (c) nearest distance. Optional “previous candle flip” can bias long after a bearish candle and short after a bullish one.
Optional 1-bar confirmation: the bar after the doji must close away from the area by confirmATR × ATR .
Quality filter (Off/Soft/Strict): four checks—(i) wick rejection past the edge, (ii) doji closes in an edge “band” of the area, (iii) fresh touch (cooldown), (iv) approach impulse over a short lookback. In Strict , thresholds auto-tighten.
Orders & exits
• Long: stop below doji low minus buffer; Short: above doji high plus buffer.
• Target = rrMultiple × risk distance .
• Pyramiding is off by default.
Position sizing
You can size from the script or from Strategy Properties:
• Script-driven (default): set Position sizing = “Risk % of equity” and choose riskPercent (e.g., 1.0%). The script applies safe floors/rounding (FX micro-lots by default) so quantity never rounds to zero.
• Properties-driven : toggle Use TV Properties → Order size ON, then pick “Percent of equity” in Properties (e.g., 1%). The header includes safe defaults so trades still place.
Key inputs to explore
• Zone building : pivotLen, zoneHalfATR, minDepartureATR, expiryBars, breakATR, leftBars, dedupeATR.
• Doji & proximity : strictDoji, dojiBodyFrac, minWickFrac, minRangeATR, proxATR, minBarsBetween.
• Overlap resolution : usePenetration, useTrend (EMA 21/55), “previous candle flip”, needNextBarConf & confirmATR.
• Quality : qualityMode (Off/Soft/Strict), minQualPass/kStrict, wickPenATR, edgeBandFrac, approachLookback, approachMinATR, freshTouchBars.
• Zone strength gating : minStrengthSoft / minStrengthStrict.
• HTF confluence (optional) : useHTFTrend (HTF EMA 34/89) and/or useHTFZoneProx (HTF swing bands).
Tips to make it cleaner / higher quality
• Turn needNextBarConf ON and use confirmATR = 0.10–0.15 .
• Increase approachMinATR (e.g., 0.35–0.45) to require a stronger pre-touch impulse.
• Raise minStrengthSoft/Strict (e.g., 4–6) so only well-reacted zones can signal.
• Use signalsOnlyConfirmed ON if you prefer trades only from zones with retests (the script falls back gracefully when none exist yet).
• Nudge proxATR to 0.5–0.6 to demand tighter proximity to the level.
• Optional: enable useHTFTrend to filter counter-trend setups.
Default settings used in this publication
• Initial capital: 100,000 (illustrative).
• Slippage: 1 tick; Commission: 0% (you can raise commission if you prefer—spread is partly modeled by slippage).
• Sizing: Risk % of equity via inputs; riskPercent = 1.0% ; FX uses micro-lot floors by default.
• Quality: Off by default (Soft/Strict available).
• HTF trend gate: Off by default.
Backtesting notes
For a meaningful sample size, test on liquid symbols/timeframes that yield 100+ trades (e.g., majors on 5–15m over 1–2 years). Backtests are modelled and broker costs/spread vary—validate on your feed and forward-test.
How to read the chart
Shaded bands are supply (above) and demand (below). Brighter bands are the nearest K per side (visual aid). BUY/SELL labels mark entries; colored dots show entry/SL/TP levels. You can hide zones or unconfirmed zones for a cleaner view.
Disclaimer
This is educational material, not financial advice. Trading involves risk. Always test and size responsibly.

Hassi XAUUSD Advanced FVG EMA/BOS/RSI/Volume + Session FilterWhat it does :
This strategy automates a popular ICT-style idea on XAUUSD (Gold): trade only when price taps back into a Fair Value Gap (FVG), but filter entries with trend, structure, momentum, volume, and session rules. It manages risk with fixed TP/SL (points) and shows a compact backtest panel on chart.
Core Logic
1) Market Structure (BOS)
Detects recent swing highs/lows and flags a Break of Structure:
BOS Up when price breaks the latest swing high.
BOS Down when price breaks the latest swing low.
2) FVG Detection (3-candle)
Bullish FVG when low > high and low > high .
Bearish FVG when high < low and high < low .
The most recent qualifying gap is drawn as a shaded box (optional).
3) Bias & Filters
Trend Bias: price vs EMA (default 200). Longs only above EMA; shorts only below.
Momentum: optional RSI filter (default 14); avoid longs in OB & shorts in OS.
Volume: optional filter requiring current volume > SMA(20) × multiplier.
Sessions: optional London / New York (PKT) time windows.
Entries & Exits
Long Entry (all must be true)
Above EMA, RSI bullish, volume ok, session ok, BOS Up.
A recent Bullish FVG exists (within N bars).
Price taps back into the FVG (low ≤ top & close > bottom) with a bullish candle.
Short Entry (mirror)
Below EMA, RSI bearish, volume ok, session ok, BOS Down.
A recent Bearish FVG exists (within N bars).
Price taps (high ≥ bottom & close < top) with a bearish candle.
Risk / R:R
Exits use fixed points on XAUUSD (default TP 100, SL 50).
On many gold feeds 1.0 = 10 points; inputs convert to price automatically.
“One-trade-at-a-time”: a new signal won’t fire until the previous position is flat.
Chart Labels
On entry, the script plots BUY/SELL plus fixed TP/SL lines & labels anchored to the entry bar (they don’t drift with price).
Visuals & Tools
EMA line (green/red by bias).
Swing points (tiny triangles) to see structure.
FVG boxes (green/red, optional).
Session shading (subtle blue overlay).
Stats Panel (top-right):
Total Trades, TP Hits, SL Hits, Win Rate, Profit Factor, Net P&L.
Inputs (quick guide)
EMA Length (default 200)
Swing Lookback for BOS (default 5)
FVG Box Length (how far the zone extends to the right)
TP / SL (points) for XAUUSD + display Risk:Reward
Sessions (PKT): London & New York windows + toggle
Filters: Volume (multiplier), RSI (length, OB/OS)
Visibility: show/hide FVG boxes & TP/SL drawings
Alerts
Buy Signal / Sell Signal on valid entries
Position Opened / Position Closed notifications
Best Practices & Notes
Designed for XAUUSD 15-minute. You can test other timeframes, but retune TP/SL points and filters accordingly.
Broker ticks differ: if your symbol steps are not 0.1, adjust TP/SL points.
Use with a HTF confluence (e.g., D1/4H bias, key S/R, news awareness).
Backtests are approximations; real results vary with spreads, slippage, and execution.
Disclaimer: This tool is for educational purposes. It is not financial advice. Always test before using on live capital.

Pro Reversal Strategie - FinalCore Functionality Description
The "Pro Reversal Strategy" script is a comprehensive and highly customizable trading system for TradingView. Its core idea is based on a mean-reversion strategy, which aims to capitalize on price extremes where the price is likely to revert to its statistical mean. This script ist full AI generated. There ist no support and no financial advice.
To identify entry points, the script combines classic indicators like the RSI (to detect overbought and oversold conditions) and Bollinger Bands (to measure volatility extremes).
However, the script's strength lies in its confluence logic: a simple RSI or Bollinger Band signal is not enough to trigger a trade. Instead, a series of filters are applied to enhance the quality of the trade signals. These include:
Trend Filter: Trades are only taken in the direction of the higher-level trend (defined by a 200-period Moving Average).
Volatility and Volume Filter: ADX and volume analysis ensure that the market has sufficient momentum for a move.
Market Structure Analysis: Concepts like Fair Value Gaps (FVG), liquidity zones, and the Volume Profile (VRVP/POC) are used to place trades in high-probability zones.
Momentum Filter: Special "Vector Candles" confirm the strength of buyers or sellers at the moment of the signal.
Furthermore, the script offers advanced features for risk and trade management, including automatic position sizing based on a percentage risk and dynamic exit strategies like a breakeven stop and a trailing stop-loss (Chandelier ATR).
A detailed info panel visualizes all key metrics in real-time directly on the chart. Thanks to its versatile configuration options, the script can be adapted for various trading styles, including swing trading, day trading, and scalping.
Core Strategies & Filters (English)
Here is a breakdown of the specific strategies and confirmation filters used within the script:
RSI Mean Reversion: Uses the Relative Strength Index (RSI) to identify overbought (> rsiSellShort) and oversold (< rsiBuyLong) conditions, which serve as the primary trigger for a potential price reversal.
Bollinger Bands (BB) Volatility Filter: Trades are confirmed when the price touches or exceeds the outer Bollinger Bands. This indicates a move to a statistical extreme in terms of volatility, reinforcing the reversal thesis.
Trend Filter (200 SMA): Ensures that long trades are only considered in a general uptrend (price > SMA 200) and short trades in a downtrend (price < SMA 200), preventing trades against the dominant market direction.
ADX Trend Strength Filter: Utilizes the Average Directional Index (ADX) to confirm that a market is trending with sufficient strength. Trades are filtered out during weak or non-trending phases (adx < adxThreshold).
Volume Profile (VRVP / POC): Analyzes volume at specific price levels to identify high-volume nodes (Point of Control - POC). This acts as a filter to avoid entering trades directly into a zone of strong support or resistance.
Vector Candle Filter: Identifies "Vector Candles" – large, high-volume candles that close strongly near their high (bullish) or low (bearish). This custom filter confirms strong conviction behind the initial reversal signal.
Market Structure (FVG & Liquidity): Incorporates advanced price action concepts. It looks for entries after a liquidity zone above a previous high/low has been tapped (Liquidity Grab) or when price enters a Fair Value Gap (FVG), adding a layer of institutional trading logic.
Chart Pattern Recognition: Optionally identifies classic chart patterns like "W-Patterns" (Double Bottom), "M-Patterns" (Double Top), and Ascending Triangles to provide additional visual confirmation for traders.
Position Sizing (Risk %): Automatically calculates the trade size based on a user-defined percentage of the total equity (riskPct) and the distance to the stop-loss, ensuring consistent risk management for every trade.
Dynamic Exit Management: Implements advanced exit strategies beyond a fixed take-profit. This includes moving the stop-loss to Breakeven after a certain risk-to-reward ratio is met and using a Trailing Stop-Loss (e.g., Chandelier ATR) to lock in profits as a trade develops.

Supertrend Hombrok BotSupertrend Hombrok Bot – Automated Trading Strategy for Dynamic Market Conditions
This trading strategy script has been developed to operate automatically based on detailed market conditions. It combines the popular Supertrend indicator, RSI (Relative Strength Index), Volume, and ATR (Average True Range) to determine the best entry and exit points while maintaining proper risk management.
Key Features:
Supertrend as the Base: Uses the Supertrend indicator to identify the market's trend direction, generating buy signals when the market is in an uptrend and sell signals when in a downtrend.
RSI Filter: The RSI is used to determine overbought and oversold conditions, helping to avoid entries in extreme market conditions. Entries are avoided when RSI > 70 (overbought) and RSI < 30 (oversold), reducing the risk of false movements.
Volume Filter: The strategy checks if the trading volume is above the average multiplied by a user-defined factor. This ensures that only significant movements, with higher liquidity, are considered.
Candle Body Size: The strategy filters only candles with a body large enough relative to the ATR (Average True Range), ensuring that the price movements on the chart have sufficient strength.
Risk Management: The bot is configured to operate with an adjustable Risk/Reward Ratio (R:R). This means that for each trade, both Take Profit (TP) and Stop Loss (SL) are adjusted based on the market's volatility as measured by the ATR.
Automatic Entries and Exits: The script automatically executes entries based on the specified conditions and exits with predefined Stop Loss and Take Profit levels, ensuring risk is controlled for each trade.
How It Works:
Buy Condition: Triggered when the market is in an uptrend (Supertrend), the volume is above the adjusted average, the candle body is strong enough, and the RSI is below the overbought level.
Sell Condition: Triggered when the market is in a downtrend (Supertrend), the volume is above the adjusted average, the candle body is strong enough, and the RSI is above the oversold level.
Alerts:
Buy and Sell Alerts are configured with detailed information, including Stop Loss and Take Profit values, allowing the user to receive notifications when trading conditions are met.
Capital Management:
The capital per trade can be adjusted based on account size and risk profile.
Important Note:
Always test before trading with real capital: While the strategy has been designed based on solid technical analysis methods, always perform tests in real-time market conditions with demo accounts before applying the bot in live trading.
Disclaimer: This script is a tool to assist in the trading process and does not guarantee profit. Past performance is not indicative of future results, and the trader is always responsible for their investment decisions.

Box Chart Overlay StrategyExploring the Box Chart Overlay Strategy with RSI & Bollinger Confirmation
The “Box Chart Overlay Strategy by BD” is a sophisticated TradingView strategy script written in Pine Script (version 5). It combines a box charting method with two widely used technical indicators—Relative Strength Index (RSI) and Bollinger Bands—to generate trade entries. In this article, we break down the strategy’s components, its logic, and how it visually represents trading signals on the chart.
1. Strategy Setup and User Inputs
Strategy Declaration
At the top of the script, the strategy is declared with key parameters:
Overlay: The indicator is plotted directly on the price chart.
Initial Capital & Position Sizing: It uses a simulated trading account with an initial capital of 10,000 and positions sized as a percentage of equity (10% by default).
Commission: A commission of 0.1% is factored into trades.
Input Parameters
The strategy is highly customizable. Users can adjust various inputs such as:
Box Settings:
Box Size (RSboxSize): Defines the size of each price “box.”
Box Options: Choose from three modes:
Standard: Boxes are calculated continuously from the start of the chart.
Anchored: The first box is fixed at a specified time and price.
Daily Reset: The boxes reset each day based on a defined session time.
Color Customizations:
Options to customize the appearance of boxes, borders, labels, and even repainting the candles based on the current price’s relation to box levels.
RSI Settings:
Length, overbought, and oversold levels are set to filter trades.
Bollinger Bands Settings:
Users can set the length of the moving average and the multiplier for standard deviation, which will be used to compute the upper and lower bands.
2. The Box Chart Mechanism
Box Construction
The core idea of a box chart is to group price movement into discrete blocks—or boxes—of a fixed size. In this strategy:
Standard Mode:
The script calculates boxes starting at a rounded price level. When the price moves sufficiently above or below the current box’s boundaries, a new box is drawn.
Anchored and Daily Reset Modes:
These modes allow traders to control where the box calculations begin or to reset them during a specific intraday session.
Visual Elements
Several custom functions handle the visual components:
drawBoxUp() and drawBoxDn():
These functions create boxes in bullish or bearish directions respectively, based on whether the price has exceeded the current box’s high or low.
drawLines() and drawLabels():
Lines are drawn to extend the current box levels, and labels are updated to display key levels or the “remainder” (the difference needed to trigger a new box).
Projected Boxes:
A “projected” box is drawn to indicate potential upcoming box levels, providing an additional visual cue about the price action.
3. Integrating RSI and Bollinger Bands for Trade Confirmation
RSI Integration
The strategy computes the RSI using a user-defined length. It then uses the following conditions to validate entries:
Long Trades (Box Up):
The strategy waits for the RSI to be at or below the oversold level before considering a long entry.
Short Trades (Box Down):
It requires the RSI to be at or above the overbought level before triggering a short entry.
Bollinger Bands Confirmation
In addition to the RSI filter:
For Long Entries:
The price must be at or below the lower Bollinger Band.
For Short Entries:
The price must be at or above the upper Bollinger Band.
By combining these filters with the box breakout logic, the strategy aims to enhance the quality of its trade signals.
4. Dynamic Trade Entries and Alerts
Box Logic and Entry Functions
Two key functions—BoxUpFunc() and BoxDownFunc()—handle the creation of new boxes and also check if trade conditions are met:
When a new box is drawn, the script evaluates if the RSI and Bollinger conditions align.
If conditions are satisfied, the script places an entry order:
Long Entry: Initiated when the price moves upward, RSI indicates oversold, and the price touches or falls below the lower Bollinger Band.
Short Entry: Triggered when the price falls downward, RSI signals overbought, and the price touches or exceeds the upper Bollinger Band.
Alerts
Built-in alert functions notify traders when a new box level is reached. Users can set custom alert messages to ensure they are aware of potential trade opportunities as soon as the conditions are met.
5. Visual Enhancements and Candle Repainting
The script also includes options for repainting candles based on their relation to the current box’s boundaries:
Above, Below, or Within the Box:
Candles are color-coded using user-defined colors, making it easier to visually assess where the price is in relation to the box levels.
Labels and Lines:
These continuously update to reflect current levels and provide an immediate visual reference for potential breakout points.
Conclusion
The Box Chart Overlay Strategy by BD is a multi-faceted approach that marries the traditional box chart technique with modern technical indicators—RSI and Bollinger Bands—to refine entry signals. By offering various customization options for box creation, visual styling, and confirmation criteria, the strategy allows traders to adapt it to different market conditions and personal trading styles. Whether you prefer a continuously running “Standard” mode or a more controlled “Anchored” or “Daily Reset” approach, this strategy provides a robust framework for integrating price action with momentum and volatility measures.

Gap Down Reversal Strategy█ STRATEGY OVERVIEW
The "Gap Down Reversal Strategy" capitalizes on price recovery patterns following bearish gap-down openings. This mean-reversion approach enters long positions on confirmed intraday recoveries and exits when prices breach previous session highs. This strategy is NOT optimized.
█ What is a Gap Down Reversal?
A gap down reversal occurs when:
An instrument opens significantly below its prior session's low (price gap)
Selling pressure exhausts itself during the session
Buyers regain control, pushing price back above the opening level
Creates a candlestick with:
• Open < Prior Session Low (true gap)
• Close > Open (bullish reversal candle)
█ SIGNAL GENERATION
1. LONG ENTRY CONDITION
Previous candle closes BELOW its opening price (bearish candle)
Current session opens BELOW prior candle's low (gap down)
Current candle closes ABOVE its opening price (bullish reversal)
Executes market order at session close
2. EXIT CONDITION
A Sell Signal is generated when the current closing price exceeds the highest high of the previous seven bars (`close > _highest `). This indicates that the price has shown strength, potentially confirming the reversal and prompting the strategy to exit the position.
█ PERFORMANCE OVERVIEW
Ideal Market: High volatility instruments with frequent gaps
Key Risk: False reversals in sustained downtrends
Optimization Tip: Test varying gap thresholds (1-3% ranges)

Optimized Engulfing StrategyOptimized Engulfing Strategy
The Optimized Engulfing Strategy is a trend-following system designed to capitalize on bullish and bearish engulfing patterns in the market. It uses a combination of price action, trend direction, and volatility-based risk management to execute high-probability trades.
Key Components:
Bullish Engulfing Pattern:
A bullish engulfing candle is identified when:
The current candle closes above its open (bullish).
The previous candle closes below its open (bearish).
The current candle's close is higher than the previous candle's open.
The current candle's open is lower than the previous candle's close.
This pattern signals potential bullish momentum.
Bearish Engulfing Pattern:
A bearish engulfing candle is identified when:
The current candle closes below its open (bearish).
The previous candle closes above its open (bullish).
The current candle's close is lower than the previous candle's open.
The current candle's open is higher than the previous candle's close.
This pattern signals potential bearish momentum.
Trend Confirmation:
Trades are only taken in the direction of the trend:
Buy: When the 50-period SMA (simple moving average) is above the 200-period SMA, indicating an uptrend.
Sell: When the 50-period SMA is below the 200-period SMA, indicating a downtrend.
Risk Management:
Stop Loss: Placed below the low of the engulfing candle (for buys) or above the high (for sells), with an additional buffer based on the ATR (Average True Range) multiplied by a user-defined factor (default: 1.5).
Take Profit: Calculated using a fixed risk-to-reward ratio (default: 1:2), ensuring a potential reward that is double the risk.
Session Filtering:
Trades can be limited to specific trading hours using a customizable session filter (default: 24 hours).
Trade Execution:
Separate logic is implemented for buy and sell trades, allowing independent toggling of long or short positions via user inputs.
Visualization:
Bullish and bearish engulfing candles are highlighted on the chart for clarity.
The ATR value is displayed in the top-right corner of the chart for reference.
How It Works:
Identify a bullish or bearish engulfing pattern.
Confirm the direction of the trend using the 50 SMA and 200 SMA.
Ensure the market is within the allowed session filter (e.g., London or New York sessions).
Enter a trade if all conditions are met:
Long trades for bullish engulfing patterns in an uptrend.
Short trades for bearish engulfing patterns in a downtrend.
Manage the trade using a stop loss and take profit based on ATR and the risk-reward ratio.

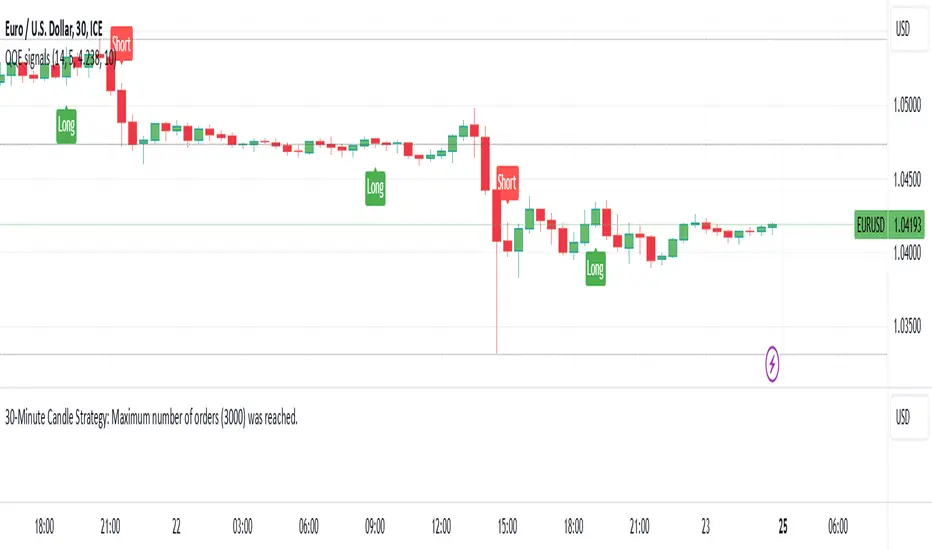
30-Minute Candle Strategy30-Minute Candle Trading Strategy
This strategy works on a 30-minute candle timeframe. When a new 30-minute candle opens, the following actions will take place based on the previous 30-minute candle's closing price:
Buy Trade Setup:
If the market opens above the previous 30-minute candle's closing price, a buy trade will be executed immediately at the market price.
The stop-loss will be set at the previous 30-minute candle's closing price.
There will be no fixed target.
The trade will be closed 1 minute before the current 30-minute candle closes, regardless of profit or loss.
Sell Trade Setup:
If a buy trade hits the stop-loss and the market moves below the previous 30-minute candle's closing price, a sell trade will be executed immediately at the market price.
The stop-loss for the sell trade will also be set at the previous 30-minute candle's closing price.
There will be no fixed target.
The trade will be closed 1 minute before the current 30-minute candle closes, regardless of profit or loss.
Procedure:
This process will repeat for every 30-minute candle.
If the market crosses the previous 30-minute candle's closing price to the upside, a buy trade will be executed, and the stop-loss will be set at the previous candle's closing price.
If the market crosses the previous 30-minute candle's closing price to the downside, a sell trade will be executed, and the stop-loss will also be set at the previous candle's closing price.
Each trade will be closed 1 minute before the current candle closes.
Key Points:
This strategy applies to every new 30-minute candle.
The stop-loss will always be based on the previous 30-minute candle's closing price.
If a stop-loss is hit, the strategy will automatically switch to the opposite trade (buy to sell or sell to buy) based on market movement crossing the previous candle's closing price.
This is a repetitive and systematic approach to trading, ensuring the rules are followed for every 30-minute candle.
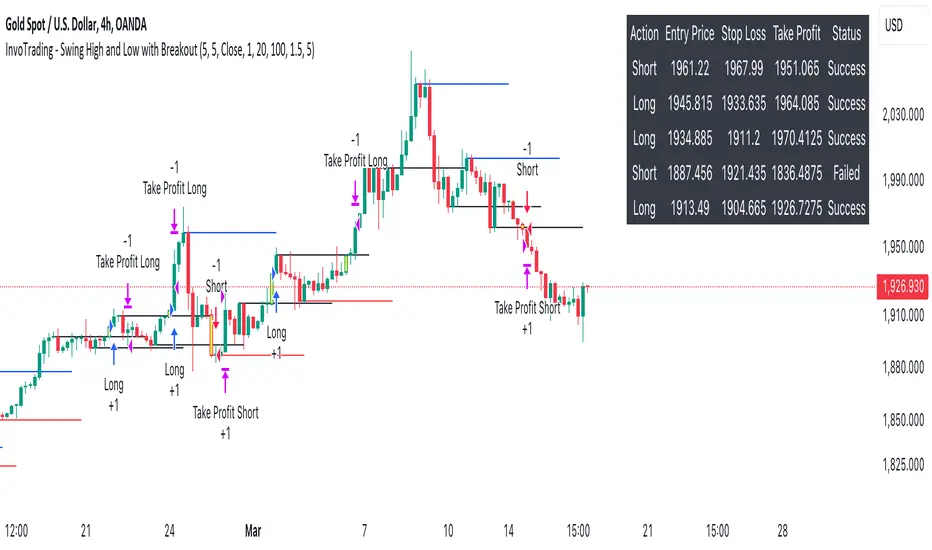
InvoTrading - Swing High and Low with BreakoutInvoTrading - Swing High and Low with Breakout Strategy
This strategy is designed to identify trading opportunities based on swing highs and lows, combined with breakout confirmations. It utilizes pivot points to detect potential reversal levels and initiates trades when the price breaks out of these levels under specific conditions.
Key Features:
- Pivot Points: The strategy calculates pivot highs and lows using customizable left and right bars. These pivots represent potential swing points in the market.
- Breakout Detection: It monitors for breakouts above pivot highs (Bullish Break of Structure - BOS) and below pivot lows (Bearish Break of Structure).
- Strong Swings (Optional): You can enable "Strong Swing" detection, which considers only those pivots where the price attempted but failed to break the pivot level, indicating stronger support or resistance.
- Trade Management: The strategy sets entry points, stop losses, and take profits based on a customizable risk-reward ratio.
- Trade Table: An optional table displays recent trades, including their status (Pending, Success, or Failed).
- Visual Aids: Customizable colors and line settings help visualize pivot points, strong swings, and breakout candles on the chart.
---
Settings:
1. Pivot Settings:
- Left Bars: Number of bars to the left of the pivot point (default: 5).
- Right Bars: Number of bars to the right of the pivot point (default: 5).
- Pivot Based On: Choose between "High/Low" or "Close" prices for pivot calculations.
2. Color Settings:
- Pivot High Color: Color for Pivot High markers (default: Blue).
- Pivot Low Color: Color for Pivot Low markers (default: Red).
- Strong Swing High Color: Color for Strong Swing High markers (default: Black).
- Strong Swing Low Color: Color for Strong Swing Low markers (default: Black).
- Breakout Candle Color (BOS): Color for the breakout candle (default: Yellow).
3. Line Settings:
- Line Width: Width of the pivot lines (default: 1).
- Line Length (Bars): Length of the pivot lines in bars (default: 20).
- Maximum Number of Lines to Keep: Limits the number of pivot lines displayed to avoid clutter (default: 100).
4. Trade Settings:
- Enable Buy and Sell Signals: Activates trade entries and exits on the chart (default: False).
- Show Trades Table: Displays a table summarizing recent trades (default: False).
- Risk-Reward Ratio: Sets the desired risk-reward ratio for trades (default: 1.5).
- Number of Trades to Display: Maximum number of recent trades shown in the table (default: 5).
- Enable Strong Trade: Only triggers trades when a "Strong Swing" is detected (default: False).
---
How It Works:
- Pivot Detection: The script identifies pivot highs and lows based on the specified number of left and right bars.
- Strong Swings: If enabled, the strategy marks a pivot as a strong swing if the price attempts to break it but closes back within the pivot level.
- Breakout Confirmation:
- Long Entry: Occurs when the price closes above a pivot high, signaling a bullish breakout. If "Strong Trade" is enabled, it must be a strong swing high.
- Short Entry: Occurs when the price closes below a pivot low, signaling a bearish breakout. If "Strong Trade" is enabled, it must be a strong swing low.
- Trade Execution: Upon a valid breakout, the strategy places a trade with a stop loss set at the previous candle's low (for longs) or high (for shorts). The take profit is calculated based on the specified risk-reward ratio.
- Trade Monitoring: The strategy updates the status of each trade (Pending, Success, Failed) based on whether the take profit or stop loss is hit.
- Visualization: Breakout candles are highlighted, and pivot lines are drawn with customizable colors and widths. Strong swings are marked distinctly.
---
Usage Tips:
- Backtesting: Before using this strategy live, backtest it on different time frames and instruments to assess its performance.
- Customization: Adjust the pivot settings and risk-reward ratio to match your trading style and the volatility of the instrument you're trading.
- Risk Management: Always use proper risk management techniques, even though the strategy calculates stop losses and take profits.
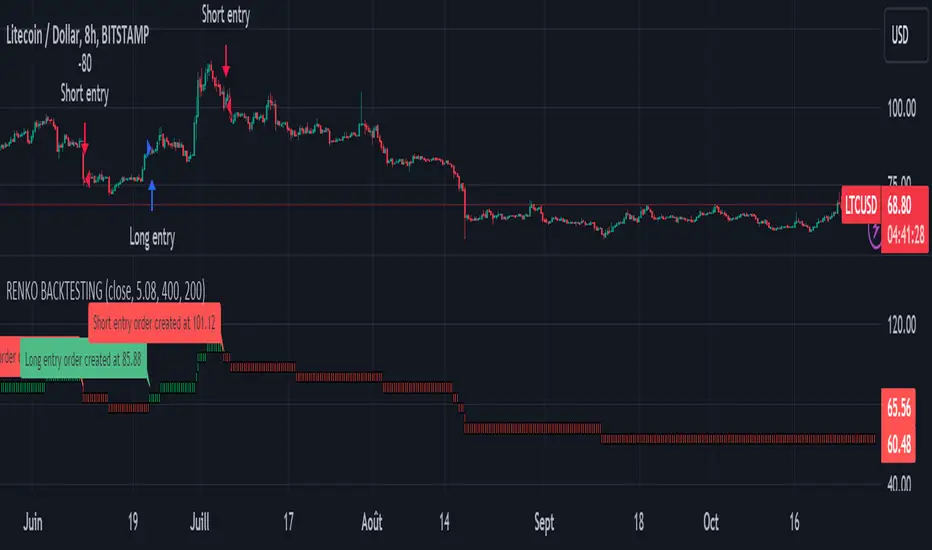
Renko StrategyRENKO STRATEGY
CAUTION : This strategy must be applied to a candlestick chart (not a Renko chart).
INTRODUCTION :
The Traditional Renko chart has been reproduced and is plotted according to the evolution of the price. It will enable us to receive buy or sell signals and follow major trends. This is a medium/long term strategy and depends a lot on the box size chosen in the parameters. There's also a money management method allowing us to reinvest part of the profits or reduce the size of orders in the event of substantial losses.
RENKO CHART :
Renko chart construction methodology :
The user must first choose the box size. The minimum is 0.00001 and there is no maximum. The default is 10. The user must then choose the source that will define the data on which the calculations will be based (high, low, open, close). By default, close is selected. The first candle on the chart is used to draw the first box with its high and low.
Each time the price changes by the amount of the box size relative to the high or low of the last box, a new box is added above or below the previous one. If price variations are less than the box size, the same box is added next to the previous one. If price variations are N (integer number) times greater than box size, N boxes are added above or below the previous one. Each box added above the previous one is a green box, while each box added below the previous one is a red box.
Conditions for drawing a green box above the previous one :
(source - high_of_the_last_box) / box_size > 1
Condition for drawing a red box below the previous one :
(low_of_the_last_box - source) / box_size > 1
If neither condition is triggered, the same box is drawn next to the previous one.
Example :
The last candle has drawn a box with low 12 and high 14. The box size is therefore 2. The strategy will look at the value of the close each time a candle ends. The current candle closes with a close equal to 15.5. As the variation from the previous high is only 1.5 (which is less than the box size), the same box is added next to the previous one. The next candle closes at 16.2. The price variation is therefore 2.2 compared with the previous high. We can now add a new green box just above the previous one, with a low of 14 and a high of 16. The same process applies if the candle's close is at least one box size below the low of the last box. In this case, a new red box is placed below the previous one.
PARAMETERS :
Source : Allows you to specify which data will be taken into account by the strategy when performing calculations. The default is close.
Box size : Size of Renko graph boxes. This is a very important parameter to choose carefully, as it has a strong impact on the strategy's performance. Defaults to 10.
Fixed Ratio : This is the amount of gain or loss at which the order quantity is changed. The default is 400, meaning that for each $400 gain or loss, the order size is increased or decreased by a user-selected amount.
Increasing Order Amount : This is the amount to be added to or subtracted from orders when the fixed ratio is reached. The default is $200, which means that for every $400 gain, $200 is reinvested in the strategy. On the other hand, for every $400 loss, the order size is reduced by $200.
Initial capital : $1000
Fees : Interactive Broker fees apply to this strategy. They are set at 0.18% of the trade value.
Slippage : 3 ticks or $0.03 per trade. Corresponds to the latency time between the moment the signal is received and the moment the order is executed by the broker.
Important : A bot has been used to test all possible box sizes to find out which one generates the highest return on BITSTAMP:LTCUSD while limiting the drawdown. This strategy is the most optimal with a box size equal to 5.08 in 8h timeframe.
BUY AND SHORT SIGNALS :
As the aim of this strategy is to follow major trends based on price movements, we need to be on the right side of price fluctuation. We trade every box reversal, i.e. we are LONG when the boxes are green indicating an uptrend and SHORT when they are red indicating a downtrend.
RISK MANAGEMENT :
This strategy can incur losses. The size of the box is decisive, as it is used to plot the RENKO chart and thus trigger buy or sell signals. It's also what allows us to manage risk. For every trade, we risk a maximum amount equal to 2 times the size of the box, i.e. :(5.08*2*nb_contract)/trade_value.
MONEY MANAGEMENT :
The fixed ratio method has been used to manage our gains and losses. For each gain of an amount equal to the value of the fixed ratio, we increase the order size by a value defined by the user in the "Increasing order amount" parameter. Similarly, each time we lose an amount equal to the value of the fixed ratio, we decrease the order size by the same user-defined value. This strategy not only increases our performance, but also our drawdown.
Enjoy the strategy and don't forget to take the trade :)
CONSOLIDATION BAND BREAKOUT [5MIN TF]CONSOLIDTION BREAKOUT STRATEGY for 5 minute Time-Frame , that has the time condition adjustable for Indian Markets.
// ══════════════════════════════════════════════════════════════════════════ //
Unlike the Free Scripts - Risk Management , Position Sizing , Partial Exit etc. are also included .
Message to know more about the strategy.
// ══════════════════════════════════════════════════════════════════════════ //
The Timing can be changed to fit other markets, scroll down to "TIME CONDITION" to know more.
The commission is also included in the strategy .
The basic idea is when ,
1) Price crosses above upper Level ,indicated by Red Line, is a Long condition .
2) Price crosses below lower Level ,indicated by Green Line , is a Short condition .
3) Candle close crosses above ema1 , is a part of the Long condition .
4) Candle close crosses below ema1 , is a part of the Short condition .
5) Allowed hours specifies the trade entry timing.
6) ATR STOP is the stop-loss value on chart , can be adjusted in INPUTS.
7) Target 1 is the 1st target value on chart , can be adjusted in INPUTS.
8) RISK is Maximum Risk per trade for the intraday trade can be changed .
9) Total Capital used can be adjusted under INPUTS.
10) ATR TRAIL is used for trailing after entry, as mentioned in the inputs below.
11) Check trades under the list of trades .
12) Trade only in liquid stocks .
13) Risk only 1-5% of total capital.
14) Inputs can be changed for better back-test results, but also manually check the trades before setting alerts
15) SQUARE OFF TIME - As you change the time frame , also change the square-off time to that candle's closing time.
Eg: For 3min Time-frame , Hour = 2Hrs | Minute = 57min
16) Strategy stops for the day if you have a loss .
*The input values and the results are mentioned under "BACKTEST RESULTS" below*
// ══════════════════════════════ //
// ————————> RISK MANAGEMENT <——————— //
// ══════════════════════════════ //
Risk management is done based on max loss per trade and can be adjusted in the INPUTS.
// ═══════════════════════════ //
// ————————> POSITION SIZE <——————— //
// ═══════════════════════════ //
Quantity of each trade is different based on the loss
// ═════════════════════════ //
// ————————> PROPERTIES <——————— //
// ═════════════════════════ //
COMMISSION , SLIPPAGE ,RECALCULATE is already mentioned .
COMMISSION can be charges , based on the broker charges.
// ═══════════════════════════════//
// ————————> TIME CONDITION <————————— //
// ═══════════════════════════════//
The time can be changed in the INPUT.
The Indian Markets open at 9:15am and closes at 3:30pm.
The 'Allowed hours' under Inputs specifies the time at which Entries should happen .
"Close All" function closes all the trades before 3pm , at the open of the next candle.
To change the time to close all trades , check INPUT.
All open trades get closed at 3pm , because some brokers don't allow you to place fresh intraday orders after 3pm .
// ═══════════════════════════════════════════════ //
// ————————> BACKTEST RESULTS ( 123 CLOSED TRADES )<————————— //
// ═══════════════════════════════════════════════ //
INPUTS can be changed for better Back-Test results.
The strategy applied to NSE:TCS (5 min Time-Frame and with a capital of 1,00,000 ) gives us 77% profitability , as shown below
It was tested for a period a 1 year with a Profit Factor of 2.143 ,net Profit of 10,886 Rs .
The Initial Capital and Risk can be increased for better results.
The graph has a Linear Curve with Consistent Profits.
The INPUTS are as follows,
1) LENGTH ——————————————> 79
2) MUT_STDEV ————————————> 2.3
3) ALLOWED HRS ———————————> 9:25 TO 14:30
4) ATR STOP ——————————————> 2.2
5) RISK ——————————————————> 400
6) ATR TRAIL ———————————————> 2.6
7) TARGET 1 ————————————————> 2.1
8) MAX POSITION VALUE ——————————> 1,00,000
8) MAX DRAWDOWN —————————————> 2,000
8) SQUARE-OFF ————————————————> 14:55
NSE:TCS
Apply it to your charts Now !!
Send us a message to know more about this strategy
Thank You ☺ NSE:TCS

SeaSide420 StrategyThis Strategy by SeaSide420 uses IchiMoku, Engulfing candles and 3 moving averages to find entry to buy and sell orders. It will hold buys and sells at the same time, it will close orders by StopLoss, or Trailing StopLoss or Target Profit. In the example chart here, only the trailing stop is active. It does have commission already included in this result. The initial test equity is set to 1 (1 BTC) so if you use this on say, a FOREX pair, you might want to check your settings, for example, set the initial equity to 100,000 USD as it normally is. I set this to 1 BTC to show that Holding 1 BTC for 2 years would not be as profitable as trading 1 BTC with this strategy for 2 years. The commission level is the same as Binance (0.1%), and the example pair is a Binance instrument, where Bitcoin trades can be in and out this way (CFD). Here it is shown on Daily chart, and with other timeframes/pairs, you may need to adjust the settings (MA period etc). New settings are achieved by you testing them yourself. This is published as an experimental script for use through API to do Automated trading on crypto exchanges. Questions welcome. Strategy free to use, Script private (PM me about it) I have not tested the alerts, but i did include alerts when open and close orders. Let me know if it works or not.

Series of Heikin ashi candle strategySeries of Heikin ashi candle strategy, idea and rules:
After 2 consecutive heikin ashi candles of same color, place a buy stop order at high of last candle if green or a sell stop order at low of last candle if red.
Strategy follows the open order with trailing stop.
Use on charts with heikin ashi candles.
Good on lower timeframes and scalping.
Please use comment section for any feedback.
Next improvment (only to who is interested to this script and follows me): study with alerts. Leave a comment if you want to have access to study.
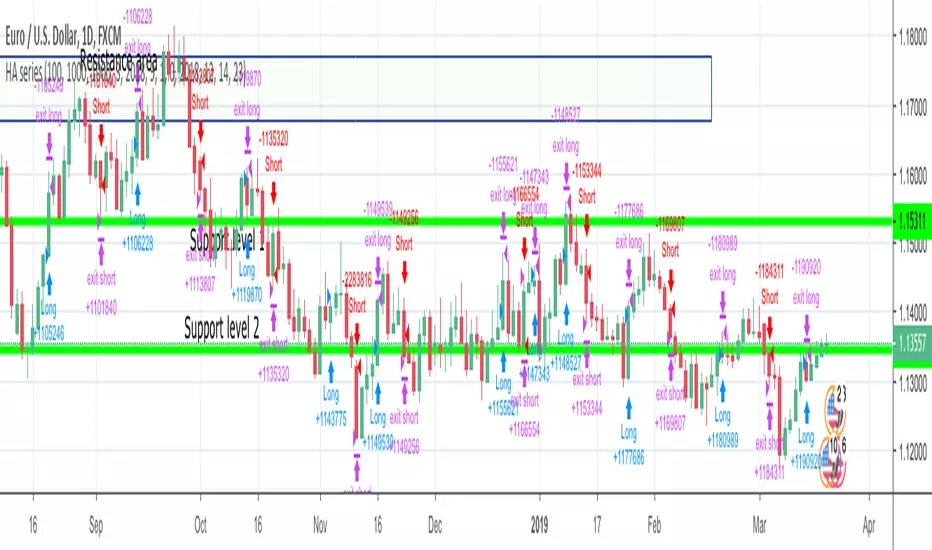
LevelTradeV2. Indicator give to us min. and max. levels This indicator is designed to work on short-term and long-term periods.
It provides levels of resistance and support for the two options.
1) purple levels - minimum and maximum price for the shadows of candles.
2) red and green levels - over the body of a candle.
added a moving average and a profit calculator fully customizable.

Fibonacci Vision ProFibonacci Precision Signals Pro | Smart Buy & Sell Alerts
━━━━━━━━━━━━━━━━━━━━━━━━━━━━━━━━━━━━━━━━━━━━━━━━━━━━
OVERVIEW
This indicator combines Fibonacci mathematics with advanced signal filtering to deliver precise buy and sell signals. It automatically detects swing structure, calculates the key 0.618 retracement level, and generates signals only when multiple confirmation factors align.
Clean. Accurate. Professional.
━━━━━━━━━━━━━━━━━━━━━━━━━━━━━━━━━━━━━━━━━━━━━━━━━━━━
HOW IT WORKS
The script identifies swing highs and lows, then calculates Fibonacci retracement levels automatically. When price interacts with the 0.618 zone and all filters confirm, a signal appears:
▲ buy — Long entry opportunity
▼ sell — Short entry opportunity
━━━━━━━━━━━━━━━━━━━━━━━━━━━━━━━━━━━━━━━━━━━━━━━━━━━━
6-LAYER CONFIRMATION SYSTEM
Every signal must pass through:
Trend Direction Analysis
Fibonacci Level Interaction
EMA Trend Filter (50-period default)
RSI Momentum Validation (14-period default)
Volume Spike Detection
Candlestick Pattern Recognition (Pin bars, Engulfing, Momentum candles)
This multi-layer approach significantly reduces false signals.
━━━━━━━━━━━━━━━━━━━━━━━━━━━━━━━━━━━━━━━━━━━━━━━━━━━━
BUILT-IN RISK MANAGEMENT
Every trade includes automatic stop loss and take profit levels:
Stop Loss: 100 pips
Take Profit: 200 pips
Risk-Reward Ratio: 1:2
Adjust these values in settings to match your trading style.
━━━━━━━━━━━━━━━━━━━━━━━━━━━━━━━━━━━━━━━━━━━━━━━━━━━━
KEY FEATURES
✅ Automatic Fibonacci calculation — no manual drawing
✅ Multi-timeframe compatibility — M15 to Daily
✅ Universal market support — Forex, Crypto, Stocks, Indices
✅ Clean minimalist signals — white triangles with text
✅ Customizable filters — adjust sensitivity to your preference
✅ Built-in alerts — never miss a signal
✅ No repainting — signals remain fixed once confirmed
━━━━━━━━━━━━━━━━━━━━━━━━━━━━━━━━━━━━━━━━━━━━━━━━━━━━
Swing Detection:
Swing Length — Controls sensitivity to market structure (default: 10)
Confirmation Bars — Bars required to confirm signal (default: 1)
Signal Filters:
EMA Trend Filter — Toggle trend confirmation on/off
EMA Length — Adjust trend filter period (default: 50)
RSI Filter — Toggle momentum confirmation on/off
RSI Length — Adjust momentum period (default: 14)
Volume Filter — Toggle volume confirmation on/off
Volume Multiplier — Set volume threshold (default: 1.2x average)
Risk Management:
Stop Loss Pips — Set your stop loss distance (default: 100)
Take Profit Pips — Set your profit target (default: 200)
Pip Value — Adjust for your instrument (0.0001 for most Forex, 0.01 for JPY pairs)
Visuals:
Show Signals — Toggle signal visibility
Show Cloud — Toggle Fibonacci zone visibility
━━━━━━━━━━━━━━━━━━━━━━━━━━━━━━━━━━━━━━━━━━━━━━━━━━━━
BEST PRACTICES
Use on H1 or H4 timeframes for optimal results
Trade in direction of the higher timeframe trend
Avoid trading during major news events
Combine with proper position sizing
Always use the built-in stop loss
Be patient — quality signals over quantity
━━━━━━━━━━━━━━━━━━━━━━━━━━━━━━━━━━━━━━━━━━━━━━━━━━━━
MARKETS SUPPORTED
Forex — All major, minor, and exotic pairs
Crypto — BTC, ETH, and altcoins
Stocks — Any equity on TradingView
Indices — S&P500, NASDAQ, DAX, FTSE, etc.
Commodities — Gold, Silver, Oil, etc.
━━━━━━━━━━━━━━━━━━━━━━━━━━━━━━━━━━━━━━━━━━━━━━━━━━━━
WHY FIBONACCI?
The 0.618 ratio (Golden Ratio) is observed by traders worldwide. When price retraces to this level, it often:
Reverses direction
Finds support or resistance
Creates high-probability entry opportunities
This script automates the detection of these key moments.
━━━━━━━━━━━━━━━━━━━━━━━━━━━━━━━━━━━━━━━━━━━━━━━━━━━━
ALERTS INCLUDED
Set up notifications to receive signals on:
Mobile push notifications
Desktop popups
Email alerts
Webhook integrations
Never miss a trading opportunity again.
━━━━━━━━━━━━━━━━━━━━━━━━━━━━━━━━━━━━━━━━━━━━━━━━━━━━
WHAT MAKES THIS DIFFERENT
Most indicators give too many signals. This one focuses on quality.
Most indicators clutter your chart. This one keeps it clean.
Most indicators ignore risk management. This one includes it.
Most indicators work on one market. This one works on all.
━━━━━━━━━━━━━━━━━━━━━━━━━━━━━━━━━━━━━━━━━━━━━━━━━━━━
DISCLAIMER
This indicator is a trading tool, not financial advice. Trading involves substantial risk of loss. Past performance does not guarantee future results. Always use proper risk management and never trade with money you cannot afford to lose. Test on a demo account before trading live.

Fractional Candlestick Long Only Experimental V10Fractional Candlestick Long-Only Strategy – Technical Description
This document provides a professional English description of the "Fractional Candlestick Long Only Experimental V6" strategy using pure CF/AB fractional kernels and wavelet-based filtering.
1. Fractional Candlesticks (CF / AB)
The strategy computes two fractional representations of price using Caputo–Fabrizio (CF) and Atangana–Baleanu (AB) kernels. These provide long-memory filtering without EMA approximations. Both CF and AB versions are applied to O/H/L/C, producing fractional candlesticks and fractional Heikin-Ashi variants.
2. Trend Stack Logic
Trend confirmation is based on a 4-component stack:
- CF close > AB close
- HA_CF close > HA_AB close
- HA_CF bullish
- HA_AB bullish
The user selects how many components must align (4, 3, or any 2).
3. Wavelet Filtering
A wavelet transform (Haar, Daubechies-4, Mexican Hat) is applied to a chosen source (e.g., HA_CF close). The wavelet response is used as:
- entry filter (4 modes)
- exit filter (4 modes)
Wavelet modes: off, confirm, wavelet-only, block adverse signals.
4. Trailing System
Trailing stop uses fractional AB low × buffer, providing long-memory dynamic trailing behavior. A fractional trend channel (CF/AB lows vs HA highs) is also plotted.
5. Exit Framework
Exit options include: stack flip, CF

Fincandle ATR Direction TrackerOverview
The Fincandle ATR Direction Tracker is a strategy designed to capture momentum moves in the market using a dynamic ATR-based trailing stop. It identifies strong momentum candles and filters signals using trend alignment with moving averages.
Partial exits allow users to take a portion of profit at a predefined ATR multiple while keeping the remaining position open until the opposite signal occurs.
How It Works
Momentum Detection:
Measures candle body size relative to the Average True Range (ATR).
A candle is considered momentum if its body size exceeds ATR × Multiplier.
Trend Filter:
Uses two moving averages (Fast MA and Slow MA) to determine the market trend.
Bullish trend: Fast MA > Slow MA → long trades allowed
Bearish trend: Fast MA < Slow MA → short trades allowed
Trend filter can be toggled on or off.
ATR Trailing Stop:
A dynamic trailing stop adapts to price volatility.
Crossing above the trail triggers a buy signal, crossing below triggers a sell signal.
Partial Exit / Take Profit:
Step 1: Exit 50% of the position when price moves a configurable multiple of ATR in your favor.
Step 2: Close the remaining position when the opposite signal occurs (e.g., price crosses below/above the ATR trail).
How to Use
Add the strategy to any chart (stocks, indices, forex, crypto).
Configure ATR period, sensitivity, take profit multiple, and moving average lengths to suit the timeframe and asset.
Monitor buy/sell markers and dynamic ATR trail on the chart.
Optional: Set alerts for real-time notifications when signals trigger.
Adjust partial exit multiplier to control risk/reward.
Example Settings
ATR Period: 10
ATR Sensitivity: 3 × ATR
Take Profit: 2 × ATR
Fast MA: 50
Slow MA: 200
Partial Exit: 50% of position at take profit, remaining exits on opposite signal
Key Features
Adaptive ATR trailing stop for volatility-based entries/exits.
Trend alignment filter with Fast/Slow MA.
Partial exit logic for better risk management.
Visual BUY/SELL markers and alerts.
Fully Pine Script v6 compatible.
Disclaimer
This strategy is for educational and analytical purposes only.
It does not guarantee profits. Traders should always use proper risk management.
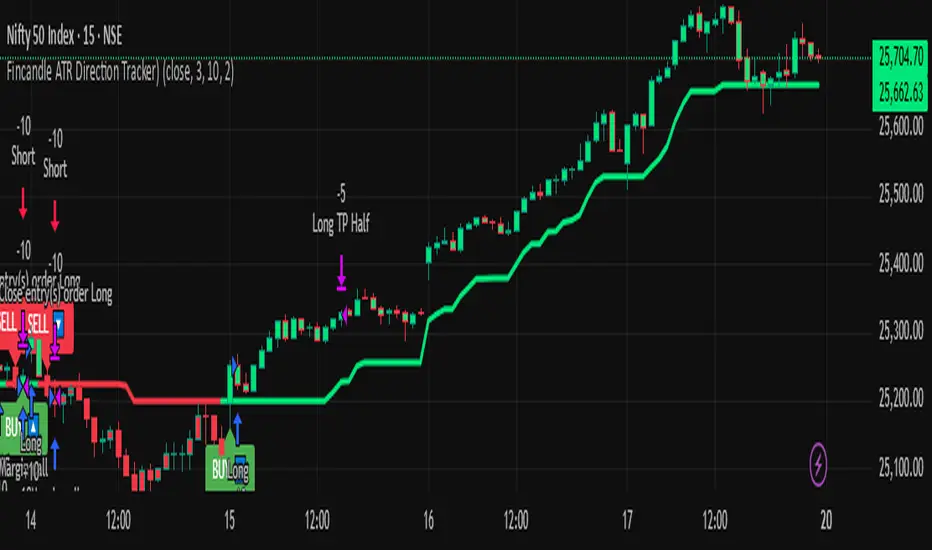
Bearish Wick Reversal█ STRATEGY OVERVIEW
The "Bearish Wick Reversal Strategy" identifies potential bullish reversals following significant bearish price rejection (long lower wicks). This counter-trend approach enters long positions when bearish candles show exaggerated downside wicks relative to closing prices, then exits on bullish confirmation signals. Includes optional EMA trend filtering for improved reliability.
█ What is a Bearish Wick?
A price rejection pattern where:
Bearish candle (close < open) forms with extended lower wick
Wick represents failed selloff: Low drops significantly below close
Measured as: (Low - Close)/Close × 100 (Negative percentage indicates downward extension)
█ SIGNAL GENERATION
1. LONG ENTRY CONDITION
Bearish candle forms with close < open
Lower wick exceeds user-defined threshold (Default: -1% of close price)
The signal occurs within the specified time window
If enabled, the close price must also be above the 200-period EMA (Exponential Moving Average)
2. EXIT CONDITION
A Sell Signal is generated when the current closing price exceeds the highest high of the previous seven bars (`close > _highest `). This indicates that the price has shown strength, potentially confirming the reversal and prompting the strategy to exit the position.
█ PERFORMANCE OVERVIEW
Ideal Market: Volatile instruments with frequent price rejections
Key Risk: False signals in sustained bearish trends
Optimization Tip: Test various thresholds
Filter Impact: EMA reduces trades but improves win rate and reduces drawdown

Liquidity Sweep + BOS Retest System — Prop Firm Edition🟦 Liquidity Sweep + BOS Retest System — Prop Firm Edition
A High-Probability Smart Money Strategy Built for NQ, ES, and Funding Accounts
🚀 Overview
The Liquidity Sweep + BOS Retest System (Prop Firm Edition) is a precision-engineered SMC strategy built specifically for prop firm traders. It mirrors institutional liquidity behavior and combines it with strict account-safe entry rules to help traders pass and maintain funding accounts with consistency.
Unlike typical indicators, this system waits for three confirmations — liquidity sweep, displacement, and a clean retest — before executing any trade. Every component is optimized for low drawdown, high R:R, and prop-firm-approved risk management.
Whether you’re trading Apex, TakeProfitTrader, FFF, or OneUp Trader, this system gives you a powerful mechanical framework that keeps you within rules while identifying the market’s highest-probability reversal zones.
🔥 Key Features
1. Liquidity Sweep Detection (Stop Hunt Logic)
Automatically identifies when price clears a previous swing high/low with a sweep confirmation candle.
✔ Filters noise
✔ Eliminates early entries
✔ Locks onto true liquidity grabs
2. Automatic Break of Structure (BOS) Confirmation
Price must show true displacement by breaking structure opposite the sweep direction.
✔ Confirms momentum shift
✔ Removes fake reversals
✔ Ensures institutional intent
3. Precision Retest Entry Model
The strategy enters only when price retests the BOS level at premium/discount pricing.
✔ Zero chasing
✔ Extremely tight stop loss placement
✔ Prop-firm-friendly controlled risk
4. Built-In Risk & Trade Management
SL set at swept liquidity
TP set by user-defined R:R multiplier
Optional session filter (NY Open by default)
One trade at a time (no pyramiding)
Automatically resets logic after each trade
This prevents overtrading — the #1 cause of evaluation and account breaches.
5. Designed for Prop Firm Futures Trading
This script is optimized for:
Trailing/static drawdown accounts
Micro contract precision
Funding evaluations
Low-risk, high-probability setups
Structured, rule-based execution
It reduces randomness and emotional trading by automating the highest-quality SMC sequence.
🎯 The Trading Model Behind the System
Step 1 — Liquidity Sweep
Price must take out a recent high/low and close back inside structure.
This confirms stop-hunting behavior and marks the beginning of a potential reversal.
Step 2 — BOS (Break of Structure)
Price must break the opposite side swing with a displacement candle. This validates a directional shift.
Step 3 — Retest Entry
The system waits for price to retrace into the BOS level and signal continuation.
This creates optimal R:R entry with minimal drawdown.
📈 Best Markets
NQ (NASDAQ Futures) – Highly recommended
ES, YM, RTY
Gold (XAUUSD)
FX majors
Crypto (with high volatility)
Works best on 1m, 2m, 5m, or 15m depending on your trading style.
🧠 Why Traders Love This System
✔ No signals until all confirmations align
✔ Reduces overtrading and emotional decisions
✔ Follows market structure instead of random indicators
✔ Perfect for maintaining long-term funded accounts
✔ Built around institutional-grade concepts
✔ Makes your trading consistent, calm, and rules-based
⚙️ Recommended Settings
Session: 06:30–08:00 MST (NY Open)
R:R: 1.5R – 3R
Contracts: Start with 1–2 micros
Markets: NQ for best structure & volume
📦 What’s Included
Complete strategy logic
All plots, labels, sweep markers & BOS alerts
BOS retest entry automation
Session filtering
Stop loss & take profit system
Full SMC logic pipeline
🏁 Summary
The Liquidity Sweep + BOS Retest System is a complete, prop-firm-ready, structure-based strategy that automates one of the cleanest and most reliable SMC entry models. It is designed to keep you safe, consistent, and rule-compliant while capturing premium institutional setups.
If you want to trade with confidence, discipline, and prop-firm precision — this system is for you.
Good Luck -BG
