Gold Scalping Strategy with Precise EntriesThe Gold Scalping Strategy with Precise Entries is designed to take advantage of short-term price movements in the gold market (XAU/USD). This strategy uses a combination of technical indicators and chart patterns to identify precise buy and sell opportunities during times of consolidation and trend continuation.
Key Elements of the Strategy:
Exponential Moving Averages (EMAs):
50 EMA: Used as the shorter-term moving average to detect the recent price trend.
200 EMA: Used as the longer-term moving average to determine the overall market trend.
Trend Identification:
A bullish trend is identified when the 50 EMA is above the 200 EMA.
A bearish trend is identified when the 50 EMA is below the 200 EMA.
Average True Range (ATR):
ATR (14) is used to calculate the market's volatility and to set a dynamic stop loss based on recent price movements. Higher ATR values indicate higher volatility.
ATR helps define a suitable stop-loss distance from the entry point.
Relative Strength Index (RSI):
RSI (14) is used as a momentum oscillator to detect overbought or oversold conditions.
However, in this strategy, the RSI is primarily used as a consolidation filter to look for neutral zones (between 45 and 55), which may indicate a potential breakout or trend continuation after a consolidation phase.
Engulfing Patterns:
Bullish Engulfing: A bullish signal is generated when the current candle fully engulfs the previous bearish candle, indicating potential upward momentum.
Bearish Engulfing: A bearish signal is generated when the current candle fully engulfs the previous bullish candle, signaling potential downward momentum.
Precise Entry Conditions:
Long (Buy):
The 50 EMA is above the 200 EMA (bullish trend).
The RSI is between 45 and 55 (neutral/consolidation zone).
A bullish engulfing pattern occurs.
The price closes above the 50 EMA.
Short (Sell):
The 50 EMA is below the 200 EMA (bearish trend).
The RSI is between 45 and 55 (neutral/consolidation zone).
A bearish engulfing pattern occurs.
The price closes below the 50 EMA.
Take Profit and Stop Loss:
Take Profit: A fixed 20-pip target (where 1 pip = 0.10 movement in gold) is used for each trade.
Stop Loss: The stop-loss is dynamically set based on the ATR, ensuring that it adapts to current market volatility.
Visual Signals:
Buy and sell signals are visually plotted on the chart using green and red labels, indicating precise points of entry.
Advantages of This Strategy:
Trend Alignment: The strategy ensures that trades are taken in the direction of the overall trend, as indicated by the 50 and 200 EMAs.
Volatility Adaptation: The use of ATR allows the stop loss to adapt to the current market conditions, reducing the risk of premature exits in volatile markets.
Precise Entries: The combination of engulfing patterns and the neutral RSI zone provides a high-probability entry signal that captures momentum after consolidation.
Quick Scalping: With a fixed 20-pip profit target, the strategy is designed to capture small price movements quickly, which is ideal for scalping.
This strategy can be applied to lower timeframes (such as 1-minute, 5-minute, or 15-minute charts) for frequent trade opportunities in gold trading, making it suitable for day traders or scalpers. However, proper risk management should always be used due to the inherent volatility of gold.
Search in scripts for "candle"

Engulfing with TrendThe script above is a trading strategy with rules based on the Engulfing candlestick pattern within the context of the trend. Some key elements of this script include:
1. ATR (Average True Range) settings to measure market volatility.
2. Supertrend settings to identify the market trend.
3. Conditions for determining uptrend and downtrend.
4. Determination of Bullish (Engulfing pattern during uptrend) and Bearish (Engulfing pattern during downtrend).
5. Calculation of Stop Loss (SL) and Take Profit (TP) levels based on the Engulfing pattern.
6. Entry conditions based on the Engulfing pattern and the corresponding trend.
7. Exit conditions based on price crossovers with SL and TP levels.
8. Plotting of the Engulfing patterns on the chart.
This strategy is used to identify trading opportunities based on Engulfing candlestick patterns that align with the direction of the market trend. Additionally, stop loss and take profit levels are calculated based on the Engulfing pattern, and trading signals are displayed on the chart.
It's important to note that this script can be customized according to your trading preferences and strategy.

Ahsan Tufail Precise MA Crossover Filter for Reliable SignalsIntroduction:
In the ever-evolving world of Forex trading, strategies that provide a competitive edge are highly sought after. The Moving Average (MA) crossover technique is a popular long-term approach, but its vulnerability to false signals can lead to potential losses. To overcome this challenge, we introduce a game-changing MA crossover filter designed to weed out false signals and unlock the full potential of this strategy. In this article, we delve into the mechanics of this filter, providing a comprehensive analysis of its components and how it enhances the accuracy of buy and sell signals.
The Power of the MA Crossover Filter:
The essence of our MA crossover filter lies in the integration of a specialized indicator that operates on a scale of 0 to 100. This ingenious indicator dynamically measures the distance between the middle Bollinger band and either the upper or lower Bollinger band. By analyzing the values of the last 504 candlesticks, it maps the range from 50 to 100 for the largest and smallest distances between the middle and upper Bollinger bands. Similarly, for values ranging from 0 to 50, it measures the distance between the middle and lower Bollinger bands.
Unveiling the Signal Execution Process:
The brilliance of this filter is revealed in its meticulous execution of buy and sell signals, which significantly reduces false crossovers. Let's explore the process step-by-step:
Buy Signal Precision:
To initiate a buy signal, the price must be positioned above the 200-period Simple Moving Average (SMA).
The filter validates the crossover by checking the indicator's value, ensuring it falls below the threshold of 25.
Sell Signal Accuracy:
For a sell signal, the price must be below the 200-period Simple Moving Average (SMA).
The filter confirms the crossover by verifying the indicator's value, which should exceed the threshold of 75.
This selective approach ensures that only high-confidence crossovers are considered, maximizing the potential for profitable trades.
Fine-Tuning the Filter for Optimal Performance:
While the MA crossover filter exhibits its prowess in GBPUSD and EURUSD currency pairs, it may require adjustments for other pairs. Currency pairs possess unique characteristics, and adapting the filter to specific behavior is crucial for its success.
To fine-tune the filter for alternative currency pairs, traders should conduct rigorous backtesting and analyze historical price data. By experimenting with indicator threshold values, traders can calibrate the filter to accurately match the dynamics of the target currency pair. This iterative process allows for customization, ultimately resulting in a finely-tuned filter that aligns with the unique behavior of the selected market.
Conclusion:
The MA crossover filter represents a paradigm shift in long-term Forex trading strategies. By intelligently filtering false signals, this precision tool unleashes the true potential of the MA crossover technique, elevating its profitability and enhancing overall trading performance. While no strategy guarantees absolute success, incorporating this filter empowers traders with a heightened level of confidence in their buy and sell signals. Embracing the power of this innovative filter can be a transformative step towards mastering Forex profits and staying ahead in the dynamic world of currency trading.

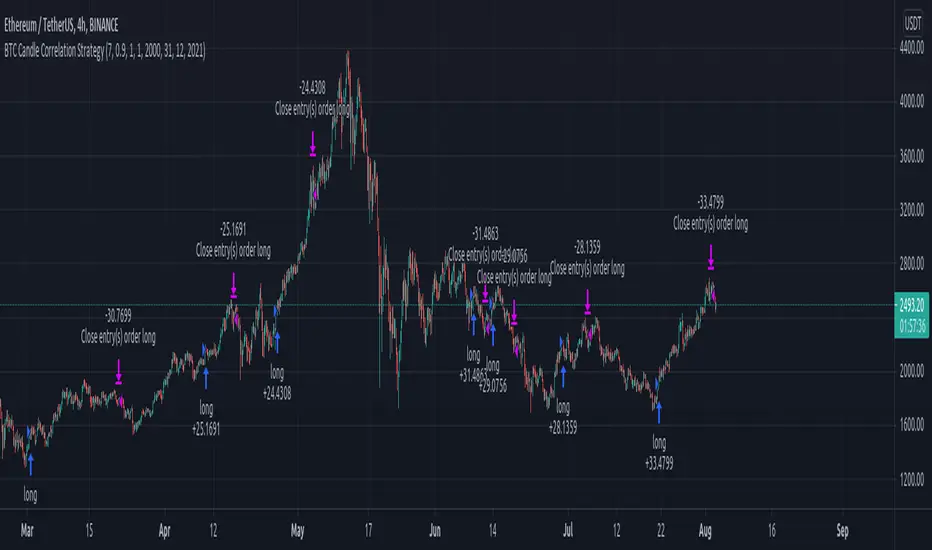
BTC Candle Correlation Strategy This is a special strategy adapted for crypto market, which instead of using the current chart candles, we use inside calculation a candle from different charts.
For best usage I recommend a big timeframe like 1-4h+.
In this case we take the high, low, open and close candles from different brokers for BTC, and with it we form up the candle that we are going to use for the logic of entry.
At the same time we are going to create an upper and lower bands using a moving average and the difference between high and low.
So in a way to put it, if BTC triggers a sell or buy order, we input instead these orders on the current chart, like in this example with ETH.
Rules for entry
For long : if we have a crossover of the btc source value with the upper band .
For short: if we have a crossunder of the btc source vale with the lower band.
For exit, we do it when we receive a different signal than the initial one.
This strategy does not have any other risk management inside, so use it with caution.
If you have any other questions, let me know !
Crypto ENGULF Candle with EMAThis is strategy based on the popular candle pattern, the ENGULFING candle together with multiple EMA for small and big length, in this case 5,20,50 and 200.
The logic for long is the next one, we have a big engulf candle, meaning the the engulf low is lower than the previous low and the high of the candle is higher than the previous candle, together with close of the engulf higher than the previous candle. At the same time I am checking that the EMA are in ascending order , like small one bigger than the middle one and the middle one above big one.
For short, we check the same patterns for engulf, but this time applied to a red candle, opposite to a green candle in long. The same we check for EMA that they are in descending order, like 5<20 and 20<50 and so on.
For exit in both situations, I use the EMA 200 cross above or below, together with a tp/sl system.
If you have any questions, please let me know on private

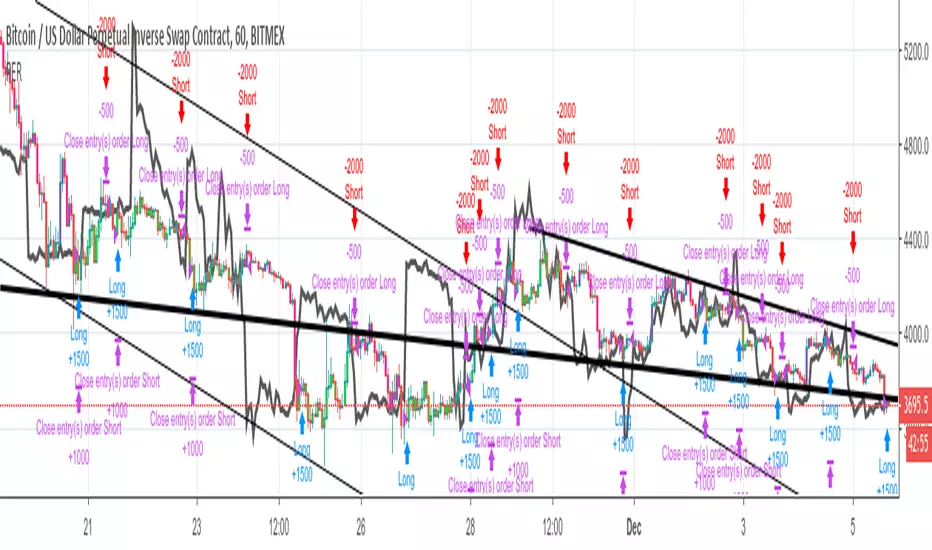
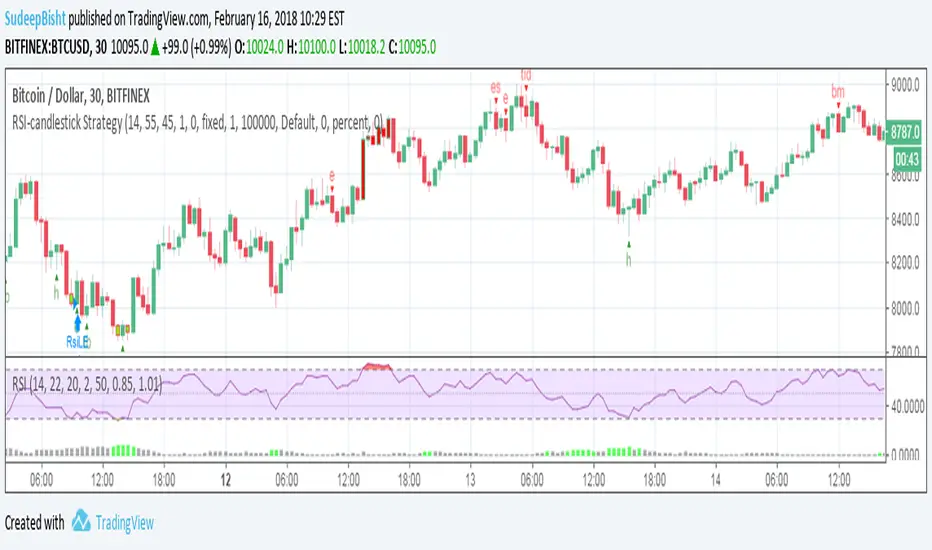
RSI-candlestick StrategyThe script follows a modified rsi strategy and orders are placed if a candlestick pattern is identified in the current or previous candle.
(For optimized results you can add or remove the strategy entry and exits based on the chart you wish to apply the script to).
Noro's Candles Strategy v1.0If there were 2 red candles in a row - to open positions
If there were 2 green candles in a row - to open a position
At emergence of a candle of opposite color - to close a position
Bars Q - the required quantity of candles of identical color

Hammer/Inv Hammer + ema and other settings + stratok, so thrown everything at this one as the previous only had longs.
so we have all the options, but main feature is the ema to divide up the longs and short, shorts above, longs below, we all know price ends up back to the ema at some point.
I have added a volume filter, this calculates the average volume from the last "20" candles (which can be adjusted) then when a hammer appears it has to be larger than the average volume to be valid.
Also added trading hours in, if you are switching between RTH and ETH it can cause issue if it enters a position EOD then you get an anomaly trade as we can hold positions past certain times.
Also added some trading strategy, so after 2 wins it wont trade again that day or after 1 loss. you decide.
So much to play with now.

Nifty 10m Simple ORB TEST harish//@version=5
strategy("Nifty 10m Simple ORB TEST", overlay=true)
// 10m timeframe check
if timeframe.period != "10"
runtime.error("Use this on 10 minute timeframe")
// First 10m candle high/low (no PCR, no opposite logic – just test syntax)
newDay = ta.change(time("D")) != 0
var float dayHigh = na
var float dayLow = na
if newDay
dayHigh := na
dayLow := na
sessStart = 0915
sessEnd = 0925
hhmm = hour * 100 + minute
isFirst = na(dayHigh) and hhmm >= sessStart and hhmm < sessEnd
if isFirst
dayHigh := high
dayLow := low
// Plot first candle range
plot(dayHigh, "First High", color=color.green, style=plot.style_linebr)
plot(dayLow, "First Low", color=color.red, style=plot.style_linebr)
// Simple breakout entries just to test
longCond = not na(dayHigh) and close > dayHigh
shortCond = not na(dayLow) and close < dayLow
if longCond
strategy.entry("LONG", strategy.long)
if shortCond
strategy.entry("SHORT", strategy.short)

TMB Invest - Smart Money Concept StrategyEnglish:
**Quick Overview**
The "TMB_SMC_Strategy_v1.1.3" combines a classic trend filter using two EMAs with contrarian RSI entries and simple SMC elements (Fair Value Gaps & Order Blocks). Stop-loss and take-profit orders are volatility-adaptive and controlled via the ATR. An integrated dashboard displays the setup status, stop-loss/take-profit levels, entry reference, and trend, RSI, and ATR values.
---
## Operating Principle
1. **Trend Filter:** A fast EMA (default 50) is compared to a slow EMA (default 200). Trading occurs only in the direction of the trend: long in uptrends, short in downtrends.
2. **Timing via RSI:** Contrarian entries within the trend. Go long when the RSI is below a buy level (default 40); Short when the RSI is above a sell level (standard 60).
3. **Structure Check (SMC Proxy):** An "FVG Touch" serves as additional confirmation that an inefficient price zone has been tested. Order blocks are visualized for guidance but are not a direct entry trigger.
4. **Risk Management via ATR:** Stop-loss and take-profit levels are set as multipliers of the current ATR (e.g., SL = 1×ATR, TP = 2×ATR). This allows target and risk distances to adjust to market volatility.
5. **Simple Position Logic:** Only one position is held at a time (no pyramiding). After entry, stop and limit orders (bracket exit) are automatically placed.
---
## Input Values
* **EMA Fast / EMA Slow:** Lengths of the moving averages for the trend filter.
* **RSI Length / Levels:** Length of the RSI as well as buy and sell thresholds (contra signals within the trend direction).
* **Take Profit (RR) / Stop Loss (RR):** ATR multipliers for TP and SL.
* **Show FVGs & Order Blocks:** Toggles the visual SMC elements (zones/boxes) on or off.
--
## Signals & Execution
* **Long Setup:** Uptrend (fast EMA above slow EMA) **and** RSI below the buy level **and** a current FVG signal in a bullish direction.
* **Short Setup:** Downtrend (fast EMA below slow EMA) **and** RSI above the sell level **and** a current FVG touch in a bearish direction.
* **Entry & Exit:** If the setup is met, the market is entered; stop-loss/take-profit orders are placed immediately according to ATR multiples.
--
## Visualization
* **EMAs:** The fast and slow EMAs are plotted to illustrate the trend.
* **FVGs:** Fair Value Gaps are drawn as semi-transparent boxes in the trend color and projected slightly into the future.
* **Order Blocks:** Potential order block zones from the previous candle are visually highlighted (for informational purposes only).
---
## Integrated Dashboard
A compact table dashboard (bottom left) displays:
* Current **Setup Status** (Long/Short active, Long/Short ready, No Setup),
* **Stop-Loss**, **Take-Profit**, and **Entry Reference**,
* **Trend Status** (Bull/Bear/Sideways),
* **RSI Value**, and **ATR Value**.
Active long/short positions are highlighted in color (green/red).
--
## Practical Guide
1. **Place on Chart** and select the desired timeframe.
2. **Calibrate Parameters** (EMA lengths, RSI levels, ATR multipliers) to match the market and timeframe.
3. **Backtest** across different market phases; prioritize robustness over maximum curve fit.
4. **Fine-Tuning:**
* Shorter EMAs are often useful intraday (e.g., 20/100 or 34/144).
* Adjust RSI levels to market characteristics (45/55 for aggressive trading, 30/70 for conservative trading).
* Increase or decrease ATR multipliers depending on volatility/trading style.
--
## Notes, Limitations & Extensions
* **FVG Definition:** The FVG detection used here is intentionally simplified. Those who prefer a more rigorous approach can switch to a 3-candle definition and fill levels.
* **Order Blocks:** These primarily serve as a guide. Integration into entry/exit logic (e.g., retests) is possible as an extension.
* **Backtest Realism:** Fills may differ from the displayed closing price. For greater accuracy, intrabar backtests or an entry indicator based on the average position price are conceivable.
* **Alerts:** Currently, no alert conditions are defined; these can be added for long/short setups and status messages.
* **Position Management:** By default, no scaling is performed. Partial sales, trailing stops, or multiple entries can be added.
---
## Purpose & Benefits
The strategy offers a clear, modular framework: trend filter (direction), RSI contra timing (entry), SMC proxy via FVG Touch (structure), and ATR-based exits (risk adaptation). This makes it robust, easy to understand, and highly extensible—both for discretionary traders who appreciate visual SMC elements and for systematic testers who prefer a clean, parameterizable foundation.

PriceAction & Economic StrategyThis indicator combines price-action logic with macroeconomic data to generate trading signals.
Features:
- Price-action signals: A bullish signal occurs when a candle closes above its open; a bearish signal occurs when a candle closes below its open.
- Signal gap: The indicator includes an input called "Signal Gap (bars)" that defines the minimum number of bars between signals. By default the gap is set to 3, but you can adjust this between 1 and 10 to control signal frequency.
- Alerts: The script defines alert conditions for long and short signals, allowing you to create TradingView alerts that notify you when a new signal occurs.
- Economic data: The script uses TradingView's built-in `request.economic()` function to request U.S. GDP data. The GDP series is plotted in the Data Window for additional macroeconomic context.
How to use:
1. Add the indicator to a chart.
2. Open the indicator's settings and adjust the "Signal Gap (bars)" input to set the minimum bar gap between signals.
3. Look for green triangles plotted below the bars (bullish signals) and red triangles plotted above the bars (bearish signals). These appear only when the gap criterion is met.
4. If you want alerts, click the Alert button in TradingView, select this indicator, and choose either the Long or Short alert conditions.
5. To view the GDP data, open the Data Window; the GDP value will be shown alongside other series for each bar.
6. Use these signals in combination with your own analysis; this indicator is for educational purposes and does not constitute financial advice.

saodisengxiaoyu-lianghua-2.1- This indicator is a modular, signal-building framework designed to generate long and short signals by combining a chosen leading indicator with selectable confirmation filters. It runs on Pine Script version 5, overlays directly on price, and is built to be highly configurable so traders can tailor the signal logic to their market, timeframe, and trading style. It includes a dashboard to visualize which conditions are active and whether they validate a signal, and it outputs clear buy/sell labels and alert conditions so you can automate or monitor trades with confidence.
Core Design
- Leading Indicator: You choose one primary signal generator from a broad list (for example, Range Filter, Supertrend, MACD, RSI, Ichimoku, and many others). This serves as the anchor of the system and determines when a preliminary long or short setup exists.
- Confirmation Filters: You can enable additional filters that validate the leading signal before it becomes actionable. Each “respect…” input toggles a filter on or off. These filters include popular tools like EMA, 2/3 EMA crosses, RQK (Nadaraya Watson), ADX/DMI, Bollinger-based oscillators, MACD variations, QQE, Hull, VWAP, Choppiness Index, Damiani Volatility, and more.
- Signal Expiry: To avoid waiting indefinitely for confirmations, the indicator counts how many consecutive bars the leading condition holds. If confirmations do not align within a defined number of bars, the setup expires. This controls latency and helps reduce late or stale entries.
- Alternating Signals: An optional mode enforces alternation (long must follow short and vice versa), helping avoid repeated entries in the same direction without a meaningful reset.
- Aggregation Logic: The final long/short conditions are formed by combining the leading condition with all selected confirmation filters through logical conjunction. Only if all enabled filters validate the signal (within expiry constraints) does the indicator consider it a confirmed long or short.
- Visualization and Alerts: The script plots buy/sell labels at signal points, provides alert conditions for automation, and displays a compact dashboard summarizing the leading indicator’s status and each confirmation’s pass/fail result using checkmarks.
Leading Indicator Options
- The indicator includes a very large menu of leading tools, each with its own logic to determine uptrend or downtrend impulses. Highlights include:
- Range Filter: Uses a dynamic centerline and bands computed via conditional EMA/SMA and range sizing to define directional movement. It can operate in a default mode or an alternative “DW” mode.
- Rational Quadratic Kernel (RQK): Applies a kernel smoothing model (Nadaraya Watson) to detect uptrends and downtrends with a focus on noise reduction.
- Supertrend, Half Trend, SSL Channel: Classic trend-following tools that derive direction from ATR-based bands or moving average channels.
- Ichimoku Cloud and SuperIchi: Multi-component systems validating trend via cloud position, conversion/base line relationships, projected cloud, and lagging span.
- TSI (True Strength Index), DPO (Detrended Price Oscillator), AO (Awesome Oscillator), MACD, STC (Schaff Trend Cycle), QQE Mod: Momentum and cycle tools that parse direction from crossovers, zero-line behavior, and momentum shifts.
- Donchian Trend Ribbon, Chandelier Exit: Trend and exit tools that can validate breakouts or sustained trend strength.
- ADX/DMI: Measures trend strength and directional movement via +DI/-DI relationships and minimum ADX thresholds.
- RSI and Stochastic: Use crossovers, level exits, or threshold filters to gate entries based on overbought/oversold dynamics or relative strength trends.
- Vortex, Chaikin Money Flow, VWAP, Bull Bear Power, ROC, Wolfpack Id, Hull Suite: A diverse set of directional, momentum, and volume-based indicators to suit different markets and styles.
- Trendline Breakout and Range Detector: Price-behavior filters that confirm signals during breakouts or within defined ranges.
Confirmation Filters
- Each filter is optional. When enabled, it must validate the leading condition for a signal to pass. Examples:
- EMA Filter: Requires price to be above a specified EMA for longs and below for shorts, filtering signals that contradict broader trend or baseline levels.
- 2 EMA Cross and 3 EMA Cross: Enforce moving average cross conditions (fast above slow for long, the reverse for short) or a three-line stacking logic for more stringent trend alignment.
- RQK, Supertrend, Half Trend, Donchian, QQE, Hull, MACD (crossover vs. zero-line), AO (zero line or AC momentum variants), SSL: Each adds its characteristic validation pattern.
- RSI family (MA cross, exits OB/OS zones, threshold levels) plus RSI MA direction and RSI/RSI MA limits: Multiple ways to constrain signals via relative strength behavior and trajectories.
- Choppiness Index and Damiani Volatility: Prevent entries during ranging conditions or insufficient volatility; choppiness thresholds and volatility states gate the trade.
- VWAP, Volume modes (above MA, simple up/down, delta), Chaikin Money Flow: Volume and flow conditions that ensure signals happen in supportive liquidity or accumulation/distribution contexts.
- ADX/DMI thresholds: Demand a minimum trend strength and directional DI alignment to reduce whipsaw trades.
- Trendline Breakout and Range Detector: Confirm that the price is breaking structure or remains within active range consistent with the leading setup.
- By combining several filters you can create strict, conservative entries or looser setups depending on your goals.
Range Filter Engine
- A core building block, the Range Filter uses conditional EMA and SMA functions to compute adaptive bands around a dynamic centerline. It supports two types:
- Type 1: The centerline updates when price exceeds the band thresholds; bands define acceptable drift ranges.
- Type 2: Uses quantized steps (via floor operations) relative to the previous centerline to handle larger moves in discrete increments.
- The engine offers smoothing for range values using a secondary EMA and can switch between raw and averaged outputs. Its hi/lo bands and centerline compose a corridor that defines directional movement and potential breakout confirmation.
Signal Construction
- The script computes:
- leadinglongcond and leadingshortcond : The primary directional signals from the chosen leading indicator.
- longCond and shortCond : Final signals formed by combining the leading conditions with all enabled confirmations. Each confirmation contributes a boolean gate. If a filter is disabled, it contributes a neutral pass-through, keeping the logic intact without enforcing that condition.
- Expiry Logic: The code counts consecutive bars where the leading condition remains true. If confirmations do not line up within the user-defined “Signal Expiry Candle Count,” the setup is abandoned and the signal does not trigger.
- Alternation: An optional state ensures that long and short signals alternate. This can reduce repeated entries in the same direction without a clear reset.
- Finally, longCondition and shortCondition represent the actionable signals after expiry and alternation logic. These drive the label plotting and alert conditions.
Visualization
- Buy and Sell Labels: When longCondition or shortCondition confirm, the script plots annotated labels directly on the chart, making entries easy to see at a glance. The labels use color coding and clear text tags (“long” vs. “short”).
- Dashboard: A table summarizes the status of the leading indicator and all confirmations. Each row shows the indicator label and whether it passed (✔️) or failed (❌) on the current bar. This intensely practical UI helps you diagnose why a signal did or did not trigger, empowering faster strategy iteration and parameter tuning.
- Failed Confirmation Markers: If a setup expires (count exceeds the limit) and confirmations failed to align, the script can mark the chart with a small label and provide a tooltip listing which confirmations did not pass. It’s a helpful audit trail to understand missed trades or prevent “chasing” invalid signals.
- Data Window Values: The script outputs signal states to the data window, which can be useful for debugging or building composite conditions in multi-indicator templates.
Inputs and Parameters
- You control the indicator from a comprehensive input panel:
- Setup: Signal expiry count, whether to enforce alternating signals, and whether to display labels and the dashboard (including position and size).
- Leading Indicator: Choose the primary signal generator from the large list.
- Per-Filter Toggles: For each confirmation, a respect... toggle enables or disables it. Many include sub-options (like MACD type, Stochastic mode, RSI mode, ADX variants, thresholds for choppiness/volatility, etc.) to fine-tune behavior.
- Range Filter Settings: Choose type and behavior; select default vs. DW mode and smoothing. The underlying functions adjust band sizes using ATR, average change, standard deviation, or user-defined scales.
- Because everything is customizable, you can adapt the indicator to different assets, volatility regimes, and timeframes.
Alerts and Automation
- The script defines alert conditions tied to longCondition and shortCondition . You can set these alerts in your chart to trigger notifications or webhook calls for automated execution in external bots. The alert text is simple, and you can configure your own message template when creating alerts in the chart, including JSON payloads for algorithmic integration.
Typical Workflow
- Select a Leading Indicator aligned with your style. For trend following, Supertrend or SSL may be appropriate; for momentum, MACD or TSI; for range/trend-change detection, Range Filter, RQK, or Donchian.
- Add a few key Confirmation Filters that complement the leading signal. For example:
- Pair Supertrend with EMA Filter and RSI MA Direction to ensure trend alignment and positive momentum.
- Combine MACD Crossover with ADX/DMI and Volume Above MA to avoid signals in low-trend or low-liquidity conditions.
- Use RQK with Choppiness Index and Damiani Volatility to only act when the market is trending and volatile enough.
- Set a sensible Signal Expiry Candle Count. Shorter expiry keeps entries timely and reduces lag; longer expiry captures setups that mature slowly.
- Observe the Dashboard during live markets to see which filters pass or fail, then iterate. Tighten or loosen thresholds and filter combinations as needed.
- For automation, turn on alerts for the final conditions and use webhook payloads to notify your trading robot.
Strengths and Practical Notes
- Flexibility: The indicator is a toolkit rather than a single rigid model. It lets you test different combinations rapidly and visualize outcomes immediately.
- Clarity: Labels, dashboard, and failed-confirmation markers make it easy to audit behavior and refine settings without digging into code.
- Robustness: The expiry and alternation options add discipline, avoiding the temptation to enter late or repeatedly in one direction without a reset.
- Modular Design: The logical gates (“respect…”) make the behavior transparent: if a filter is on, it must pass; if it’s off, the signal ignores it. This keeps reasoning clean.
- Avoiding Overfitting: Because you can stack many filters, it’s tempting to over-constrain signals. Start simple (one leading indicator and one or two confirmations). Add complexity only if it demonstrably improves your edge across varied market regimes.
Limitations and Recommendations
- No single configuration is universally optimal. Markets change; tune filters for the instrument and timeframe you trade and revisit settings periodically.
- Trend filters can underperform in choppy markets; likewise, momentum filters can false-trigger in quiet periods. Consider using Choppiness Index or Damiani to gate signals by regime.
- Use expiry wisely. Too short may miss good setups that need a few bars to confirm; too long may cause late entries. Balance responsiveness and accuracy.
- Always consider risk management externally (position sizing, stops, profit targets). The indicator focuses on signal quality; combining it with robust trade management methods will improve results.
Example Configurations
- Trend-Following Setup:
- Leading: Supertrend uptrend for longs and downtrend for shorts.
- Confirmations: EMA Filter (price above 200 EMA for long, below for short), ADX/DMI (trend strength above threshold with +DI/-DI alignment), Volume Above MA.
- Expiry: 3–4 bars to keep entries timely.
- Result: Strong bias toward sustained moves while avoiding weak trends and thin liquidity.
- Mean-Reversion to Momentum Crossover:
- Leading: RSI exits from OB/OS zones (e.g., RSI leaves oversold for long and leaves overbought for short).
- Confirmations: 2 EMA Cross (fast crossing slow in the same direction), MACD zero-line behavior for added momentum validation.
- Expiry: 2–3 bars for responsive re-entry.
- Result: Captures momentum transitions after short-term extremes, with extra confirmation to reduce head-fakes.
- Range Breakout Focus:
- Leading: Range Filter Type 2 or Donchian Trend Ribbon to detect breakouts.
- Confirmations: Damiani Volatility (avoid low-volatility false breaks), Choppiness Index (prefer trend-ready states), ROC positive/negative threshold.
- Expiry: 1–3 bars to act on breakout windows.
- Result: Better alignment to breakout dynamics, gating trades by volatility and regime.
Conclusion
- This indicator is a comprehensive, configurable framework that merges a chosen leading signal with an array of corroborating filters, disciplined expiry handling, and intuitive visualization. It’s designed to help you build high-quality entry signals tailored to your approach, whether that’s trend-following, breakout trading, momentum capturing, or a hybrid. By surfacing pass/fail states in a dashboard and allowing alert-based automation, it bridges the gap between discretionary analysis and systematic execution. With sensible parameter tuning and thoughtful filter selection, it can serve as a robust backbone for signal generation across diverse instruments and timeframes.

多指标量化交易DIY- The indicator includes a very large menu of leading tools, each with its own logic to determine uptrend or downtrend impulses. Highlights include:
- Range Filter: Uses a dynamic centerline and bands computed via conditional EMA/SMA and range sizing to define directional movement. It can operate in a default mode or an alternative “DW” mode.
- Rational Quadratic Kernel (RQK): Applies a kernel smoothing model (Nadaraya Watson) to detect uptrends and downtrends with a focus on noise reduction.
- Supertrend, Half Trend, SSL Channel: Classic trend-following tools that derive direction from ATR-based bands or moving average channels.
- Ichimoku Cloud and SuperIchi: Multi-component systems validating trend via cloud position, conversion/base line relationships, projected cloud, and lagging span.
- TSI (True Strength Index), DPO (Detrended Price Oscillator), AO (Awesome Oscillator), MACD, STC (Schaff Trend Cycle), QQE Mod: Momentum and cycle tools that parse direction from crossovers, zero-line behavior, and momentum shifts.
- Donchian Trend Ribbon, Chandelier Exit: Trend and exit tools that can validate breakouts or sustained trend strength.
- ADX/DMI: Measures trend strength and directional movement via +DI/-DI relationships and minimum ADX thresholds.
- RSI and Stochastic: Use crossovers, level exits, or threshold filters to gate entries based on overbought/oversold dynamics or relative strength trends.
- Vortex, Chaikin Money Flow, VWAP, Bull Bear Power, ROC, Wolfpack Id, Hull Suite: A diverse set of directional, momentum, and volume-based indicators to suit different markets and styles.
- Trendline Breakout and Range Detector: Price-behavior filters that confirm signals during breakouts or within defined ranges.
Confirmation Filters
- Each filter is optional. When enabled, it must validate the leading condition for a signal to pass. Examples:
- EMA Filter: Requires price to be above a specified EMA for longs and below for shorts, filtering signals that contradict broader trend or baseline levels.
- 2 EMA Cross and 3 EMA Cross: Enforce moving average cross conditions (fast above slow for long, the reverse for short) or a three-line stacking logic for more stringent trend alignment.
- RQK, Supertrend, Half Trend, Donchian, QQE, Hull, MACD (crossover vs. zero-line), AO (zero line or AC momentum variants), SSL: Each adds its characteristic validation pattern.
- RSI family (MA cross, exits OB/OS zones, threshold levels) plus RSI MA direction and RSI/RSI MA limits: Multiple ways to constrain signals via relative strength behavior and trajectories.
- Choppiness Index and Damiani Volatility: Prevent entries during ranging conditions or insufficient volatility; choppiness thresholds and volatility states gate the trade.
- VWAP, Volume modes (above MA, simple up/down, delta), Chaikin Money Flow: Volume and flow conditions that ensure signals happen in supportive liquidity or accumulation/distribution contexts.
- ADX/DMI thresholds: Demand a minimum trend strength and directional DI alignment to reduce whipsaw trades.
- Trendline Breakout and Range Detector: Confirm that the price is breaking structure or remains within active range consistent with the leading setup.
- By combining several filters you can create strict, conservative entries or looser setups depending on your goals.
Range Filter Engine
- A core building block, the Range Filter uses conditional EMA and SMA functions to compute adaptive bands around a dynamic centerline. It supports two types:
- Type 1: The centerline updates when price exceeds the band thresholds; bands define acceptable drift ranges.
- Type 2: Uses quantized steps (via floor operations) relative to the previous centerline to handle larger moves in discrete increments.
- The engine offers smoothing for range values using a secondary EMA and can switch between raw and averaged outputs. Its hi/lo bands and centerline compose a corridor that defines directional movement and potential breakout confirmation.
Signal Construction
- The script computes:
- leadinglongcond and leadingshortcond : The primary directional signals from the chosen leading indicator.
- longCond and shortCond : Final signals formed by combining the leading conditions with all enabled confirmations. Each confirmation contributes a boolean gate. If a filter is disabled, it contributes a neutral pass-through, keeping the logic intact without enforcing that condition.
- Expiry Logic: The code counts consecutive bars where the leading condition remains true. If confirmations do not line up within the user-defined “Signal Expiry Candle Count,” the setup is abandoned and the signal does not trigger.
- Alternation: An optional state ensures that long and short signals alternate. This can reduce repeated entries in the same direction without a clear reset.
- Finally, longCondition and shortCondition represent the actionable signals after expiry and alternation logic. These drive the label plotting and alert conditions.
Visualization
- Buy and Sell Labels: When longCondition or shortCondition confirm, the script plots annotated labels directly on the chart, making entries easy to see at a glance. The labels use color coding and clear text tags (“long” vs. “short”).
- Dashboard: A table summarizes the status of the leading indicator and all confirmations. Each row shows the indicator label and whether it passed (✔️) or failed (❌) on the current bar. This intensely practical UI helps you diagnose why a signal did or did not trigger, empowering faster strategy iteration and parameter tuning.
- Failed Confirmation Markers: If a setup expires (count exceeds the limit) and confirmations failed to align, the script can mark the chart with a small label and provide a tooltip listing which confirmations did not pass. It’s a helpful audit trail to understand missed trades or prevent “chasing” invalid signals.
- Data Window Values: The script outputs signal states to the data window, which can be useful for debugging or building composite conditions in multi-indicator templates.
Inputs and Parameters
- You control the indicator from a comprehensive input panel:
- Setup: Signal expiry count, whether to enforce alternating signals, and whether to display labels and the dashboard (including position and size).
- Leading Indicator: Choose the primary signal generator from the large list.
- Per-Filter Toggles: For each confirmation, a respect... toggle enables or disables it. Many include sub-options (like MACD type, Stochastic mode, RSI mode, ADX variants, thresholds for choppiness/volatility, etc.) to fine-tune behavior.
- Range Filter Settings: Choose type and behavior; select default vs. DW mode and smoothing. The underlying functions adjust band sizes using ATR, average change, standard deviation, or user-defined scales.
- Because everything is customizable, you can adapt the indicator to different assets, volatility regimes, and timeframes.
Alerts and Automation
- The script defines alert conditions tied to longCondition and shortCondition . You can set these alerts in your chart to trigger notifications or webhook calls for automated execution in external bots. The alert text is simple, and you can configure your own message template when creating alerts in the chart, including JSON payloads for algorithmic integration.
Typical Workflow
- Select a Leading Indicator aligned with your style. For trend following, Supertrend or SSL may be appropriate; for momentum, MACD or TSI; for range/trend-change detection, Range Filter, RQK, or Donchian.
- Add a few key Confirmation Filters that complement the leading signal. For example:
- Pair Supertrend with EMA Filter and RSI MA Direction to ensure trend alignment and positive momentum.
- Combine MACD Crossover with ADX/DMI and Volume Above MA to avoid signals in low-trend or low-liquidity conditions.
- Use RQK with Choppiness Index and Damiani Volatility to only act when the market is trending and volatile enough.
- Set a sensible Signal Expiry Candle Count. Shorter expiry keeps entries timely and reduces lag; longer expiry captures setups that mature slowly.
- Observe the Dashboard during live markets to see which filters pass or fail, then iterate. Tighten or loosen thresholds and filter combinations as needed.
- For automation, turn on alerts for the final conditions and use webhook payloads to notify your trading robot.
Strengths and Practical Notes
- Flexibility: The indicator is a toolkit rather than a single rigid model. It lets you test different combinations rapidly and visualize outcomes immediately.
- Clarity: Labels, dashboard, and failed-confirmation markers make it easy to audit behavior and refine settings without digging into code.
- Robustness: The expiry and alternation options add discipline, avoiding the temptation to enter late or repeatedly in one direction without a reset.
- Modular Design: The logical gates (“respect…”) make the behavior transparent: if a filter is on, it must pass; if it’s off, the signal ignores it. This keeps reasoning clean.
- Avoiding Overfitting: Because you can stack many filters, it’s tempting to over-constrain signals. Start simple (one leading indicator and one or two confirmations). Add complexity only if it demonstrably improves your edge across varied market regimes.
Limitations and Recommendations
- No single configuration is universally optimal. Markets change; tune filters for the instrument and timeframe you trade and revisit settings periodically.
- Trend filters can underperform in choppy markets; likewise, momentum filters can false-trigger in quiet periods. Consider using Choppiness Index or Damiani to gate signals by regime.
- Use expiry wisely. Too short may miss good setups that need a few bars to confirm; too long may cause late entries. Balance responsiveness and accuracy.
- Always consider risk management externally (position sizing, stops, profit targets). The indicator focuses on signal quality; combining it with robust trade management methods will improve results.
Example Configurations
- Trend-Following Setup:
- Leading: Supertrend uptrend for longs and downtrend for shorts.
- Confirmations: EMA Filter (price above 200 EMA for long, below for short), ADX/DMI (trend strength above threshold with +DI/-DI alignment), Volume Above MA.
- Expiry: 3–4 bars to keep entries timely.
- Result: Strong bias toward sustained moves while avoiding weak trends and thin liquidity.
- Mean-Reversion to Momentum Crossover:
- Leading: RSI exits from OB/OS zones (e.g., RSI leaves oversold for long and leaves overbought for short).
- Confirmations: 2 EMA Cross (fast crossing slow in the same direction), MACD zero-line behavior for added momentum validation.
- Expiry: 2–3 bars for responsive re-entry.
- Result: Captures momentum transitions after short-term extremes, with extra confirmation to reduce head-fakes.
- Range Breakout Focus:
- Leading: Range Filter Type 2 or Donchian Trend Ribbon to detect breakouts.
- Confirmations: Damiani Volatility (avoid low-volatility false breaks), Choppiness Index (prefer trend-ready states), ROC positive/negative threshold.
- Expiry: 1–3 bars to act on breakout windows.
- Result: Better alignment to breakout dynamics, gating trades by volatility and regime.
Conclusion
- This indicator is a comprehensive, configurable framework that merges a chosen leading signal with an array of corroborating filters, disciplined expiry handling, and intuitive visualization. It’s designed to help you build high-quality entry signals tailored to your approach, whether that’s trend-following, breakout trading, momentum capturing, or a hybrid. By surfacing pass/fail states in a dashboard and allowing alert-based automation, it bridges the gap between discretionary analysis and systematic execution. With sensible parameter tuning and thoughtful filter selection, it can serve as a robust backbone for signal generation across diverse instruments and timeframes.

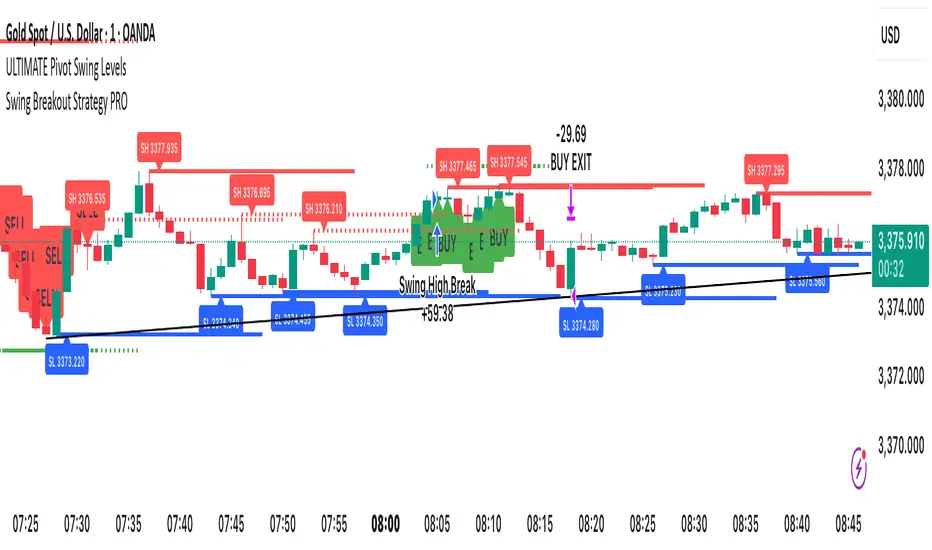
Swing Breakout Strategy PRO“Swing Strategy Pro”
A powerful trading tool designed for price action & swing traders. This indicator automatically detects swing highs and lows and generates precise Buy & Sell signals based on breakout confirmations.
✅ How It Works:
• Buy signal: When swing high breaks with confirmation candle
• Sell signal: When swing low breaks with confirmation candle
• Target = Distance between recent swing high & low
• Stop Loss = Opposite swing level
📌 Perfect for Breakout Trading, Swing Entries, and Trend Continuation strategies.
🎯 Fully automated with visual alerts & clean chart design.
HSI1! First 30m Candle Strategy (15m Chart)## HSI1! First 30-Minute Candle Breakout Strategy (15m Chart) — Description
### Overview
This strategy is designed for trading **Hang Seng Index (HSI) Futures** on a 15-minute chart. It uses the price range established during the first 30 minutes of the Hong Kong main session (09:15–09:44:59) to define key breakout levels for a systematic trade entry each day.
### How the Strategy Works
#### 1. Reference Candle Period
- **Aggregation Window:** The strategy monitors the first two 15-minute bars of the session (09:15:00–09:44:59 HKT).
- **Range Capture:** It records the highest and lowest prices (the "reference high/low") during this window.
#### 2. Trade Setup
- After the 09:45 bar completes, the reference range is locked in.
- Throughout the rest of the trading day (within session hours), the strategy looks for breakouts beyond the reference range.
#### 3. Entry Rules
- **Long Entry (Buy):**
- Triggered if price rises to or above the reference high.
- Only entered if the user's settings permit "Buy Only" or "Both".
- **Short Entry (Sell):**
- Triggered if price falls to or below the reference low.
- Only entered if the user's settings permit "Sell Only" or "Both".
- **Single trade per day:**
- Once any trade executes, no additional trades are opened until the next session.
#### 4. Exit Rules
- **Take Profit (TP):**
- Target profit is set to a distance equal to the initial range added above the long entry (or subtracted below the short entry).
- Example: For a 100-point range, a long trade targets entry + 100 points.
- **Stop Loss (SL):**
- Longs are stopped out if price falls back to the session's reference low; shorts are stopped out if price rallies to the reference high.
#### 5. Session Control
- Active only within the regular day session (09:15–12:00 and 13:00–16:00 HKT).
- Trade tracking resets each new trading day.
#### 6. Trade Direction Manual Setting
- A user input allows restriction to "Buy Only", "Sell Only" or "Both" directions, providing discretion over daily bias.
### Example Workflow
| Step | Action |
|---------------------------|-------------------------------------------------------------------------|
| 09:15–09:44 | Aggregate first two 15m candles; record daily high/low |
| After 09:45 | Wait for a breakout (price crossing either the high or the low) |
| Long trade triggered | Enter at the reference high, target is "high + range", SL is at the low |
| Short trade triggered | Enter at the reference low, target is "low - range", SL at the high |
| Trade management | No more trades for the day, regardless of further breakouts |
| End of session (if open) | Trades may be closed per further logic or left to strategy to handle |
### Key Features and Benefits
- **Discipline:** Only one trade per day, minimizing overtrading.
- **Clarity:** Transparent entry/exit rules; no discretionary execution.
- **Flexibility:** User can bias system to buy-only, sell-only, or allow both, depending on trend or personal view.
- **Simple Risk Control:** Pre-defined stop loss and profit target for every trade.
- **Works best in:** Trending, breakout-prone markets with a history of impulsive moves early in the session.
This strategy is ideal for systematic traders looking to capture the Hang Seng's early session momentum, with robust rule-based management and minimal intervention.

LANZ Strategy 6.0 [Backtest]🔷 LANZ Strategy 6.0 — Precision Backtesting Based on 09:00 NY Candle, Dynamic SL/TP, and Lot Size per Trade
LANZ Strategy 6.0 is the simulation version of the original LANZ 6.0 indicator. It executes a single LIMIT BUY order per day based on the 09:00 a.m. New York candle, using dynamic Stop Loss and Take Profit levels derived from the candle range. Position sizing is calculated automatically using capital, risk percentage, and pip value — allowing accurate trade simulation and performance tracking.
📌 This is a strategy script — It simulates real trades using strategy.entry() and strategy.exit() with full money management for risk-based backtesting.
🧠 Core Logic & Trade Conditions
🔹 BUY Signal Trigger:
At 09:00 a.m. NY (New York time), if:
The current candle is bullish (close > open)
→ A BUY order is placed at the candle’s close price (EP)
Only one signal is evaluated per day.
⚙️ Stop Loss / Take Profit Logic
SL can be:
Wick low (0%)
Or dynamically calculated using a % of the full candle range
TP is calculated using the user-defined Risk/Reward ratio (e.g., 1:4)
The TP and SL levels are passed to strategy.exit() for each trade simulation.
💰 Risk Management & Lot Size Calculation
Before placing the trade:
The system calculates pip distance from EP to SL
Computes the lot size based on:
Account capital
Risk % per trade
Pip value (auto or manual)
This ensures every trade uses consistent, scalable risk regardless of instrument.
🕒 Manual Close at 3:00 p.m. NY
If the trade is still open by 15:00 NY time, it will be closed using strategy.close().
The final result is the actual % gain/loss based on how far price moved relative to SL.
📊 Backtest Accuracy
One trade per day
LIMIT order at the candle close
SL and TP pre-defined at execution
No repainting
Session-restricted (only runs on 1H timeframe)
✅ Ideal For:
Traders who want to backtest a clean and simple daily entry system
Strategy developers seeking reproducible, high-conviction trades
Users who prefer non-repainting, session-based simulations
👨💻 Credits:
💡 Developed by: LANZ
🧠 Logic & Money Management Engine: LANZ
📈 Designed for: 1H charts
🧪 Purpose: Accurate simulation of LANZ 6.0's NY Candle Entry system

Long Explosive V1The “Long Explosive V1” strategy calculates the percentage change in price from the last closing price of the candlestick, so that if it increases by a certain percentage it goes long, but if it decreases by another percentage it sends an exit order, so that the percentage limits above and below the current price function as inherent stop loss and take profit, with the benefit of taking advantage of the volatility of the bull market.
Entries and exits are always at the market and based on percentage changes in the price. Of course, the default configuration of the strategy considers a position with a 5% risk control, modest initial capital and standard commissions, which helps to obtain realistic results and protect the user from unexpectedly controlled potential losses.
It is again emphasized that it is always advisable to adjust the parameters of the strategy well, so that the risk-reward is well controlled.

Consecutive Bearish Candle Strategy█ STRATEGY DESCRIPTION
The "Consecutive Bearish Candle Strategy" is a momentum-based strategy designed to identify potential reversals after a sustained bearish move. It enters a long position when a specific number of consecutive bearish candles occur and exits when the price shows strength by exceeding the previous bar's high. This strategy is optimized for use on various timeframes and instruments.
█ SIGNAL GENERATION
1. LONG ENTRY
A Buy Signal is triggered when:
The close price has been lower than the previous close for at least `Lookback` consecutive bars. This indicates a sustained bearish move, suggesting a potential reversal.
The signal occurs within the specified time window (between `Start Time` and `End Time`).
2. EXIT CONDITION
A Sell Signal is generated when the current closing price exceeds the high of the previous bar (`close > high `). This indicates that the price has shown strength, potentially confirming the reversal and prompting the strategy to exit the position.
█ ADDITIONAL SETTINGS
Lookback: The number of consecutive bearish bars required to trigger a Buy Signal. Default is 3.
Start Time and End Time: The time window during which the strategy is allowed to execute trades.
█ PERFORMANCE OVERVIEW
This strategy is designed for markets with frequent momentum shifts.
It performs best in volatile conditions where price movements are significant.
Backtesting results should be analysed to optimize the `Lookback` parameter for specific instruments.

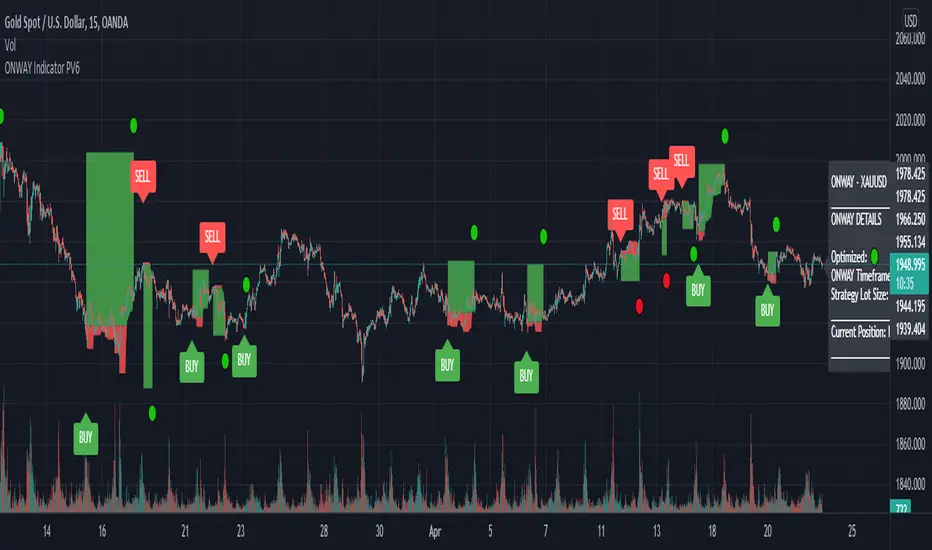
ONWAY Indicator PV6The ONWAY indicator is a comprehensive and earnestly designed tool aimed to increase confidence in a traders market bias. ONWAY analyzes market trends, market strength, and price action near key pivot levels to form a bias on future price action. Of course, it is fundamentally impossible to predict the future, but we all try it now don't we. Gain an edge in the markets and add ONWAY to your tool box.
ONWAY Functionality
Confirmation Signals: ONWAY provides real-time, non-repaint BUY and SELL signals upon the active timeframes candle close.
Targets and Stops: ONWAY will, upon signal confirmation, set a target and stop loss.
Position Management: ONWAY will monitor its current position, if one exists, and attempt to tighten the stop loss if possible.
ONWAY Details
Symbols and Timeframes: ONWAY is restricted to approved symbols and timeframes indicated by the 🟢 icon next to "Optimized:" and "ONWAY Timeframe:" on the dashboard. If an unapproved combination of symbol and timeframe is in use, ONWAY will be disabled (no signals will be visible). See author's instructions for the current ONWAY watchlist or to submit a symbol/timeframe request.
Position Details: Apart from the on chart signals and position plot, the ONWAY dashboard will indicate the current position, entry price, target price, and stop price.
Stop Loss: ONWAY has a unique stop loss/exit strategy that has proved, based on our calculations, to be advantageous. If price reaches or exceeds the stop loss, ONWAY will not close the position unless there is a candle close on the active timeframe exceeding the stop level. This is known as a soft stop loss and identified on the dashboard as "(Soft)" next to the stop price. Additionally, the stop loss will change throughout the position, following the low, for a long position or high, for a short position, within a given period, but the soft stop loss will not exceed beyond a 1:1 risk to reward ratio (the risk will always be equal to or less than the potential reward). It is importance to be aware that the soft stop is utilized at this 1:1 threshold as well. On the plus side, the changing stop loss will impose a risk free position if it finds itself between the entry price and target price. At this stage the soft stop is no longer utilized, the stop loss can only approach the target price, and profit is uhhh.....certain (I don't think the mods will like that word 😉). If the soft stop is no longer in use, the dashboard will indicate this with "(Hard)" next to the stop price.
Position Sizing: The position sizing used for the backtested results is displayed on the dashboard next to "Strategy Lot Size:". This position size is provided solely as a reference for the backtest results. The choice of a position size is left to the users discretion.
Backtest Results: With any strategy, backtesting is an excellent way to judge performance and viability, but it is important to recognize that past performance does not confirm repeatability in future market conditions.
Updates: ONWAY updates its acceptable symbols frequently to account for everchanging market conditions. This includes adding new symbols, rejecting previously compatible symbols, and modifying the optimal window for current symbols.
Acceptability Criteria: The criteria for a symbol to be deemed acceptable requires that its backtested results deliver a win rate greater than 70%, profit factor greater than 1.2, and its equity chart appear favorable. These metrics are available to users by clicking on "Strategy Tester" located on the bottom panel of the chart view.
Accessibility: To gain access to ONWAY, see the author's instructions below.
Use of this script implies that you acknowledge that past performance does not necessarily indicate future results and that guarantees are not possible in this trading realm.
MavilimW Strategy MTF EMA with HA CandlesThis is a strategy adapted initially for Mavilim moving average indicator, based on WMA MA.
It seems to works amazingly on long term markets, like stocks, some futures, some comodities and so on.
In this strategy, I form initially the candle, using EMA values, so I take the EMA of last 50 closes, open, highs and lows and form the candle
After this I take interally HA and convert the EMA candle to HA.
Then using the moving averages on multiple timeframes, like in this example we have a chart on 4h, but I use 1h and 1d moving averages.
For long condition we have : close is above moving average timeframe1 and oving average timeframe2 and oving average timeframe3
Initially short would be close below ma timeframe1, ma timeframe2 and timeframe3 -> but here I also convert it into a long signal.
So we actually go only long .
And we have 2 different exits : for first long if we have a crossdown of 1h ma with 1 day ma, and for second long if we have a cross up of 1h ma with 1 day ma in this example.
Message me if you have any questions about this strategy.

2 Candles Inside ATR2 agitated candles falling inside ATR range, awaiting possibly a big move.
Buy / Sell signals at combined high / low can be used as order with other as stop loss.
Counter trade, when this minimal stop loss is hit, is also as useful. However, wait till the SL candle closes, before opening position on the other side.
Works quite well on 15 mins chart, with settings of ATR duration 25 and multiplier 0.6. These settings are configurable, so feel free.

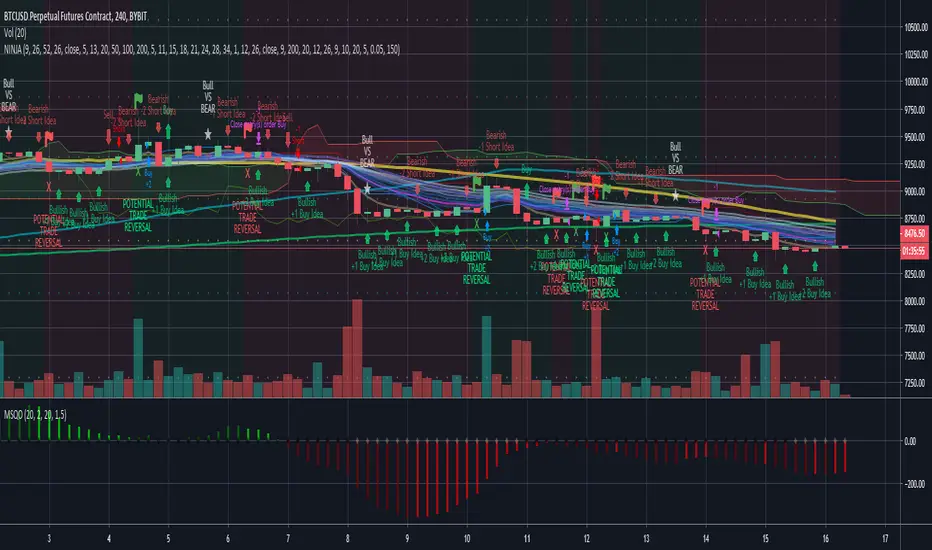
BTC BRAWL NINJA TRADERThe NINJA TRADER was devloped for trading competition higher leverage scalp trading. It is a modified from my Trade Trend Indicator (indicator) has been the brain child of 23 years of trading experience rolled into a simple to understand all market setup alert system based solely on 5 high probability trade set ups with a 6th high risk. The hope is to provide something that is can assist traders in building confidence in their trades with a little assistance from the indicator.
This like any and all indicators is not a be all and end to trading, yes while back tested the indicator has produced fantastic profitable results; past performance is not a guarantee of future but which with human intervention can increase the return result exponentially.
You need to be able to chart simple candle sticks and you need to have an understanding of support and resistance areas to make sense of what you are doing in trading otherwise even this indicator won't help you.
While this may alert buy or sell / long or short entrance these are to be taken as educational points of reference and if you wish to trade you are understanding that you enter and exit at your own risk. Not many indicators will alert you to the possibility of a rogue wave spike / dump or both, this will but everything is perspective of the time frame you are on.
The indicator is designed for the 4hour time frame with trade entry on the 15min and managed on the 30min time frame. Alot can happen within these time frame but as we know not every trader can sit in front of a screen for hours at a time and this let's one trade for swings. Once you have your entry you place your exits and you set your stops. If you wait for the alert to exit you are in a draw down this should never reach that point pay yourself for being right.
The set ups are simple:
1. Trend change from bearish to bullish buys are dip interim support entries.
2. Trend change from bullish to bearish sells are top interim resistance exits.
3. Blue buy is an entry position for a trade.
4. Blue long is an add position for a trade.
5. Red short is just that a short trade idea. (this is advanced and requires a manual cover target),
6. Green buy is a break out over the next candle to print above (highest risk)
All trades are based on a 5% to 10% of capital entry with no more than 40% ever in 1 trade goal is many consistent trade wins while limiting the losses and size.
Certain set ups such as longs over the Moving Averages but below the cloud can lead to strong rally returns as well as short in a bearish trend just above the Moving Averages can give prolonged selling pressure.
Pay attention to the golden dump line as it rises the closer to the candle it gets the higher the risk of the trade lacking continuation.
Made the golden dump line easier to bringing it forward.
Changed the trade trend reversal to stand out more as a marker of a trade even when alerts stacked
Added a calculation for the alert to recalculate based on the time frame chosen
Added a check balance verse the break out buy as to not false alert during the BTC BRAWL CHALLENGE in high risk trade setups
Added notification of bullvsbear action to avoid being caught in the BTC BRAWL CHALLENGE
Added a take profit reminder based on time frame volume
None of this is to be taken as investment advice but rather Edutainment and infotainment
//#TradeSocially
Relative Estimated Price KivanÇ version (Strategy) By Wicksell Thanks to the great work of KIVANÇ in the Relative Estimated Price REP by KIVANÇ fr3762, it has adapted modifications in the Lookback bar length, transformed into strategy, where a line determines a relative average price of XBTUSD, BTCUSD, ETHUSD and BCH.
the line is a calculation, where it involves reading previous candles where it determines what the current price should be.
When the REP line is above the candle, open buy and close sell, when it is below, open sell and close buy.
When setting which currency, do not forget to change the settings where they are:
1 - XBTUSD
2 - BTCUSD
3 - ETHUSD
4 - BCHBTC
may also be modified:
the Lookback bar length, stop loss settings, test date.
The best results are in the 1H time, with the default settings, but try to modify the data and if you find better results, I would be grateful if you post here.