TechniTrend: Strong Candles DetectorTechniTrend: Strong Candles Detector
Description:
The TechniTrend: Strong Candles Detector indicator is designed to identify strong candlestick patterns based on customizable thresholds of candle strength, volume, and price volatility. By detecting significant candles that have a high proportion of body relative to total range, the indicator helps traders identify potential shifts in market direction, making it a useful tool for trend analysis and reversal spotting.
Key Features:
Candle Strength Detection: The indicator calculates the strength of a candle based on the ratio of its body (difference between open and close) to its total range (high minus low). If the body size exceeds a user-defined threshold, the candle is flagged as strong. This helps traders quickly identify key candles that may signal market movements.
Volume Confirmation (Optional): An optional volume confirmation allows the indicator to only flag candles as "strong" if the trading volume during the candle exceeds the average volume over a customizable period. This can help validate that a candle’s movement is backed by significant market participation.
Volatility Body Confirmation (Optional): Users can further refine the detection by requiring that the body of a strong candle exceed the average body size (volatility) of previous candles. This ensures that candles with greater price movement are prioritized.
Customizable Inputs:
Strength Threshold: Defines the minimum ratio of body to total range for a candle to be considered strong.
Moving Average Type: Choose from SMA, EMA, or WMA for calculating the moving average of volume or body volatility.
Volume and Body Confirmation: Adjust the percentage thresholds for the difference between the current volume/body size and their average values.
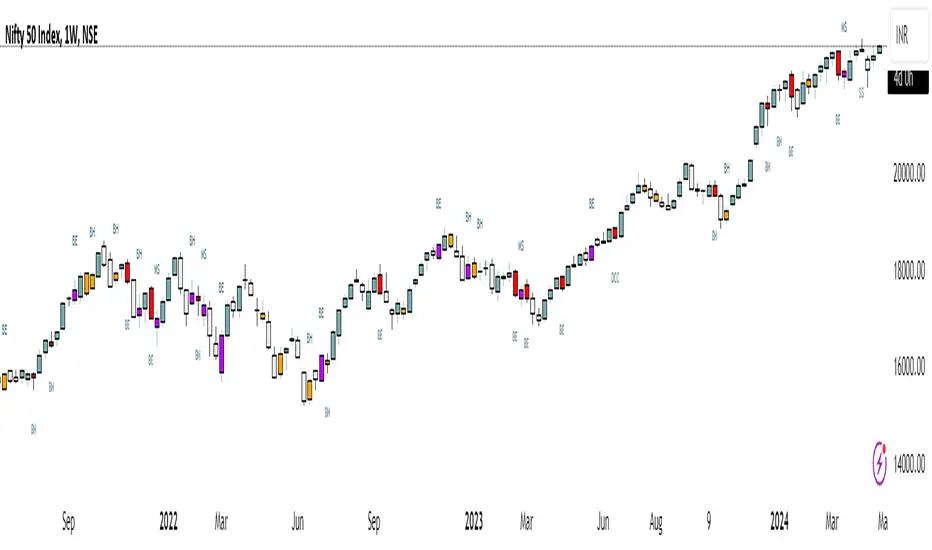
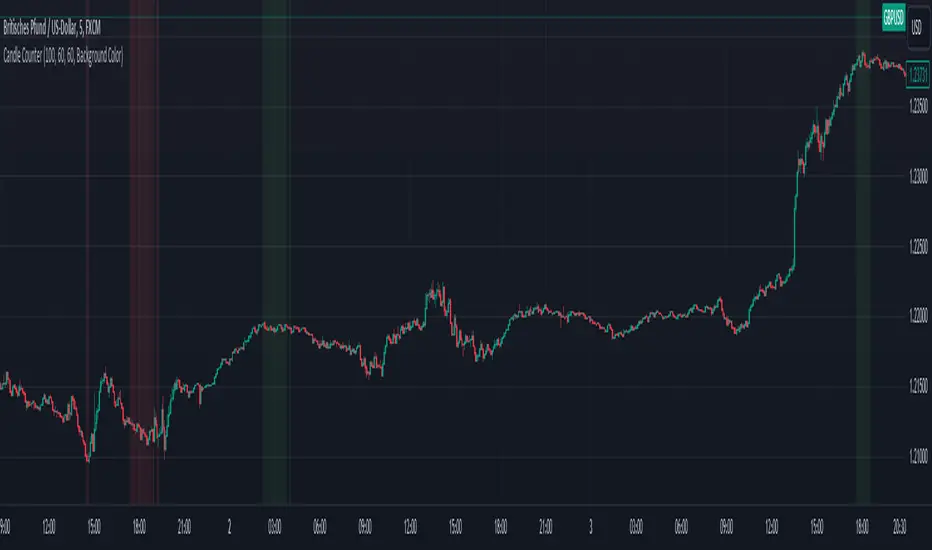
Visual Alerts: The indicator marks strong bullish candles with green upward labels below the candle, and strong bearish candles with red downward labels above the candle. Additionally, strong candles can be highlighted with a customizable background color for easier visualization.
How It Works:
Strength Ratio:
The core of this indicator is the calculation of the strength ratio, which is defined as the body size (open-close) divided by the total range (high-low). If the body size is larger relative to the total range and exceeds the user-defined threshold, the candle is flagged as strong.
Volume and Volatility Confirmation:
For traders seeking additional confirmation, the indicator can be configured to only mark candles if the current volume or body volatility exceeds the average by a user-defined percentage. These confirmations can be toggled on or off to suit different trading strategies.
Customization Options:
Strength Threshold (0-1):
Sets the minimum strength required for a candle to be flagged. A higher value will result in fewer but more significant candles being marked.
Volume Confirmation:
Toggle on to require a higher volume compared to the average volume for a candle to be confirmed as strong.
Volatility Body Confirmation:
Toggle on to require a larger candle body compared to the average body size for further confirmation.
Candle Color:
Choose the background color used to highlight strong candles.
Recommended Settings:
Strength Threshold: 0.7 (for a good balance between body and range)
Volume Difference: 0.05 (5% above the average volume)
Body Volatility Difference: 0.05 (5% above the average body size)
Length: 14 (for volume and volatility moving averages)
Conclusion: The TechniTrend: Strong Candles Detector is an easy-to-use yet powerful tool for traders who want to identify key candles that signal potential market trends. Its customizable settings allow for fine-tuning to fit different trading styles, whether looking for high-volume breakouts or significant price movements. The indicator offers both a visual and configurable alert system to help traders make more informed decisions.
Pine Script® indicator