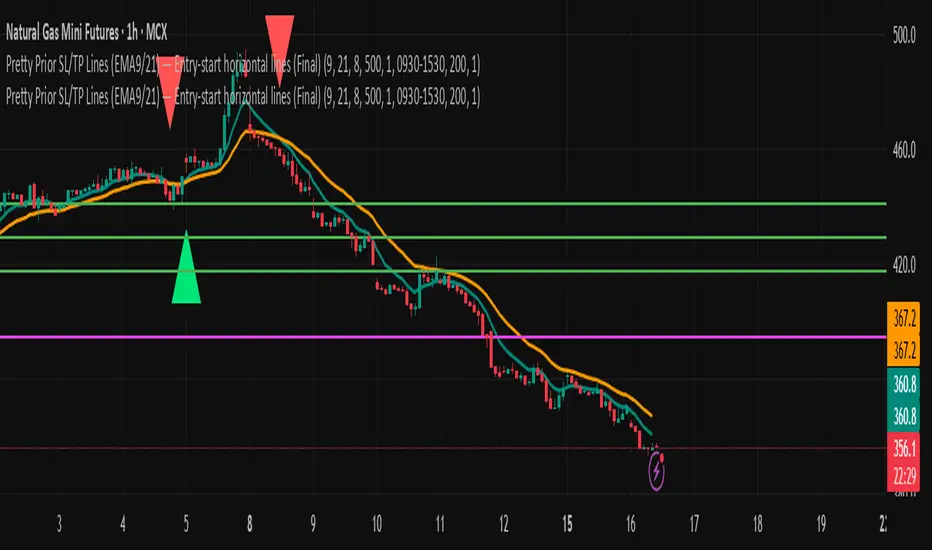
Multi Time Frame Heiken Ashi Candles by @DaviddTechMulti Time Frame Heiken Ashi Candles Visual Strategy.
Inspired by a video on YouTube by TradePro I decided to backtest this strategy.
The Strategy : This strategy waits for all the lines to cross green or red to look for a an entry.
It seems to give good results on the 15 minute timeframe.
1. The Cloud - Confirmed with no repainting.
2. The Lines may repaint as the price movement changes.
Confluence with the RSI STOCHASTIC.
If you use the RSI STOCHASTIC you have 2 options.
1. Super Scalper - Where the strategy will enter on every cross <> the two levels.
2. Longer positions - One entry is made where the RSI STOCHASTIC the closest to the GREEN/RED Star.
WARNING:
- For purpose educate only
- Plots EMAs and other values on chart.
- This script to change bars colors.
Search in scripts for "candle"
Oscilator candles - momentum strategyThis is momentum based strategy based on indicators published earlier:
Also trying to use delayed supertrend based on steps as mentioned in the published indicator:
Added option to filter trade entries based on higher timeframe pivots. But, it is not so effective and may need further optimization.
Bollinger %B Candles StrategyStrategy built based on earlier published indicator:
Looks to be doing good for short term swing trades. But, I am not sure if there is repainting. I tried to avoid buy/sell trades on same day - but wasn't successful.
So far back-tested on following:
COINBASE:BTCUSD - works on both long and short
CURRENCYCOM:GOLD and equities - long only.
Some of the failures: ASX:WPL , ASX:WHC , ASX:NHC
As usual for back-testing - using 1000 as initial capital with 100% invested on each trade and no compounding so that it will be easy to compare with buy and hold. Trade with caution :)

MACD Bull Crossover and RSI Oversold 5 Candles Ago-Long StrategyHello everyone, I've been having a great time perfecting this strategy for a few weeks now. I finally feel like it's time to release it to the public and share what I have been working on.
This strategy only enters a long trade when the MACD crosses over the signal line and the RSI was oversold looking back 5 candles ago. The logic behind this is to wait for RSI to enter the oversold territory, and then when the market starts to recovery the MACD will crossover telling us the sell off is over.
This strategy will close once these 2 conditions are met.
1. MACD Histogram is above 0 and MACD crosses under the signal line.
2. RSI was overbought 5 previous candles ago.
In the strategies settings, you'll be able to enable visual stop-loss and profit levels and change those levels to what you like, enable up to 5 EMA'S,
ADDONS That Affect Strategy:
* Enable visual stop-loss and profit levels as soon as a buy signal is triggered.
* Modify stop-loss and profit levels.
* Modify RSI oversold and RSI overbought levels.
* Modify MACD Fast and Slow moving average.
ADDONS That Do Not Affect Strategy:
* Enable up to 5 EMA's. (This will not affect strategy, and is the only purpose is for people who like following EMA's.)
Thank you for taking the time to try my strategy. I hope you have the best success. I will be making a short strategy, and alerts for this strategy soon. Follow me for updates!

Full Candle Outside BB [Bishnu103]Bollinger band defines volatility range based on the current market condition. If a full candle is created outside BB then it is highly volatile and it may reverse to the mean, i.e. middle BB.
Buy - when a green candle is created below lower BB (alert candle) and price goes above high of it.
Buy SL - low of alert candle
Target 1 - middle band
Target 2- upper band
Sell - when a red candle is cerated above upper BB (alert candle) and price goes below low of it
Sell SL - high of alert candle
Target 1 - middle band
Target 2 - lower band
************************************************************************************************************************************************************************************
Disclaimer: This is in-progress strategy. I plan to work further and improve this. So please use this in the live market very carefully and based on your own risk factors.
************************************************************************************************************************************************************************************

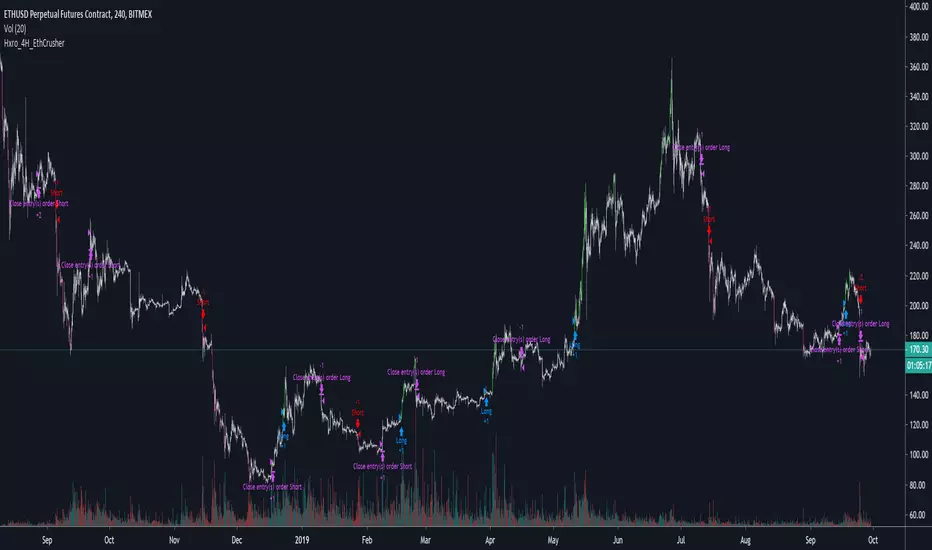
Hxro_4H_EthThis script is intended for use on 4H ETHUSD Perpetual Futures Contract. It includes entry / exit logic and has a tuned risk management based on volatility.
This script is brought to you by Hxro Games, LLC, a new way to play cryptocurrency markets.
Our MoonRekt( tm ) game simplifies the trading process by allowing users to simply pick "Moon" or "Rekt" and receive payouts based on if the next candle closes up or down.
Renko Magic - StrategyThis strategy uses the Renko Candle's trend change and follows it with a trend.
Applied 10 ticks of slippage and Bitmex's market order commission.
Last Updated June 7th 2019.

Failure Swing Strategy (stop hunting) V1 (Made on XBT/USD 4h Bitmex)
This strategy is a first attempt to countertrade the false break of a key support/resistance.
If a candle breaks the level, but it comes back before close, it will trigger an order.
The Stop Loss is in %, the Take Profit is near the EMA.
There is a "volatility filter" to block orders when the price is near the EMA and a coefficient to adjust a little the Stop Loss and Take Profit according to the chart condition.

Hull & Candle CrossoverA Hull moving average and candle crossover.
(2 hullMA's and present to past candle value calculation and smoothing function)
Enters order on Hull1 vs Hull2 crossover, Exits order on Price vs Candle crossover
Strategy looks at the previous(1) candle value to calculate current price so it lags 1 candle (to avoid repainting)
Any timeframe and pair ok, just change settings to suit
commission is included in the default result

Japanese Candles Pyramiding StrategyFirst attempt at a regular candles version of our private strategy. Configurable options as usual.

SD_Bull_Bear_Engulfing_Rsi_SdThis strategy combines the idea of a bullish or bearish candle engulfing coupled with standard deviation (a 100% increase or a 50% decrease). The exit condition is placed if the percentage increase is achieved or 35<rsi<65.
The strategy requires refinement so please test the script and let know what can be incorporated to improve the efficiency.

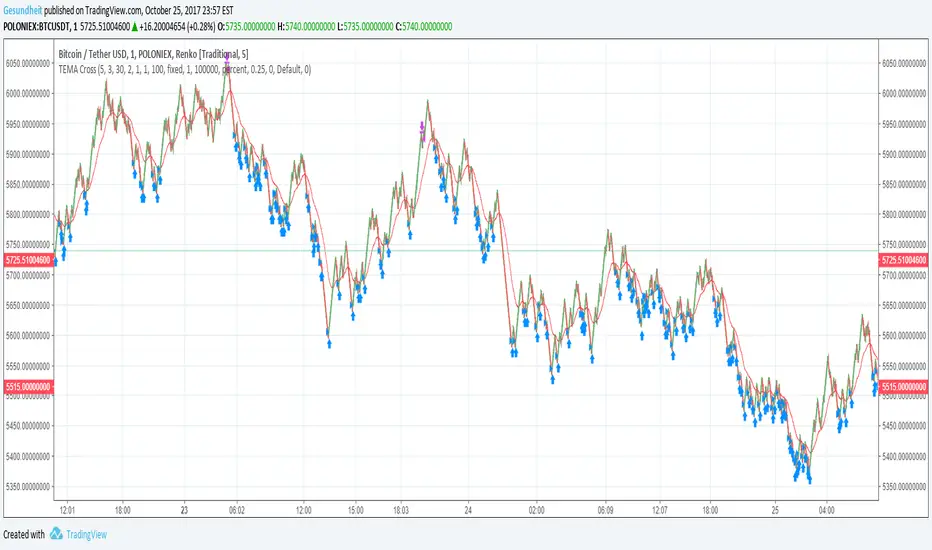
TEMA Cross on Renko CandlesRenko candles filter out noise by plotting a fixed change in price rather than a fixed time frame.
Strategies like MACD or MA cross can give a lot of false signals when the price is wavy, but not actually going anywhere. This is especially a problem with small time frames.
Since it's so easy to identify trends on a Renko plot, this strategy uses a simple moving average cross idea. Instead of an EMA, we use a TEMA ( triple exponential moving average ) because that version does not lag as much.
We also will avoid buying when the price is above a longer-term smoothed moving average. This means we will hopefully reduce bags, but we will also miss some trades.
Also included are
avg_protection -- if >0 only buy when it will bring down our average price, else buy whenever the TEMA crosses over the short-term SMA
gain_protection -- if >0 only sell when we meet out min_gain %, otherwise sell whenever TEMA crosses under the short-term SMA
I've been setting my Renko candles to a fixed range instead of ATR, and I use increments of roughly 0.1% in the example chart.
30min First Candle + Fibo50 + Sequential Multi-TF Break StrategyPrice action basée sur ouverture marché US a partir de la 1ere bougie
Réinitialisation chaque jour
Price action based on US market opening from 1st candle
Reset every day.

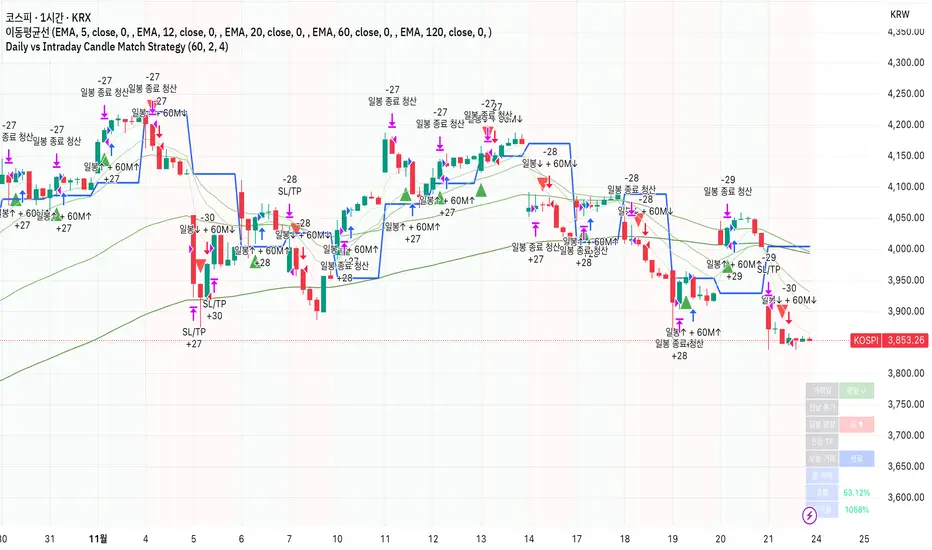
Daily vs Intraday Candle Match Strategy고죠 훈의 차트공부방
Gojo Hoon’s Trading Room
전일 종가 대비 현재 일봉 방향과 시간봉 방향이 일치할 때 진입
Trade when current daily direction (vs. previous close) matches the hourly/15-minute candle direction.
EMA Cross Strategy v5 (30 lots) (15 min candle only)- safe flip🚀 EMA Cross Strategy v5 (30 Lots) (15 min candle only)— Safe Flip Edition
Fully Automated | Fast | Reliable | Battle-tested
Welcome to a clean, powerful, and automation-friendly EMA crossover system.
This strategy is built for traders who want consistent trend-based entries without the risk of unwanted pyramiding or doubled positions.
🔥 How It Works
This strategy uses a fast EMA (10) crossing a slow EMA (20) to detect trend shifts:
Bullish Crossover → LONG (30 lots)
Bearish Crossover → SHORT (30 lots)
Every opposite signal safely flips the position by first closing the current trade, then opening a fresh position of exactly 30 lots.
No doubling.
No runaway position size.
No surprises.
Just clean, mechanical trend-following.
📈 Why This Strategy Stands Out
Unlike basic EMA crossbots, this version:
✔ Prevents unintended pyramiding
✔ Never over-allocates capital
✔ Works perfectly with webhook-based automation
✔ Produces stable, systematic entries
✔ Executes directional flips with precision
🔍 Backtest Highlights (1-Year)
(Backtests will vary by instrument/timeframe)
1,500+ trades executed
Profit factor above 1.27
Strong trend performance
Balanced long/short behavior
No margin calls
Consistent trade execution
This strategy thrives in trending markets and maintains strict discipline even in choppy conditions.
⚙️ Automation Ready
Designed for automated execution via webhook and API setups on supported platforms.
Just connect, run, and let the bot follow the rules without hesitation.
No emotions.
No overtrading.
No fear or greed.
Pure logic.

Fractional Candlestick Long Only Experimental V4 Another example of use an idea of Fractional Candlestick , based on mathematical rules of Fractional Calculus , typical kernel Caputo-Fabrizio ( CF ) and Atangana-Baleanu is used, alfa factor ( esential for calculation ) is in range 0,1-0.9.
Let's fun with this script .

US Index First 30m Candle Strategy (10m Chart)Strategy Description for Publishing
Title: US Index First 30-Minute Candle Strategy (10m Chart)
Overview:
This Pine Script implements a trading strategy designed to capitalize on price movements within the first 30 minutes of the U.S. stock market opening. It is specifically tailored for use on a 15-minute chart and is optimized for trading U.S. indices during regular market hours.
Features:
Session Time Configuration: The strategy operates within the U.S. market hours, specifically from 9:30 AM to 4:00 PM (Eastern Time).
First 30-Minute Candle Aggregation: The script identifies the high and low of the first 30-minute candle, which is considered a critical time frame for market momentum.
Single Trade Per Day: To minimize risk, the strategy is designed to execute only one trade per day based on the established range of the first 30 minutes.
Dynamic Trade Conditions: Buy and sell signals are generated when the price breaks above the high or below the low of the first 30-minute candle, with defined stop-loss and take-profit levels based on a customizable risk-reward ratio.
How It Works:
Initialization:
At the start of each trading day, the script resets the high and low values for the first 30 minutes.
Range Locking: After the first 30 minutes, the high and low values are locked, allowing for trade entries based on these levels.
Trade Execution:
Long Entry: Triggered when the price moves above the locked high.
Short Entry: Triggered when the price drops below the locked low.
Risk Management: Each trade comes with a stop-loss and take-profit mechanism to manage potential losses and secure profits.
Visuals:
The script also plots the locked high and low levels on the chart, providing a visual reference for traders.
Conclusion:
This strategy leverages the volatility often seen in the first 30 minutes of trading, aiming to capture significant price movements while maintaining a disciplined trading approach. It is suitable for traders looking to implement a systematic strategy based on early market behavior.
Usage:
To use this strategy, simply add the script to your TradingView chart, set your desired parameters, and monitor for trade signals during the specified market hours. Adjust the risk-reward ratio as needed to align with your trading style.

Parabolic SAR Heikin Ashi MTF Candle ScalperThis is scalper strategy designed around parabolic sar indicator, where as an input candle value it uses the heikinashi from a higher timeframe.
This example has been adapted to SPY/SPX chart
In this case ,we are using a 5 min chart, but the calculations are made on a 15 min heikin ashi chart for the PSAR and then on 5 min chart we plot the results.
At the same time we are conditioning the entry to be base on a time/session for daytrading/scalper mentality
In this case we only enter within the first 30 min of SPY opening session , and then we exit after 3-4 hours of staying in the position ( unless we hit a reverse condition).
For long condition we enter when the mtf ha candle close is above the mtf psar and for short condition we enter when the mtf ha candle close is below the mtf psar
This script is made with an educational purpose to show the power of multiple time frame approach compared to a single chart.
If you have any questions, let me know !

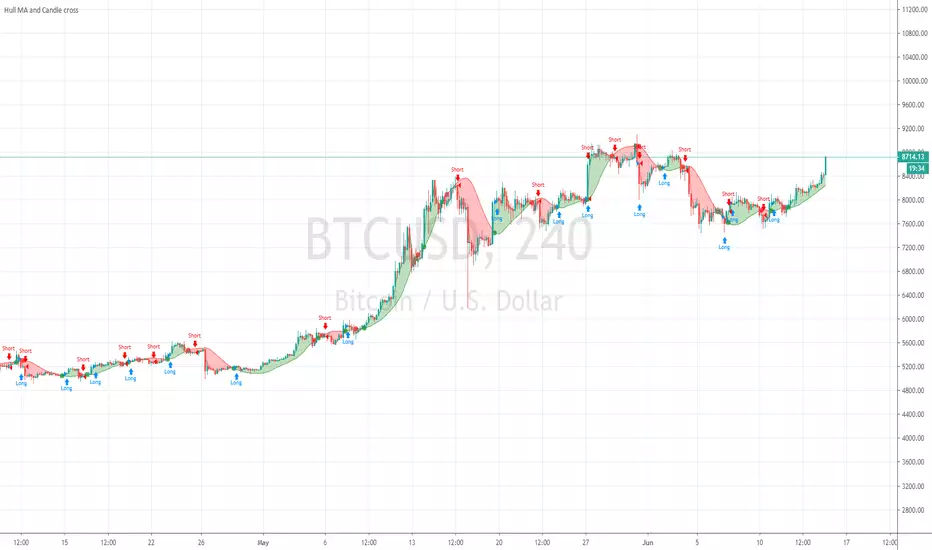
Hull Moving Average vs CandleA Hull moving average is applied to the chart with settings for user to change the period of the Hull MA.
And a value of a previous candle is compared to the HMA. If the HMA is above the previous candle value, then the strategy will buy.
If below, it will sell. The default setting for the HMA is 50 and the Candle is D1 (Daily timeframe)
So basically if the HMA value is greater than yesterdays candle open, buy. ( i use open as a price source to avoid repainting)
This example is put onto ETHBTC chart and currency changed from default to BTC and Equity set to 1 BTC and commission set to 0.25%
The ETHBTC chart seems to follow good old moving average more than other pairs.
The strategy can be used on any pair and timeframes.
A good idea for setting the HMA period is:
small timeframe=big period, big timeframe=small period.
range from period=3 to period=200 is about right, for charts from 4H to 1 minute.
This HMA strategy is fairly simple, best to use other sources of information in combination with moving averages.
And strict money management, risk/reward control is very important to any trading strategy.
Not intended as stand alone strategy but has potential for bot use, i will publish a study version soon, for use with alerts and API bots.

Hull MA and Candle crossHull MA vs price cossover . not 2 Hull MA's crossing, and also a price vs previous price crossover :
current price higher than previous = buy
current price lower than previous = sell
Price value set to OPEN to avoid repaint during candle
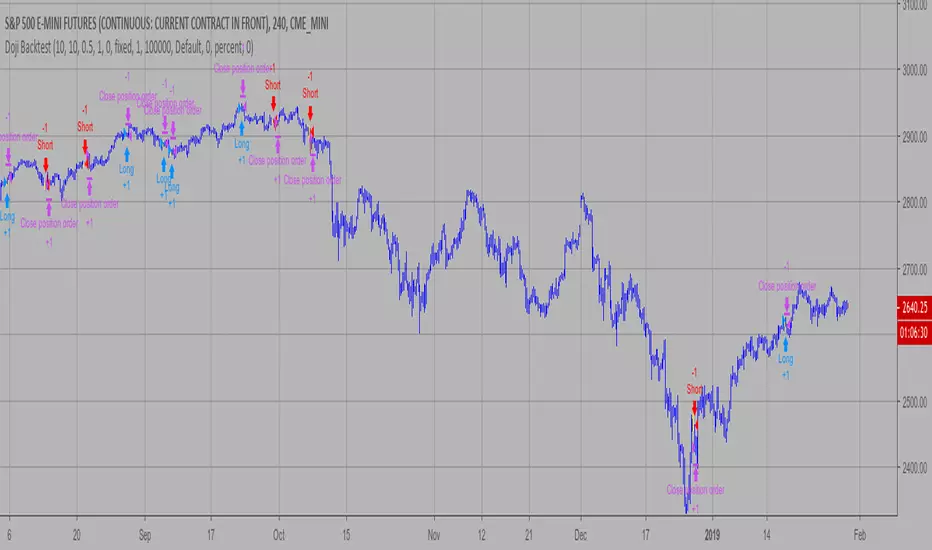
Doji Backtest This is a candlestick where the open and close are the same.
WARNING:
- For purpose educate only
- This script to change bars colors.
AUD/USD 30M Heikin/CandleReasonably accurate Heikin Ashi or Candle stick strategy, i recommend using in conjunction with a force Index .