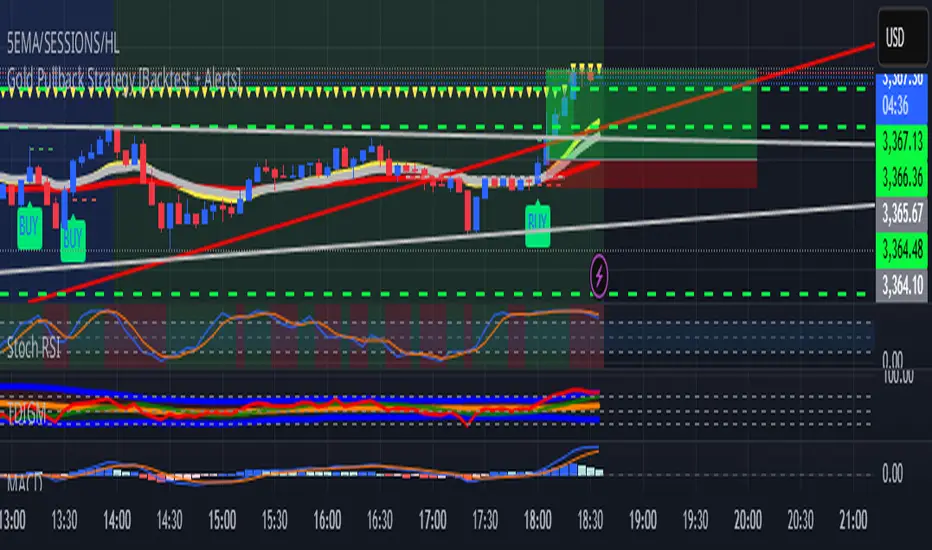
Gold Pullback Strategy [Backtest + Alerts]XAU USD M5 M15 TP1-1
BUY Pull black EMA 21
Storsi oversold
Search in scripts for "candle"
ZYTX RSI SuperTrendZYTX RSI SuperTrend
ZYTX RSI + SuperTrend Strategy
The definitive integration of RSI and SuperTrend trend-following indicators, delivering exemplary performance in automated trading bots.

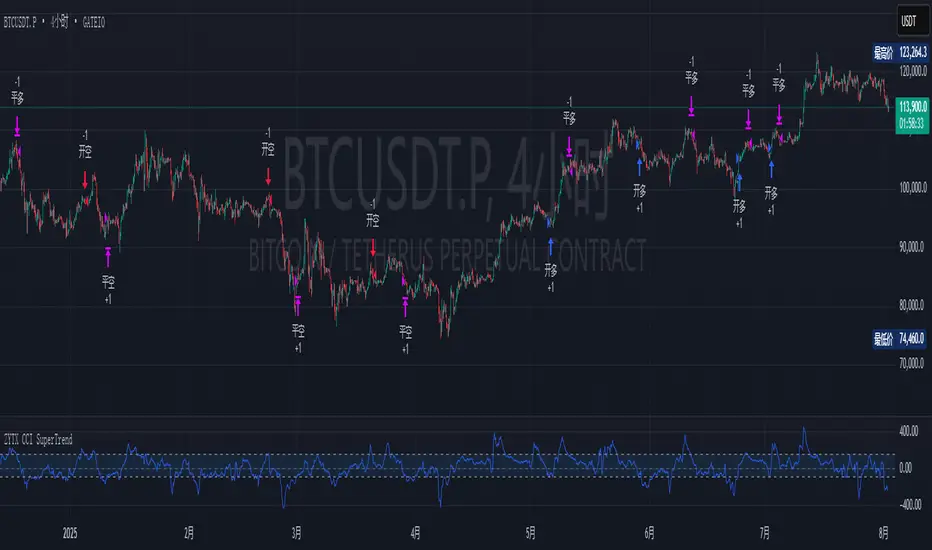
ZYTX CCI SuperTrendZYTX CCI SuperTrend
The definitive integration of CCI and SuperTrend trend-following indicators, delivering exemplary performance in automated trading bots.
ZYTX SuperTrend V1ZYTX SuperTrend V1 Indicator
Multi-strategy intelligent rebalancing with >95% win rate
Enables 24/7 automated trading

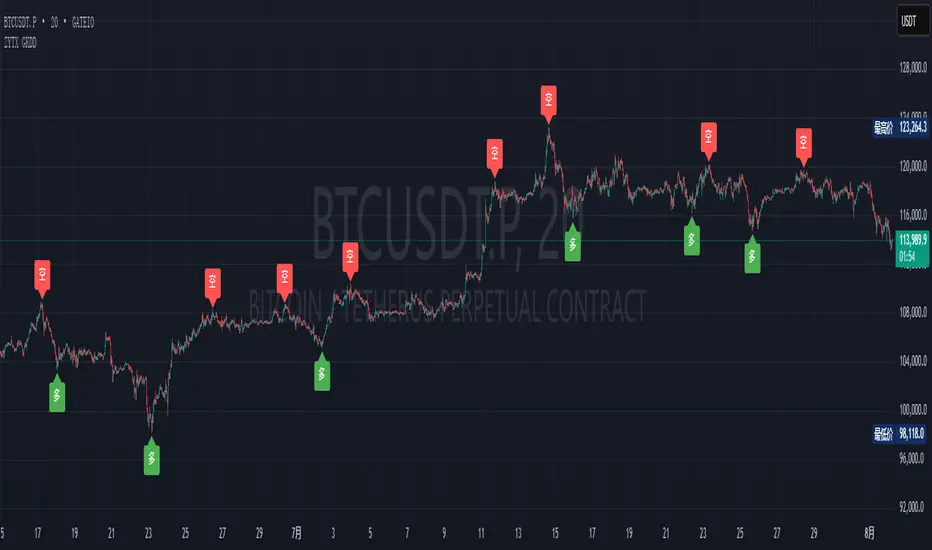
ZYTX GKDDThe ZYTX High-Sell Low-Buy Indicator Strategy is a trend-following indicator that integrates multiple indicator resonances. It demonstrates the perfect performance of an automated trading robot, truly achieving the high-sell low-buy strategy in trading.


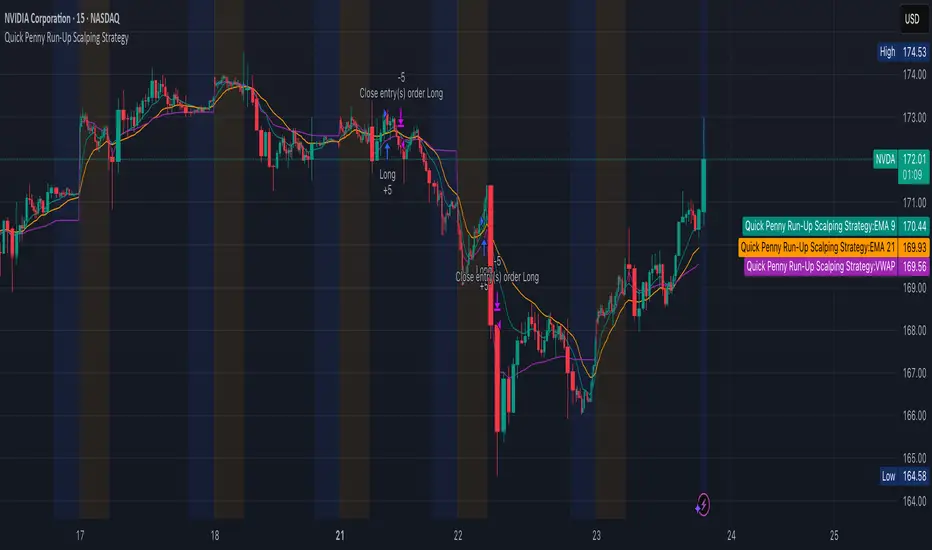
Quick Penny Run-Up Scalping StrategyQuick Penny Run-Up Scalping Strategy. Use it for 15 min within two hours
CVD Divergence + Volume HMA RSI MACD StrategyHow the script works:
The script calculates the HMA for trend direction. The HMA (shown in orange) is used as a filter: long trades are taken only if price is above the HMA, and short trades when below.
The CVD is computed by cumulatively adding volume on up bars and subtracting volume on down bars.
Pivot routines (with the input "Pivot Length") detect swing lows/highs for both price and CVD. A bullish divergence is flagged when the price makes a lower low while the CVD makes a higher low. Similarly, a bearish divergence is flagged when the price makes a higher high while the CVD makes a lower high.
Trading is triggered when the divergence condition also agrees with the HMA filter.
Feel free to further adjust the parameters or add risk‐management/exit rules as needed for your trading style.

Supertrend TP SL (PRO)2. Main Components:
Supertrend Indicator:
Theoretical basis: The Supertrend indicator is based on two main concepts: Average True Range (ATR) and Factor. ATR measures the extent of price fluctuations in a given period of time, while Factor determines the sensitivity of the indicator to price changes.
Mechanism of operation: The indicator calculates two possible lines: one line representing the potential support level and another line representing the potential resistance level. The selection of the appropriate line depends on the current price direction. When the price is above the line, the indicator is considered to be in an uptrend, and vice versa.
Customizable inputs:
atrPeriod: Allows the trader to specify the time period for calculating the ATR. Shorter periods make the indicator more sensitive to price changes, while longer periods reduce its sensitivity.
factor: Allows the adjustment of the factor. Higher values make the indicator less likely to give false signals, but they may also delay entry signals.
Risk Management:
Take Profit and Stop Loss Orders:
TPPoints: Specifies the distance between the entry price and the take profit level. This distance is expressed in points, and is converted to an actual price value using syminfo.mintick (the smallest possible price movement of the traded asset).
SLPoints: Specifies the distance between the entry price and the stop loss level.
Importance: These orders allow the trader to specify the maximum loss he is willing to take and the profit target he is aiming to achieve, which helps in effective risk management.
Activate/Disable Trades:
isLongEnabled: Allows buy trades to be enabled or disabled, which allows the trader to trade in one direction only (for example, only trade in the uptrend during a bull market).
isShortEnabled: Allows sell trades to be enabled or disabled.
isTakeProfitEnabled: Allows take profit orders to be enabled or disabled. The trader may wish to disable them if he prefers to manage his trades manually.
isStopLossEnabled: Allows you to enable or disable stop loss orders. Although disabling them may seem tempting in some cases, it is a very risky move.
Visual Customization:
Line Style and Width:
lineStyle: Allows the trader to choose the style of lines used to draw TP and SL levels (Solid, Dashed, Dotted).
lineWidth: Sets the thickness of the lines.
Label Size:
labelSize: Allows you to set the size of the labels that display TP and SL levels (Small, Normal, Large).
Colors:
bullColor, bearColor, tpColor, slColor: Allows the trader to customize the colors of the different elements on the chart, making visual analysis easier.
3. Strategy Logic:
Determining Entry Signals: The strategy relies on the Supertrend indicator to determine entry signals. When the Supertrend trend changes from bearish to bullish, a buy trade is triggered (if isLongEnabled is enabled). When the trend changes from bullish to bearish, a sell trade is triggered (if isShortEnabled is enabled).
Order Execution: Once the entry signal is triggered, the strategy automatically places buy or sell orders.
Trade Management: After opening a trade, the strategy monitors the price and automatically triggers Take Profit and Stop Loss orders if the price reaches the specified levels.
Visualization: The strategy displays useful information on the chart, such as TP and SL lines, entry and exit signals, which helps the trader understand the strategy’s behavior and evaluate its performance.
4. Advanced Tips:
Optimizing Settings: The strategy’s performance can be improved by adjusting different input values. For example, the trader can experiment with different values for atrPeriod and factor to improve the accuracy of Supertrend signals.
Combining Indicators: This strategy can be combined with other indicators to improve the accuracy of entry signals. For example, the Relative Strength Index (RSI) can be used to confirm Supertrend signals.
Time Analysis: The strategy’s performance can be analyzed over different time periods to evaluate its effectiveness in various market conditions.
Strategy Testing: Before using the strategy in real trading, it should be tested on historical data (Backtesting) to evaluate its performance and determine the optimal settings.
5. Associated Risks:
False Signals: The Supertrend indicator may sometimes give false signals, especially in volatile markets.
Losses: Even with the use of stop loss orders, the trader may be exposed to significant losses.
Over-optimization: Over-optimization of settings on historical data may lead to misleading results. The trader should be careful about generalizing the results to future data.
Over-reliance on automation: The automated strategy should not be relied upon completely. The trader should monitor the trades and make appropriate decisions when necessary.
6. Disclaimer:
I am not a licensed financial advisor. This strategy is provided for educational and illustrative purposes only and should not be considered as investment advice. Trading in financial markets involves significant risks and you may lose your invested capital. Before making any investment decisions, consult a qualified financial advisor and conduct your own research. You alone are responsible for your trading decisions and their results. By using this strategy, you acknowledge and agree that I am not responsible for any losses or damages you may incur.
2. المكونات الرئيسية:
مؤشر Supertrend:
الأساس النظري: يعتمد مؤشر Supertrend على مفهومين رئيسيين هما: متوسط المدى الحقيقي (Average True Range - ATR) ومعامل الضرب (Factor). ATR يقيس مدى تقلبات الأسعار في فترة زمنية محددة، بينما Factor يحدد مدى حساسية المؤشر لتغيرات الأسعار.
آلية العمل: يقوم المؤشر بحساب خطين محتملين: خط يمثل مستوى الدعم المحتمل وخط آخر يمثل مستوى المقاومة المحتمل. يعتمد اختيار الخط المناسب على اتجاه السعر الحالي. عندما يكون السعر أعلى من الخط، يعتبر المؤشر في اتجاه صاعد، والعكس صحيح.
المدخلات القابلة للتخصيص:
atrPeriod: يتيح للمتداول تحديد الفترة الزمنية لحساب ATR. الفترات الأقصر تجعل المؤشر أكثر حساسية لتغيرات الأسعار، بينما الفترات الأطول تقلل من حساسيته.
factor: يسمح بتعديل معامل الضرب. القيم الأعلى تجعل المؤشر أقل عرضة لإعطاء إشارات خاطئة، ولكنها قد تؤخر أيضًا إشارات الدخول.
إدارة المخاطر:
أوامر جني الأرباح وإيقاف الخسارة:
TPPoints: يحدد المسافة بين سعر الدخول ومستوى جني الأرباح. يتم التعبير عن هذه المسافة بالنقاط (Points)، ويتم تحويلها إلى قيمة سعرية فعلية باستخدام syminfo.mintick (أصغر حركة سعرية ممكنة للأصل المتداول).
SLPoints: يحدد المسافة بين سعر الدخول ومستوى إيقاف الخسارة.
الأهمية: تتيح هذه الأوامر للمتداول تحديد الحد الأقصى للخسارة التي يرغب في تحملها والهدف الربحي الذي يسعى لتحقيقه، مما يساعد على إدارة المخاطر بشكل فعال.
تفعيل/تعطيل الصفقات:
isLongEnabled: يسمح بتفعيل أو تعطيل صفقات الشراء، مما يمكن المتداول من التداول في اتجاه واحد فقط (على سبيل المثال، التداول فقط في الاتجاه الصاعد خلال سوق صاعدة).
isShortEnabled: يسمح بتفعيل أو تعطيل صفقات البيع.
isTakeProfitEnabled: يسمح بتفعيل أو تعطيل أوامر جني الأرباح. قد يرغب المتداول في تعطيلها إذا كان يفضل إدارة صفقاته يدويًا.
isStopLossEnabled: يسمح بتفعيل أو تعطيل أوامر إيقاف الخسارة. على الرغم من أن تعطيلها قد يبدو مغريًا في بعض الحالات، إلا أنه يعتبر خطوة محفوفة بالمخاطر للغاية.
التخصيص المرئي:
نمط وعرض الخطوط:
lineStyle: يتيح للمتداول اختيار نمط الخطوط المستخدمة لرسم مستويات TP و SL (Solid, Dashed, Dotted).
lineWidth: يحدد سمك الخطوط.
حجم الملصقات:
labelSize: يسمح بتحديد حجم الملصقات التي تعرض مستويات TP و SL (Small, Normal, Large).
الألوان:
bullColor, bearColor, tpColor, slColor: تتيح للمتداول تخصيص ألوان العناصر المختلفة على الرسم البياني، مما يسهل عملية التحليل البصري.
3. منطق عمل الاستراتيجية:
تحديد إشارات الدخول: تعتمد الاستراتيجية على مؤشر Supertrend لتحديد إشارات الدخول. عندما يتغير اتجاه Supertrend من هابط إلى صاعد، يتم تفعيل صفقة شراء (إذا كانت isLongEnabled مفعلة). وعندما يتغير الاتجاه من صاعد إلى هابط، يتم تفعيل صفقة بيع (إذا كانت isShortEnabled مفعلة).
تنفيذ الأوامر: بمجرد تفعيل إشارة الدخول، تقوم الاستراتيجية بوضع أوامر الشراء أو البيع تلقائيًا.
إدارة الصفقات: بعد فتح الصفقة، تقوم الاستراتيجية بمراقبة السعر وتفعيل أوامر جني الأرباح وإيقاف الخسارة تلقائيًا في حالة وصول السعر إلى المستويات المحددة.
التمثيل المرئي: تعرض الاستراتيجية معلومات مفيدة على الرسم البياني، مثل خطوط TP و SL وإشارات الدخول والخروج، مما يساعد المتداول على فهم سلوك الاستراتيجية وتقييم أدائها.
4. نصائح متقدمة:
تحسين الإعدادات: يمكن تحسين أداء الاستراتيجية من خلال تعديل قيم المدخلات المختلفة. على سبيل المثال، يمكن للمتداول تجربة قيم مختلفة لـ atrPeriod و factor لتحسين دقة إشارات Supertrend.
الجمع بين المؤشرات: يمكن دمج هذه الاستراتيجية مع مؤشرات أخرى لتحسين دقة إشارات الدخول. على سبيل المثال، يمكن استخدام مؤشر القوة النسبية (RSI) لتأكيد إشارات Supertrend.
التحليل الزمني: يمكن تحليل أداء الاستراتيجية على مدى فترات زمنية مختلفة لتقييم مدى فعاليتها في ظروف السوق المتنوعة.
اختبار الاستراتيجية: قبل استخدام الاستراتيجية في التداول الحقيقي، يجب اختبارها على بيانات تاريخية (Backtesting) لتقييم أدائها وتحديد الإعدادات المثلى.
5. المخاطر المرتبطة:
الإشارات الخاطئة: قد يعطي مؤشر Supertrend إشارات خاطئة في بعض الأحيان، خاصة في الأسواق المتقلبة.
الخسائر: حتى مع استخدام أوامر إيقاف الخسارة، قد يتعرض المتداول لخسائر كبيرة.
التحسين المفرط: قد يؤدي التحسين المفرط للإعدادات على بيانات تاريخية إلى نتائج مضللة. يجب أن يكون المتداول حذرًا بشأن تعميم النتائج على البيانات المستقبلية.
الاعتماد الزائد على الأتمتة: يجب عدم الاعتماد بشكل كامل على الاستراتيجية الآلية. يجب على المتداول مراقبة الصفقات واتخاذ القرارات المناسبة عند الضرورة.
6. إخلاء المسؤولية:
أنا لست مستشارًا ماليًا مرخصًا. هذه الاستراتيجية مقدمة لأغراض تعليمية وتوضيحية فقط، ولا ينبغي اعتبارها نصيحة استثمارية. التداول في الأسواق المالية ينطوي على مخاطر كبيرة، وقد تخسر رأس المال المستثمر. قبل اتخاذ أي قرارات استثمارية، استشر مستشارًا ماليًا مؤهلاً وقم بإجراء بحثك الخاص. أنت وحدك المسؤول عن قراراتك التجارية ونتائجها. باستخدام هذه الاستراتيجية، فإنك تقر وتوافق على أنني لست مسؤولاً عن أي خسائر أو أضرار قد تتكبدها.

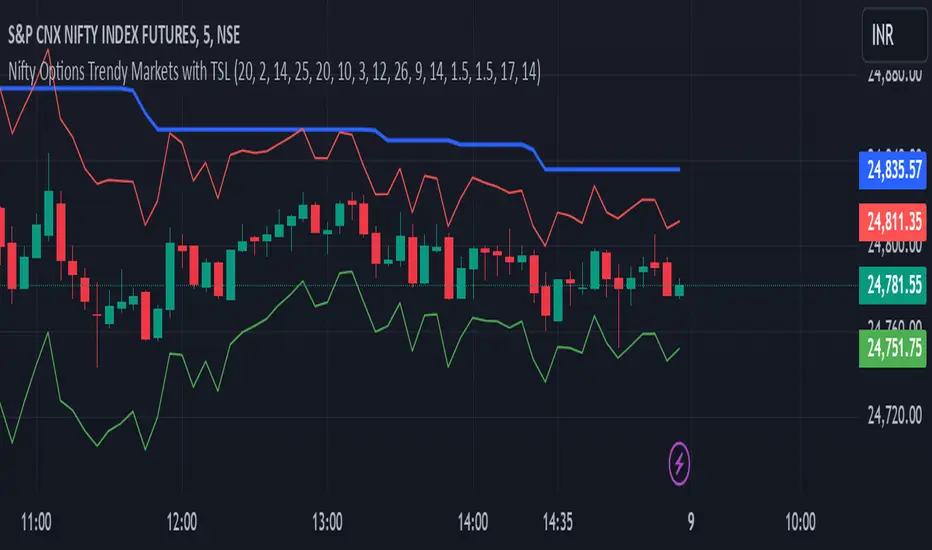
Nifty Options Trendy Markets with TSLNifty options strategy that works on volume, technical analysis etc
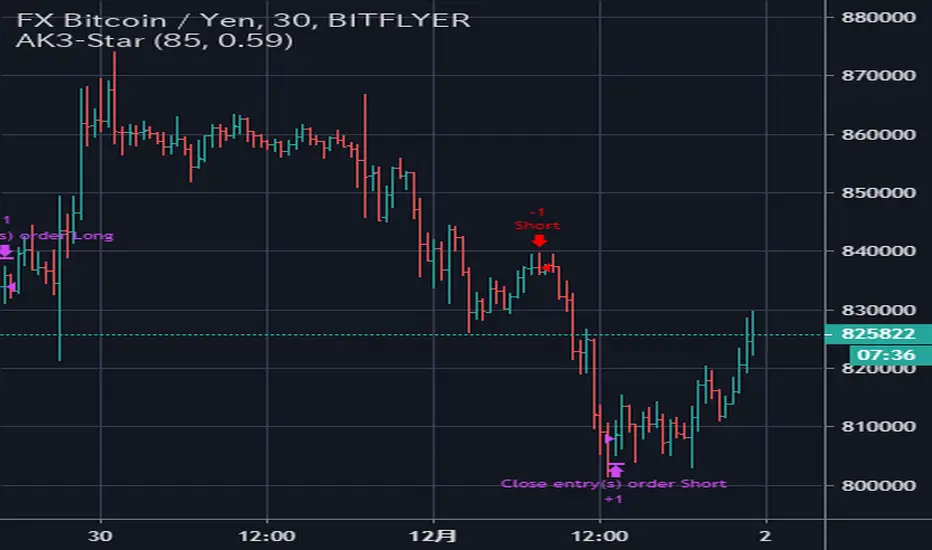
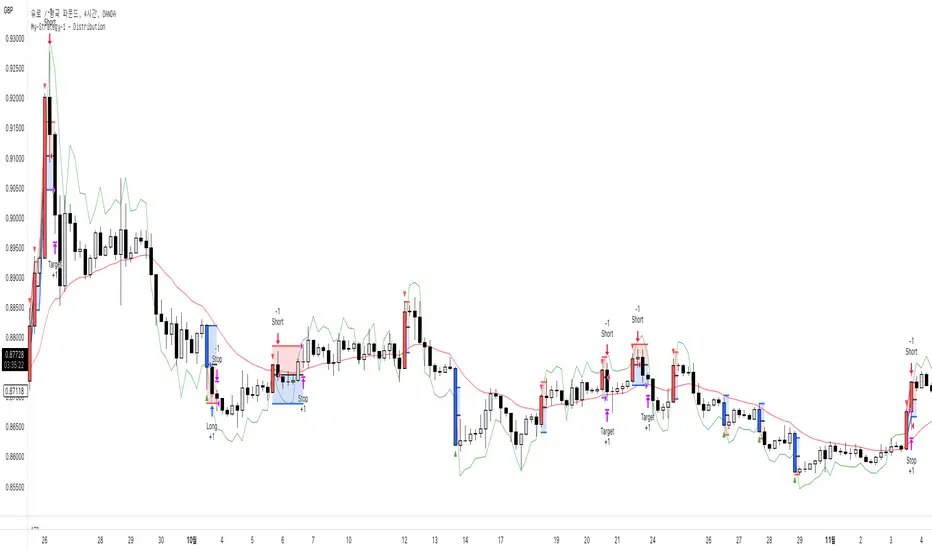
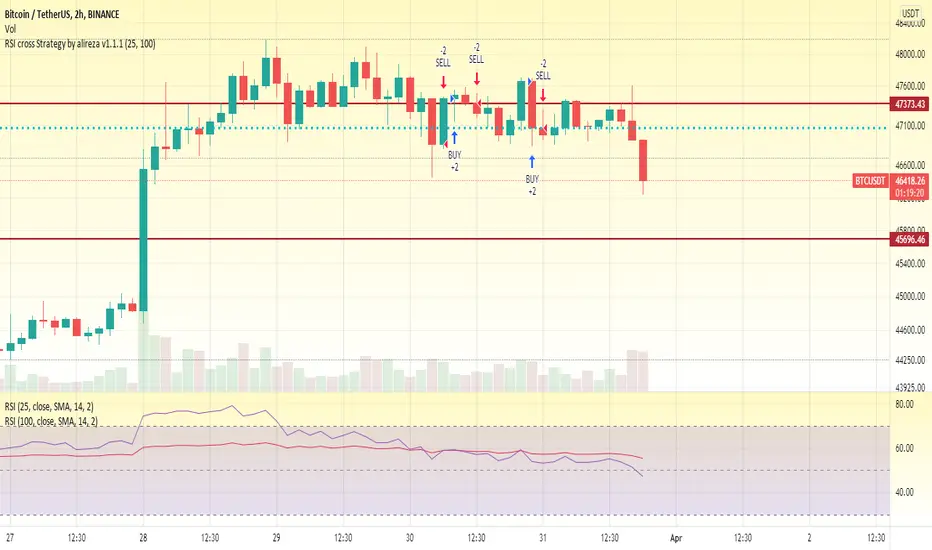
KT Litmus2
Hello everyone,
Recently I saw a very good indicator on TV called Ichimoku Oscillator. This is a K-line convergence and divergence indicator similar to MACD. After backtesting research, this indicator performs well on long-term trends.
Since it is an indicator, it is made into a strategy category. Several optimizations have also been made.
This strategy takes into account the following market factors:
EMA -> Trend
Fast line - slow line -> moving average
EMA Squeeze -> Momentum Conversion, Trend
ATR -> Noise Reduction
How does it compare to the original indicator?
Optimized background display so the canvas doesn't feel cluttered with excessive colors.
Optimized part of the position reduction logic so that too many trading signals will not affect the performance of the strategy.
NOTE: As you can see, there are potential improvements that can be made by merging volumes.
Signal
Input level -> Kinetic energy enhancement, +4 long, -4 short
Partial exit level -> moving average (EMA | fast and slow line) crossing, trend unchanged
All exit levels -> trend conversion
Risk Management
"Trend Stop Loss" and "Momentum Take Profit" are used here.
Trend stop loss: Use the conversion of the strategy trend parameter wave range to close the order.
Momentum take profit: take advantage of the weakening or reverse trend momentum of the strategy to take profit.
As described, the strategy has obvious advantages in trend trading, but in volatile markets, stop loss may be triggered due to frequent signals.
Now, a set of knowledge is provided for the inexperienced reader.
MACD usually consists of three components. The MACD line is the fast exponential moving average (usually taken on the 12th day) minus the slow exponential moving average (usually taken on the 26th day), generally called the difference (DIF). The second line is the signal line, which is the exponential moving average of DIF (usually 9 days), generally called DEA. The last component is the MACD histogram, whose value is the difference between DIF and DEA. However, the time value of the MACD indicator can also be adjusted according to the trader's preference and trading category.
The underlying logic of DIF is that the short-term exponential moving average reflects current price movements, while the long-term EMA reflects earlier price movements. Therefore, if there is a large gap between these two EMAs, then the market is trending up or down. While the MACD histogram is oscillating around the zero line, indicating the strength of the trend.
EMA: Exponential Moving Average; similar to a simple moving average but exponentially weights the input data.
Sincerely,
salute
---
Acknowledgments:
@LonesomeTheBlue
renew
March 14
Strategies for increasing Python version

simple pull back TJlv26This is a very simple strategy for swing trade in stock indexes.
this strategy only trade long position, recommend to use this in day chart of sp500 or nas100.
SPX
NDX
Buy condition:
close price above long term SMA(default period 200),close price under short term SMA(default period 10), RSI is under 30(default period 3)
Sell condition:
1:if close price is above short period SMA and current close price is lower than low price of previous bar
2:hit the take profit target(default value 10%)
3:hit the stop loss target(default value 5%)
from author:
As you can see, it's a very simple logic. You only start trading when the price is above long-term moving average, so you can avoid risk by taking positions only in the uptrend. You also use stop-loss, so even in situations where there is a significant downturn, you can minimize losses.
However, it's important to note that this strategy performs well only in markets where long-term (approximately 10 years) upward movements are expected. It often yields disappointing results during prolonged bear markets. This is where each user's fundamental analysis comes into play, as there is no such thing as a perfect trading logic.
Another noteworthy point is that, as seen in the results of back testing, this strategy tends to underperform buy-and-hold in most cases. As mentioned earlier, it's a strategy focused on risk mitigation and starting trades at the most advantageous prices, so I believe that using leverage of 2-4 times can maximize profits. However, trading with leverage is highly risky, so it should be assessed based on each individual's risk tolerance.

Merovinh - Mean Reversion Lowest lowThe "Merovinh - Mean Reversion Lowest Low" strategy is a mean reversion trading approach that aims to identify potential reversal points based on the updated lowest low of the specified number of bars. This strategy focuses on the detection of bullish price movements. Works well on Tech giant's shares.
Strategy Overview:
The strategy detects the lowest low and highest high over a specified number of bars.
It uses a mean reversion concept where it expects the price to revert back towards the updated lowest low.
The strategy enters a long position when the current lowest low breaks the previous lowest low (based on the specified number of broken lows).
It closes the long position when the highest high breaks the previous highest high.
The strategy aims to capitalize on potential reversals in the market by buying at lower price levels and selling at higher price levels.
Strategy Parameters:
Minimum number of bars: Specifies the minimum number of bars considered for calculating the lowest low and highest high.
Number of broken lows: Determines the number of previous lows that need to be broken for entering a long position.
How It Works:
The strategy calculates the lowest low and highest high based on the specified number of bars.
It compares the current lowest low with the previous lowest low.
If the current lowest low breaks the previous lowest low (based on the specified number of broken lows), a long position is entered.
The strategy continuously updates the previous lows and highs.
It closes the long position if the highest high breaks the previous highest high.

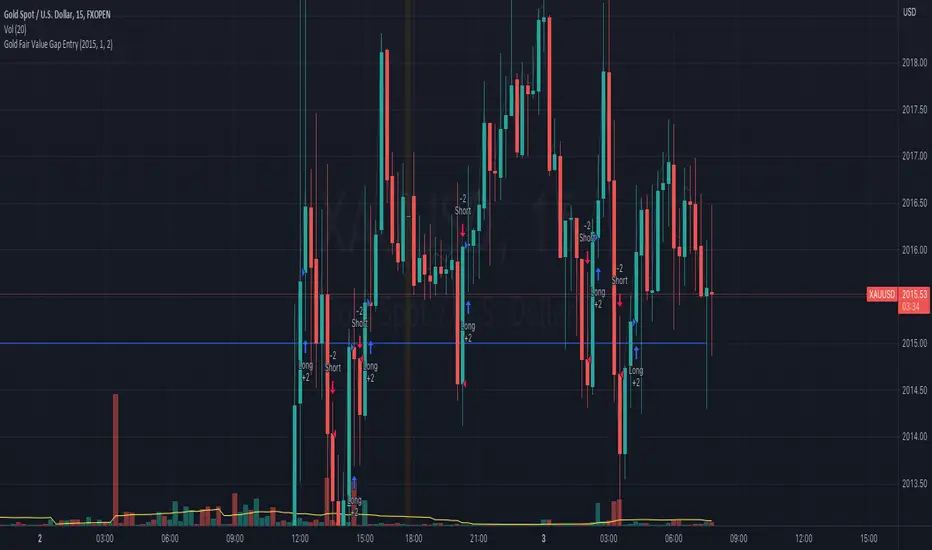
Gold Fair Value Gap Entry(FVG GOLD)This script calculates the fair value of gold, which is set as an input parameter. It then gets the current price of gold and calculates the gap between the price and the fair value. If the gap is positive, it enters a long trade, and if it's negative, it enters a short trade.
The script also uses proper risk management techniques by setting a stop loss and take profit for each trade. The plot() function is used to display the fair value and gap on the chart.
Please note that this is just an example script, and you should customize it based on your specific trading strategy and criteria. It's also important to backtest your strategy and refine it before using it with real money.
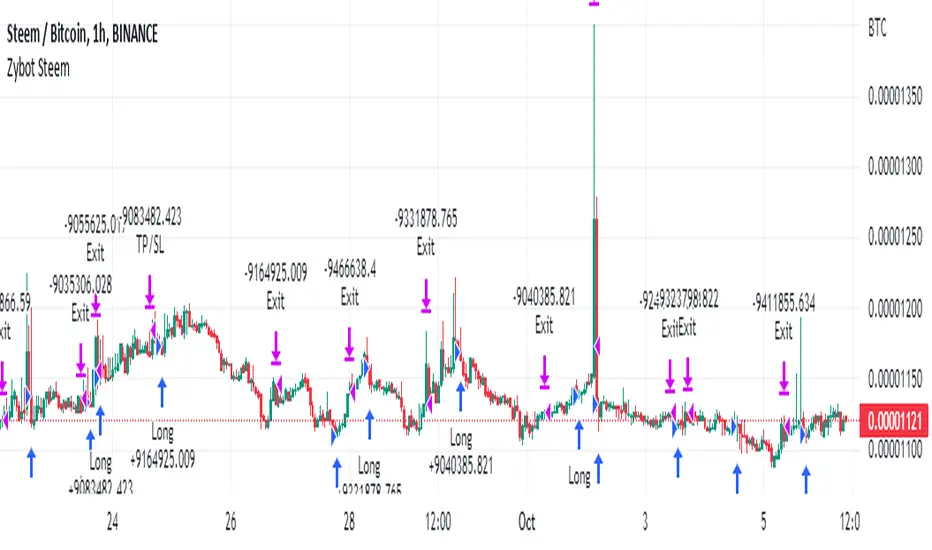
My Strategy to Multiply Bitcoin 99x Using ZYBOT STEEM IndicatorMy Strategy to Multiply Bitcoin 99x Using ZYBOT STEEM Indicator
Crazy IBSThis is a mean reversion strategy using the IBS indicator, which calculates ratios of h/l/c/o. It does well particularly on NQ and VXX, but try it on other things! It tends to outperform other R2M strategies like RSI and BB mean reversion, at least in early 2022.

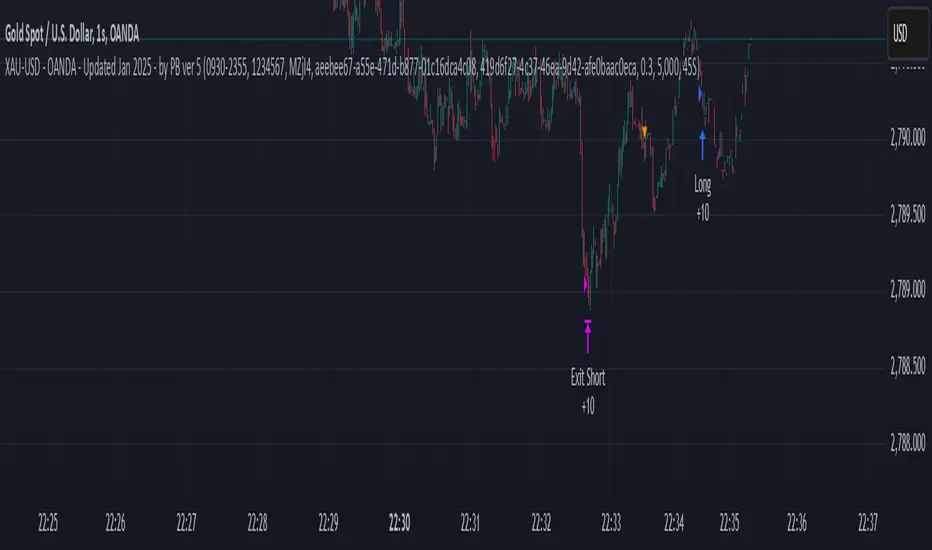
XAU-USD - OANDA - Updated Jan 2025 - by PB ver 5Script Title: XAU-USD - OANDA - Updated Jan 2025 - by PB ver 5
Description:
This strategy is designed for trading XAU/USD (Gold) on the OANDA platform, optimized with a session-based filter and Renko bar indicators for enhanced price action analysis. The script utilizes trailing stop loss functionality to manage risk effectively and allows flexibility for both long and short trades.
Key Features:
Date Filter: This strategy includes a time filter to backtest the performance from January 1st, 2025 to December 31st, 2025. Users can enable or disable the filter based on their preference.
Session Filter: Customizable session inputs allow the user to define the active trading session using a time range (default is 09:20-15:16) and the days of the week (default is all days, 1-7). The strategy will only enter trades during the active session, ensuring more controlled and focused trading.
Renko Bar Strategy: This strategy uses Renko charts, a popular price action tool, to detect buy and sell signals based on the crossover of Renko close and open prices. Users can adjust the Renko block size and the Renko value used for detecting price action shifts.
Trailing Stops: The script applies a trailing stop loss mechanism for both long and short trades. The trailing stop is dynamically updated to follow the market as prices move in favor of the trade. It uses a 5000-point trailing stop (adjustable by the user).
Flexible Trade Settings: Users can enable or disable long and short positions through simple toggle switches. The strategy allows for full control over trade entry and exit.
How It Works:
Long Trades: A long position is entered when the Renko close crosses above the Renko open. The position will be exited using a trailing stop, which follows the price in the market.
Short Trades: A short position is entered when the Renko close crosses below the Renko open. The position will also exit using a trailing stop.
The strategy will automatically close positions if the session ends or if the user manually exits the trades.
Customization Options:
Backtest Date Range: Set the start and end dates to backtest the strategy over a specific time period.
Session and Days: Adjust the session time and which days of the week the strategy is active.
Renko Block Size: Customize the Renko block size for finer control over price action signals.
Trailing Stop Distance: Adjust the trailing stop loss to your preferred risk levels.
Limitations and Considerations:
Renko Charting: Renko charts may not suit every trading style, as they are based on price movement rather than time. This strategy is designed for traders who prefer this style of charting.
Backtest Results: Always review the strategy's backtest results with realistic parameters. The strategy uses historical data, and past performance is not indicative of future results. Be aware of slippage and commission costs in real-world trading scenarios.
Manual Intervention: Users should monitor active trades and intervene manually if required.
Ideal Usage:
This strategy is suited for traders looking to use price action-based strategies with Renko charts for XAU/USD on the OANDA platform.
Ideal for those who want to automate their entry and exit points with trailing stop mechanisms while having control over the session time and backtesting period.
Disclaimer:
Past performance does not guarantee future results. Always use caution when using trading strategies and adjust parameters based on market conditions. The strategy is provided for educational purposes and should be tested on paper before live trading.
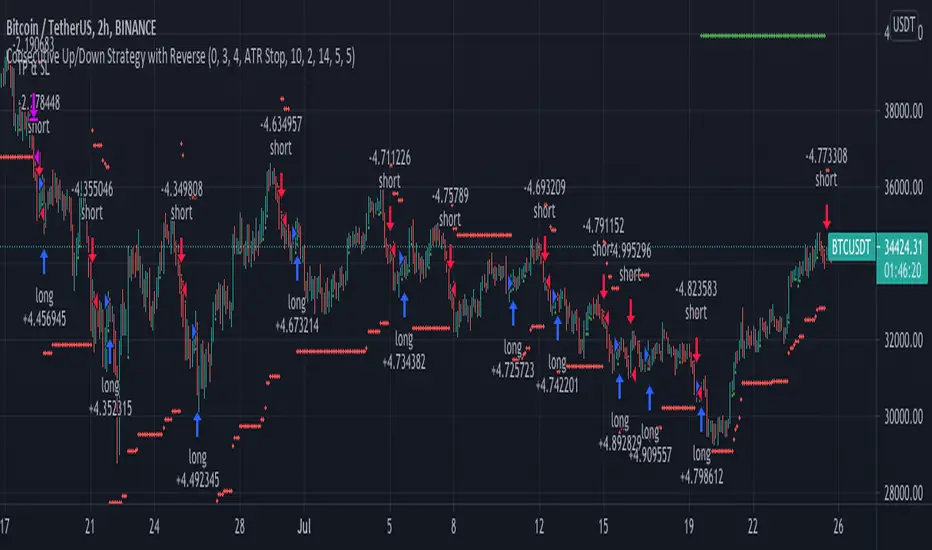
Consecutive Up/Down Strategy with Reverse and SLExtension of the built-in strategy by TradingView. The strategy buys after an X amount of
consecutive bullish bars and viceversa for selling. This logic can be reversed and a Stop Loss
with Take Profit can be added. There's also an option to adapt the SL into a Trailing Stop.