xGhozt Consecutive Candle Count - BacktestxGhozt Consecutive Candle Count with Backtest simply counts consecutive positive or negative candles, and allows you to get the live statistics of how many times this consecutive candle series occurred in the past, with the probabilities of the next candle to be a reversal, and the average past gains from that reversal. You can select the number of consecutive candles you're tracking, and select a start and end date. When your desired pattern is met by the indicator, it will indicate you on the chart if it's worth shorting or longing the next candle.
You also have the possibility to set up alerts when your consecutive candles patterns are met. To do so, go into the indicator's settings, select your time frame, the consecutive number of candles you are tracking, your success rate, and the number this pattern occurred in the past. Once it's done, open the alerts box, and set up your alerts accordingly.
You will have 2 options:
- Green Candles Followed by Red = short next candle.
- Red Candles Followed by Green = long next candle
Now that the backtest is added, you can try different combinations and figure the best outcome to get the best returns!
One thing to note with the backtest: you cannot run the backtest with take profits / stop loss AND candle closing, it has to be one of the two.
Search in scripts for "candle"

EMA 5 Alert Candle ShortThe 5 EMA (Exponential Moving Average) Strategy is a simple yet effective trading strategy that helps traders identify short-term trends and potential entry and exit points. This strategy is widely used in intraday and swing trading, particularly in forex, stocks, and crypto markets.
Components of the 5 EMA Strategy
5 EMA: A fast-moving average that reacts quickly to price movements.
15-minute or 1-hour timeframe (commonly used, but adaptable to other timeframes).
Candlestick Patterns: To confirm entry signals.
How the 5 EMA Strategy Works
Buy (Long) Setup:
Price Above the 5 EMA: The price should be trading above the 5 EMA.
Pullback to the 5 EMA: A minor retracement or consolidation near the 5 EMA.
Bullish Candlestick Confirmation: A bullish candle (e.g., engulfing or pin bar) forms near the 5 EMA.
Entry: Enter a long trade at the close of the bullish candle.
Stop Loss: Place below the recent swing low or 5-10 pips below the 5 EMA.
Take Profit: Aim for a risk-reward ratio of at least 1:2 or trail the stop using a higher EMA (e.g., 10 or 20 EMA).
Sell (Short) Setup:
Price Below the 5 EMA: The price should be trading below the 5 EMA.
Pullback to the 5 EMA: A small retracement towards the 5 EMA.
Bearish Candlestick Confirmation: A bearish candle (e.g., engulfing or pin bar) near the 5 EMA.
Entry: Enter a short trade at the close of the bearish candle.
Stop Loss: Place above the recent swing high or 5-10 pips above the 5 EMA.
Take Profit: Aim for a 1:2 risk-reward ratio or use a trailing stop.
Additional Filters for Better Accuracy
Higher Timeframe Confirmation: Check the trend on a higher timeframe (e.g., 1-hour or 4-hour).
Volume Confirmation: Enter trades when volume is increasing.
Avoid Sideways Market: Use the strategy only when the market is trending.
Advantages of the 5 EMA Strategy
✔️ Simple and easy to use.
✔️ Works well in trending markets.
✔️ Helps traders capture short-term momentum.
Disadvantages
❌ Less effective in choppy or sideways markets.
❌ Requires discipline in following stop-loss rules.

Candle Emotion Index (CEI) StrategyThe Candle Emotion Index (CEI) Strategy is an innovative sentiment-based trading approach designed to help traders identify and capitalize on market psychology. By analyzing candlestick patterns and combining them into a unified metric, the CEI Strategy provides clear entry and exit signals while dynamically managing risk. This strategy is ideal for traders looking to leverage market sentiment to identify high-probability trading opportunities.
How It Works
The CEI Strategy is built around three core oscillators that reflect key emotional states in the market:
Indecision Oscillator . Measures market uncertainty using patterns like Doji and Spinning Tops. High values indicate hesitation, signaling potential turning points.
Fear Oscillator . Tracks bearish sentiment through patterns like Shooting Star, Hanging Man, and Bearish Engulfing. Helps identify moments of intense selling pressure.
Greed Oscillator . Detects bullish sentiment using patterns like Marubozu, Hammer, Bullish Engulfing, and Three White Soldiers. Highlights periods of strong buying interest.
These oscillators are averaged into the Candle Emotion Index (CEI):
CEI = (Indecision + Fear + Greed) / 3
This single value quantifies overall market sentiment and drives the strategy’s trading decisions.
Key Features
Sentiment-Based Trading Signals . Long Entry: Triggered when the CEI crosses above a lower threshold (e.g., 0.1), indicating increasing bullish sentiment. Short Entry: Triggered when the CEI crosses above a higher threshold (e.g., 0.2), signaling rising bearish sentiment.
Volume Confirmation . Trades are validated only if volume exceeds a user-defined multiplier of the average volume over the lookback period. This ensures entries are backed by significant market activity.
Break-Even Recovery Mechanism . If a trade moves into a loss, the strategy attempts to recover to break-even instead of immediately exiting at a loss. This feature provides flexibility, allowing the market to recover while maintaining disciplined risk management.
Dynamic Risk Management . Maximum Holding Period: Trades are closed after a user-defined number of candles to avoid overexposure to prolonged uncertainty. Profit-Taking Conditions: Positions are exited when favorable price moves are confirmed by increased volume, locking in gains. Loss Threshold: Trades are exited early if the price moves unfavorably beyond a set percentage of the entry price, limiting potential losses.
Cooldown Period . After a trade is closed, a cooldown period prevents immediate re-entry, reducing overtrading and improving signal quality.
Why Use This Strategy?
The CEI Strategy combines advanced sentiment analysis with robust trade management, making it a powerful tool for traders seeking to understand market psychology and identify high-probability setups. Its unique features, such as the break-even recovery mechanism and volume confirmation, add an extra layer of discipline and reliability to trading decisions.
Best Practices
Combine with Other Indicators . Use trend-following tools (e.g., moving averages, ADX) and momentum oscillators (e.g., RSI, MACD) to confirm signals.
Align with Key Levels . Incorporate support and resistance levels for refined entries and exits.
Multi-Market Compatibility . Apply this strategy to forex, crypto, stocks, or any asset class with strong volume and price action.

Candle checker for long/short for scalping/day tradingHey.
This strategy is still in working.
For it I check a x amount of candles in the past if they been for example all red/green in row, and based on that I enter. For example candle 7 < candle 6 .... candle 3 < candle 2 .... candle 1 < candle current for long and viceversa for short.
After that,once the trade is initiated, I exit based on 2 possibilities : candle color is different than the color of candle when entry, or based tp/sl.
Let me know what you think of it.
I will try to make the process to calculate automatically and input the number of candles to check like 5-10-15 and so on.

3 Candle Strike StretegyMainly developed for AMEX:SPY trading on 1 min chart. But feel free to try on other tickers.
Basic idea of this strategy is to look for 3 candle reversal pattern within trending market structure. The 3 candle reversal pattern consist of 3 consecutive bullish or bearish candles,
followed by an engulfing candle in the opposite direction. This pattern usually signals a reversal of short term trend. This strategy also uses multiple moving averages to filter long or short
entries. ie. if the 21 smoothed moving average is above the 50, only look for long (bullish) entries, and vise versa. There is option change these moving average periods to suit your needs.
I also choose to use Linear Regression to determine whether the market is ranging or trending. It seems the 3 candle pattern is more successful under trending market. Hence I use it as a filter.
There is also an option to combine this strategy with moving average crossovers. The idea is to look for 3 candle pattern right after a fast moving average crosses over a slow moving average.
By default , 21 and 50 smoothed moving averages are used. This gives additional entry opportunities and also provides better results.
This strategy aims for 1:3 risk to reward ratio. Stop losses are calculated using the closest low or high values for long or short entries, respectively, with an offset using a percentage of
the daily ATR value. This allows some price fluctuation without being stopped out prematurely. Price target is calculated by multiplying the difference between the entry price and the stop loss
by a factor of 3. When price target is reach, this strategy will set stop loss at the price target and wait for exit condition to maximize potential profit.
This strategy will exit an order if an opposing 3 candle pattern is detected, this could happen before stop loss or price target is reached, and may also happen after price target is reached.
*Note that this strategy is designed for same day SPY option scalping. I haven't determined an easy way to calculate the # of contracts to represent the equivalent option values. Plus the option
prices varies greatly depending on which strike and expiry that may suits your trading style. Therefore, please be mindful of the net profit shown. By default, each entry is approximately equal
to buying 10 of same day or 1 day expiry call or puts at strike $1 - $2 OTM. This strategy will close all open trades at 3:45pm EST on Mon, Wed, and Fri.
**Note that this strategy also takes into account of extended market data.
***Note pyramiding is set to 2 by default, so it allows for multiple entries on the way towards price target.
Remember that market conditions are always changing. This strategy was only able to be back-tested using 1 month of data. This strategy may not work the next month. Please keep that in mind.
Also, I take no credit for any of the indicators used as part of this strategy.
Enjoy~

Close Above/Below Prev 2 Candle Strategy (Any Timeframe)Title: Close Above/Below Previous 2 Candle Strategy (Any Timeframe)
Description:
This strategy identifies potential breakout and trend continuation signals by analyzing the closing price relative to the highs and lows of the previous two candles. It works on any chart timeframe, making it versatile for intraday, swing, and daily trading.
How it works:
Long Entry (Bullish Signal): Triggered when the current candle closes above the highs of the previous two candles.
Short Entry (Bearish Signal): Triggered when the current candle closes below the lows of the previous two candles.
Visual Indicators:
Green triangles above the bar indicate bullish signals.
Red triangles below the bar indicate bearish signals.
Strategy Features:
Works on any timeframe, from 1-minute charts to daily/weekly charts.
Configurable risk/reward ratio for automatic stop-loss and take-profit levels.
Alerts trigger immediately when the condition is met, helping traders react to potential breakouts.
Provides clean visual signals for easy chart reading and decision-making.
Benefits:
Reduces noise by focusing on candle close confirmations.
Versatile and suitable for intraday, swing, and long-term trading.
Easy to combine with other indicators or strategies.

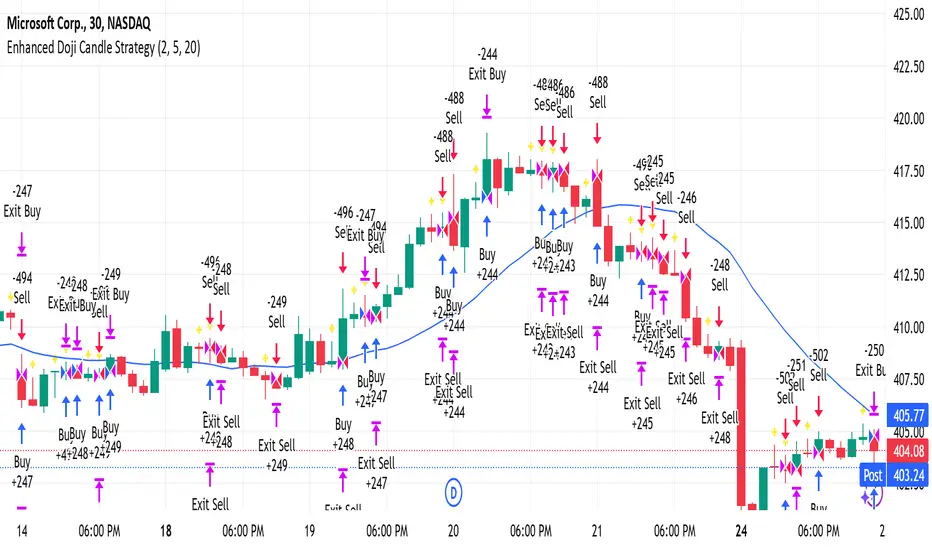
Enhanced Doji Candle StrategyYour trading strategy is a Doji Candlestick Reversal Strategy designed to identify potential market reversals using Doji candlestick patterns. These candles indicate indecision in the market, and when detected, your strategy uses a Simple Moving Average (SMA) with a short period of 20 to confirm the overall market trend. If the price is above the SMA, the trend is considered bullish; if it's below, the trend is bearish.
Once a Doji is detected, the strategy waits for one or two consecutive confirmation candles that align with the market trend. For a bullish confirmation, the candles must close higher than their opening price without significant bottom wicks. Conversely, for a bearish confirmation, the candles must close lower without noticeable top wicks. When these conditions are met, a trade is entered at the market price.
The risk management aspect of your strategy is clearly defined. A stop loss is automatically placed at the nearest recent swing high or low, with a tighter distance of 5 pips to allow for more trading opportunities. A take-profit level is set using a 2:1 reward-to-risk ratio, meaning the potential reward is twice the size of the risk on each trade.
Additionally, the strategy incorporates an early exit mechanism. If a reversal Doji forms in the opposite direction of your trade, the position is closed immediately to minimize losses. This strategy has been optimized to increase trade frequency by loosening the strictness of Doji detection and confirmation conditions while still maintaining sound risk management principles.
The strategy is coded in Pine Script for use on TradingView and uses built-in indicators like the SMA for trend detection. You also have flexible parameters to adjust risk levels, take-profit targets, and stop-loss placements, allowing you to tailor the strategy to different market conditions.
EMA Crossover Strategy with Take Profit and Candle HighlightingStrategy Overview:
This strategy is based on the Exponential Moving Averages (EMA), specifically the EMA 20 and EMA 50. It takes advantage of EMA crossovers to identify potential trend reversals and uses multiple take-profit levels and a stop-loss for risk management.
Key Components:
EMA Crossover Signals:
Buy Signal (Uptrend): A buy signal is generated when the EMA 20 crosses above the EMA 50, signaling the start of a potential uptrend.
Sell Signal (Downtrend): A sell signal is generated when the EMA 20 crosses below the EMA 50, signaling the start of a potential downtrend.
Take Profit Levels:
Once a buy or sell signal is triggered, the strategy calculates multiple take-profit levels based on the range of the previous candle. The user can define multipliers for each take-profit level.
Take Profit 1 (TP1): 50% of the previous candle's range above or below the entry price.
Take Profit 2 (TP2): 100% of the previous candle's range above or below the entry price.
Take Profit 3 (TP3): 150% of the previous candle's range above or below the entry price.
Take Profit 4 (TP4): 200% of the previous candle's range above or below the entry price.
These levels are adjusted dynamically based on the previous candle's high and low, so they adapt to changing market conditions.
Stop Loss:
A stop-loss is set to manage risk. The default stop-loss is 3% from the entry price, but this can be adjusted in the settings. The stop-loss is triggered if the price moves against the position by this amount.
Trend Direction Highlighting:
The strategy highlights the bars (candles) with colors:
Green bars indicate an uptrend (when EMA 20 crosses above EMA 50).
Red bars indicate a downtrend (when EMA 20 crosses below EMA 50).
These visual cues help users easily identify the market direction.
Strategy Entries and Exits:
Entries: The strategy enters a long (buy) position when the EMA 20 crosses above the EMA 50 and a short (sell) position when the EMA 20 crosses below the EMA 50.
Exits: The strategy exits the positions at any of the defined take-profit levels or the stop-loss. Multiple exit levels provide opportunities to take profit progressively as the price moves in the favorable direction.
Entry and Exit Conditions in Detail:
Buy Entry Condition (Uptrend):
A buy position is opened when EMA 20 crosses above EMA 50, signaling the start of an uptrend.
The strategy calculates take-profit levels above the entry price based on the previous bar's range (high-low) and the multipliers for TP1, TP2, TP3, and TP4.
Sell Entry Condition (Downtrend):
A sell position is opened when EMA 20 crosses below EMA 50, signaling the start of a downtrend.
The strategy calculates take-profit levels below the entry price, similarly based on the previous bar's range.
Exit Conditions:
Take Profit: The strategy attempts to exit the position at one of the take-profit levels (TP1, TP2, TP3, or TP4). If the price reaches any of these levels, the position is closed.
Stop Loss: The strategy also has a stop-loss set at a default value (3% below the entry for long trades, and 3% above for short trades). The stop-loss helps to protect the position from significant losses.
Backtesting and Performance Metrics:
The strategy can be backtested using TradingView's Strategy Tester. The results will show how the strategy would have performed historically, including key metrics like:
Net Profit
Max Drawdown
Win Rate
Profit Factor
Average Trade Duration
These performance metrics can help users assess the strategy's effectiveness over historical periods and optimize the input parameters (e.g., multipliers, stop-loss level).
Customization:
The strategy allows for the adjustment of several key input values via the settings panel:
Take Profit Multipliers: Users can customize the multipliers for each take-profit level (TP1, TP2, TP3, TP4).
Stop Loss Percentage: The user can also adjust the stop-loss percentage to a custom value.
EMA Periods: The default periods for the EMA 50 and EMA 20 are fixed, but they can be adjusted for different market conditions.
Pros of the Strategy:
EMA Crossover Strategy: A classic and well-known strategy used by traders to identify the start of new trends.
Multiple Take Profit Levels: By taking profits progressively at different levels, the strategy locks in gains as the price moves in favor of the position.
Clear Trend Identification: The use of green and red bars makes it visually easier to follow the market's direction.
Risk Management: The stop-loss and take-profit features help to manage risk and optimize profit-taking.
Cons of the Strategy:
Lagging Indicators: The strategy relies on EMAs, which are lagging indicators. This means that the strategy might enter trades after the trend has already started, leading to missed opportunities or less-than-ideal entry prices.
No Confirmation Indicators: The strategy purely depends on the crossover of two EMAs and does not use other confirming indicators (e.g., RSI, MACD), which might lead to false signals in volatile markets.
How to Use in Real-Time Trading:
Use for Backtesting: Initially, use this strategy in backtest mode to understand how it would have performed historically with your preferred settings.
Paper Trading: Once comfortable, you can use paper trading to test the strategy in real-time market conditions without risking real money.
Live Trading: After testing and optimizing the strategy, you can consider using it for live trading with proper risk management in place (e.g., starting with a small position size and adjusting parameters as needed).
Summary:
This strategy is designed to identify trend reversals using EMA crossovers, with customizable take-profit levels and a stop-loss to manage risk. It's well-suited for traders looking for a systematic way to enter and exit trades based on clear market signals, while also providing flexibility to adjust for different risk profiles and trading styles.

Grand Master's Candlestick Dominance (ATR Enhanced)### Grand Master's Candlestick Dominance (ATR Enhanced)
**Overview**
Unleash the ancient wisdom of Japanese candlestick charting with a modern twist! This comprehensive Pine Script v5 strategy and indicator scans for over 75 classic and advanced candlestick patterns (bullish, bearish, and neutral), assigning dynamic strength scores (1-10) to each for precise signal filtering. Enhanced with Average True Range (ATR) for volatility-aware body size validation, it dominates the markets by combining timeless pattern recognition with robust confirmation layers. Whether used as a backtestable strategy or visual indicator, it empowers traders to spot high-probability reversals, continuations, and indecision setups with surgical accuracy.
Inspired by Steve Nison's *Japanese Candlestick Charting Techniques*, this tool elevates pattern analysis beyond basics—think Hammers, Engulfing patterns, Morning Stars, and rare gems like Abandoned Baby or Concealing Baby Swallow—all consolidated into intelligent arrays for real-time averaging and prioritization.
**Key Features**
- **Extensive Pattern Library**:
- **Bullish (25+ patterns)**: Hammer (8.0), Bullish Engulfing (10.0), Morning Star (7.0), Three White Soldiers (9.0), Dragonfly Doji (8.0), and more (e.g., Rising Three, Unique Three River Bottom).
- **Bearish (25+ patterns)**: Hanging Man (8.0), Bearish Engulfing (10.0), Evening Star (7.0), Three Black Crows (9.0), Gravestone Doji (8.0), and exotics like Upside Gap Two Crows or Stalled Pattern.
- **Neutral/Indecision (34+ patterns)**: Doji variants (Long-Legged, Four Price), Spinning Tops, Harami Crosses, and multi-bar setups like Upside Tasuki Gap or Advancing Block.
Each pattern includes duration tracking (1-5 bars) and ATR-adjusted body/shadow criteria for relevance in volatile conditions.
- **Smart Confirmation Filters** (All Toggleable):
- **Trend Alignment**: 20-period SMA (customizable) ensures entries align with the prevailing trend; optional higher timeframe (e.g., Daily) MA crossover for multi-timeframe confluence.
- **Support/Resistance (S/R)**: Pivot-based levels with 0.01% tolerance to confirm bounces or breaks.
- **Volume Surge**: 20-period volume MA with 1.5x spike multiplier to validate momentum.
- **ATR Body Sizing**: Filters small bodies (<0.3x ATR) and long bodies (>0.8x ATR) for context-aware pattern reliability.
- **Follow-Through**: Ensures post-pattern confirmation via bullish/bearish closes or closes beyond prior bars.
Minimum average strength (default 7.0) and individual pattern thresholds (5.0) prevent weak signals.
- **Entry & Exit Logic**:
- **Long Entry**: Bullish average strength ≥7.0 (outweighing bearish), uptrend, volume spike, near support, follow-through, and HTF alignment.
- **Short Entry**: Mirror for bearish dominance in downtrends near resistance.
- **Exits**: Bearish/neutral shift, or fixed TP (5%) / SL (2%)—pyramiding disabled, 10% equity sizing.
- Backtest range: Jan 1, 2020 – Dec 31, 2025 (editable). Initial capital: $10,000.
- **Interactive Dashboard** (Top-Right Panel):
Real-time insights including:
- Market phase (e.g., "Bullish Phase (Avg Str: 8.2)"), active pattern (e.g., "BULLISH: Bullish Engulfing (Str: 10.0, Bars: 2)"), and trend status.
- Strength breakdowns (Bull/Bear/Neutral counts & averages).
- Filter status (e.g., "Volume: ✔ Spike", "ATR: Enabled (L:0.8, S:0.3)").
- Backtest stats: Total trades, win rate, streak, and last entry/exit details (price & timestamp).
Toggle mode: Strategy (live trades) or Indicator (signals only).
- **Advanced Alerts** (15+ Toggleable Types):
Set up via TradingView's "Any alert() function call" for bar-close triggers:
- Entry/Exit signals with strength & pattern details.
- Strong patterns (≥2 bullish/bearish), neutral indecision, volume spikes.
- S/R breakouts, HTF reversals, high-confidence singles (≥8.0 strength).
- Conflicting signals, MA crossovers, ATR volatility bursts, multi-bar completions.
Example: "STRONG BULLISH PATTERN detected! Strength: 9.5 | Top Pattern: Three White Soldiers | Trend: Up".
**Customization & Usage Tips**
- **Inputs Groups**: Strategy toggles, confirmations, exits, backtest dates, and 15+ alert switches—all intuitively grouped.
- **Optimization**: Tune min strengths for aggressive (lower) or conservative (higher) trading; enable/disable filters to suit your style (e.g., disable S/R for scalping).
- **Best For**: Forex, stocks, crypto on 1H–Daily charts. Test on historical data to refine TP/SL.
- **Limitations**: No external data installs; relies on built-in TA functions. Patterns are probabilistic—combine with your risk management.
Master the candles like a grandmaster. Deploy on TradingView, backtest relentlessly, and let dominance begin! Questions? Drop a comment.
*Version: 1.0 | Updated: September 2025 | Credits: Built on Pine Script v5 with nods to Nison's timeless techniques.*

Hilly's Reversal Scalping Strategy - 5 Min CandlesHow to Use
Copy the Code: Copy the script above.
Paste in TradingView: Open TradingView, go to the Pine Editor (bottom of the chart), paste the code, and click “Add to Chart.”
Set Timeframe: Ensure the chart is set to 5-minute candles (TradingView: right-click chart > Timeframe > 5 Minutes).
Check for Errors: Verify no errors appear in the Pine Editor console.
Apply to Chart: Use a liquid crypto pair (e.g., BTC/USDT, ETH/USDT on Binance or Coinbase).
Verify Signals:
Green “BUY” labels and triangle-up arrows for bullish reversals (e.g., bullish engulfing, hammer, doji, morning star, three white soldiers, double bottom in a downtrend).
Red “SELL” labels and triangle-down arrows for bearish reversals (e.g., bearish engulfing, shooting star, doji, evening star, three black crows, double top in an uptrend).
Green/red background highlights for signal candles.
Backtest: Use TradingView’s Strategy Tester to evaluate performance over 1–3 months, checking Net Profit, Win Rate, and Drawdown.
Demo Test: Run on a demo account to confirm signal visibility and performance before trading with real funds.
Troubleshooting
If Errors Occur: If any errors appear in TradingView’s Pine Editor console (e.g., “Syntax error” or “Invalid argument”), please share the exact error messages to diagnose environment-specific issues.
Signal Overload: If too many signals appear, increase patternLookback to 15 or set volFilter = volume > volMa * 2.0.
Missed Signals: If signals are too rare, set useVolumeFilter=false or reduce patternLookback to 5.
Additional Features: If you need alerts, other indicators (e.g., EMA, RSI), or dynamic arrow sizing, please specify. Note that dynamic sizing caused errors previously, so I’ve kept size=size.normal.

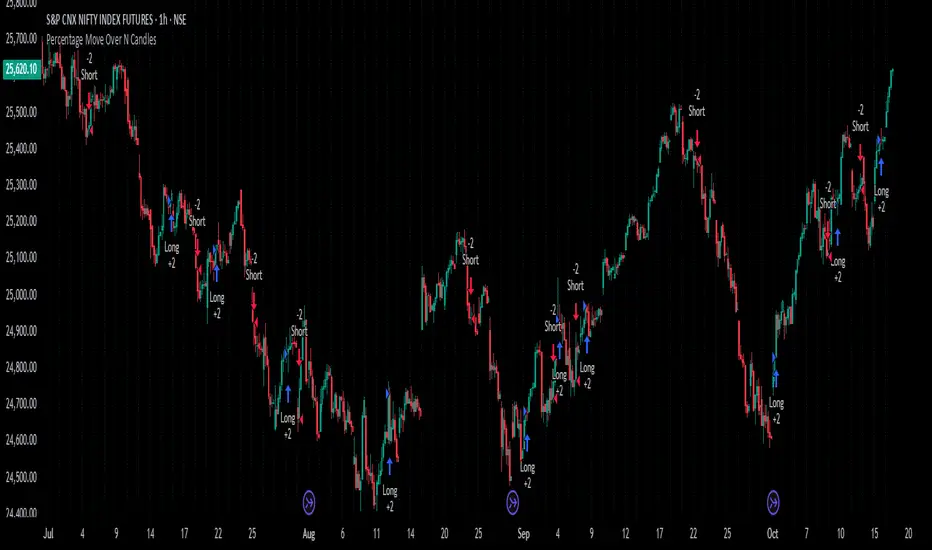
Percentage Move Over N CandlesThis strategy enters long/short trades if the price goes up/down by a certain defined percentage of the price, over a previous certain number of candles. Can be run on any time frame and on any instrument and alerts can be enabled.
Candle stick pattern strategy - No EMA 5MTFOverview
This strategy is designed to maximize trade frequency by identifying an expanded range of high-probability candlestick reversal patterns. It is an unfiltered system, meaning it will act on every valid signal it finds on the 5min timeframe, making it a very active strategy.
The core of the system is its ability to recognise not just the most common reversal signals, but also powerful "second-tier" patterns that often precede strong market moves.
An Expanded Arsenal of Signals 🏹
In addition to the flexible Pin Bars (Hammers/Shooting Stars) and classic Engulfing patterns, this strategy has been upgraded to include two new, powerful two-candle reversal patterns:
Piercing Pattern (Bullish): A strong bullish signal where a green candle opens below the prior red candle's close and then "pierces" more than halfway up into the body of that red candle, showing a decisive rejection of lower prices.
Dark Cloud Cover (Bearish): The opposite of a piercing pattern. A red candle opens above the prior green candle's high and then closes more than halfway down into the body of the green candle, signaling that sellers are taking control.
The inclusion of these patterns significantly increases the number of trading opportunities the strategy can capture.
Trade & Risk Management
Trade Logic: Once a trade is entered, it is held until it reaches its original Stop Loss or Take Profit. The strategy will ignore all new signals while a position is active to ensure each trade follows its plan.
Automated Risk: Every trade is automatically sized to risk exactly 2% of your account equity, providing consistent risk management.
Risk/Reward: The strategy targets a 1:6 R:R for long trades and a 1:4 R:R for short trades.
How To Use
Apply the strategy script to your chart.
Set the chart's timeframe to 5 min
Review the performance and individual trades in the 'Strategy Tester' tab at the bottom of your screen.
Disclaimer: This script is for educational and informational purposes. Trading involves substantial risk, and past performance is not a guarantee of future results. Use this tool at your own risk.

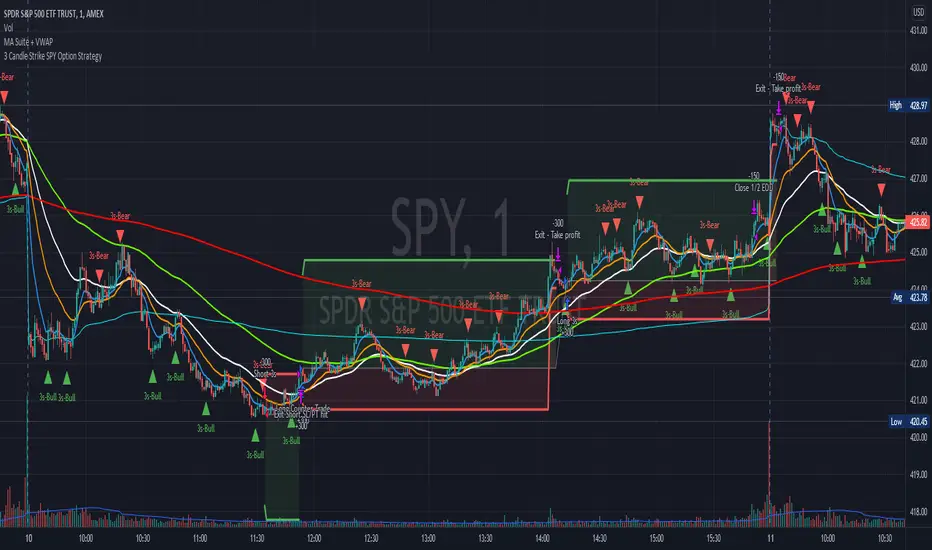
3 Candle Strike SPY Option StrategyImportant notes:
1. This strategy is designed for same day SPY option scalping. All profit shown in back testing report is based on Profit/Loss (P/L) estimates from trading options with approximately 7.5 weeks of data. By default, it is set to 10 option contracts. By default the initial capital is set to $5000.
2. This strategy also takes into account of extended market data, so turn it on for it to work as intended.
3. This strategy is mainly developed for SPY trading on 1 min chart, it probably will not work with other tickers without tweaking all the parameters first.
4. At the time of publish, the market is experiencing high volatility. Keep that in mind as market conditions changes constantly.
How it works:
Basic idea of this strategy is to look for 3 candle reversal pattern within trending market structure. The 3 candle reversal pattern consist of 3 consecutive bullish or bearish candles, followed by an engulfing candle in the opposite direction. This pattern usually signals a reversal of short term trend (a.k.a pullbacks). This strategy uses multiple moving averages to filter long or short entries. For example, if the 21 smoothed moving average is above the 50, only look for long (bullish) entries, and vise versa. There are settings to change these moving average periods to suit your needs. Linear Regression to determine whether the market is trending. The 3 candle pattern is more successful under trending market.
This strategy aims for approximately 1:3 risk to reward ratio. Stop losses are calculated using the closest low or high values for long or short entries, respectively, with an offset using a percentage of the daily ATR value. This allows some price fluctuation without being stopped out prematurely. Price target is calculated by multiplying the difference between the entry price and the stop loss by a factor of 3. When price target is reach, this strategy will set stop loss at the price target and wait for exit conditions to maximize potential profit.
By default, the strategy signals a trade in the opposite direction if the previous one had resulted in a loss. Often times, this opposite trade results in profit.
This strategy automatically signal to close all trades at 3:50 pm EST at the end of the day.
Enjoy~!!! Let's all make $$$
EMA 5/9 Angle + Candle Strength (SL=Open, TP=RR)EMA 5 / EMA 9 cross
Cross must have ~30° angle (approximated using slope → atan)
Entry candle must be bullish/bearish and also be Normal / 2nd Most / Most based on body-size percentile
Entry = close of signal candle
SL = open of signal candle
TP = 1:2 RR (editable input)

Yellow Candle X:@BADPERSON129**Yellow Candle Strategy - Performance Overview**
The Yellow Candle signal demonstrates moderate effectiveness with a success rate ranging from 30% to 60%. This strategy yields profit margins between 3% and 10%, depending on your portfolio management approach and market conditions.
**Key Parameters:**
- **Success Rate:** 30%-60%
- **Profit Target:** 3%-10%
- **Stop Loss:** 3%-8%
**Risk Management Notes:**
- Adjust position sizing according to your risk tolerance
- Stop loss placement is crucial for capital preservation
- The wide success rate range reflects varying market volatility
- Portfolio diversification recommended when implementing this signal
*Note: Performance may vary based on market conditions, timeframe selection, and proper risk management execution. Always backtest and forward test strategies before live implementation.*

US Index First Candle Breakout with FVGStrategy Description: US Index First Candle Breakout with FVG
Works on NG1! and YM1! for maximised profit.
Overview:
The "US Index First Candle Breakout with FVG" strategy is designed to capitalize on the volatility present during the first minutes of the U.S. stock market opening. By focusing on the initial 5-minute candle, this strategy identifies key price levels that can serve as breakout points for potential trading opportunities.
Key Features:
1. Breakout Strategy:
The strategy tracks the high and low of the first 5-minute candle after the market opens at 9:30 AM (New York time). These levels are critical indicators for potential price movements.
A long position is triggered when the price breaks above the high of the first candle, while a short position is initiated when the price drops below the low.
2. Manual Trade Direction Filter: (developing)
Users can select their preferred trading direction through a customizable input:
Buy only: Execute long trades only.
Sell only: Execute short trades only.
Both: Allow trades in both directions.
This feature enables traders to align the strategy with their market outlook and risk tolerance.
3. Fair Value Gap (FVG) Analysis:
The strategy incorporates an FVG filter to enhance trade precision. It assesses market gaps to identify whether a breakout is supported by underlying market dynamics.
The algorithm checks for conditions that indicate a valid breakout based on previous price action, ensuring that trades are made on strong signals.
4. Risk Management:
A customizable risk per trade setting allows users to define their risk tolerance in ticks.
The strategy includes a reward-to-risk ratio input, enabling traders to set their take-profit levels based on their risk preferences.
Stop-loss levels are automatically calculated based on the breakout direction, helping to safeguard against unexpected price movements.
5. Automatic Trade Execution:
Trades are executed automatically based on the defined conditions, reducing the need for manual intervention and allowing traders to capitalize on market movements in real-time.
Session End Closure:
The strategy automatically closes all open positions at 4:00 PM (New York time), ensuring that trades do not carry overnight risk.
How to Use the Strategy:
Simply add the script to your TradingView chart, set your desired parameters, and select your preferred trade direction.
Monitor for breakout signals during the first trading session, and let the automated system handle trade entries and exits based on your specifications.
Conclusion:
The "US Index First Candle Breakout with FVG" strategy is ideal for traders seeking to leverage early market volatility with a structured approach. By combining breakout techniques with FVG analysis and customizable trade direction, this strategy offers a robust framework for navigating the complexities of the U.S. stock market's opening dynamics.

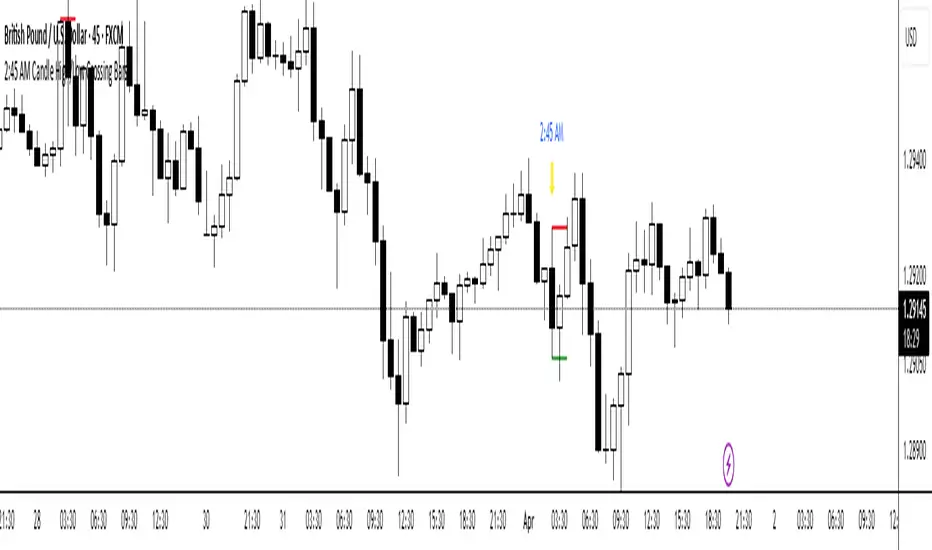
2:45 AM Candle High/Low Crossing Bars2:45 AM Candle High/Low Crossing Bars is an indicator that focuses on the trading view 2:45am NY TIME high and low indicating green for buy and red bars for sell, with the 2:45am new york time highlight/ If the next candle sweeps the low we buy while if it sweeps the high we sell, all time zoon must be the new York UTC time.
EMA + Bullish Engulfing Candle Pattern StrategyHello Guys! Nice to meet you all!
This is my first open source script!
### Long Condition
1. Bullish Engulfing Candle
2. No doge Candle
3. Present volume should be bigger than the previous volume (20%)
4. Trend filter (with 2 EMAs)
### Close Condition
1. When trend Changes
2. When Bearish Engulfing Candle appears
###
No stop loss and take profit.

G-BOT ENGULFING CANDLE - FIXED SL & TP // Description:
This Pine Script strategy identifies bullish and bearish engulfing candle patterns over a defined lookback period and places trades based
on recent market highs and lows. It calculates stop loss and take profit levels using the Average True Range (ATR) multiplied by a user-defined factor, with the ability to adjust the risk-to-reward ratio for each trade.

Jeremy: Candle StrategyPrice action strategy developed for a Backtest Rookies service customer. Published for verification and acceptance.
Please visit the Backtest Rookies website if you are interested in Development services
Features
Hammer / Hanging man candle detection with variable inputs
2 position entries
2 different SL and TP ratios
Custom position sizing algorithm
Move the second position to break even once the first take profit is hit

Alpha Candle Breakout Signal on Momentum from Support Resistance
Hello traders,
Let’s start with a brief description of what this strategy/indicator is and what it does and how we trade based on Alpha Candles.
The definition of an Alpha Candle is that it is mathematically calculated, and significantly bigger than the previous candles. This could be a green candle or a red candle, as long as the body is significantly bigger than the previous candles at the end of the calculation. All calculations are done in real time, we do NOT paint the candle sticks after the close of the candle and do not use offset values. This is extremely important. You will see the candle changing it's color as the body of the candle gets bigger with real time data feed. (Recalculate On Every Tick is ON by default). Now besides the mathematical calculations, an Alpha Candle also represents the emotion in the market for that stock in that moment. We can also say that an Alpha Candle is a change in the momentum.
Now that we’ve identified the Alpha candle, the second step is, to have a look at the chart and identify if the Alpha candle is breaking to a new high / low from a consolidation period, or from a good chart pattern (ascending / descending triangle , pennant , sideways consolidation) or a sudden direction change of the stock (bounce). Remember, the script will paint all Alpha candles regardless.
NVAX day trading example
Forex
Crypto
PLUG (Bounce example)
The script will identify the Alpha candles that are breaking to a new high / low from a user input look back period (default is 20 bars back, but this can be changed by the user input). An Alpha candle that breaks the look back period, will have a stop loss line below for Green Alpha or above for Red Alpha Candle and reward targets, like target1 or target2 (both are user input fields, can be adjusted to personal R values, default values are 2R and 3R)
A 2R means two times the reward (profit) of a 1-unit risk. If you are comfortable of loosing $50 per trade which will be considered 1-unit, then 2R means $100 reward (profit) target and a 3R is $150 reward (profit) target. Those R values will be plotted and/or labelled on the chart with dollar amounts if desired. You can change your R values from the user input area, even with decimal points, like 2.5R or 3.75R. If you shoot for at least 2R, you could be wrong 6 times out of 10, and still make 2R profit, as long as the other 4 trades give you a total of 8R. This is a basic trading concept. It will force the new traders to focus on risk/reward rather then a gambling attitude.
The script is meant to work with candle stick chart patterns only, it is NOT meant to work with ranges, line charts or point and figure charts. It will work with time frames like (seconds,1,2,3,5,10 minute or any minutes, daily, weekly). If you are trading IPOs , there might not be enough data for the script to do the calculation, so just be aware.
The script will identify the candles if they are Green Alpha (going up, bullish ) or Red Alpha (going down, bearish ). In order to see them clearly, we’ve greyed out the rest of the candles, and made Green Alpha candles white, and Red Alphas are left as red. You can change the colors from the user input area.
There is also a look back period, between 1-55 and the initial value is 20 for Green Alpha and 10 for Red Alpha. So, if the Alpha Candle breaks this look back period, it will be considered as an opportunity to take the trade. The code will put the stop loss area, possible target1 and target2 areas with a blue diamond and will draw the resistance/support lines for that Alpha candle. Depending on the individual’s risk tolerance, a label on the right side of the screen will show the risk tolerance (user input value) and the number of shares to be traded based on the risk tolerance (# of shares will be for the last Alpha Candle that is formed, it will constantly update itself with the new Alpha Candle)
For those who might be familiar with the three-bar play, we implemented something similar, so the code will find them in real time. Once an Alpha Candle is formed, if the following candle is a very small candle, also called pin bar , it will be painted to orange, so you can see it clearly. This pin bar is significantly smaller than the previous candles and formed right after an Alpha Candle.
Like anything in life, nothing is free. Meaning you have to work for it. So if you are looking to buy/sell blindly based on some indicators and signals, please do not consider this script. However, once you start using it, you will see how patterns repeat, when they repeat and how they repeat. It will identify the action, but you have to check the validity from the charts, so user discretionary is advised. As an example, if the Alpha candle is breaking from a consolidation period at $10. Let’s assume stop loss is at $9 so the 2R target will be $12, but if there is a possible resistance at $11, then the trader has to decide to take the trade for a possible 1R return, or skip the trade.
We try to approach the trading as a set of rules and processing the trades one by one, with a calculated risk and reward. This script will give you the Candle stick formation that is worth consideration and will draw the Stop Loss area (you can tweak this to your liking), will draw the 2-3R Targets, and will calculate the number of shares to be purchased based on the Risk Tolerance user entered in the user input area. The rest is to let the trade take care of it self.
Charts and patterns work better, when there is enough volume in a particular stock. If the stock is trading very low in volume , things will not work as expected. So, we must focus on the abnormal stocks, like gap gainers, volume gainer stocks, or heavily traded stocks (for intraday trading). For swing or long-term traders, one could look for a Green Alpha candle, assess the risk and possible return and trade the plan on a daily chart pattern (long term), or 15,30,60 min charts for swing trades.
If you are looking to short a stock, look for stocks that are weak (gap downs), so look for Red Alpha formations in that stock.
Once the back testing is turned on, code will generate buy/sell signals, otherwise it will work as an indicator. But please keep in mind….. For day trading, the stock has to be abnormally trading, so the chart patterns and the Alpha Candles work correctly. Volume has to be more than usual. It is the best way to have predictable results for day trading. If the volume of the stock is 2-5 times or more than the average of 20 days period (early in the morning), and even more later in the day, it is a good indication that the stock is trading on an abnormal volume with some news (pre-market abnormality is a good sign for possible abnormality for that stock).
For back testing, user can select from the user input area :
• Long or Short Trades or both or use the script as an indicator
• Close any open position if an Alpha candle forms in the opposite direction
• Pyramid the trades up to 4 levels (allow to buy/sell 4 times in the same direction every time another Alpha Candle forms)
• Breakout/breakdown look back period (every time an Alpha Candle forms and breaks this look back period, it will be a trade opportunity)
• Target Reward areas
• Stop Loss area
• Time frame (change the time frame and observe which time frame made good profit. Test the plan for future trades. Test it in as many abnormal stocks for the day they were behaving abnormal as possible). Time frame is not a user input field, just the time frame of the chart, 2,5,10 min, 1 hour etc.
• Selective date testing (between two dates/times). This is very important as most of the good opportunities comes from abnormal price action with volume . If you back test with the maximum amount of data for that abnormal stock on that day, it will produce unrealistic results, because the stock will have a normal course of trend before the news. Remember, we are looking for stocks that are trading abnormal in both price and volume or stocks like AAPL , TSLA which are trading heavily on each day. It is also a good way to learn, how and when to buy/sell, where to put stop losses by observing the chart with the Alpha Candles showing the results.
• All the above values will have an impact on the total profit / loss.
F (Ford Motors)
Now that we’ve covered what the script does, let’s plan the trade and trade the plan.
Side Note:
-------------
We started coding this as an indicator to show the Alpha Candles to find opportunities in the market. Later in the development, we implemented it as a Strategy, to be able to back test the ideas, to tweak some rules for entry/exit and see the effects on our profit/loss percentages in general. We kept the original idea being an Indicator, to show us the Alpha Candles in real time. This requires the option “Indicator Mode” is to be selected from the User Input area, and leaving the “Recalculate On Every Tick” is selected from the Properties tab of the strategy (as of Pine Script v5). Strategy is turning this “On” by default.
Disclaimer: This script is an educational and personal use only tool and should be used accordingly. User can not publish any images created with this code. Do your own due diligence, do not buy / sell stocks based on any indicator, always use stop losses. We do not make any promises as this indicator or any indicator will make you a profitable trader. Trading and technical analysis is difficult, it takes time to build confidence and experience. Study the charts and candlestick formations. Study support/resistance areas and how to identify them. This will help you to tweak the script’s stop loss areas and 2R-3R targets. Do not invest any money you are not comfortable loosing.
This is an invite only strategy. We will give ample time to test it out. After that you will need to subscribe. To get access to this strategy trader can send me an email from the links below.
All the Best
Happy Trading

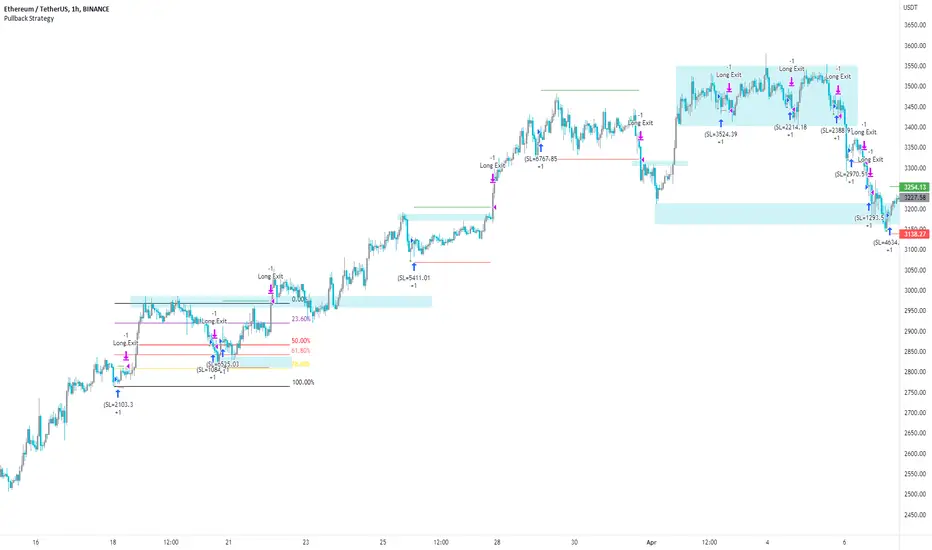
Pullback Strategy (Candle Analysis) New VersionFollowing on from the previous Pullback Candle which smashed over 100 likes - here we have the strategy behind the indicator.
Signal = Pullback Candle (This will alert on all timeframes and markets when selecting the Alert function for the Signal
Entry = When the Pullback Candle is confirmed ie 16:00 - the strategy will enter within the next two candles.
Stop loss = 0.25 ATR multiple which means we have a tighter stop loss - if greater than 1 then the stop loss will be more in percentages!!!
Take Profit = 1.5 Risk to Reward Model
Ema filter - There is a function to modify when looking into trades so as this is a bullish setup we want trades to be over the ema and using this filter will only show trades above the 200ema
Time filter - If you want to backtest Uptrends - locate the time of the start and the end of the uptrend - input this data into the settings and this will bring up the trades in that time period.
Most efficient to use this script is only in uptrends and this signal is a bullish signal - when using a ema filter we wont get trades under this so narrow down good trades for automation.
!!!!TO ENHANCE THE SYSTEM - USE TECHNICAL ANANLYSIS FOR CONFLUENCES
Most inefficient way to use the script is when price is in a downtrend and the win rate falls dramatically.
The pullback candle has a R-Expectancy of R5 so profits can be elongated when trading manually.
As the pullback candle occurs often in a trend we could pyramided trades to say have 5 trades in the same direction but the way i would trade this is to alert R1.5 then look to R2 and above to take profits manually.
(((P.S coders.... i need help to work on a profit extension code where exit long when price is below the 9ema (this seems simple but proving difficult) - this would be included onto the script if received.
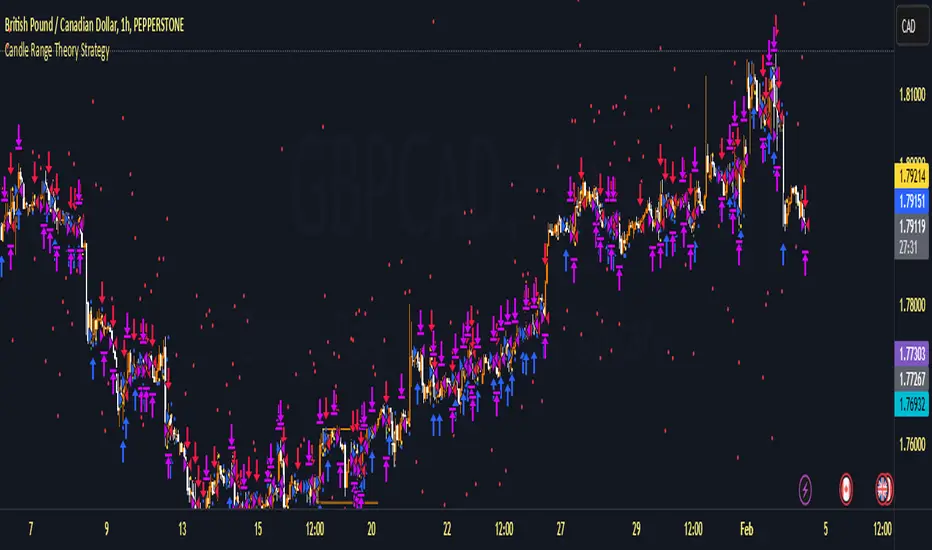
Candle Range Theory StrategyCandle Range Theory StrategyCandle Range Theory Strategy delves into the intricacies of price action analysis, focusing on the behavior of candlestick patterns within specific ranges. Traders employing this strategy aim to identify key support and resistance levels by analyzing the high and low points of significant candlesticks. The core principle lies in understanding that the range of a candle—defined by its opening, closing, high, and low prices—provides valuable insight into market sentiment and potential future movements.
To implement the Candle Range Theory Strategy effectively, one must first recognize the importance of different candle sizes. A long-bodied candle suggests strong momentum, pointing to a bullish or bearish bias, while a small-bodied candle indicates indecision or consolidation, often signaling potential reversals or breakouts. By plotting these candlesticks over a defined time frame, traders can ascertain whether the market is trending or range-bound.
Additionally, traders should consider the context in which these candles form. Analysis of the preceding price action can reveal whether current ranges are extensions of existing trends or indications of market fatigue. In particular, look for patterns such as engulfing candles, pin bars, or inside bars, as they often foreshadow forthcoming price fluctuations.
Moreover, combining the Candle Range Theory with other technical indicators, like moving averages or Fibonacci retracements, can offer a more comprehensive view of potential entry and exit points. By aligning candle patterns with broader market dynamics, traders can optimize their strategies, enhancing their probability of success while minimizing risk.
Lastly, maintaining a disciplined approach is crucial. Setting precise stop-loss and take-profit levels grounded in candle ranges can safeguard one's capital. Adhering to this framework allows traders to navigate the complexities of the market with greater confidence, ultimately leading to more informed and successful trading decisions. Embracing the nuances of Candle Range Theory not only sharpens analytical skills but also enriches one’s trading repertoire, paving the way for sustained profitability in the dynamic world of forex and equities.