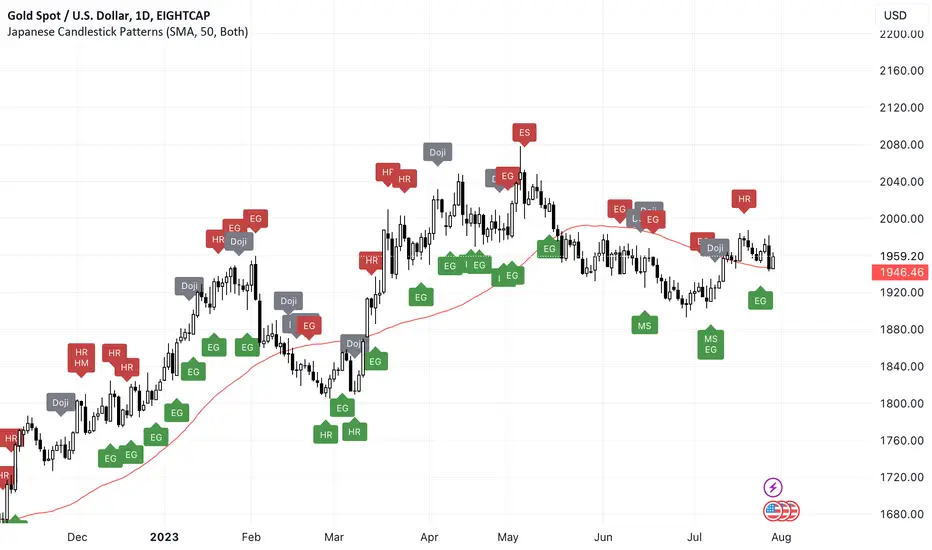
Japanese Candlestick Patterns💡 Japanese Candlesticks are a visual representation of price movements in financial markets. They were first developed by Japanese rice traders in the 18th century to analyze the price of rice contracts, and have since been adopted by traders across the world for a wide range of assets.
📌 A candlestick is composed of a rectangular body and two thin lines, known as wicks, that extend from the top and bottom of the body. The body represents the difference between the opening and closing prices of the asset during a specific time period, while the wicks indicate the high and low prices reached during that period.
📌 By using these and other candlestick patterns, traders can identify potential buying and selling opportunities and manage their risk accordingly. However, it's important to note that candlestick patterns should be used in conjunction with other technical and fundamental analysis tools to make well-informed trading decisions.
📌 Candlestick patterns are particularly useful because they are based on price action rather than external factors such as news or economic data. This makes them useful for traders who employ technical analysis, as they can use candlestick patterns to identify potential trading opportunities and manage their risk accordingly.
🚀 Candlesticks can be used to identify market trends, as well as potential buying and selling opportunities. By analyzing the patterns formed by multiple candlesticks, traders can gain insights into the behavior of the market and make informed trading decisions. Overall, Japanese Candlesticks are a powerful tool for technical analysis that can provide valuable insights into financial markets.
🔍 THE PATTERNS THAT ARE RECOGNIZED:
🔄 Reversal Patterns
* Counterattack Lines
* Dark-Cloud Cover
* Engulfing ( Bearish / Bullish )
* Hammer
* Hanging Man
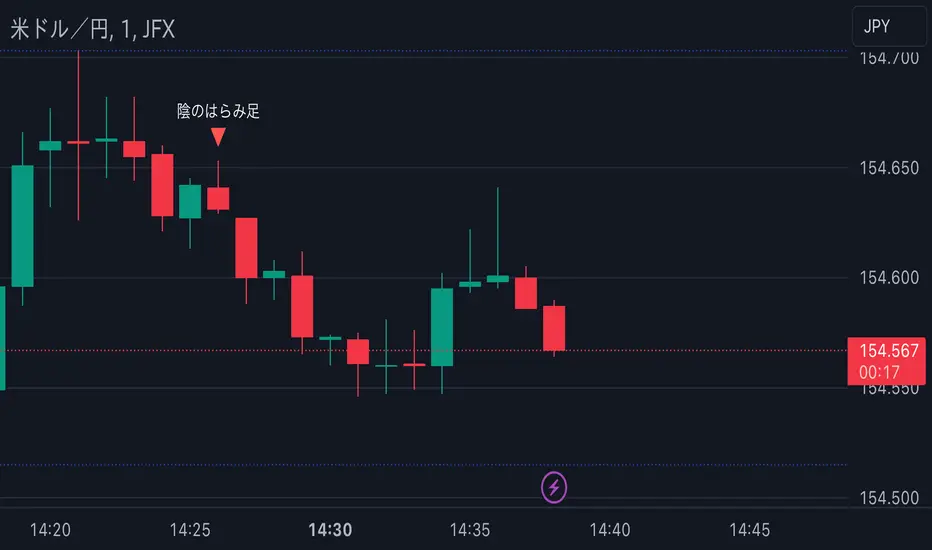
* Harami ( Bearish / Bullish )
* In Neck
* On Neck
* Piercing
* Three Black Crows
* Thrusting
* Upside Gap Two Crows
⭐️ Stars
* Abandoned Baby
* Evening star
* Inverted Hammer
* Morning Star
* Shooting Star
🎯 Doji
* Doji
* Dragonfly Doji
* Evening Doji Star
* Gravestone Doji
* Long Legged Doji
* Morning Doji Star
🔥 Continuation Patterns
* Falling Three Methods
* Rising Three Methods
* Tasuki ( Upside / Downside )
🥊 Utility
* Long Lower Shadow
* Long Upper Shadow
❤️ Please, support the work with like & comment! ❤️
Pine Script® indicator