New ALASMARThis is an update version of my strategy. You all are welcome for any notifications.
best regards,
Alasmar
Search in scripts for "candle"

ETH UU Reversion Strategy Strategy Overview
The "ETH UU Reversion Strategy" is a sophisticated mean-reversion trading system designed to capture price reversals at standard deviation extremes. Unlike typical strategies that enter trades immediately at market price, this script employs a proprietary **Limit Order Execution Mechanism** combined with volatility filtering to optimize entry prices and reduce slippage.
Originality & Key Features
This script addresses the common pitfalls of standard Bollinger Band strategies by introducing advanced order management logic:
1. Limit Order Execution:** Instead of market orders, the strategy calculates an optimal entry price based on ATR offsets. This allows traders to capitalize on "wicks" and secure better risk-reward ratios.
2. Smart Timeout Logic:To prevent "catching a falling knife," pending orders are automatically cancelled if not filled within a customizable number of bars (default: 15). This ensures orders do not remain active when market structure shifts.
3. Dynamic Risk Recalculation:** Stop Loss (SL) and Take Profit (TP) levels are recalculated at the exact moment of execution using the real-time ATR, ensuring risk parameters adapt to current market volatility.
How to Use
1. Setup: Apply the strategy to ETH/USDT (or other crypto pairs) on 15m or 1h timeframes.
2. Configuration:
* Adjust `BB Length` and `RSI Length` to fit your timeframe.
* Set `Order Timeout` to define how long a pending order should remain active.
* Toggle `Use ADX Filter` to avoid trading against strong trends.
3. *Visuals: The chart displays distinct labels for pending orders (Gray), active entries (Blue/Red), and cancellations, providing full transparency of the strategy's logic.
Risk Disclaimer
This script is for educational and quantitative analysis purposes only. Past performance regarding backtesting or live trading does not guarantee future results. Cryptocurrency trading involves high risk and high volatility. Please use proper risk management and trade at your own discretion.
-------------------------------------------------------------
Chinese Translation (中文说明)
策略概述
“ETH UU 均值回归策略”是一个旨在捕捉标准差极端位置价格反转的交易系统。与立即以市价入场的典型策略不同,本策略采用独特的**挂单执行机制**结合波动率过滤,以优化入场价格并减少滑点。
原创性与核心功能
本脚本通过引入高级订单管理逻辑,解决了普通布林带策略的常见缺陷:
1. 挂单交易模式: 策略不使用市价单,而是根据 ATR 偏移计算最佳入场价(Limit Orders)。这允许交易者捕捉K线的“影线”,获得更好的盈亏比。
2. 智能超时撤单: 为了防止“接飞刀”,如果挂单在指定K线数内(默认15根)未成交,系统会自动撤单。这确保了当市场结构发生变化时,旧的挂单不会被错误触发。
3. 动态风控重算: 止损和止盈在成交的瞬间根据实时 ATR 重新计算,确保风控参数始终适应当前的市场波动率。
风险提示
本脚本仅供教育和量化分析使用。回测或实盘的过往表现并不预示未来结果。加密货币交易具有极高的风险和波动性,请务必做好仓位管理,并自行承担使用本策略的风险。

Multi-MA + RSI Pullback Strategy (Jordan)1️⃣ Strategy logic I’ll code
From your screenshots:
Indicators
• EMAs: 600 / 200 / 100 / 50
• RSI: length 6, levels 80 / 20
Rules (simplified so a script can handle them):
• Use a higher-timeframe trend filter (15m or 1h) using the EMAs.
• Take entries on the chart timeframe (you can use 1m or 5m).
• Long:
• Higher-TF trend is up.
• Price is pulling back into a zone (between 50 EMA and 100 EMA on the entry timeframe – this approximates your 50–61% retrace).
• RSI crosses below 20 (oversold).
• Short:
• Higher-TF trend is down.
• Price pulls back between 50 & 100 EMAs.
• RSI crosses above 80 (overbought).
• Exits: ATR-based stop + take-profit with adjustable R:R (2:1 or 3:1).
• Max 4 trades per day.
News filter & “only trade gold” you handle manually (run it on XAUUSD and avoid news times yourself – TradingView can’t read the economic calendar from code).

Trend Following $ZEC - Multi-Timeframe Structure Filter + Revers# Trend Following CRYPTOCAP:ZEC - Strategy Guide
## 📊 Strategy Overview
Trend Following CRYPTOCAP:ZEC is an enhanced Turtle Trading system designed for cryptocurrency spot trading, combining Donchian Channel breakouts, multi-timeframe structure filtering, and ATR-based dynamic risk management for both long and short positions.
---
## 🎯 Core Features
1. Multi-Timeframe Structure Filtering
- Uses Swing High/Low to identify market structure
- Customizable structure timeframe (default: 1 minute)
- Only enters trades in the direction of the trend, avoiding counter-trend positions
2. Reverse Signal Exit
- No fixed stop-loss or fixed-period exits
- Exits only when a reverse entry signal triggers
- Maximizes trend profits, reduces premature exits
3. ATR Dynamic Pyramiding
- Adds positions when price moves 0.5 ATR in favorable direction
- Supports up to 2 units maximum (adjustable)
- Pyramid scaling to enhance profitability
4. Complete Risk Management
- Fixed position size (5000 USD per unit)
- Commission fee 0.06% (Binance spot rate)
- Initial capital 10,000 USD
---
## 📈 Trading Logic
Entry Conditions
✅ Long Entry:
- Close price breaks above 20-period high
- Structure trend is bullish (price breaks above Swing High)
✅ Short Entry:
- Close price breaks below 20-period low
- Structure trend is bearish (price breaks below Swing Low)
Add Position Conditions
- Long: Price rises ≥ 0.5 ATR
- Short: Price falls ≥ 0.5 ATR
- Maximum 2 units including initial entry
Exit Conditions
- Long Exit: When short entry signal triggers (price breaks 20-period low + structure turns bearish)
- Short Exit: When long entry signal triggers (price breaks 20-period high + structure turns bullish)
---
## ⚙️ Parameter Settings
Channel Settings
- Entry Channel Period: 20 (Donchian Channel breakout period)
- Exit Channel Period: 10 (reserved parameter, actually uses reverse signal exit)
ATR Settings
- ATR Period: 20
- Stop Loss ATR Multiplier: 2.0 (reserved parameter)
- Add Position ATR Multiplier: 0.5
Structure Filter
- Swing Length: 160 (Swing High/Low calculation period)
- Structure Timeframe: 1 minute (can change to 5/15/60, etc.)
Position Management
- Maximum Units: 2 (including initial entry)
- Capital Per Unit: 5000 USD
---
## 🎨 Visualization Features
Background Colors
- Light Green: Bullish structure
- Light Red: Bearish structure
- Dark Green: Long entry
- Dark Red: Short entry
Optional Display (Default: OFF)
- Entry/exit channel lines
- Structure high/low lines
- ATR stop-loss line
- Next add position indicator
- Entry/exit labels
---
## 📱 Alert Message Format
Strategy sends notifications on entry/exit with the following format:
- Entry: `1m Long EP:428.26`
- Add Position: `15m Add Long 2/2 EP:429.50`
- Exit: `1m Close Long Reverse Signal`
Where:
- `1m`/`15m` = Current chart timeframe
- `EP` = Entry Price
---
## 💰 Backtest Settings
Capital Allocation
- Initial Capital: 10,000 USD
- Per Entry: 5,000 USD (split into 2 entries)
- Leverage: 0x (spot trading)
Trading Costs
- Commission: 0.06% (Binance spot VIP0)
- Slippage: 0
---
## 🎯 Use Cases
✅ Best Scenarios
- Trending markets
- Moderate volatility assets
- 1-minute to 4-hour timeframes
⚠️ Not Suitable For
- Highly volatile choppy markets
- Low liquidity small-cap coins
- Extreme market conditions (black swan events)
---
## 📊 Usage Recommendations
Timeframe Suggestions
| Timeframe | Trading Style | Suggested Parameter Adjustment |
|-----------|--------------|-------------------------------|
| 1-5 min | Scalping | Swing Length 100-160 |
| 15-30 min | Short-term | Swing Length 50-100 |
| 1-4 hour | Swing Trading | Swing Length 20-50 |
Optimization Tips
1. Adjust swing length based on backtest results
2. Different coins may require different parameters
3. Recommend backtesting on 1-minute chart first before live trading
4. Enable labels to observe entry/exit points
---
## ⚠️ Risk Disclaimer
1. Past Performance Does Not Guarantee Future Results
- Backtest data is for reference only
- Live trading may be affected by slippage, delays, etc.
2. Market Condition Changes
- Strategy performs better in trending markets
- May experience frequent stops in ranging markets
3. Capital Management
- Do not invest more than you can afford to lose
- Recommend setting total capital stop-loss threshold
4. Commission Impact
- Frequent trading accumulates commission fees
- Recommend using exchange discounts (BNB fee reduction, etc.)
---
## 🔧 Troubleshooting
Q: No entry signals?
A: Check if structure filter is too strict, adjust swing length or timeframe
Q: Too many labels displayed?
A: Turn off "Show Labels" option in settings
Q: Poor backtest performance?
A:
1. Check if the coin is suitable for trend-following strategies
2. Adjust parameters (swing length, channel period)
3. Try different timeframes
Q: How to set alerts?
A:
1. Click "Alert" in top-right corner of chart
2. Condition: Select "Strategy - Trend Following CRYPTOCAP:ZEC "
3. Choose "Order filled"
4. Set notification method (Webhook/Email/App)
---
## 📞 Contact Information
Strategy Name: Trend Following CRYPTOCAP:ZEC
Version: v1.0
Pine Script Version: v6
Last Updated: December 2025
---
## 📄 Copyright Notice
This strategy is for educational and research purposes only.
All risks of using this strategy for live trading are borne by the user.
Commercial use without authorization is prohibited.
---
## 🎓 Learning Resources
To understand the strategy principles in depth, recommended reading:
- "The Complete TurtleTrader" - Curtis Faith
- "Trend Following" - Michael Covel
- TradingView Pine Script Official Documentation
---
Happy Trading! Remember to manage your risk 📈

Strategia S&P 500 vs US10Y YieldThis strategy explores the macroeconomic relationship between the equity market (S&P 500) and the debt market (10-Year Treasury Yield). Historically, rapid spikes in bond yields often exert downward pressure on equity valuations, leading to corrections or bear markets.
The goal of this strategy is capital preservation. It attempts to switch to cash when yields are rising too aggressively and re-enter the stock market when the bond market stabilizes.

Keltner Channels Strategy NewThe strategy is chenging the same as an original copy, but this one is for tests, so I will publish it and check results

2 Dip/Tepe + Destek/Direnç + Tek Sinyal Stratejisi⭐ A Brief Summary of What the Strategy Does
🎯 1) Market analysis is being released (bottom-top analysis)
It automatically finds pivot bottoms and pivot tops on the strategic chart. Then:
If the bottoms are rising (HL – High Low): the trend is upward
If the tops are falling (LH – Lower High): the trend is downward
it interprets this.
🎯 2) Support and resistance lines are formed
Last pivot top = resistance line
Last pivot bottom = support line
These lines are automatically drawn on the chart.
🎯 3) Breakout is expected according to the trend structure
For LONG:
The last two bottoms will be rising bottoms
The price will rise above the last resistance line
This gives a single LONG signal.
For SHORT:
The last two peaks will be falling peaks
The price will fall below the support line
This gives a single SHORT signal.

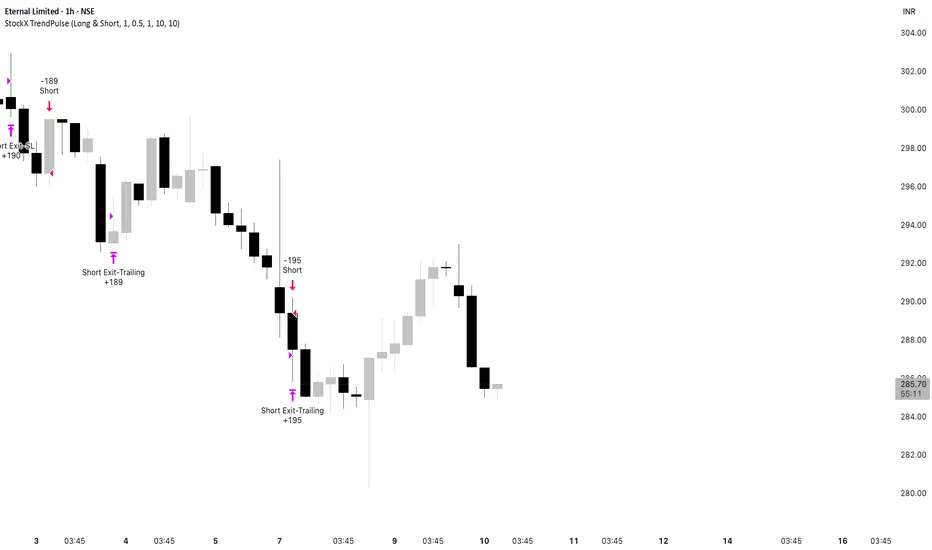
StockX TrendPulseThis is one of our premium, high-grade trading scripts built specifically for highly liquid stocks. It’s a fully automated system designed to deliver consistent performance, adapt to changing market conditions, and maintain strict risk control. With enhanced trade management and built-in performance tracking, it provides a reliable, disciplined framework for stock traders who demand precision and robustness.
StockX TrendPulse removes emotion from trading decisions and provides complete transparency through detailed performance metrics. The strategy is fully backtested and ready for live deployment.
Ready to Trade Like a Pro?
StockX TrendPulse is a premium strategy with limited availability.
Email brijamohanjha@gmail.com
to request access and pricing.
AlasmarPrivet strategy in the beginning .
hope it will help to give you a good advice when to in and out from SPX500.
i test it in options only and you can use it and try if it works with stocks or no.
pls feel free to contact me if needed.
best regards,
Alasmar

YCGH Crypto ultimate Breakout StrategyAdvanced Momentum Breakout Strategy - Optimized for crypto markets, proven effective on equities
Core Features:
Multi-layered signal generation combining volatility expansion and momentum confirmation
Adaptive risk management with dynamic stops, profit targets, and trailing mechanisms
Systematic position sizing with configurable leverage (designed for perpetual/margin trading)
Volatility regime filters to avoid false breakouts during low-momentum periods
Optional trend alignment for directional bias confirmation
Comprehensive backtesting with realistic slippage and commission modeling
Daily drawdown limits for capital preservation
Performance:
Applicable across multiple timeframes (1H, 4H, Daily)
Works on both spot and derivatives markets
Long and short position capability
Interested in using this strategy? This is a paid service. For access to the complete script and implementation support, email: brijamohanjha@gmail.com

PSAR with EMA FilterThis indicator combines the Parabolic SAR (PSAR) with an EMA trend filter to generate more accurate trend-following signals.
PSAR helps identify potential trend reversals and trailing stop levels, while the EMA ensures that trades are aligned with the overall market direction.

MACD with EMA FilterThis indicator combines the MACD (Moving Average Convergence Divergence) with an EMA-based trend filter to improve the quality of entry signals.
MACD identifies changes in momentum and potential trend reversals, while the EMA ensures that signals are taken only in the direction of the broader trend.

Supertrend + MAXTRA inputsThe Supertrend strategy is a trend-following trading method that uses the Supertrend indicator, which is calculated based on the ATR (Average True Range). When the price closes above the Supertrend line, it generates a buy signal, and when the price closes below the Supertrend line, it generates a sell signal. The indicator continuously trails the price, helping traders identify trend direction, ride trends, and manage stop-loss levels.

EMA + Sessions + RSI Strategy v1.0A professional trading strategy that combines multiple technical indicators for high-probability entries. This system uses EMA crossovers, RSI zone filtering, and trend confirmation to identify optimal trading opportunities while managing risk with advanced position management tools.
Key Features:
✅ Dual Entry Signals (EMA21 + EMA100 crossover conditions)
✅ Trend Filter EMA750 (trade only with the major trend)
✅ Complete Risk Management (SL 1%, TP 3% default)
✅ Trailing Stop & Breakeven (maximize profits, protect capital)
✅ Compact Statistics Table (real-time performance metrics)
✅ RSI & Session Filters (avoid low-probability setups)
✅ Optional Pyramiding (scale into winning positions)
Perfect for swing trading and trend-following on any timeframe. Fully customizable to match your trading style.

Empire OS Automated Trading • Institutional-grade executionEmpire OS – 9/40 EMA Dynamic Momentum Strategy
This strategy isn’t just EMAs — it’s a dynamic entry and exit system built around real-time price behavior. The 9/40 EMA setup gives the base trend direction, and the internal engine calculates every entry, stop, and target using recent price action and a 14-ATR volatility model.
Everything adjusts automatically:
• Entries react to momentum shifts based on the 9/40 EMA separation
• Stops tighten or widen based on the current 14-ATR reading
• Targets scale with real market volatility (not fixed numbers)
• Risk-to-Reward is calculated on the fly for cleaner, stronger trades
• Exits are based on structure + volatility, not random lines
Most strategies use fixed stops, fixed R:R, or standard EMA pairs that anyone can copy.
This one adapts to the market in real time — making every trade unique to current conditions.
It’s rare because almost nobody builds a retail strategy that:
Uses a non-standard 9/40 EMA combo
Calculates stops + targets off real volatility
Adjusts risk reward based on live price activity
Filters entries through momentum AND price structure
Keeps drawdown tight while catching high-quality moves
This is the official Empire OS version — built for consistency, momentum accuracy, and prop-firm scalability.

SergejFxin this indiokator you will gain a lot of succes in your tradinmg life i put my heart and my blood in this wqork and could gain a lot of experience i hope you guys will gain the same

Syntropy - System v4Syntropy System v4 – La Estrategia de Acumulación Profesional que Todos Están UsandoEDICIÓN LIMITADA – SOLO 10 PLAZAS DISPONIBLES EN TODO EL MUNDOPor primera (y única) vez, libero mi estrategia privada más potente:
La misma que uso personalmente y que ha cambiado por completo la forma en que acumulo en Bitcoin, Ethereum y altcoins de alto potencial.¿Qué incluye Syntropy v4?8 motores de entrada independientes (PG Solo, PG+FA, RZ1/RZ2, SFP, Liquidity Sweep, STE Bottom + reentradas inteligentes)
Piramidación hasta 20 niveles con control total de riesgo
Medias móviles dinámicas + proyecciones extendidas
Tabla en tiempo real con P&L total, capital invertido y operaciones abiertas/cerradas
Señales 100% visuales y sin repintado
Optimizada para cripto, pero funciona perfecto en forex y acciones
OFERTA EXCLUSIVA Y POR TIEMPO MUY LIMITADOPrecio normal: 499 USD (pago único de por vida + todas las futuras actualizaciones) PRECIO LANZAMIENTO SOLO PARA LOS PRIMEROS 10 COMPRADORES:
50 USD DE POR VIDA
(Sí, leíste bien: cincuenta dólares una sola vez y el indicador es tuyo para siempre)Una vez que se vendan las 10 primeras licencias, este precio desaparece para siempre y vuelve al valor real de 499 USD.Ya van 7/10 vendidas en las últimas horas…¿Quieres ser uno de los últimos 3 que se lleven Syntropy v4 a precio de lanzamiento?Envíame YA un mensaje privado con la palabra “SYNTROPY 50” y te mando el enlace de pago + acceso inmediato al script protegido.No hay prueba gratis esta vez porque a este precio es literalmente un regalo… pero sí te doy mi palabra: si en 30 días no estás 100% convencido de que es la mejor estrategia que has usado jamás, te devuelvo hasta el último centavo.Quedan muy pocas horas antes de que suba el precio para siempre.Los primeros 10 que escriban ahora se llevan el indicador de por vida por solo 50 USD.
El resto pagará 10 veces más.Tú decides si estás dentro del grupo élite o te quedas mirando desde afuera.Te espero del otro lado.Aviso importante (reglas de TradingView):
Este es un script privado de pago. No constituye asesoramiento financiero. Operar implica riesgo de pérdida de capital. Los resultados pasados no garantizan resultados futuros. Uso bajo tu propia responsabilidad.
Syntropy System v4 – The Most Powerful Accumulation Strategy Ever ReleasedWORLDWIDE LIMITED EDITION – ONLY 10 LIFETIME SEATSFor the first and last time ever, I’m opening my personal, private strategy that I use every single day to stack Bitcoin, Ethereum, Ethereum and high-conviction altcoins.What you get with Syntropy v48 independent & complementary entry engines (PG Solo, PG+FA, RZ1/RZ2, SFP, Liquidity Sweep, STE Bottom + smart reentries)
Up to 20 pyramiding levels with perfect risk scaling
Dynamic moving averages + extended visual projections
Real-time dashboard (total P&L, invested capital, open/closed trades)
100% visual, non-repainting signals
Built for crypto, but works flawlessly on forex and stocks too
INSANE LAUNCH PRICE – ONLY FOR THE FIRST 10 PEOPLENormal lifetime price: $499 (one-time payment + all future updates forever)LAUNCH PRICE – FIRST 10 BUYERS ONLY:
$50 USD LIFETIME
(Yes, you read that right: fifty dollars one time and the indicator is yours forever)Once these 10 licenses are gone, the price jumps permanently to $499 and will never come back down.7 out of 10 already sold in the last few hours…That leaves only 3 seats at this ridiculous price.Want to be one of the last 3 people on Earth to grab Syntropy v4 for $50 lifetime?Send me a private message RIGHT NOW with the words
“SYNTROPY 50”
and I’ll instantly send you the payment link + immediate access to the protected script.There is no free trial at this price (it would be insane), but I give you my personal word:
If within 30 days you’re not 100% blown away and convinced this is the best strategy you’ve ever used, I’ll refund every single penny — no questions asked.The clock is ticking. In a few hours this $50 offer disappears forever.The first 10 who message me now get lifetime access for only $50.
Everyone else will pay 10× more.Your move: be part of the elite 10 or watch from the sidelines.I’ll see you inside.TradingView Required Disclaimer
This is a paid private script. Not financial advice. Trading involves substantial risk of loss. Past performance is no guarantee of future results. Use only capital you can afford to lose. You are solely responsible for your trading decisions.


Titan EMA Liquidity [Stansbooth]
🔥 Precision EMA + FVG Liquidity Sweep System
Advanced Buy/Sell Signal Engine for High-Probability Trade Entries
Unlock a new level of precision with this all-in-one market structure indicator built for traders who demand accuracy, clarity, and confidence.
This tool combines EMA trend filtration , Fair Value Gap (FVG) detection , and liquidity sweep analysis to deliver powerful buy and sell signals that align with institutional price behavior.
✅ Key Features
Dynamic EMA Trend Filter:
Identifies true trend direction and filters out low-quality trades. Signals only trigger when momentum aligns with higher-timeframe directional bias.
Smart FVG Detection:
Automatically highlights bullish and bearish Fair Value Gaps, helping you spot premium/discount zones where institutional traders seek entries.
Liquidity Sweep Identification:
Detects equal highs/lows, stop hunts, and engineered liquidity grabs—then confirms reversals when price sweeps liquidity and returns inside structure.
High-Accuracy Signal Engine:
Buy/Sell alerts trigger only when three layers agree:
1. EMA trend alignment
2. FVG confirmation
3. Liquidity sweep completion
This results in cleaner signals , fewer false entries, and strong trend continuation setups.
Optimized for All Market Conditions:
Works for scalping, day trading, and swing trading across Forex, Crypto, Indices, and Stocks.
What This Indicator Helps You Achieve
Capture smart-money style entries with reduced drawdown
Enter after liquidity grabs instead of before them
Avoid chop with EMA-filtered market direction
Spot precision premium/discount zones using automatic FVG mapping
Obtain high-confidence Buy/Sell signals based on institutional concept
Why Traders Love It
This system isn’t just another signal generator—it’s a market-structure aware model that reads the chart the same way professional traders do.
Every signal is based on probability stacking , giving you the clarity and confidence to take the best setups while ignoring noise.


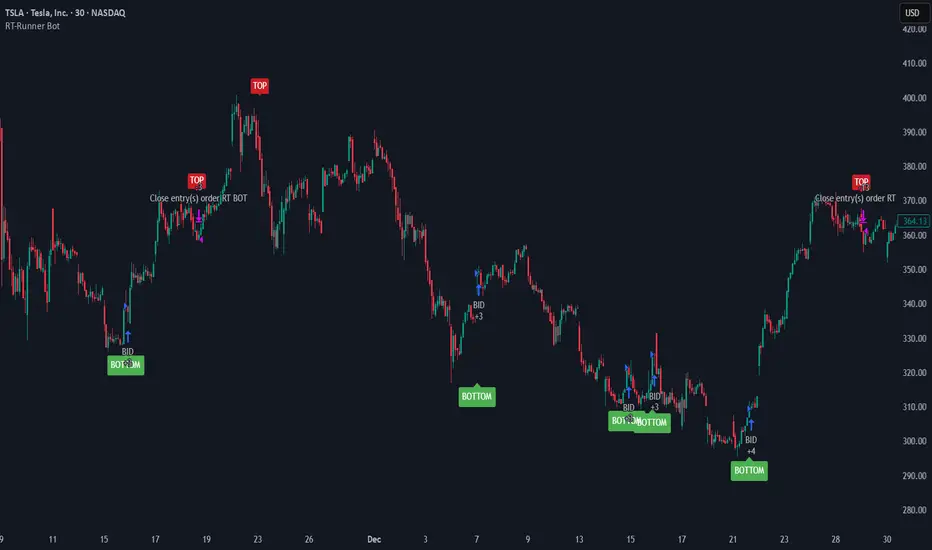
RT-Runner BotRunner Bot is a trend following tool designed to highlight when price shifts from normal back and forth rotation into stronger directional moves. It is built to help traders focus on higher quality trend legs, stay patient during chop, and avoid forcing trades when conditions are not aligned.
Blurring The Lines - Indicator vs Bot
Rainbow Trends set out to combine some of the ideas behind automated trading bots with the flexibility of trading indicators. After years of development, Runner Bot was built as an "indicator bot" that can be applied across multiple assets and multiple timeframes from the same interface.
How It Works
This tool aims to identify points where large market players - the "whales" - may be more likely to reverse the trend. It generates BOTTOM signals when its conditions suggest a potential market bottom has formed, and TOP signals when it detects that a potential top has been reached.
These signals are plotted directly on the chart so traders can visually review where Runner Bot has flagged prior tops and bottoms and compare them with their own levels, structure, and risk management.
How It Changes With Timeframe
Runner Bot identifies trend reversals based on the selected timeframe. The same logic can be applied across intraday, swing, and macro views, but its behavior will naturally change:
For macro level reversals, many traders focus on higher timeframes such as H4 to H12.
If you are scalping, you can switch to much lower timeframes, but keep in mind that bottoms detected on shorter intervals are less reliable at predicting a true long term bottom.
Choosing the timeframe intentionally is important: higher timeframes tend to highlight larger structural tops and bottoms, while lower timeframes are more sensitive to short term noise.
Tuning The Bot
Runner Bot was built to be relatively turnkey, but it does allow users to tune it for specific timeframes and assets.
To adjust the sensitivity of the TOP/BOTTOM prints, adjust the first two values in the settings column:
Decreasing these values (negative adjustments) will generally increase the number of TOP/BOTTOM signals the bot will fire.
Increasing these values will do the opposite and make TOP/BOTTOM signals less common.
This lets traders decide whether they want Runner Bot to be more selective (fewer, higher conviction style signals) or more frequent (more signals for active traders).
The trader also has the option to toggle the signals On/Off as desired. Some traders prefer to only plot TOPs and not BOTTOMs, or only BOTTOMs and not TOPs, depending on their strategy.
Limitations Of The Tool
Under the hood, Runner Bot uses internal algorithms working together to analyze price action. It can be applied across multiple timeframes, but like any tool, it has its sweet spots:
On higher ranges like 12H to 1D, you will mostly see TOP signals, which can be useful for monitoring extended moves.
On ultra low timeframes under 15 minutes, market noise can increase and short term bottoms are less reliable as long term turning points.
Fine tuning your settings to match your strategy, asset, and timeframe is recommended rather than relying on one configuration for every situation.
Preferred Settings
Over time, a few configurations have become common starting points:
H4 - A core timeframe to start catching both Tops and Bottoms across TradFi, Crypto, and Commodities.
H2/H4 Combo - Monitoring Bottoms on H2 and taking profits on H4 has been a popular combination among Rainbow Theory traders. H2 can provide earlier entries, while H4 offers a more conservative, lagging exit.
1D/H24 - Helpful for macro Tops in both TradFi and Crypto when combined with other higher timeframe context.
These are not rules, but practical examples of how some traders choose to deploy Runner Bot.
Automating Alerts
Runner Bot can also be connected to standard TradingView alerts so TOP and BOTTOM signals do not need to be watched manually on every bar.
A typical alert setup:
Symbol - Set to the asset you are charting.
Condition - Set to Runner Bot (this will use the settings you currently have on the chart).
Condition detail - Use the alert() function calls only so the tool can send alerts when TOP or BOTTOM signals fire.
Interval - Same as chart (this locks alerts to the timeframe you set them up on).
Once alerts are configured, TradingView can notify you according to your alert preferences whenever Runner Bot detects a new TOP or BOTTOM based on your current settings.
Important Note
Runner Bot is intended to provide additional context around tops, bottoms, and broader trend behavior. It is not a standalone signal generator and should always be used together with your own analysis, testing, and risk management. Historical Runner Bot signals and past market reversals do not guarantee future results.
🐋 Tight lines and happy trading!
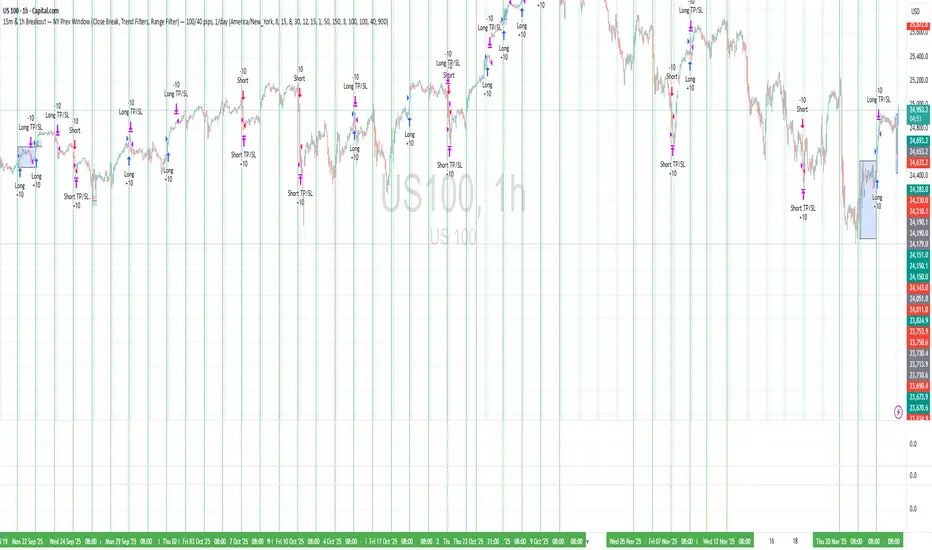
15m & 1h Breakout — NY Prev Window Define a session anchored at 09:15 New York time, adjusted safely around weekends.
For each new session, store the high and low of the previous session’s 09:15→09:15 window.
During a configurable entry window (default: 09:30–11:15 NY time), watch for close-based breakouts:
Long when price closes above the previous window high + buffer.
Short when price closes below the previous window low − buffer.
Take exactly one trade per session, with fixed TP/SL in pips, and optional:
EMA trend filters for longs and shorts.
Range (volatility) filter on the previous window.
Option to skip Thursdays.
The strategy is designed mainly for intraday timeframes (e.g. 15m / 1h), but the logic is timeframe-agnostic.