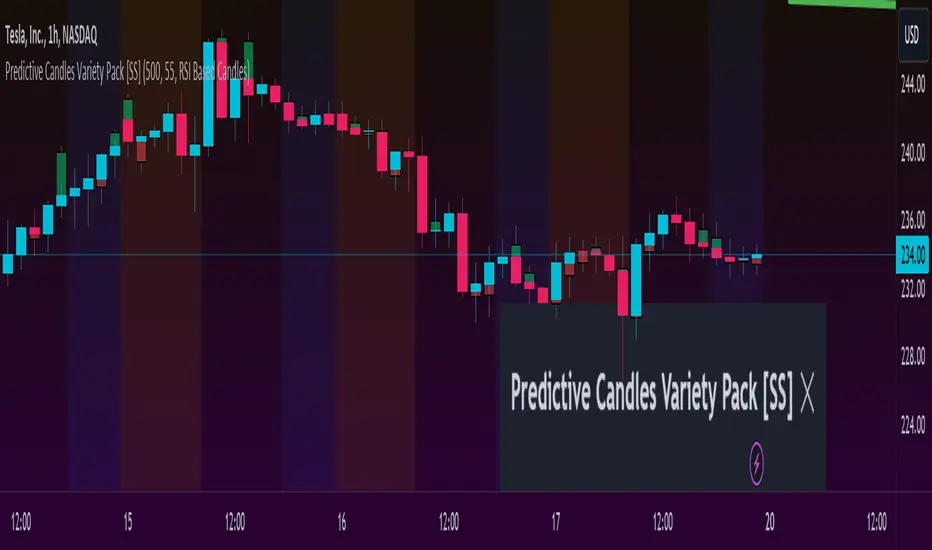
Swing Highs/Lows & Candle Patterns [LuxAlgo]This script labels swing highs and swing lows as well as the candle pattern that occurred at that precise point. The script can detect the following 6 candle patterns: hammer, inverse hammer, bullish engulfing, hanging man, shooting star, and bearish engulfing.
This indicator by its very nature backpaints by default, meaning that the displayed components are offset in the past.
🔶 USAGE
It can be interesting to see if a top or bottom is associated with a specific candle pattern, this allows us to study the potential of such a pattern to indicate a reversal. You can hover on a label with a specific pattern to see more details about it.
The notations HH, HL, LH, and LL you can see on the labels are defined as follows:
HH : Higher high
HL : Higher low
LH : Lower high
LL : Lower low
🔶 SETTING
Length: Sensitivity of the swing high/low detection, with lower values returning the maximum/minimum of shorter-term price variations.
Search in scripts for "candle"
HTF Candlestick Patterns [TradingView] vX by DGTCandlesticks are graphical representations of price movements for a given period of time. They are commonly formed by the opening, high, low, and closing prices of a financial instrument. They have their origins in the centuries-old Japanese rice trade and have made their way into modern day price charting.
It’s important to note that candlestick patterns aren’t necessarily a buy or sell signal by themselves. They are instead a way to look at market structure and a potential indication of an upcoming opportunity. It is always useful to look at candlestick patterns in context like any other market analysis tool and candlestick patterns are most useful when used in combination with other techniques. There are countless candlestick patterns that traders can use to identify areas of interest on a chart, where some candlestick patterns may provide insights into the balance between buyers and sellers, others may indicate a reversal, continuation, or indecision.
Reversal patterns are quite useful when used in context. Reversal patterns should form at the bottom of a downtrend or at the top of an uptrend. Otherwise, they are not a reversal patterns, but continuation patterns. Most reversal patterns require confirmation such as price move in the direction of reversal accompanied by appropriate trading volume. The reversal patterns can further be confirmed through other means of traditional technical analysis—like trend lines, momentum, oscillators, or volume indicators—to reaffirm buying or selling pressure. The patterns themselves do not guarantee that the trend will reverse. Investors should always confirm reversal by the subsequent price action before initiating a trade.
This study implements some of the most commonly used candlestick patterns in a context with directional movement indicator. On request users can adjust the strong trend threshold from dialog box, eighter can disabled correlation with directional movement indicator. To add additional sight to analysis the simple moving averages of 20, 50, 100 and 200 periods are added (configurable)
You may add additional indicators of your choice. Colored DMI, BB Cloud or Price Distance to its MAs may help
Enjoy it!
Disclaimer: The script is for informational and educational purposes only. Use of the script does not constitutes professional and/or financial advice. You alone the sole responsibility of evaluating the script output and risks associated with the use of the script. In exchange for using the script, you agree not to hold dgtrd tradingview user liable for any possible claim for damages arising from any decision you make based on use of the script
Candlestick Reversal SystemHello Traders,
In the book "Secrets of a Pivot Boss: Revealing Proven Methods for Profiting in the Market" by Franklin Ochoa, Four different types of reversal systems were introduced and candlestick patterns are used to find reversals. I will not write a lot about the book, you should get/read it for yourself. There are many great ideas in the book, Candlesetick Reversal System, Following Trend, Time Price Opportunity, Advanced Camarilla Concepts and much more.
Reversal systems mentioned in the book are :
- Wick Reversal System
- Exteme Reversal System
- Outside Reversal System
- Doji Reversal System
I tried to add these four reversal systems to the script. If you need detailed info you better read the book ;)
Enjoy!
BH - Candlestick Pattern DetectionThis is a script to help the beginners locate the candle patterns. It has a nice code that can be used in other scripts too. Easy to use with separated functions, simple patterns and complex patterns detections.
I have done some updates at the Candlestick Patterns Identified script by @repo32. Was a good start of my ideia. Tks for sharing repo.
It will be always under constant development but I want to share this first version to know what can be done to get better, improve, get more desired patterns, know what are you guys using that could be helpful.
I still need to check if all patterns are correct.
Any comments, help and suggestions will be appreciated.
Marcos Issler @ Isslerman
Previous Candle High/Low (Global Rays)Previous Candle High/Low (Global Rays, Corrected)
This indicator tracks the high and low of the most recently closed candle and projects them forward as global horizontal rays.
Features:
✅ Automatically updates the levels once a candle fully closes.
✅ Draws persistent lines at the previous candle’s high (green) and low (red), extending them into the future.
✅ Highlights real-time breakouts:
✅ Includes built-in alert conditions for both breakout events.
How to Use:
Use the levels as reference points for breakout trades, liquidity sweeps, or stop hunts.
Alerts can help you catch moves without needing to constantly watch the chart.
Works on any timeframe and symbol.
Efficient Candle Range (ECR)Efficient Candle Range (ECR)
A custom-built concept designed to detect zones of efficient price movement, often signaling the start, pause, or end of an implied move.
What is the Efficient Candle Range?
The Efficient Candle Range (ECR) is a unique tool that identifies price zones based on efficient candles—candles with relatively small bodies and balanced wicks. These candles reflect balanced or orderly price action, and when grouped into a range, they can reveal areas of temporary equilibrium in the market.
Rather than focusing on single candles, ECR builds a range that dynamically adjusts as new efficient candles form. This gives traders an objective way to track potential areas of absorption, distribution, or transition.
Why use ECR?
Efficient candles often occur:
At the beginning of a new move, after a liquidity sweep or shift in sentiment
At the end of a strong move, as momentum fades
Within consolidation zones, where price trades in a balanced, indecisive state
While ECRs can appear in any market condition, their interpretation depends on context:
In a range, an ECR might just reflect sideways balance.
But after a sweep or breakout, it could signal a potential shift in direction or continuation.
A close outside the ECR often marks the end of that balance and the start of a new impulse.
How it works
The script detects efficient candles based on body-to-range ratio and wick symmetry.
Consecutive ECs are grouped into a live ECR box.
The box dynamically extends as long as price stays inside the high-low range.
Once a candle closes outside, the ECR is considered invalid (fades visually, but remains visible for reference).
Each active range is labeled "ECR" within the box for easy tracking.
Customizable in settings
Max body percentage of range
Max wick imbalance
Box and label color/transparency
Suggested usage
Let the ECR define your observation zone.
Instead of reacting immediately to an efficient candle, wait for a confirmed breakout from the ECR to validate the next move.
Whether you trade breakouts, reversals, or continuation setups, ECR provides an objective way to visualize price balance and understand when the market is likely to expand.
Designed for individual traders looking to build structure around efficient price movement — no specific methodology required.
Tradeable Candle Detection By Raja SaienTradeable Candle Detection By Raja Saien
Overview:
This advanced candle detection tool is designed to help traders identify high-quality trade setups and avoid fake moves, based on candle structure, volume, and RSI conditions. Unlike many indicators that are limited to specific sessions, this script works across all market sessions, giving you full flexibility to trade 24/7.
🔍 Key Features:
All Session Support (24/7 Trading)
Detects tradeable setups during any time of the day, including Asian, London, New York, and overlapping hours.
No restriction to any specific session — trade when the opportunity is there!
Fake Move Detection 🚫
Identifies candles with long wicks, small bodies, and low volume — typical signs of manipulation or indecision.
Displays a “No Trade Zone – Fake Move” label to help you avoid poor entries.
Real Move Detection ✅
Highlights candles with strong bodies, short wicks, and high volume — ideal conditions for trade entries.
Helps you focus only on high-probability, momentum-driven moves.
RSI-Based Confirmation
Uses RSI to ensure trade entries align with momentum:
Bullish Entry Allowed: Candle is bullish + RSI between 50–75.
Bearish Entry Allowed: Candle is bearish + RSI between 25–50.
Avoid Trades: RSI is overbought/oversold or showing divergence.
Divergence Detection
Detects bearish divergence in bullish setups and bullish divergence in bearish setups — warns against risky entries.
Visual Zones & Candle Highlights
Plots horizontal lines at candle highs/lows and extended zones based on candle range.
Dominant candles are highlighted in black for quick visual spotting.
⚙️ Custom Inputs:
Minimum Body Size Threshold
Wick-to-Body Ratio for Fake Move
Volume Strength Multiplier
Candle Dominance Precision (% of range)
RSI Period and Source
Optional session filter (can be turned off to enable all-session detection)
🛎️ Alerts Included:
✅ Long Entry Confirmed – Strong bullish candle with supporting RSI
✅ Short Entry Confirmed – Strong bearish candle with supporting RSI
🚫 Fake Move Detected – Weak structure + low volume, no trade
🧠 How to Use:
Wait for a dominant black candle to appear.
Read the label to understand:
✅ Green = Trade Allowed
⚠️ Orange = Avoid (due to RSI or divergence)
🚫 Red = Fake Move (stay out)
Combine with support/resistance, SMC, or price action strategy for confluence.
🟢 "Trade any session, any time – with confidence, precision, and control. Powered by Raja Saien."
Built for traders who value smart entries and reliable signals across all time zones.
Hybrid candles by Marian BDescription
-------------
This script it does a very simple thing: it will color the candles according to the HeikenAshi rules.
It will keep the regular candle shape, but with the HeikenAshi colors. Some traders find it useful, especially those using the ATS methodology.
Originality
-------------
This script is not at all orginal and it will not make you win trades. There are a few others out there, but I could not find a public one that also colors the wicks; most of them just handle the color of the candle body.
Chart
-------
See a sample screenshot how it will look like.
Supply/Demand Zones (Synthetic SMA Candles)Supply/Demand Zones (Synthetic SMA Candles)
Created by The_Forex_Steward
This indicator highlights institutional-style supply and demand zones using synthetic SMA-based candles rather than raw price data. It provides a smoother, more refined view of price action to help identify key imbalance areas where price is likely to react.
Features:
- Uses SMA-smoothed synthetic candles to detect bullish and bearish engulfing structures
- Draws demand zones after bullish breakouts and supply zones after bearish breakouts
- Zones are persistent for a customizable number of bars
- Mitigated zones can optionally be removed from the chart
- Includes alerts for breakout and mitigation events
- Optional plotting of synthetic candles over price for visual clarity
How It Works:
When a synthetic candle closes above the high of a previous bearish candle, a bullish engulfing is detected, and a demand zone is created from that bearish candle’s high and low. Conversely, when price closes below the low of a previous bullish candle, a supply zone is formed. These zones stay on the chart for the user-defined duration or until they are mitigated by price, at which point they can be removed automatically.
How to Use:
- Adjust the SMA Length to control how smooth the synthetic candles appear
- Enable or disable Show Supply Zones and Show Demand Zones as needed
- Set the Zone Duration to control how long each zone persists
- Use Delete Mitigated Zones to automatically remove zones when price returns to them
- Optionally enable Show Synthetic SMA Candles to see the candle logic used in detection
- Use the built-in alerts to stay notified of new zone creation or mitigation
Note: This tool is most effective when combined with structure or trend-based strategies for confirmation.
8:15 AM 15-min Candle Box on 5-min Chart with TP and SLThe “8:15 AM 15-min Candle Box on 5-min Chart with TP and SL” indicator is a custom-built Pine Script tool for breakout trading strategies, particularly tailored for assets like NASDAQ Futures (NAS100) during the U.S. market pre-open.
🔍 What It Does:
Tracks the 8:15–8:30 AM Central Time (CDT) Candle:
It marks the high and low of the 15-minute candle that starts at 8:15 AM (CDT).
The box visually outlines this price range.
Draws a Breakout Box:
At 8:30 AM, a box is drawn from the 8:15 candle’s high and low.
The box stretches forward 8 hours into the session, helping you visualize price interaction with that range.
Detects Breakouts:
If the price closes above the high, it signals a buy breakout.
If it closes below the low, it signals a sell breakout.
Automatically Calculates TP and SL:
Take Profit (TP): 50 pips from the breakout level in the direction of the trade.
Stop Loss (SL): 40 pips in the opposite direction.
Pips are calculated using the symbol’s minimum tick size.
Color Feedback:
Box turns green on a buy breakout, red on a sell breakout.
If TP is reached, the box turns black.
If SL is hit, the box turns purple.
🧠 Why Use This Indicator:
Perfect for pre-market breakout traders who want a visual confirmation of price action around the U.S. market open.
Provides a clear entry range, trade direction, and risk/reward visual cue.
No manual drawing — everything is automated daily based on reliable timing.
Would you like a version with alerts or plotted TP/SL lines as well?
Accumulation-Distribution CandlesThis structural visualization tool maps each candle through the lens of Effort vs. Result, blending Volume, Range, and closing bias into a normalized pressure score. Candle bodies are dynamically color-coded using a five-tier system—from heavy accumulation to heavy distribution—revealing where energy is building, dispersing, or neutral. This helps to visually isolate Markup, Markdown, Re-accumulation, and Distribution at a glance.
The indicator calculates a strength score by multiplying price result (close minus open) by effort (volume or price range), smoothing this raw value using a Fibonacci-based EMA. (34 for standard, 55 for crypto; the higher crypto value acknowledges that 24/7 trading offers more hours per week or month than trad markets.) The result is standardized against its rolling deviation and clamped to a range. This score determines the visual tier:
• 💙 Dark Blue = heavy Accumulation (strong upward result on strong effort)
• 🩵 Pale Blue = mild Accumulation
• 🌚 Gray = neutral (low conviction or balance)
• 💛 Pale Yellow = mild Distribution
• 🧡 Deep Yellow = heavy Distribution (strong downward result on strong effort)
The tool is optimized for the 1D chart, where Wyckoff phases are most clearly expressed. However, it adapts well to lower timeframes when used selectively. Traders may hide the body coloring and enable only zone highlighting to preserve other candle overlays such as SUPeR TReND 2.718, which offers directional clarity and trend duration. This combination is especially useful on intraday charts (15m–1H) where microstructure matters but visual clutter must be avoided.
When used alongside other Volume overlays (such as the OBVX Conviction Bias) or Volatility indicators (such as the Asymmetric Turbulence Ribbon (ATR)), this indicator adds confluence to directional setups by contextualizing pressure with Volatility. For example: compression zones marked by ATR may align with persistent pale blue candles—indicating quiet Accumulation before expansion.
Optional Overlays:
Normally ON -
• 📌 Pin Bars , filtered by volume, to isolate wick-dominant reversals from key zones
• 💪🏻 Strong-Body Candles — fuchsia candles w/ high body-to-range ratio reflect conviction
• 🧯 Wick Absorption Candles — red candles w/ long wicks and low closing strength indicate failed pushes or absorbed breakouts
• 🟦/🟧 Zone Highlighting for candles above a defined Accumulation/Distribution threshold
Normally OFF -
• 🔺 Fractals (5-bar) to map swing pivots by underlying pressure tier (normally OFF)
• 🟥/🟩 Engulfing patterns, filtered by directional conviction (normally OFF)
The Pin Bar strategy benefits most from the zone logic—when a bullish pin bar appears in an Accumulation zone (esp. pale or dark blue), and Volume exceeds its rolling average, it may mark a spring or failed breakdown. Conversely, bearish pins in Distribution zones can mark rejection or resistance.
This is not a signal engine—it’s a narrative filter designed to slot cleanly into a multi-layered workflow of visual structure and informed execution. Use it to identify bias and phase. Then deploy trade triggers from tools like SUPeR TReND 2.718, or the liquidity flows shown the The Silver Lining or the AltSeasonality - MTF indicators, for example. The candle colors tell you who’s in control—the other tools tell you when to act.
Momentum Candle Identifier # Momentum Candle Identifier
This indicator helps traders identify significant momentum candles by analyzing candle body size relative to recent price action (think after consolidation periods). Unlike traditional volatility indicators, this tool specifically focuses on price movement captured by the candle body (open to close distance), filtering out potentially misleading wicks.
## How It Works
- The indicator calculates the average candle body size over a user-defined lookback period
- Momentum candles are identified when their body size exceeds the average by a customizable threshold multiplier
- Bullish momentum candles (close > open) are highlighted in a user defined color
- Bearish momentum candles (close < open) are highlighted in a user defined color
- A real-time information panel displays key metrics including current average body size and threshold values
## Key Features
- Focus on candle body size rather than full range (high to low)
- Custom lookback period to adapt to different timeframes
- Adjustable threshold multiplier to fine-tune sensitivity
- Customizable colors for bullish and bearish momentum candles
- Optional labels for momentum candles
- Information panel showing lookback settings, average size, and momentum candle count
## Usage Tips
- Use shorter lookback periods (3-5) for more signals in choppy markets
- Use longer lookback periods (8-20) to identify only the most significant momentum moves
- Higher threshold multipliers (2.0+) will identify only the strongest momentum candles
- Combine with trend indicators to find potential reversal or continuation signals
- Look for clusters of momentum candles to identify strong shifts in market sentiment
This indicator helps identify candles that represent significant price movement relative to recent activity, potentially signaling changes in market momentum, sentiment shifts, or the beginning of new trends.
Volume Footprint POC for Every CandleCalculating and plotting the Point of Control (POC) for every candle on a volume footprint chart can provide valuable insights for traders. Here are some interpretations and uses of this information:
1. Identify Key Price Levels
Highest Traded Volume: The POC represents the price level with the highest traded volume for each candle. This level often acts as a significant support or resistance level.
Confluence Zones: When multiple POCs align at similar price levels over several candles, it indicates strong support or resistance zones.
2. Gauge Market Sentiment
Buyer and Seller Activity: High volume at certain price levels can indicate where buyers and sellers are most active. A rising POC suggests stronger buying activity, while a falling POC suggests stronger selling activity.
Volume Profile: Analyzing the volume profile helps in understanding the distribution of traded volume across different price levels, providing insights into market sentiment and potential reversals.
3. Spot Trends and Reversals
Trend Continuation: Consistent upward or downward shifts in POC levels can indicate a trend continuation. Traders can use this information to stay in trending positions.
Reversal Signals: A sudden change in the POC direction may signal a potential reversal. This can be used to take profits or enter new positions.
4. Intraday Trading Strategies
Short-Term Trading: Intraday traders can use the POC to make informed decisions on entry and exit points. For example, buying near the POC during an uptrend or selling near the POC during a downtrend.
Scalping Opportunities: High-frequency traders can use shifts in the POC to scalp small profits from price movements around these key levels.
5. Volume-Based Indicators
Confirmation of Other Indicators: The POC can be used in conjunction with other technical indicators (e.g., moving averages, RSI) to confirm signals and improve trading accuracy.
Support and Resistance: Combining the POC with traditional support and resistance levels can provide a more comprehensive view of the market dynamics.
In summary, the Point of Control (POC) is a valuable tool for traders to understand market behavior, identify key levels, and make more informed trading decisions. If you have specific questions or need further details on how to use this information in your trading strategy, feel free to ask! 😊
Longest Candles HighlighterDescription:
The Longest Candles Highlighter is a simple yet effective tool that identifies and highlights candles with significant price ranges. By visually marking candles that meet specific size criteria, this indicator helps traders quickly spot high-volatility moments or significant market moves on the chart.
Features:
1. Customizable Candle Range:
- Define the minimum and maximum candle size in pips using input fields.
- Tailor the indicator to highlight candles that are most relevant to your trading strategy.
2. Flexible for Different Markets:
- Automatically adjusts pip calculation based on the instrument type (Forex or non-Forex).
- Accounts for differences in pip values, such as the 0.01 pip for JPY pairs in Forex.
3. Visual Highlighting:
- Highlights qualifying candles with a customizable background color for easy identification.
- The default color is red, but you can choose any color to match your chart theme.
4. Precision and Efficiency:
- Quickly scans and identifies candles that meet your criteria, saving you time in analyzing charts.
- Works seamlessly across all timeframes and asset classes.
How It Works:
- The indicator calculates the range of each candle in pips by subtracting the low from the high and dividing by the appropriate pip value.
- It checks whether the candle's size falls within the user-defined minimum and maximum pip range.
- If the conditions are met, the background of the candle is highlighted with the specified color, drawing your attention to significant price movements.
Use Case:
- This indicator is ideal for identifying key market moments, such as breakouts, volatility spikes, or significant price movements.
- Traders can use it to quickly locate large candles on any chart, aiding in technical analysis and strategy development.
This tool simplifies the process of spotting important candles, empowering traders to make faster and more informed trading decisions.
First 5-Minute Candle BoxTitle: "First 5-Minute Candle Box Indicator"
Description:
Introducing the "First 5-Minute Candle Box" indicator for TradingView! This powerful script is designed to help traders visualize and analyze the high and low prices of the first 5-minute candle of each trading day. By clearly marking this crucial price range, traders can gain valuable insights into potential support and resistance levels right from the start of the trading session.
Features:
First 5-Minute Candle High and Low: Automatically captures and displays the high and low prices of the first 5-minute candle of the trading day, providing key levels for intraday trading strategies.
Daily Reset: Resets the high and low variables at the beginning of each new trading day to ensure accurate data capture for the current session.
Visual Box Representation: Draws a visual rectangle box on the chart from the start of the trading day to the end, highlighting the range between the high and low of the first 5-minute candle.
Customizable Appearance: The box is drawn with a customizable border color and background color, allowing traders to personalize the indicator to their chart's aesthetic.
Usage:
Add the indicator to your TradingView chart to automatically display the high and low of the first 5-minute candle of each trading day.
Utilize these levels as potential support and resistance zones for your intraday trading strategies.
Gain an early edge in your trading day by identifying key price levels right from the market open.
Code Explanation:
Variable Initialization: The script initializes variables to store the high and low prices of the first 5-minute candle.
Daily Reset Logic: At the start of a new day, the variables are reset to ensure they capture the correct data for the new trading session.
Price Capture Logic: The high and low prices of the first 5-minute candle are captured and stored.
Box Drawing Logic: The script defines the start and end times for the visual box and draws the rectangle if the high and low prices are set.
Customizable Box: The box is drawn with specified colors and border properties, providing a clear visual representation on the chart.
Enhance your trading analysis with the "First 5-Minute Candle Box" indicator. Add it to your TradingView chart today and start leveraging the power of early price action!
Dead Simple Heikin Ashi Candles (HA Candles)Are you looking for a dead simple calculation of the Heikin Ashi candles as they are calculated in tradingview? Here it is!
I was looking through the library and I saw that many have come up with a lot of awesome scripts using heikin ashi candles. But, I can't find anywhere that had the straightforward simple version of how Tradingview calculates them. This was a problem for me because I realized after punching the formula in that TradingView doesn't calculate HA candles in the original way.
You might say they don't calculate them the "right" but, spoiler alert, there is no right in trading. You can only be rational or irrational as you make money or lose money.
This is useful to me for building out some portions of an algo that are not going to be compatible with the built-in function. It happens. So, if you were looking for it too, hopefully it saves you some time.
For reference the original calc of HA candles is:
o = (prev_HA_open + prev_HA_close) / 2
h = math.max(high, ha_open, ha_close)
l = math.min(low, ha_open, ha_close)
c = ohlc4
Trade Well.
% Change CandleThis script creates a trading indicator that shows how much the price of a financial instrument (like a stock or currency) changes within each trading period, represented by candles on a chart. Each candle shows the range of prices from the highest to the lowest within a specific time frame.
The indicator calculates the percentage difference between the highest and lowest prices for each candle. If the closing price of the candle is higher than the opening price, suggesting that the price has gone up during that period, the indicator will display this percentage increase as a green line. Conversely, if the closing price is lower than the opening price, indicating a price decrease, it will display the percentage decrease as a red line.
In simple terms, this indicator provides a visual way to see how much and in which direction the price is moving during each trading period, with green lines showing periods of price increase and red lines showing periods of price decrease.
FalconRed 3 Candlestick LevelsThis Pine Script indicator is designed to enhance price action analysis by identifying specific candle patterns that signal potential buying and selling levels. The analysis is based on the characteristics of the current candle and its two immediate predecessors.
For identifying buying levels, the script examines the wicks of the candles, highlighting areas where buying and selling struggle is evident. The indicator recognizes significant breaks above wick levels, especially when followed by a subsequent candle with a lower wick. This combination suggests that previous selling pressure has been challenged and overcome.
Buy breakout and retest levels are highlighted with green color, providing a clear visual indication of potential buying opportunities. The indicator draws horizontal lines that extend to the right, offering insights into the frequency of retests and the recurrence of similar patterns in specific price zones, thereby confirming and reinforcing the observed price action.
Similarly, the indicator scrutinizes the selling side, pinpointing breakdown and retest levels. These areas are highlighted with red color, aiding in the identification of potential selling opportunities.
This indicator serves as a valuable tool for analyzing price action levels and visualizing buying and selling areas. It can be effectively combined with other technical indicators to enhance confidence in trading decisions. Gain deeper insights into market dynamics and improve decision-making by integrating this candle pattern analysis indicator into your trading strategy.
Price-Action Candles (Lower)What is a swing high or swing low?
Swing highs and lows are price extremes. For example say we set our swing length to 5. A candle that is a swing high with a swing length of 5 will have 5 bars to the left that are lower and 5 bars to the right that are lower. A candle that is a swing low with a swing length of 5 will have 5 bars to the left that are higher and 5 bars to the right that are higher.
How is the trend coloring calculated?
The trend coloring is calculated the exact same way as our trend candles study... by storing and comparing historical swing lows and swing highs.
The pinescript code goes as follows:
var int trend = na
trend := ((hh and high >= psh) or close > csh) ? 1 : ((ll and low <= psl) or close < csl) ? -1 : lh or hl ? 0 : trend
What does that gibberish mean?
-Trend can be GREEN IF
- We have a higher high (current swing high is greater than the previous swing high) and the high is greater than the previous swing high
- OR The current close is greater than the current swing high
-Trend can be RED IF
- We have a lower low (current swing low is less than the previous swing low) and the low is less than the previous swing low
- OR The current close is less than the current swing low
-Trend can be YELLOW IF
- We have a new swing high and the new swing high is less than the previous swing high
- OR We have a new swing low and the new swing low is greater than the previous swing low
If none of the conditions above are true then we continue with whatever color the previous bar was.
What is repainting?
Repainting is "script behavior causing historical vs realtime calculations or plots to behave differently." That definition comes directly from Tradingview. If you want to read the full explanation you can visit it here www.tradingview.com . The price-action candles use swing highs and swing lows which need bars to the left (past) and bars to the right ("future") in order to confirm the swing level. Because of the need to wait for confirmation for swing levels the plot style can be repainting. The Price-Action Candles (Lower) indicator, or this indicator, has no repainting anywhere. We opt to not shift back the candle coloring which causes the repainting, but it is relevant to discuss since this indicator's sibling (Price-Action Candles) can have repainting labels.
Repaint
Here the labels are shifted back the price-action length. Repainting is not present in the Price-Candles (Lower) study, but can be found in this indicator's sibling (Price-Action Candles).
Non-Repaint
Here the labels are not shifted back or "repainted". Repainting is not present in the Price-Candles (Lower) study, but can be found in this indicator's sibling (Price-Action Candles).
Multi-timeframe Analysis
The users can view multi-timeframe historical price action trend via this lower study. Each timeframe is plotted as its own on the lower pane and you can determine what timeframe it is by the label next to the plot.
More examples
Pair the Price-Action Candles (Lower) indicator with our main price indicator that colors candles based on trend and can show price action labels.
Price-Action CandlesWhat is a swing high or swing low?
Swing highs and lows are price extremes. For example say we set our swing length to 5. A candle that is a swing high with a swing length of 5 will have 5 bars to the left that are lower and 5 bars to the right that are lower. A candle that is a swing low with a swing length of 5 will have 5 bars to the left that are higher and 5 bars to the right that are higher.
How are the trend candles calculated?
The trend candles are calculated by storing and comparing historical swing lows and swing highs.
The pinescript code goes as follows:
var int trend = na
trend := ((hh and high >= psh) or close > csh) ? 1 : ((ll and low <= psl) or close < csl) ? -1 : lh or hl ? 0 : trend
What does that gibberish mean?
-Candle can be GREEN IF
- We have a higher high (current swing high is greater than the previous swing high) and the high is greater than the previous swing high
- OR The current close is greater than the current swing high
-Candle can be RED IF
- We have a lower low (current swing low is less than the previous swing low) and the low is less than the previous swing low
- OR The current close is less than the current swing low
-Candle can be YELLOW IF
- We have a new swing high and the new swing high is less than the previous swing high
- OR We have a new swing low and the new swing low is greater than the previous swing low
If none of the conditions above are true then we continue with whatever color the previous bar was.
What is repainting?
Repainting is "script behavior causing historical vs realtime calculations or plots to behave differently." That definition comes directly from Tradingview. If you want to read the full explanation you can visit it here www.tradingview.com . The price-action candles use swing highs and swing lows which need bars to the left (past) and bars to the right ("future") in order to confirm the swing level. Because of the need to wait for confirmation to for swing levels the plot style can be repainting. With the price-action candles indicator the only repainting part of the indicator is the labels. The price-action candles themselves WILL NOT REPAINT. The labels however can be set to repaint or not depending on the user preference. If the user opts to use repainting then the label location is shifted back by the length of the price-action. So if the "Price-Action Length" input is set to 10, and the user wants repainting, the swing high/low label will be shifted back 10 bars. If the user opts for no repainting, the label will not be shifted and instead show on the exact bar the swing level was confirmed.
Examples Below.
Repaint
Here the labels are shifted back the price-action length.
Non-Repaint
Here the labels are not shifted back because the input setting is set to not repaint.
Multi-timeframe Analysis
The users can view the trend from multiple different timeframes at once with a table displayed at the bottom of their charts. The timeframe can be lower or higher than the chart timeframe.
More examples
Be on the lookout for the Price Action Candles (Lower) indicator where you can view the multi-timeframe labels on a lower price grid in order to see the history over time!
ICT HTF Candles [Source Code] (fadi)Plotting a configurable higher timeframe on current chart's timeframe helps visualize price movement without changing timeframes. It also plots FVG and Volume Imbalance on the higher timeframe for easier visualization.
With ICT concepts, we usually wait for HTF break of structure and then find an entry on a lower timeframe. With this indicator, we can set it to the HTF and watch the develop of price action until the break of structure happens. We can then take an entry on the current timeframe.
Settings
HTF Higher timeframe to plot
Number of candles to display The number of higher timeframe candles to display to the right of current price action
Body/Border/Wick The candle colors for the body, border, and wick
Padding from current candles The distance from current timeframe's candles
Space between candles Increase / decrease the candle spacing
Candle width The size of the candles
Imbalance
Fair Value Gap Show / Hide FVG on the higher timeframe
Volume Imbalance Show / Hide Volume Imbalance on the higher timeframe
Trace
Trace lines Extend the OHLC lines of the higher timeframe and the source of each
Label Show/Hide the price levels of the OHLC
LTF Candle Insights (Zeiierman)█ Overview
The LTF Candle Insights indicator allows traders to explore the finer details of the market by integrating lower time frame (LTF) data into their current chart, offering a more detailed and nuanced view of price movements. This comprehensive visual tool is crucial for traders who want to investigate complex market trends without the constant need to switch between different chart timeframes.
In essence, this indicator overlays the smaller details into the broader frame, enabling traders to grasp the fine points while examining the larger market picture.
█ How It Works
The LTF Candle Insights indicator easily puts LTF candles onto the current chart, allowing traders to see both the current timeframe and the chosen lower timeframe candles at the same time. This dual view helps traders see the main market trends and important price levels, helping them get a better understanding of the little details and complexities of the market.
█ How to Use
Trend Analysis
Traders can use this indicator to look closely at smaller market trends by comparing LTF candles with the candles of the current timeframe. Knowing the trends in LTF helps traders make trades that go along with the small market movements.
Support and Resistance Identification
By looking at the high, low, and middle levels of LTF candles, traders can find possible support and resistance areas. This detailed look helps traders pick the best times to enter or exit trades, set up stop-losses effectively, and manage risk carefully.
█ Settings
Lower Timeframe and Candle Amount
Users can determine the lower timeframe and the number of LTF candles they wish to observe on their current chart.
Range Lines
The high/low range of the illustrated candles and the optional mid-range line can be displayed, granting insights into significant price levels and ranges.
Table Display
A summary table can be displayed, outlining details of the current chart's timeframe and the chosen LTF, providing a succinct overview for traders.
-----------------
Disclaimer
The information contained in my Scripts/Indicators/Ideas/Algos/Systems does not constitute financial advice or a solicitation to buy or sell any securities of any type. I will not accept liability for any loss or damage, including without limitation any loss of profit, which may arise directly or indirectly from the use of or reliance on such information.
All investments involve risk, and the past performance of a security, industry, sector, market, financial product, trading strategy, backtest, or individual's trading does not guarantee future results or returns. Investors are fully responsible for any investment decisions they make. Such decisions should be based solely on an evaluation of their financial circumstances, investment objectives, risk tolerance, and liquidity needs.
My Scripts/Indicators/Ideas/Algos/Systems are only for educational purposes!
All Candlestick Patterns Screener [By MUQWISHI]▋ INTRODUCTION :
The Candlestick Patterns Screener has been designed to offer an advanced monitoring solution for up to 40 symbols. Utilizing a log screener style, it efficiently gathers information on confirmed candlestick pattern occurrences and presents it in an organized table. This table includes essential details such as the symbol name, signal price, and the corresponding candlestick pattern name.
_______________________
▋ OVERVIEW:
_______________________
▋ CREDIT:
Credit to public technical “*All Candlestick Patterns*” indicator.
_______________________
▋ USAGE:
_______________________
▋ Final Comments:
For best performance, add the Candlestick Patterns Screener on active symbol chart like QQQ, SPY, AAPL, BTCUSDT, ES, EURUSD or …etc.
Candlestick patterns are not a major concept to build a trading decision.
Personally, I see candlestick patterns as a means to comprehend the psychology of the market, and help to follow the price action.
Please let me know if you have any questions.
Thank you.