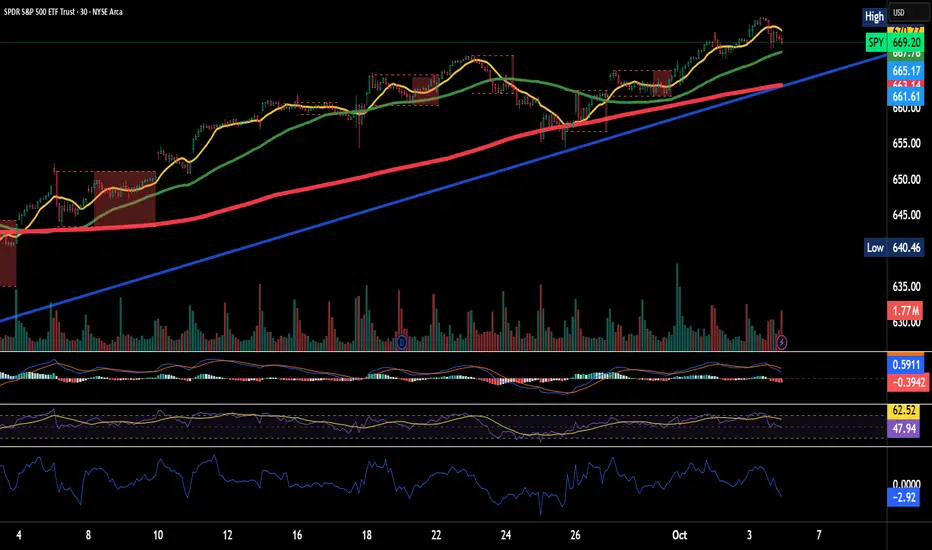
Trend CandlesThis shows candlesticks that only follow the trend. So it will make it easier to know where the trend is going.Pine Script® indicatorby Jesusgirl307
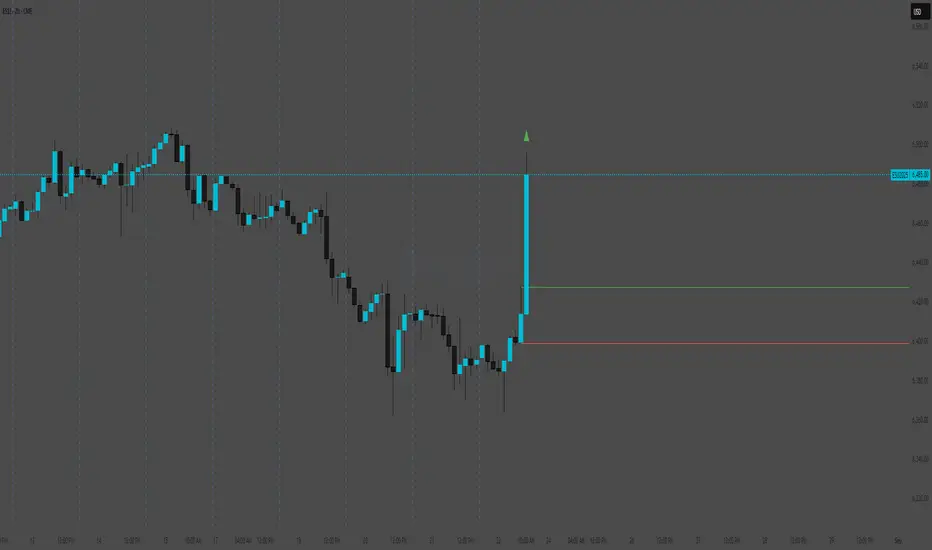
Previous Candle High/Low (Global Rays)Previous Candle High/Low (Global Rays, Corrected) This indicator tracks the high and low of the most recently closed candle and projects them forward as global horizontal rays. Features: ✅ Automatically updates the levels once a candle fully closes. ✅ Draws persistent lines at the previous candle’s high (green) and low (red), extending them into the future. ✅ Highlights real-time breakouts: ✅ Includes built-in alert conditions for both breakout events. How to Use: Use the levels as reference points for breakout trades, liquidity sweeps, or stop hunts. Alerts can help you catch moves without needing to constantly watch the chart. Works on any timeframe and symbol.Pine Script® indicatorby samb81784
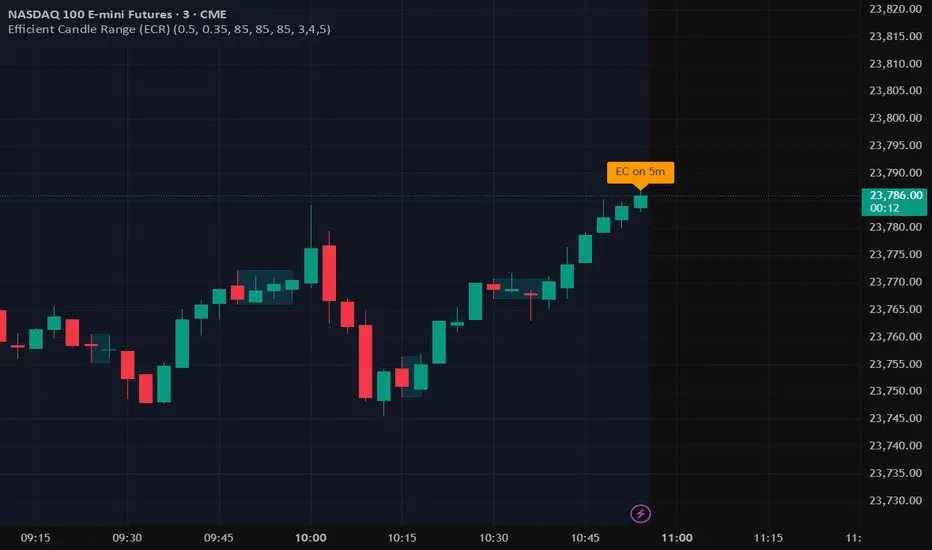
Efficient Candle Range (ECR)Efficient Candle Range (ECR) A custom-built concept designed to detect zones of efficient price movement, often signaling the start, pause, or end of an implied move. What is the Efficient Candle Range? The Efficient Candle Range (ECR) is a unique tool that identifies price zones based on efficient candles—candles with relatively small bodies and balanced wicks. These candles reflect balanced or orderly price action, and when grouped into a range, they can reveal areas of temporary equilibrium in the market. Rather than focusing on single candles, ECR builds a range that dynamically adjusts as new efficient candles form. This gives traders an objective way to track potential areas of absorption, distribution, or transition. Why use ECR? Efficient candles often occur: At the beginning of a new move, after a liquidity sweep or shift in sentiment At the end of a strong move, as momentum fades Within consolidation zones, where price trades in a balanced, indecisive state While ECRs can appear in any market condition, their interpretation depends on context: In a range, an ECR might just reflect sideways balance. But after a sweep or breakout, it could signal a potential shift in direction or continuation. A close outside the ECR often marks the end of that balance and the start of a new impulse. How it works The script detects efficient candles based on body-to-range ratio and wick symmetry. Consecutive ECs are grouped into a live ECR box. The box dynamically extends as long as price stays inside the high-low range. Once a candle closes outside, the ECR is considered invalid (fades visually, but remains visible for reference). Each active range is labeled "ECR" within the box for easy tracking. Customizable in settings Max body percentage of range Max wick imbalance Box and label color/transparency Suggested usage Let the ECR define your observation zone. Instead of reacting immediately to an efficient candle, wait for a confirmed breakout from the ECR to validate the next move. Whether you trade breakouts, reversals, or continuation setups, ECR provides an objective way to visualize price balance and understand when the market is likely to expand. Designed for individual traders looking to build structure around efficient price movement — no specific methodology required.Pine Script® indicatorby joeyheickUpdated 48
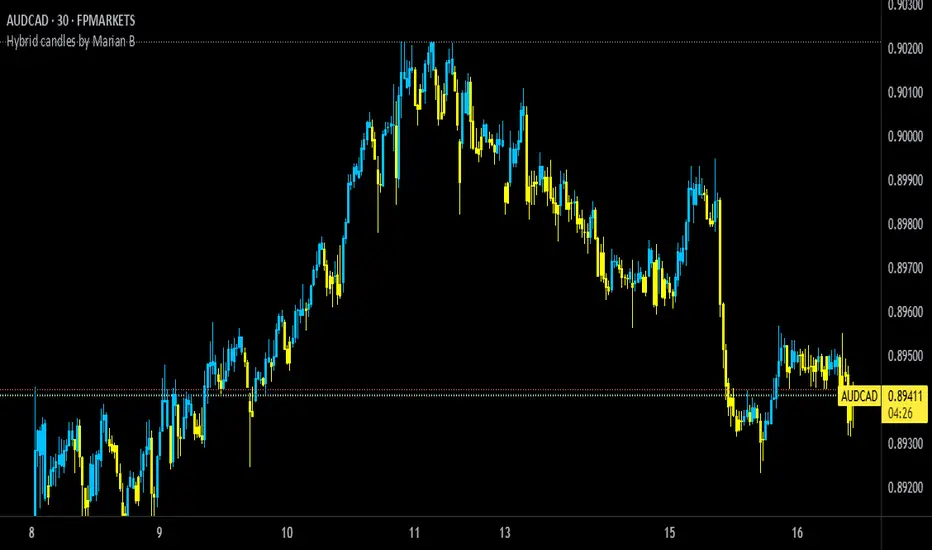
Hybrid candles by Marian BDescription ------------- This script it does a very simple thing: it will color the candles according to the HeikenAshi rules. It will keep the regular candle shape, but with the HeikenAshi colors. Some traders find it useful, especially those using the ATS methodology. Originality ------------- This script is not at all orginal and it will not make you win trades. There are a few others out there, but I could not find a public one that also colors the wicks; most of them just handle the color of the candle body. Chart ------- See a sample screenshot how it will look like.Pine Script® indicatorby marianboricean11
Supply/Demand Zones (Synthetic SMA Candles)Supply/Demand Zones (Synthetic SMA Candles) Created by The_Forex_Steward This indicator highlights institutional-style supply and demand zones using synthetic SMA-based candles rather than raw price data. It provides a smoother, more refined view of price action to help identify key imbalance areas where price is likely to react. Features: - Uses SMA-smoothed synthetic candles to detect bullish and bearish engulfing structures - Draws demand zones after bullish breakouts and supply zones after bearish breakouts - Zones are persistent for a customizable number of bars - Mitigated zones can optionally be removed from the chart - Includes alerts for breakout and mitigation events - Optional plotting of synthetic candles over price for visual clarity How It Works: When a synthetic candle closes above the high of a previous bearish candle, a bullish engulfing is detected, and a demand zone is created from that bearish candle’s high and low. Conversely, when price closes below the low of a previous bullish candle, a supply zone is formed. These zones stay on the chart for the user-defined duration or until they are mitigated by price, at which point they can be removed automatically. How to Use: - Adjust the SMA Length to control how smooth the synthetic candles appear - Enable or disable Show Supply Zones and Show Demand Zones as needed - Set the Zone Duration to control how long each zone persists - Use Delete Mitigated Zones to automatically remove zones when price returns to them - Optionally enable Show Synthetic SMA Candles to see the candle logic used in detection - Use the built-in alerts to stay notified of new zone creation or mitigation Note: This tool is most effective when combined with structure or trend-based strategies for confirmation. Pine Script® indicatorby The_Forex_StewardUpdated 1818 1 K
Engulfing Candles (ATR-Based) with Volume SpikeOverview: This script is designed to detect high-probability bullish and bearish engulfing patterns — but with a twist: it filters them through ATR-based volatility and confirms strength with volume spikes, all while offering optional trend filtering. It's built for traders who want more than just surface-level candle patterns — it's for those who want contextual confirmation before entering a trade. What Makes It Different: Most engulfing candle indicators simply match two candle shapes. This script goes deeper by: Measuring candle body size relative to recent volatility (via ATR). Checking for volume confirmation using a dynamic spike threshold. Filtering based on trend context using SMA-based structure detection. This tri-layered logic aims to avoid false positives and give traders cleaner, more actionable entries that align with momentum. Core Concepts: 1. Trend Detection (Optional) You can choose between two structural filters: SMA50 only: Looks for price above or below the 50-period SMA to define trend direction. SMA50 + SMA200 alignment: A stricter rule requiring both fast and slow SMAs to confirm a trend. Or turn off trend filtering entirely (No detection). This helps ensure engulfing setups appear in line with the broader trend, increasing the likelihood of continuation. 2. ATR-Filtered Candle Bodies To eliminate noise: A candle is only considered a valid engulfing candle if it has a body larger than 1.5× ATR(14). The previous candle must be a small-bodied candle (less than 0.5× ATR), creating a clear visual engulfing structure. This method dynamically adjusts for market volatility, so setups are meaningful even during periods of compression or expansion. 3. Volume Spike Confirmation Not all engulfing candles lead to follow-through. That’s why this script includes a volume confirmation filter: A 20-period moving average of volume is calculated. A spike is flagged if the current bar’s volume exceeds 1.5× this average (adjustable). Patterns with this confirmation are marked with a “*” label (e.g., BU* or BE*) to distinguish volume-backed setups from weaker ones. Visuals & Alerts: BU = Bullish engulfing without volume spike BU* = Bullish engulfing with volume spike BE = Bearish engulfing without volume spike BE* = Bearish engulfing with volume spike A white background highlight is shown behind candles with volume-confirmed engulfing patterns. Alerts are available for BU* and BE* so you can automate your edge. How to Use: Add the indicator to any chart. Choose your trend filter from the settings panel. Watch for BU* and BE* labels — these are your highest-conviction signals. Optional: Combine with support/resistance, Fibonacci zones, or MTF confirmation to refine entries. Use the included alerts to receive real-time push/email notifications when patterns emerge. Performance Note: I’ve found this script to be fairly good when applied to the 1-hour charts of the companies in the US100. The combination of ATR-based filtering and volume confirmation appears to provide clear, high-quality setups with good follow-through potential. By blending candle patterns, volatility filtering, volume confirmation, and trend context, this script aims to filter out weak signals and highlight the most statistically significant engulfing opportunities.Pine Script® indicatorby Marc_Thiart11105
Volume-Enhanced Candlestick Patterns 1 Overview Scans for four major candlestick reversal patterns: Harami Engulfing Morning/Evening Star Piercing Line/Dark Cloud Cover Underlying logic assumes that, at a turning point, the dominant side (bulls or bears) often delivers a “final” push—either a last surge of buying or selling—before the reversal truly takes hold. Pattern Toggles Each individual pattern can be turned on or off in the inputs. Enable only the patterns you want to monitor to reduce chart clutter and speed up performance. Volume Filter Toggle On: Requires volume-based exhaustion or climax to confirm each pattern. Off: Relies purely on price-action candlestick logic (no volume checks). Grouped Labels & Confluence When one or more patterns trigger on the same bar close, a single label is drawn: Grouping multiple confirmed patterns on one bar increases confluence and signal strength. Climax Volume × Multiplier Adjusting this input affects signal frequency and conviction: Higher multiplier → fewer signals but with stronger volume confirmation Lower multiplier → more signals, each with a looser volume requirement Alerts Built-in alert condition for each individual pattern (bullish/bearish Harami, Engulfing, Star, Piercing, Dark Cloud Cover), so you can receive real-time notifications whenever a confirmation occurs. Follow for Weekly Scripts If you find this helpful, please hit Follow and 🚀button —I release a new scripts every week. Disclaimer Not Financial Advice. This script is for educational and research purposes only. Use as Part of a Larger System. It should not be used in isolation; combine it with your own risk management rules, additional indicators, and broader market analysis. No Guarantees. Candlestick patterns and volume filters can improve signal quality, but they do not guarantee profitable trades. Always perform your own due diligence before entering any position.Pine Script® indicatorby Alex_AlgoUpdated 41
Abusuhil Bullish Candles (Label + Table)Abusuhil Bullish Candles is a pattern recognition indicator designed to identify key bullish reversal candlestick formations including Hammer, Bullish Engulfing, Morning Star, Piercing Line, Three White Soldiers, and Three Inside Up. The script includes optional filters such as Stochastic and Volume Confirmation, providing more precise signal detection. Each pattern and filter is fully customizable via settings. Alerts are also included to support active trading workflows. This script was written originally and does not copy open-source indicators. It's ideal for traders seeking visual clarity on bullish opportunities with professional-grade logic. مؤشر الشموع الصعودية هو مؤشر احترافي يكتشف أبرز نماذج الانعكاس الصعودي في الشموع اليابانية مثل: Hammer، Bullish Engulfing، Morning Star، Piercing Line، Three White Soldiers، و Three Inside Up. يوفر المؤشر فلاتر إضافية مثل فلتر Stochastic وفلتر الفوليوم لتعزيز دقة الإشارات. جميع الإعدادات قابلة للتعديل بما يتناسب مع احتياج كل متداول. يحتوي المؤشر أيضًا على تنبيهات تلقائية لدعم استراتيجيات التداول اللحظي. تمت برمجة المؤشر من الصفر ويعتمد على منطق خاص غير منسوخ من سكربتات مفتوحة المصدر. -------------------------------------------------------------------------------------------------------------------- 🇸🇦 التحديثات – النسخة الجديدة (Abusuhil Bullish Candles) ✅ تم تغيير الملصقات بشكل أوضح: باستخدام دوائر ملونة أسفل الشموع بدلًا من المربعات لتفادي التراكب. 🟦 إضافة جدول تفاعلي على الشارت يعرض أسماء النماذج وألوانها المخصصة. 🎨 إمكانية تغيير ألوان كل نموذج من الإعدادات حسب رغبة المستخدم. 🧩 تفعيل/تعطيل كل نموذج على حدة من خلال إعدادات منفصلة. 🔔 إضافة تنبيه احترافي واحد يتم تفعيله عند تحقق أي نموذج نشط من النماذج المحددة. 📋 توافق كامل مع سياسة TradingView: لا يحتوي على أكواد منسوخة أو مبنية على مؤشرات داخلية. لا تكرار للوظائف أو العناوين. وصف واضح مع تحكم كامل للمستخدم. 🇬🇧 Updates – Latest Version (Abusuhil Bullish Candles) ✅ Clearer Signal Labels: Now uses colored circles under candles instead of labels to avoid overlapping. 🟦 Interactive Table showing pattern names and user-defined colors. 🎨 Customizable colors for each candlestick pattern from the settings menu. 🧩 Toggle each pattern independently using dedicated checkboxes. 🔔 Single professional alert condition that triggers only when any enabled pattern is detected. 📋 Fully compliant with TradingView's publishing policy: No reused or built-in indicator code. No duplicated logic or misleading titles. Clean and modular design with full user customization. Pine Script® indicatorby abusuhil11153
8:15 AM 15-min Candle Box on 5-min Chart with TP and SLThe “8:15 AM 15-min Candle Box on 5-min Chart with TP and SL” indicator is a custom-built Pine Script tool for breakout trading strategies, particularly tailored for assets like NASDAQ Futures (NAS100) during the U.S. market pre-open. 🔍 What It Does: Tracks the 8:15–8:30 AM Central Time (CDT) Candle: It marks the high and low of the 15-minute candle that starts at 8:15 AM (CDT). The box visually outlines this price range. Draws a Breakout Box: At 8:30 AM, a box is drawn from the 8:15 candle’s high and low. The box stretches forward 8 hours into the session, helping you visualize price interaction with that range. Detects Breakouts: If the price closes above the high, it signals a buy breakout. If it closes below the low, it signals a sell breakout. Automatically Calculates TP and SL: Take Profit (TP): 50 pips from the breakout level in the direction of the trade. Stop Loss (SL): 40 pips in the opposite direction. Pips are calculated using the symbol’s minimum tick size. Color Feedback: Box turns green on a buy breakout, red on a sell breakout. If TP is reached, the box turns black. If SL is hit, the box turns purple. 🧠 Why Use This Indicator: Perfect for pre-market breakout traders who want a visual confirmation of price action around the U.S. market open. Provides a clear entry range, trade direction, and risk/reward visual cue. No manual drawing — everything is automated daily based on reliable timing. Would you like a version with alerts or plotted TP/SL lines as well?Pine Script® indicatorby PhiloRamzy12250
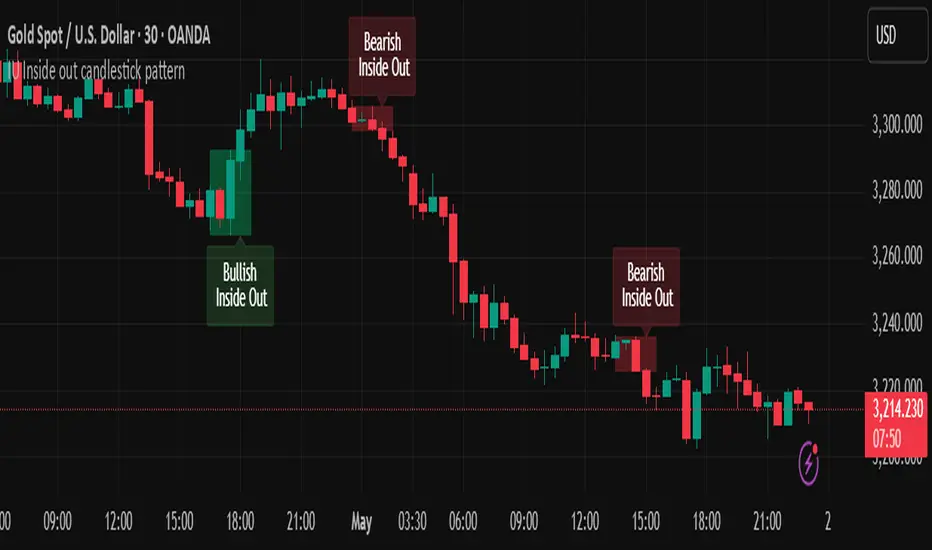
IU Inside out candlestick patternIU Inside Out Candlestick Pattern This indicator identifies the Inside Out Candlestick Pattern — a unique 3-bar price action setup that captures strong market momentum and potential reversals with greater reliability than traditional patterns. Pattern Logic: The Inside Out pattern builds upon a classic engulfing setup by adding a breakout confirmation, making it a refined and filtered approach to candlestick analysis. Bullish Inside Out Logic: - Bar must be a bullish engulfing candle (engulfs previous bearish candle). - Current bar must be bullish and must close above the high of the engulfing candle (a bullish breakout). - When this setup is confirmed, a shaded green box is drawn around the range of the engulfing candle and its preceding bar. Bearish Inside Out Logic: - Bar must be a bearish engulfing candle (engulfs previous bullish candle). - Current bar must be bearish and must close below the low of the engulfing candle (a bearish breakdown). - When confirmed, a red box highlights the zone formed by the engulfing candle and its prior bar. Why this is unique: Unlike conventional candlestick indicators that trigger signals immediately after an engulfing pattern, this script adds a breakout condition to validate follow-through strength. This reduces false positives and gives traders a clearer edge. The pattern is also rare, which means it captures strong, decisive moves when it does appear. How users can benefit: - High-quality entries: Only shows patterns with proven follow-through, improving trade timing. - Visual clarity: Boxes and labels highlight significant price zones for easy interpretation. - Flexible use: Applicable across timeframes and instruments — ideal for both intraday and swing traders. - Alerts included: Real-time alerts help traders stay updated without staring at charts all day. This script is a powerful tool for price action traders looking to enhance pattern reliability and signal strength through structure-based breakout confirmation.Pine Script® indicatorby Shivam_Mandrai88649
Accumulation-Distribution CandlesThis structural visualization tool maps each candle through the lens of Effort vs. Result, blending Volume, Range, and closing bias into a normalized pressure score. Candle bodies are dynamically color-coded using a five-tier system—from heavy accumulation to heavy distribution—revealing where energy is building, dispersing, or neutral. This helps to visually isolate Markup, Markdown, Re-accumulation, and Distribution at a glance. The indicator calculates a strength score by multiplying price result (close minus open) by effort (volume or price range), smoothing this raw value using a Fibonacci-based EMA. (34 for standard, 55 for crypto; the higher crypto value acknowledges that 24/7 trading offers more hours per week or month than trad markets.) The result is standardized against its rolling deviation and clamped to a range. This score determines the visual tier: • 💙 Dark Blue = heavy Accumulation (strong upward result on strong effort) • 🩵 Pale Blue = mild Accumulation • 🌚 Gray = neutral (low conviction or balance) • 💛 Pale Yellow = mild Distribution • 🧡 Deep Yellow = heavy Distribution (strong downward result on strong effort) The tool is optimized for the 1D chart, where Wyckoff phases are most clearly expressed. However, it adapts well to lower timeframes when used selectively. Traders may hide the body coloring and enable only zone highlighting to preserve other candle overlays such as SUPeR TReND 2.718, which offers directional clarity and trend duration. This combination is especially useful on intraday charts (15m–1H) where microstructure matters but visual clutter must be avoided. When used alongside other Volume overlays (such as the OBVX Conviction Bias) or Volatility indicators (such as the Asymmetric Turbulence Ribbon (ATR)), this indicator adds confluence to directional setups by contextualizing pressure with Volatility. For example: compression zones marked by ATR may align with persistent pale blue candles—indicating quiet Accumulation before expansion. Optional Overlays: Normally ON - • 📌 Pin Bars , filtered by volume, to isolate wick-dominant reversals from key zones • 💪🏻 Strong-Body Candles — fuchsia candles w/ high body-to-range ratio reflect conviction • 🧯 Wick Absorption Candles — red candles w/ long wicks and low closing strength indicate failed pushes or absorbed breakouts • 🟦/🟧 Zone Highlighting for candles above a defined Accumulation/Distribution threshold Normally OFF - • 🔺 Fractals (5-bar) to map swing pivots by underlying pressure tier (normally OFF) • 🟥/🟩 Engulfing patterns, filtered by directional conviction (normally OFF) The Pin Bar strategy benefits most from the zone logic—when a bullish pin bar appears in an Accumulation zone (esp. pale or dark blue), and Volume exceeds its rolling average, it may mark a spring or failed breakdown. Conversely, bearish pins in Distribution zones can mark rejection or resistance. This is not a signal engine—it’s a narrative filter designed to slot cleanly into a multi-layered workflow of visual structure and informed execution. Use it to identify bias and phase. Then deploy trade triggers from tools like SUPeR TReND 2.718, or the liquidity flows shown the The Silver Lining or the AltSeasonality - MTF indicators, for example. The candle colors tell you who’s in control—the other tools tell you when to act.Pine Script® indicatorby TheLeadingIndicator1161
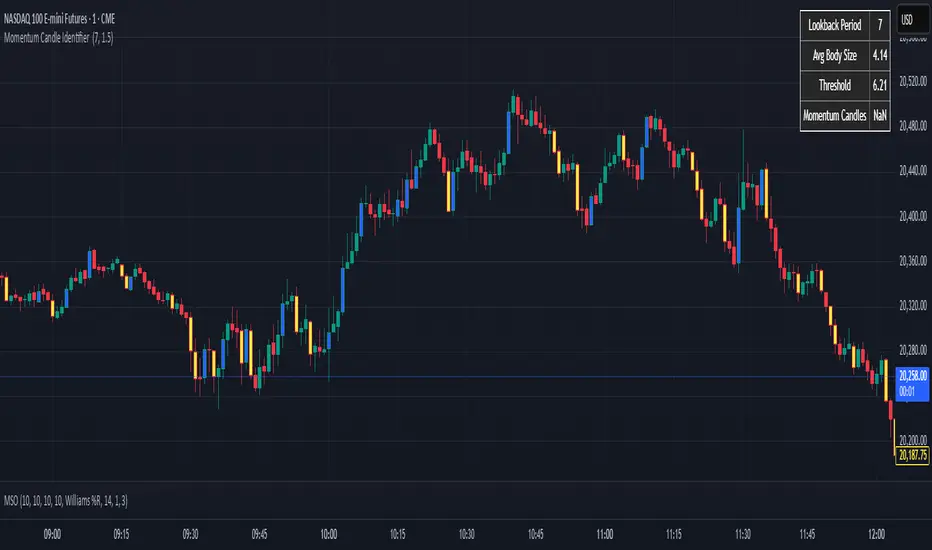
Momentum Candle Identifier # Momentum Candle Identifier This indicator helps traders identify significant momentum candles by analyzing candle body size relative to recent price action (think after consolidation periods). Unlike traditional volatility indicators, this tool specifically focuses on price movement captured by the candle body (open to close distance), filtering out potentially misleading wicks. ## How It Works - The indicator calculates the average candle body size over a user-defined lookback period - Momentum candles are identified when their body size exceeds the average by a customizable threshold multiplier - Bullish momentum candles (close > open) are highlighted in a user defined color - Bearish momentum candles (close < open) are highlighted in a user defined color - A real-time information panel displays key metrics including current average body size and threshold values ## Key Features - Focus on candle body size rather than full range (high to low) - Custom lookback period to adapt to different timeframes - Adjustable threshold multiplier to fine-tune sensitivity - Customizable colors for bullish and bearish momentum candles - Optional labels for momentum candles - Information panel showing lookback settings, average size, and momentum candle count ## Usage Tips - Use shorter lookback periods (3-5) for more signals in choppy markets - Use longer lookback periods (8-20) to identify only the most significant momentum moves - Higher threshold multipliers (2.0+) will identify only the strongest momentum candles - Combine with trend indicators to find potential reversal or continuation signals - Look for clusters of momentum candles to identify strong shifts in market sentiment This indicator helps identify candles that represent significant price movement relative to recent activity, potentially signaling changes in market momentum, sentiment shifts, or the beginning of new trends.Pine Script® indicatorby IndicatorCraft84
Volume Footprint POC for Every CandleCalculating and plotting the Point of Control (POC) for every candle on a volume footprint chart can provide valuable insights for traders. Here are some interpretations and uses of this information: 1. Identify Key Price Levels Highest Traded Volume: The POC represents the price level with the highest traded volume for each candle. This level often acts as a significant support or resistance level. Confluence Zones: When multiple POCs align at similar price levels over several candles, it indicates strong support or resistance zones. 2. Gauge Market Sentiment Buyer and Seller Activity: High volume at certain price levels can indicate where buyers and sellers are most active. A rising POC suggests stronger buying activity, while a falling POC suggests stronger selling activity. Volume Profile: Analyzing the volume profile helps in understanding the distribution of traded volume across different price levels, providing insights into market sentiment and potential reversals. 3. Spot Trends and Reversals Trend Continuation: Consistent upward or downward shifts in POC levels can indicate a trend continuation. Traders can use this information to stay in trending positions. Reversal Signals: A sudden change in the POC direction may signal a potential reversal. This can be used to take profits or enter new positions. 4. Intraday Trading Strategies Short-Term Trading: Intraday traders can use the POC to make informed decisions on entry and exit points. For example, buying near the POC during an uptrend or selling near the POC during a downtrend. Scalping Opportunities: High-frequency traders can use shifts in the POC to scalp small profits from price movements around these key levels. 5. Volume-Based Indicators Confirmation of Other Indicators: The POC can be used in conjunction with other technical indicators (e.g., moving averages, RSI) to confirm signals and improve trading accuracy. Support and Resistance: Combining the POC with traditional support and resistance levels can provide a more comprehensive view of the market dynamics. In summary, the Point of Control (POC) is a valuable tool for traders to understand market behavior, identify key levels, and make more informed trading decisions. If you have specific questions or need further details on how to use this information in your trading strategy, feel free to ask! 😊Pine Script® indicatorby GTR511Updated 66274
Longest Candles HighlighterDescription: The Longest Candles Highlighter is a simple yet effective tool that identifies and highlights candles with significant price ranges. By visually marking candles that meet specific size criteria, this indicator helps traders quickly spot high-volatility moments or significant market moves on the chart. Features: 1. Customizable Candle Range: - Define the minimum and maximum candle size in pips using input fields. - Tailor the indicator to highlight candles that are most relevant to your trading strategy. 2. Flexible for Different Markets: - Automatically adjusts pip calculation based on the instrument type (Forex or non-Forex). - Accounts for differences in pip values, such as the 0.01 pip for JPY pairs in Forex. 3. Visual Highlighting: - Highlights qualifying candles with a customizable background color for easy identification. - The default color is red, but you can choose any color to match your chart theme. 4. Precision and Efficiency: - Quickly scans and identifies candles that meet your criteria, saving you time in analyzing charts. - Works seamlessly across all timeframes and asset classes. How It Works: - The indicator calculates the range of each candle in pips by subtracting the low from the high and dividing by the appropriate pip value. - It checks whether the candle's size falls within the user-defined minimum and maximum pip range. - If the conditions are met, the background of the candle is highlighted with the specified color, drawing your attention to significant price movements. Use Case: - This indicator is ideal for identifying key market moments, such as breakouts, volatility spikes, or significant price movements. - Traders can use it to quickly locate large candles on any chart, aiding in technical analysis and strategy development. This tool simplifies the process of spotting important candles, empowering traders to make faster and more informed trading decisions.Pine Script® indicatorby mandragolaminum17
Accurate 10x Volume Spike with Corrected Next Candle AnalysisDescription : The Volume Ten Candles indicator is a technical analysis tool that helps traders identify candles with volume exceeding the previous one by 10 times. This can indicate a potential trend reversal or continuation of the current price movement. Signal : The indicator generates a signal when a candle with volume exceeding the previous one by 10 times appears. The signal is displayed on the chart as an arrow or other symbol. Statistics : The indicator also displays statistics in the form of a table that shows the number of candles with volume exceeding the previous one by 10 times for a certain period of time. This helps traders assess the strength of the trend and make a decision about entering a trade. Example of Use : The Volume Ten Candles indicator can be useful for traders who want to find candles with high volume and use them to enter a trade. For example, if a candle with volume exceeding the previous one by 10 times appears, it may indicate that the market is ready for a price movement. In this case, the trader can open a trade in the direction of this movement. It is important to note that the Volume Ten Candles indicator is not a guarantee of profit and may produce false signals. Therefore, before using the indicator, it is necessary to conduct testing on historical data and develop a trading strategy. Statistics Table : The table displays the number of candles with volume exceeding the previous one by 10 times for each day.Pine Script® indicatorby young-but-old-12_06_193611283
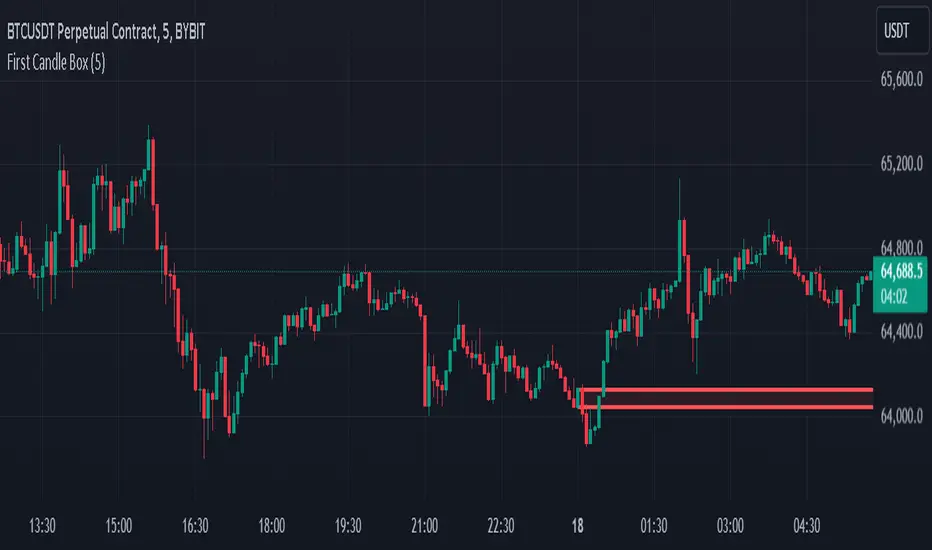
First 5-Minute Candle BoxTitle: "First 5-Minute Candle Box Indicator" Description: Introducing the "First 5-Minute Candle Box" indicator for TradingView! This powerful script is designed to help traders visualize and analyze the high and low prices of the first 5-minute candle of each trading day. By clearly marking this crucial price range, traders can gain valuable insights into potential support and resistance levels right from the start of the trading session. Features: First 5-Minute Candle High and Low: Automatically captures and displays the high and low prices of the first 5-minute candle of the trading day, providing key levels for intraday trading strategies. Daily Reset: Resets the high and low variables at the beginning of each new trading day to ensure accurate data capture for the current session. Visual Box Representation: Draws a visual rectangle box on the chart from the start of the trading day to the end, highlighting the range between the high and low of the first 5-minute candle. Customizable Appearance: The box is drawn with a customizable border color and background color, allowing traders to personalize the indicator to their chart's aesthetic. Usage: Add the indicator to your TradingView chart to automatically display the high and low of the first 5-minute candle of each trading day. Utilize these levels as potential support and resistance zones for your intraday trading strategies. Gain an early edge in your trading day by identifying key price levels right from the market open. Code Explanation: Variable Initialization: The script initializes variables to store the high and low prices of the first 5-minute candle. Daily Reset Logic: At the start of a new day, the variables are reset to ensure they capture the correct data for the new trading session. Price Capture Logic: The high and low prices of the first 5-minute candle are captured and stored. Box Drawing Logic: The script defines the start and end times for the visual box and draws the rectangle if the high and low prices are set. Customizable Box: The box is drawn with specified colors and border properties, providing a clear visual representation on the chart. Enhance your trading analysis with the "First 5-Minute Candle Box" indicator. Add it to your TradingView chart today and start leveraging the power of early price action!Pine Script® indicatorby dev_dkayUpdated 66258
Dead Simple Heikin Ashi Candles (HA Candles)Are you looking for a dead simple calculation of the Heikin Ashi candles as they are calculated in tradingview? Here it is! I was looking through the library and I saw that many have come up with a lot of awesome scripts using heikin ashi candles. But, I can't find anywhere that had the straightforward simple version of how Tradingview calculates them. This was a problem for me because I realized after punching the formula in that TradingView doesn't calculate HA candles in the original way. You might say they don't calculate them the "right" but, spoiler alert, there is no right in trading. You can only be rational or irrational as you make money or lose money. This is useful to me for building out some portions of an algo that are not going to be compatible with the built-in function. It happens. So, if you were looking for it too, hopefully it saves you some time. For reference the original calc of HA candles is: o = (prev_HA_open + prev_HA_close) / 2 h = math.max(high, ha_open, ha_close) l = math.min(low, ha_open, ha_close) c = ohlc4 Trade Well. Pine Script® indicatorby kurtsmockUpdated 77103
% Change CandleThis script creates a trading indicator that shows how much the price of a financial instrument (like a stock or currency) changes within each trading period, represented by candles on a chart. Each candle shows the range of prices from the highest to the lowest within a specific time frame. The indicator calculates the percentage difference between the highest and lowest prices for each candle. If the closing price of the candle is higher than the opening price, suggesting that the price has gone up during that period, the indicator will display this percentage increase as a green line. Conversely, if the closing price is lower than the opening price, indicating a price decrease, it will display the percentage decrease as a red line. In simple terms, this indicator provides a visual way to see how much and in which direction the price is moving during each trading period, with green lines showing periods of price increase and red lines showing periods of price decrease.Pine Script® indicatorby TheTrexUpdated 51
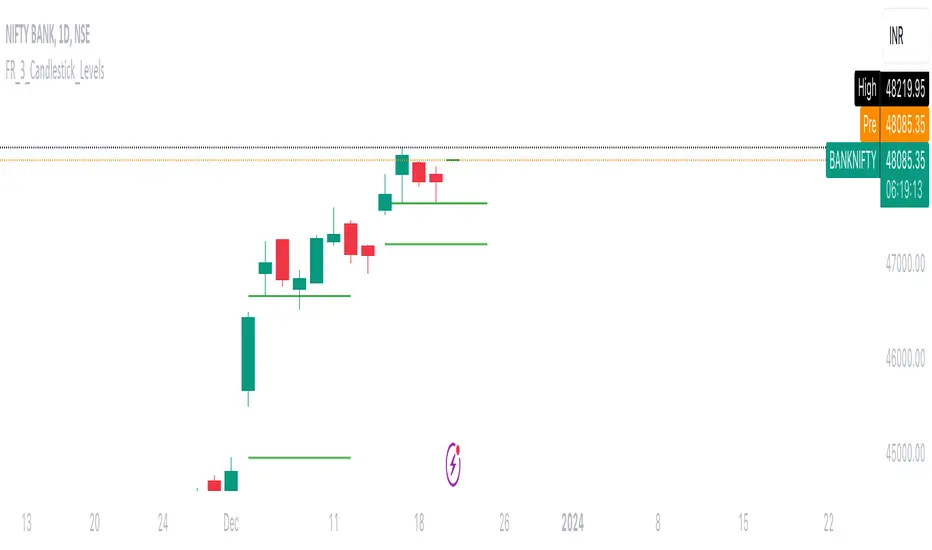
FalconRed 3 Candlestick LevelsThis Pine Script indicator is designed to enhance price action analysis by identifying specific candle patterns that signal potential buying and selling levels. The analysis is based on the characteristics of the current candle and its two immediate predecessors. For identifying buying levels, the script examines the wicks of the candles, highlighting areas where buying and selling struggle is evident. The indicator recognizes significant breaks above wick levels, especially when followed by a subsequent candle with a lower wick. This combination suggests that previous selling pressure has been challenged and overcome. Buy breakout and retest levels are highlighted with green color, providing a clear visual indication of potential buying opportunities. The indicator draws horizontal lines that extend to the right, offering insights into the frequency of retests and the recurrence of similar patterns in specific price zones, thereby confirming and reinforcing the observed price action. Similarly, the indicator scrutinizes the selling side, pinpointing breakdown and retest levels. These areas are highlighted with red color, aiding in the identification of potential selling opportunities. This indicator serves as a valuable tool for analyzing price action levels and visualizing buying and selling areas. It can be effectively combined with other technical indicators to enhance confidence in trading decisions. Gain deeper insights into market dynamics and improve decision-making by integrating this candle pattern analysis indicator into your trading strategy.Pine Script® indicatorby falcon_redUpdated 11124
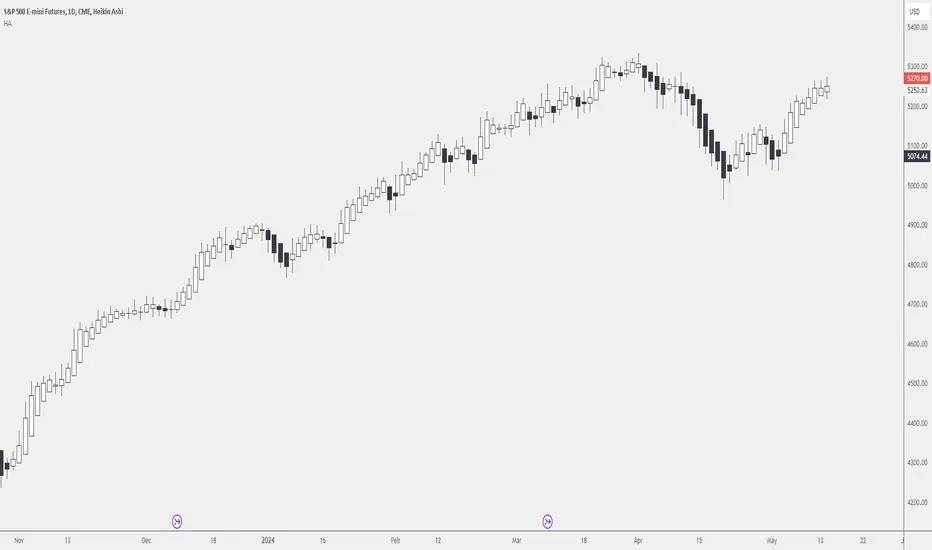
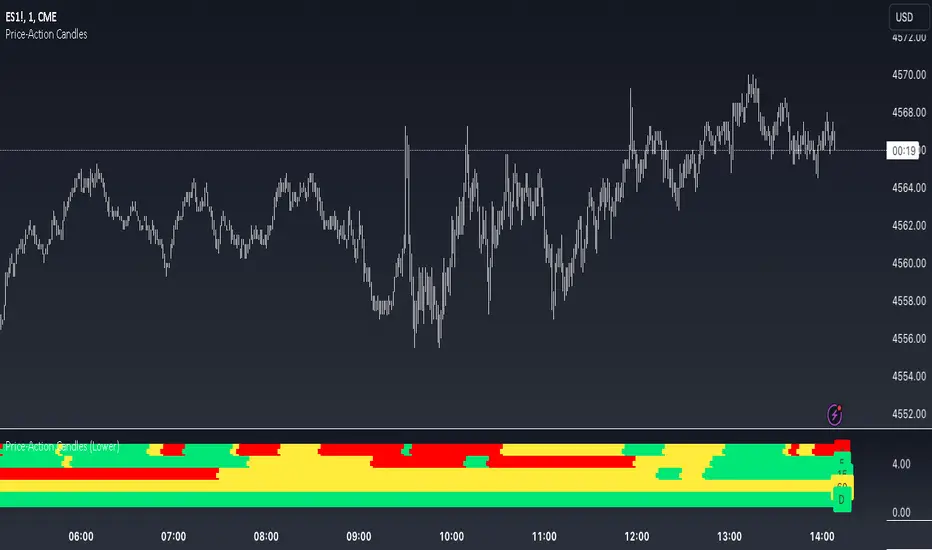
Price-Action Candles (Lower)What is a swing high or swing low? Swing highs and lows are price extremes. For example say we set our swing length to 5. A candle that is a swing high with a swing length of 5 will have 5 bars to the left that are lower and 5 bars to the right that are lower. A candle that is a swing low with a swing length of 5 will have 5 bars to the left that are higher and 5 bars to the right that are higher. How is the trend coloring calculated? The trend coloring is calculated the exact same way as our trend candles study... by storing and comparing historical swing lows and swing highs. The pinescript code goes as follows: The pinescript code goes as follows: var int trend = na trend := ((hh and high >= psh) or close > csh) ? 1 : ((ll and low <= psl) or close < csl) ? -1 : lh or hl ? 0 : trend What does that gibberish mean? -Trend can be GREEN IF - We have a higher high (current swing high is greater than the previous swing high) and the high is greater than the previous swing high - OR The current close is greater than the current swing high -Trend can be RED IF - We have a lower low (current swing low is less than the previous swing low) and the low is less than the previous swing low - OR The current close is less than the current swing low -Trend can be YELLOW IF - We have a new swing high and the new swing high is less than the previous swing high - OR We have a new swing low and the new swing low is greater than the previous swing low If none of the conditions above are true then we continue with whatever color the previous bar was. What is repainting? Repainting is "script behavior causing historical vs realtime calculations or plots to behave differently." That definition comes directly from Tradingview. If you want to read the full explanation you can visit it here www.tradingview.com . The price-action candles use swing highs and swing lows which need bars to the left (past) and bars to the right ("future") in order to confirm the swing level. Because of the need to wait for confirmation for swing levels the plot style can be repainting. The Price-Action Candles (Lower) indicator, or this indicator, has no repainting anywhere. We opt to not shift back the candle coloring which causes the repainting, but it is relevant to discuss since this indicator's sibling (Price-Action Candles) can have repainting labels. Repaint Here the labels are shifted back the price-action length. Repainting is not present in the Price-Candles (Lower) study, but can be found in this indicator's sibling (Price-Action Candles). Non-Repaint Here the labels are not shifted back or "repainted". Repainting is not present in the Price-Candles (Lower) study, but can be found in this indicator's sibling (Price-Action Candles). Multi-timeframe Analysis The users can view multi-timeframe historical price action trend via this lower study. Each timeframe is plotted as its own on the lower pane and you can determine what timeframe it is by the label next to the plot. More examples Pair the Price-Action Candles (Lower) indicator with our main price indicator that colors candles based on trend and can show price action labels. Pine Script® indicatorby GoodGains57
Price-Action CandlesWhat is a swing high or swing low? Swing highs and lows are price extremes. For example say we set our swing length to 5. A candle that is a swing high with a swing length of 5 will have 5 bars to the left that are lower and 5 bars to the right that are lower. A candle that is a swing low with a swing length of 5 will have 5 bars to the left that are higher and 5 bars to the right that are higher. How are the trend candles calculated? The trend candles are calculated by storing and comparing historical swing lows and swing highs. The pinescript code goes as follows: The pinescript code goes as follows: var int trend = na trend := ((hh and high >= psh) or close > csh) ? 1 : ((ll and low <= psl) or close < csl) ? -1 : lh or hl ? 0 : trend What does that gibberish mean? -Candle can be GREEN IF - We have a higher high (current swing high is greater than the previous swing high) and the high is greater than the previous swing high - OR The current close is greater than the current swing high -Candle can be RED IF - We have a lower low (current swing low is less than the previous swing low) and the low is less than the previous swing low - OR The current close is less than the current swing low -Candle can be YELLOW IF - We have a new swing high and the new swing high is less than the previous swing high - OR We have a new swing low and the new swing low is greater than the previous swing low If none of the conditions above are true then we continue with whatever color the previous bar was. What is repainting? Repainting is "script behavior causing historical vs realtime calculations or plots to behave differently." That definition comes directly from Tradingview. If you want to read the full explanation you can visit it here www.tradingview.com . The price-action candles use swing highs and swing lows which need bars to the left (past) and bars to the right ("future") in order to confirm the swing level. Because of the need to wait for confirmation to for swing levels the plot style can be repainting. With the price-action candles indicator the only repainting part of the indicator is the labels. The price-action candles themselves WILL NOT REPAINT. The labels however can be set to repaint or not depending on the user preference. If the user opts to use repainting then the label location is shifted back by the length of the price-action. So if the "Price-Action Length" input is set to 10, and the user wants repainting, the swing high/low label will be shifted back 10 bars. If the user opts for no repainting, the label will not be shifted and instead show on the exact bar the swing level was confirmed. Examples Below. Repaint Here the labels are shifted back the price-action length. Non-Repaint Here the labels are not shifted back because the input setting is set to not repaint. Multi-timeframe Analysis The users can view the trend from multiple different timeframes at once with a table displayed at the bottom of their charts. The timeframe can be lower or higher than the chart timeframe. More examples Be on the lookout for the Price Action Candles (Lower) indicator where you can view the multi-timeframe labels on a lower price grid in order to see the history over time!Pine Script® indicatorby GoodGainsUpdated 77653
ICT HTF Candles [Source Code] (fadi)Plotting a configurable higher timeframe on current chart's timeframe helps visualize price movement without changing timeframes. It also plots FVG and Volume Imbalance on the higher timeframe for easier visualization. With ICT concepts, we usually wait for HTF break of structure and then find an entry on a lower timeframe. With this indicator, we can set it to the HTF and watch the develop of price action until the break of structure happens. We can then take an entry on the current timeframe. Settings HTF Higher timeframe to plot Number of candles to display The number of higher timeframe candles to display to the right of current price action Body/Border/Wick The candle colors for the body, border, and wick Padding from current candles The distance from current timeframe's candles Space between candles Increase / decrease the candle spacing Candle width The size of the candles Imbalance Fair Value Gap Show / Hide FVG on the higher timeframe Volume Imbalance Show / Hide Volume Imbalance on the higher timeframe Trace Trace lines Extend the OHLC lines of the higher timeframe and the source of each Label Show/Hide the price levels of the OHLCPine Script® indicatorby fadizeidanUpdated 135135 4.6 K
LTF Candle Insights (Zeiierman)█ Overview The LTF Candle Insights indicator allows traders to explore the finer details of the market by integrating lower time frame (LTF) data into their current chart, offering a more detailed and nuanced view of price movements. This comprehensive visual tool is crucial for traders who want to investigate complex market trends without the constant need to switch between different chart timeframes. In essence, this indicator overlays the smaller details into the broader frame, enabling traders to grasp the fine points while examining the larger market picture. █ How It Works The LTF Candle Insights indicator easily puts LTF candles onto the current chart, allowing traders to see both the current timeframe and the chosen lower timeframe candles at the same time. This dual view helps traders see the main market trends and important price levels, helping them get a better understanding of the little details and complexities of the market. █ How to Use Trend Analysis Traders can use this indicator to look closely at smaller market trends by comparing LTF candles with the candles of the current timeframe. Knowing the trends in LTF helps traders make trades that go along with the small market movements. Support and Resistance Identification By looking at the high, low, and middle levels of LTF candles, traders can find possible support and resistance areas. This detailed look helps traders pick the best times to enter or exit trades, set up stop-losses effectively, and manage risk carefully. █ Settings Lower Timeframe and Candle Amount Users can determine the lower timeframe and the number of LTF candles they wish to observe on their current chart. Range Lines The high/low range of the illustrated candles and the optional mid-range line can be displayed, granting insights into significant price levels and ranges. Table Display A summary table can be displayed, outlining details of the current chart's timeframe and the chosen LTF, providing a succinct overview for traders. ----------------- Disclaimer The information contained in my Scripts/Indicators/Ideas/Algos/Systems does not constitute financial advice or a solicitation to buy or sell any securities of any type. I will not accept liability for any loss or damage, including without limitation any loss of profit, which may arise directly or indirectly from the use of or reliance on such information. All investments involve risk, and the past performance of a security, industry, sector, market, financial product, trading strategy, backtest, or individual's trading does not guarantee future results or returns. Investors are fully responsible for any investment decisions they make. Such decisions should be based solely on an evaluation of their financial circumstances, investment objectives, risk tolerance, and liquidity needs. My Scripts/Indicators/Ideas/Algos/Systems are only for educational purposes!Pine Script® indicatorby Zeiierman1313 1.3 K