50% of Previous 1H Candle (Color Logic)📌 Script Title: 50% Midpoint of Previous 1H Candle (Color Coded)
📝 Description:
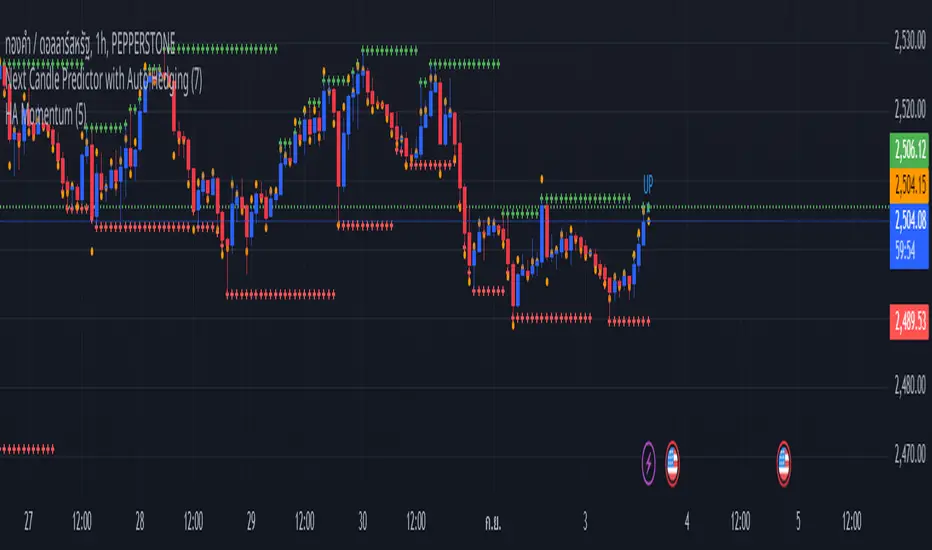
This indicator draws a horizontal line at the 50% (midpoint) of the most recently closed 1-hour candle, helping traders visualize intraday support/resistance and sentiment bias.
🔹 Key Features:
Plots the midpoint of the last 1H candle as a horizontal line.
Color-coded line and label:
🟢 Green: Previous candle was bullish
🔴 Red: Previous candle was bearish
⚪ Gray: Neutral (doji or equal open/close)
Displays the exact price level with a floating label.
Works on any lower timeframe chart (e.g., 5m, 15m, 30m).
Automatically updates every hour after the 1H candle closes.
📈 Use Cases:
Trade around the 1H midpoint as a dynamic pivot zone.
Confirm or fade price breakouts/rejections at this level.
Use it with trendlines, supply/demand zones, or VWAP.
🔍 Technical Notes:
The midpoint is calculated using:
Midpoint = (High + Low) / 2
from the most recent closed 1H candle.
Color logic is based on whether the 1H candle closed above or below its open.
🚀 Enhancement Ideas (future updates):
Add optional alerts on cross of the midpoint.
Show multiple historical midpoint levels.
Input toggle to enable/disable color coding.
Whether you’re scalping intraday or watching for reaction zones, this tool gives you a clean, real-time level to anchor your trades around.
Happy trading! 💹
— Built with ❤️ in Pine Script v6
Pine Script® indicator