Simple and Profitable Scalping Strategy (ForexSignals TV)Strategy is based on the "SIMPLE and PROFITABLE Forex Scalping Strategy" taken from YouTube channel ForexSignals TV.
See video for a detailed explaination of the whole strategy.
I'm not entirely happy with the performance of this strategy yet however I do believe it has potential as the concept makes a lot of sense.
I'm open to any ideas people have on how it could be improved.
Strategy incorporates the following features:
Risk management:
Configurable X% loss per stop (default to 1%)
Configurable R:R ratio
Trade entry:
Based on stratgey conditions outlined below
Trade exit:
Based on stratgey conditions outlined below
Backtesting:
Configurable backtesting range by date
Trade drawings:
Each entry condition indicator can be turned on and off
TP/SL boxes drawn for all trades. Can be turned on and off
Trade exit information labels. Can be turned on and off
NOTE: Trade drawings will only be applicable when using overlay strategies
Debugging:
Includes section with useful debugging techniques
Strategy conditions
Trade entry:
LONG
C1: On higher timeframe trend EMAs, Fast EMA must be above Slow EMA
C2: On higher timeframe trend EMAs, price must be above Fast EMA
C3: On current timeframe entry EMAs, Fast EMA must be above Medium EMA and Medium EMA must be above Slow EMA
C4: On current timeframe entry EMAs, all 3 EMA lines must have fanned out in upward direction for previous X candles (configurable)
C5: On current timeframe entry EMAs, previous candle must have closed above and not touched any EMA lines
C6: On current timeframe entry EMAs, current candle must have pulled back to touch the EMA line(s)
C7: Price must break through the high of the last X candles (plus price buffer) to trigger entry (stop order entry)
SHORT
C1: On higher timeframe trend EMAs, Fast EMA must be below Slow EMA
C2: On higher timeframe trend EMAs, price must be below Fast EMA
C3: On current timeframe entry EMAs, Fast EMA must be below Medium EMA and Medium EMA must be below Slow EMA
C4: On current timeframe entry EMAs, all 3 EMA lines must have fanned out in downward direction for previous X candles (configurable)
C5: On current timeframe entry EMAs, previous candle must have closed above and not touched any EMA lines
C6: On current timeframe entry EMAs, current candle must have pulled back to touch the EMA line(s)
C7: Price must break through the low of the last X candles (plus price buffer) to trigger entry (stop order entry)
Trade entry:
Calculated position size based on risk tolerance
Entry price is a stop order set just above (buffer configurable) the recent swing high/low (long/short)
Trade exit:
Stop Loss is set just below (buffer configurable) trigger candle's low/high (long/short)
Take Profit calculated from Stop Loss using R:R ratio
Credits
"SIMPLE and PROFITABLE Forex Scalping Strategy" taken from YouTube channel ForexSignals TV
Search in scripts for "candle"

Pro Trading Art Open Range Breakout StrategyThis strategy is based on Selected Candle High Low Breakout with buffer point.
You can select specific candle from input tab by giving time of that candle.
Default Settings:
Start Hour : Hour of starting candle means from this input you can specify opening candle. Default is 9.
Start Minute: Minute of starting candle. Default is 15. Means Default opening candle is 9:15
Stop Hour : Means After this time no new trade will execute.
End Hour & End Minute & Close All Trade : Means when you specify End Hour and Minute and Close all trade is true then strategy will close all trade on specified time.
Buffer : With the help of this option you can add some point in High and low of Opening Candle
Trade Mode : You can specify Target and Stop Loss in point or Percent
Stop Loss Point or Percent : This will work according to Trade Mode
Target Point Or Percent : This will work according to Trade Mode

ReversionStrategyThis strategy aims to identify condition of exhaustion to trade market reversal. It uses multiple indicators to enter a position. It uses following indicator:
1. RSI
2. ATR
Functionality of the Multi-Indicator:
1. RSI:
If RSI value is more then 70(input parameter) then market is over-brought. When less than 30 (input parameter) then market is over sold. Over brought or over sold market are good to play reversal.
2. ATR:
If current bar atr is more than 20 period (input) atr then it indicates over extended move.
3. Candle structure:
If a big candle closes near (within 10%) to its high then it indicates exhaustion. Same when big candle closes near to lows.
The combination of above 3 identifies buy or sell condition. Stop loss is 1.5 times atr. These parameter are input.
Sell condition:
1. RSI is more than 70
2. Current bar ATR is more than 20 perios ATR
3. Candle closes within 10% of its high.
If above 3 conditions are met on a candle then it indicates exhaustion of up move and sell order should be opened on next candle.
Buy condition:
1. RSI is less than 30
2. Current bar ATR is more than 20 perios ATR
3. Candle closes within 10% of its lows.
If above 3 conditions are met on a candle then it indicates exhaustion of down move and buy order should be opened on next candle.

Setup 9.1 Larry WilliamsThis Strategy was created according to Larry Williams 9.1 Setup. This is based on the Exponential Moving Average of 9 days. Although this might be used in any timeframe, it is most common on the Daily Timeframe.
I have developed this strategy to be used on both Long and Short Position, using the drop down list.
- Setup 9.1 (Lond Position)
It looks for tickers where the close is below EMA9. Once close gets above EMA9 we set this candle as 9.1. The entry point happens one tick above the 9.1 candle. The stop loss is set to be one tick below the lowest of this candle. The exit takes place once close is below EMA9
- Setup 9.1 (Short Position)
It looks for tickers where the close is above EMA9. Once Close gets below EMA9 we set this candle as 9.1. The entry point happens one tick below the 9.1 candle. The stop loss is set to be one tick above the highest of this candle. The exit takes place once close is above EMA9
To cut the noise and have a better trend direction on the EMA9, on both Long and Short, I used the code below for the setup.
setup91B = fastMA >fastMA and fastMA >fastMA and fastMA >fastMA and fastMA >fastMA and fastMA fastMA
setup91S = fastMA fastMA and close > fastMA and close < fastMA
If you have any questions, let me know !

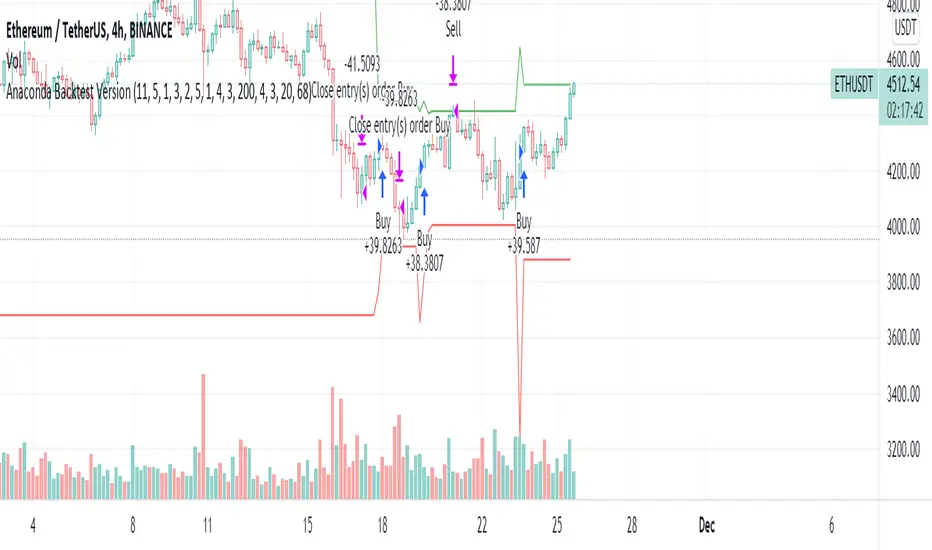
Anaconda Backtest VersionThis is the Anaconda strategy backtest version, no alerts. It will execute orders up to current_date - 2 days.
This is a LONG only strategy.
Anaconda waits for some thresholds to enter long. Once it enters long, it will setup profit and stoploss targets. These targets are updated if some conditions are met. The position is closed when the price hits profit or stoploss targets or when a certain bearish threshold is met.
No portfolio management is integrated. Positions are supposed to be entered with 100% equity and closed at 100%.
The strategy works better for large timeframes : 1h, 2h, 3h, 4h, 1D ...
You can apply the strategy to any symbol supported by TardingView and fine-tune the settings for the selected market/timeframe.
The strategy is supposed to be used on regular candles.
security() function has not been used. No special candles have been used (heikin ashi, renko etc.). Trailing stop (trail_* variables) have not been used.
==================
EXAMPLE SETTINGS
==================
These are the example settings for some assets that make the strategy perform well in the backtest mode.
Settings are listed in order of appearance in the strategy settings dialog in TradingView.
Please note that exaggerated profits for some symbols may come from the fact that the minimum ticker size of that symbol has been increased (from 0.0001 to 0.001 for example) between the start date and end date of the backtest. So you will see some trades closing outside the candle's ohlc range. Unfortunately, this is a limitation in TV and can't do much about it.
BNB/USDT (4h) : 11,5,1,3,10,4,1,4,5,200,6,2,19 (rsi threshold = 50)
FTM/USDT (1h) : 11,8,3,4,5,5,1,5,7,400,5,3,20 (rsi threshold=50)
ETH/USDT (4h) : 11,5,1,3,2,5,1,4,3,200,4,3,20 (rsi threshold = 68)
MATIC/USDT (1h) : 9,10,3,4,6,7,1,6,7,200,2,5,18 (rsi threshold = 70)
DASH/USDT (4h) : 8,8,3,3,4,4,1,7,5,200,3,2,21 (no rsi)
BAT/USDT (4h) : 8,8,3,3,7,7,1,8,6,200,3,2,21 (rsi threshold = 40)
BAT/USDT (1h) : 9,9,3,6,6,7,1,7,7,300,6,4,21 (no rsi)
DOGE/USDT (1h) : 11,8,3,4,4,9,1,4,6,200,3,2,18 (rsi thresold = 70)
NKN/USDT (1h) : 6,7,3,4,2,8,3,5,8,200,6,3,15 (rsi threshold = 50)
BTC/USDT (4h) : 6,5,3,4,7,6,5,5,6,200,2,3,15 (no rsi)
BTC/USDT (3h) : 6,5,3,4,7,5,1,6,4,300,2,2,17 (no rsi)
Smoothed Waddah ATR~~~All Credit to LAZY BEAR for posting the original Script which is an old MT4 indicator.~~~~
No this system does not repaint... if it does let me know. Either the code is wrong or you are using a repainting chart such as renko candles.
*PURPOSE*
This Is an "Enhanced or Smoothed" version of the script that captures the heiken-ashi closing price as its main calculation variable. While using normal bar or line charts. Enhancements integrate trade filters to reduce false signals.
*WHAT TYPE OF TRADING STRATEGY IS THIS?*
This is a Long Only, Trend Trading System. Is intended to be applied to Charts/Timeframes that produce sustainable trends for which ever asset you are trading.
*NOTE OF ADVICE REGARDING SETTINGS*
Settings can be tweaked but I have found that best results come with the given settings. If a chart is too choppy to trade this indicator successfully, it is advised not to change the settings but either find a different timeframe or different asset to apply this strategy to.
TLDR
Indicator measures the change of the MacD (difference between MAC D of given EMA's) and compares it to the difference between the Upper and Lower Bollinger bands. Green bar over trigger line= entry. Red bar over trigger line = close.
*SETTINGS AND INPUTS*
-MacD of HeikenAshi chart (will always be of the Heikenashi chart even when applied to different chart type)
sensitivity = input(150, title='Sensitivity') =range should be (125-175)multiplier so that MacD can be compared to BB
fastLength = input(20, title='MacD FastEMA Length')
slowLength = input(40, title='MacD SlowEMA Length')
-Bollinger Band of currently used price chart type
channelLength = input(20, title='BB Channel Length')
mult = input(1.5, title='BB Stdev Multiplier')
-14 Period RSI Trade Filter (set to 0 to Disable)
RSI14filter = input(40, title='RSI Value trade filter') =only gives entry when RSI is higher than given value
*ABSTRACT & CONCEPT*
TLDR - Indicator measures the change of the MacD (difference between MAC D of given EMA's) and compares it to the difference between the Upper and Lower Bollinger bands. Green bar over trigger line= entry. Red bar over trigger line = close.
Indicator plots -
Bars are the change in the MAC D and the indicator line is the difference in the BB.
When Bars are higher than the indicator line then it is considered a trend "Explosion"
Green Bars are Trend Explosion to the upside, Red Bars are Trend explosion to the downside.
GENERAL DETAIL-
the core calculation is measuring the change in MacD of current candle compared to the MacD of two previous candles.
This value is multiplied by the sensitivy so it can be compared to the change in Bollinger Band Width.
if the MACD change is positive then you get a green/lime bar for that value. If the MacDchange is negative you get a red/orange bar for that value.
and are determined by whether the actual change is increasing in that direction or decreasing. (bars getting taller or bars getting shorter)
Entry signal for long is A positive change in MACD difference (Green bar) that is greater than the change of the bollinger band (orange signal line) AND if the RSI value is above your filter.
Close signal or Trend Stop Warning Signal is given when a Negative MacD Difference (red bar) is greater than the change of the bollinger band (orange Line)
*CONSIDERATIONS AND THOUGHTS*
I have over 150 iterations of this indicator and this is the most consistent and best version of settings and filters I was able to generate. I built this indicator specifically for 3 charts. SPY monthly, QQQ monthly, BTC 3 Day. However this indicator works well on any long term bullish chart. (tech stocks are great) .
Trend trading systems are intended to be homerun hitting, plunge protecting indicators that allow for long legs and expanding volatility. This indicator does this as the trigger line is Dynamic with the expansion and contraction of the bollinger band.
I do not take every signal specifically not the close signals. Instead they more like warnings in ultra bullish environments.
If i had to pair this indicator with any other filter than the RSI, it would be a long term moving average i.e. the 50 week or equivalent for your chart. signals above rising moving averages means that you are trading with an upward trending market.
Hope this helps. Happy trades.
-SnarkyPuppy

BTC Volatility Band StrategyThis script/strategy is a pullback system designed for securities with high volatility so naturally Bitcoin is an excellent choice for trading this. This could be used both on a daily chart or on lower timeframes (I found good results on 3hr timeframe but haven't tested it on anything under 1hr).
A volatility band is created by comparing the candle close price of the previous 2 candles and and it uses this change in price to create a moving average. A band is wrapped around the moving average with a standard deviation of 1 for the inner band and 2 for the outer band. If the price is above a pre-set MA (moving average filter) then it is determined we are in an uptrend so the strategy will issue a buy signal when we are in an uptrend and there is a pullback which causes the lower inner deviation band to be spiked, but if the price continues and falls through the outer deviation band then a buy signal will not issue as this detriments that the volatility spike is to great. You can see a spike "buy" event occur on the indicator where the background is coloured green. For a short/sell then there will be a spike on the upper inner band and we are below the pre-set MA filter, for this it shows with red background on the indicator.
The user can change the date range they wish to test, the moving average period for the volatility tracking and the inner and outer band deviations. On BTC I left the inner deviation and outer deviation bands on standard settings but found the 3 period volatility tracking to be good for trading 1 day chart and the 5 period volatility tracking good for the 3hr chart. Since this is not a buy and hold strategy then for trading you would probably want to stick with the most liquid coins so you can get in and out very fast on any exchange. If you wanted to tray this on less volatile markets then changing the inner deviation band to ~0.75 would work okay in various futures markets likely stocks as well. The take profit and stop loss levels are based on a multiple of the trading range looking back the past 7 candles.
Attached result is trading 1 BTCUSDT contract on Binance.

Heikin-Ashi Change Strategy/ Indicator
Today I bring you a simple and efficient indicator/strategy based only on HA.
Can be used together with other TA tools or alone.
The idea behind is simple :
We have to forms to calculate the candle, using inner HA candles or normal candles. Once we have that we apply certain rules to get the max high, min low, open and close(ohlc)
With that then we check for changing in the patters like for example
For long close is higher than open and the previos close is lower than open. For short is going to be the opposite of long condition.
For the purpose of this example, I only use long direction and exit once we have the short signal.
If you have any questions, please let me know in private chat !

Crypto Long only Strategy 3h+ timeframeToday I bring another crypto strategy that works greatly with pairs like BTCEUR, ETHEUR, for 3h+ time frames.
Its a risky strategy because we have a hard stop loss of 25% of our capital which can be modified.
The idea behind its simple, we have a candle which is made from open+high+low+close / 4 , and we make the decision based on this one.
We only go long with this strategy .
For entry: if we have 5 ascending candles we enter, and we exit when we have 4 descending candles.
For this example, I used 100% of the initial capital(1000 EUR/USD), with a commission of 0.1% per each deal.
At the same time, the max capital that can be lost in a trade is going to be the equity risk, in this example 25% .
Overall we can see that's more or less around the same level as buy and hold strategy

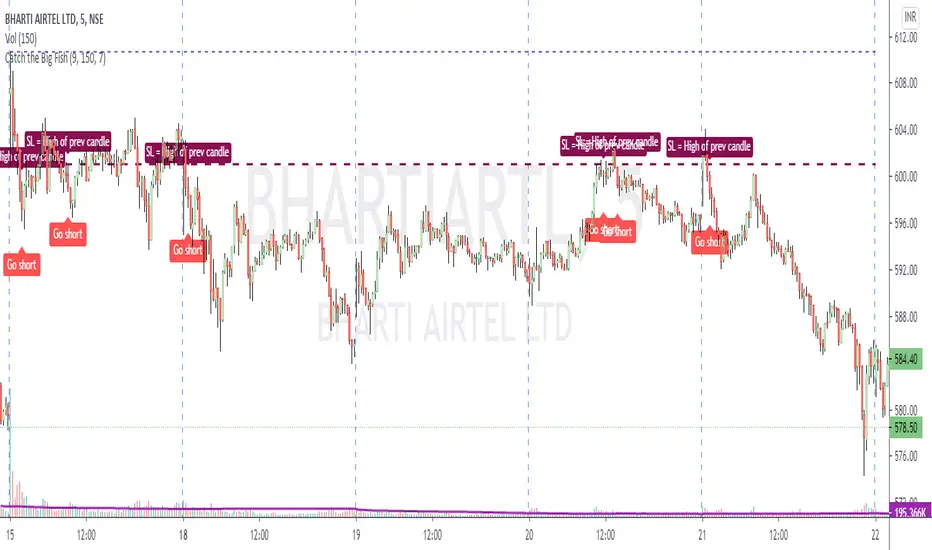
Catch the Big FishVolume based script to catch a big move. Works best on 5 min timeframe.
The default sma duration for volume is set to 150 = number of candles in 5 mins timeframe for 2 days.
Heavy volume is defined as = more than 9 times of sma.
Both parameters are configurable.
Trading strategy: Long buy at high / Short sell at low of the candle where the script gives the signal.
Important note regarding SL - for Long / Short positions respectively, the SL should be placed at low / high of previous candle, and NOT of the same candle.
Profit Sniper 2.0 | BACKTESTProfit Sniper 2.0 Backtest now offering up huge improvements, including multiple position triggers, derived from Bollinger Bands and Chande Momentum as well as our own bespoke stochastic ribbons that provide trend pivots .
Profit Sniper now works with regular Japanese candles, however, still provides the flexibility of Heiken Ashi settings for certain elements of the indicator, this allows the accuracy of Japanese candlestick prices, and the smooth trends of HA.
Profit Sniper 2.0 has been specifically re-written for use with automation, including our own in-house trading robot known as C.A.T (Crypto Algo Trader) and as such we have chosen to remove several noisy elements of the now defunct Profit Sniper that were underused, such as the PPO and RSI variants.
Another big decision was to remove the MACD from the indicator package, as invariably users preferred using the built in MACD .
So how does it work?
HUNT
In true Sniper fashion, when our stochastic HA ribbons pivot between short and long trends, the indicator will offer up a colour coded flag the says “1. HUNT” green for long, red for short.
SIGHT
At this stage, the indicator is now looking for a second condition, this is displayed as “2. Sight” at this point the indicator as noticed a drop in the previous momentum, to pre-empt a flip between long and short. Red is for short, green is for Long
FIRE
The final condition to be met, is based on the positioning of the Bollinger Bands , which is show as the “3. Fire Flag” again, as with hunt and sight, red is for short and green is for long.
User parameters allow traders to add trailing stop, toggle between percentage and USD value, as well as edit all the indicator settings in both HA and JPY Candles providing higher accuracy in the forecast rate.
** Please note, that trade execution occurs at the open of the candle after the FIRE condition is met, this means that it is likely that the back test may throw up slightly worse results than in real time trading with using CAT as CAT will execute on Bollinger moving average line in real time.

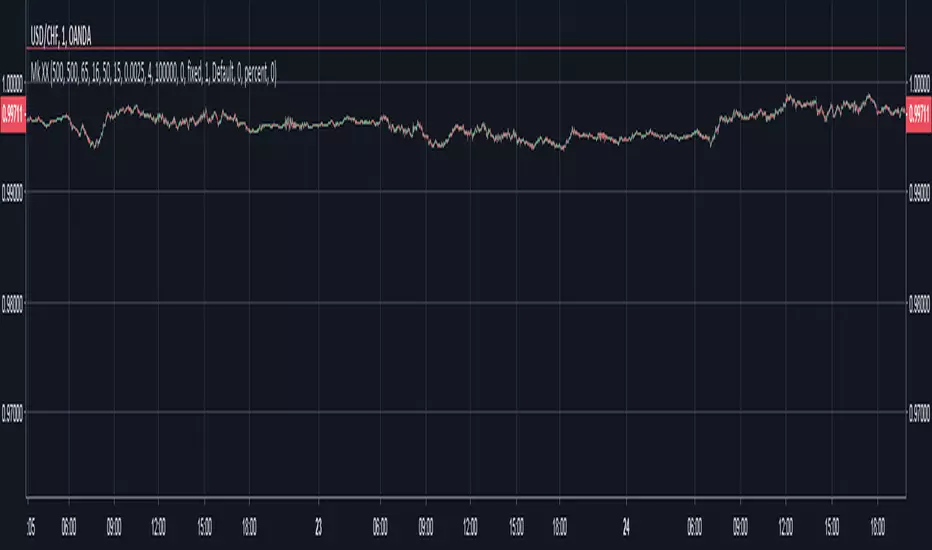
Mk XXIMPORTANT:
Use on 1m candles. Thick red/green lines are supp/res, thin are fibonacci.
Seems to work consistently on GBPUSD, EURUSD, USDCHF maybe AUDUSD, on NZDUSD it goes way out of the Fib lines. That's the main issue I have, no matter what I put the inputs at, won't work on all charts. I would customize it for each chart, but with 1m candles I can't backtest far enough to know whether it's reliable. I got it up to 300% or even 500% but it was never consistent. Here are some ranges I was using for the inputs:
Look-Back Res.: 50 - 500
Look-Back Sup.: 50 - 500
Time In Stage 1: 15 - 150
Readjust: 15 - 150
How Steep for a break: 15 - 150
Spacer: 5 - 25
TP: 0.0006 - 0.0025 (feel free to try higher)
Goals:
Consistency. You can try on other candle sizes, I was just using 1m because the buys/sells are more accurate
Drawdown under $50 ideally
Avg # Bars in Trades as low as possible, to get out quickly and enter trade on different coin pair
Note: Currently using $200,000 account and buying in with about $180k when all 4 trades are in. So results are using ridiculously high risk just so I can see max possible drawdown.
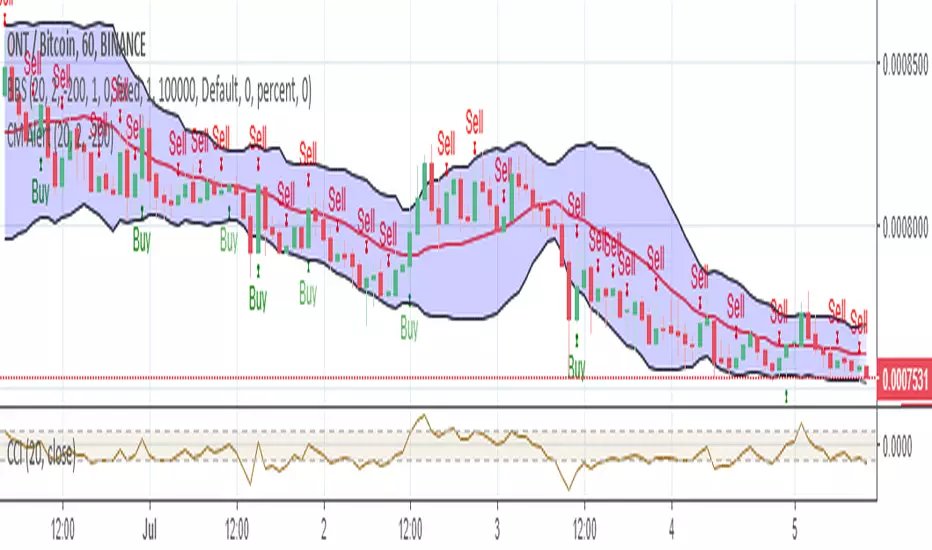
Bollinger Bear SniperThis script uses Bollinger Band but with different interpretation. The upper Bollinger Band is the resistant level, the lower Bollinger Band is the base or support level. The Commodity Channel Index (CCI) and the Bollinger Bandwidth helps us avoid high risk.
The script identifies candles that are marking bold upward moves in prices and fires buy signal. Sales signals are fired when the candle closes in positive. The idea is to buy and sell on the same candle or next positively closed candle. This is anti-bear-anti-bags strategy. You either make profit or loss holding no bag. When you gain more than lose you are in business. This script is set to gain more than lose. We however offer no guarantee, expressed or implied. We are NOT responsible.
Braid Filter StrategyThis strategy is like a sophisticated set of traffic lights and speed limit signs for trading. It only allows a trade when multiple indicators line up to confirm a strong move, giving it its "Braid Filter" name—it weaves together several conditions.
The strategy is set up to use 100% of your account equity (your trading funds) on a trade and does not "pyramid" (it won't add to an existing trade).
1. The Main Trend Check (The Traffic Lights)
The strategy uses three main filters that must agree before it considers a trade.
A. The "Chad Filter" (Direction & Strength)
This is the heart of the strategy, a custom combination of three different Moving AveragesThese averages have fast, medium, and slow settings (3, 7, and 14 periods).
Go Green (Buy Signal): The fastest average is higher than the medium average, AND the three averages are sufficiently separated (not tangled up, which indicates a strong move).
Go Red (Sell Signal): The medium average is higher than the fastest average, AND the three averages are sufficiently separated.
Neutral (Wait): If the averages are tangled or the separation isn't strong enough.
Key Trigger: A primary condition for a signal is when the Chad Filter changes color (e.g., from Red/Grey to Green).
B. The EMA Trend Bars (Secondary Confirmation)
This is a simpler, longer-term filter using a 34-period Exponential Moving Average (EMA). It checks if the current candle's average price is above or below this EMA.
Green Bars: The price is above the 34 EMA (Bullish Trend).
Red Bars: The price is below the 34 EMA (Bearish Trend).
Trades only happen if the signal direction matches the bar color. For a Buy, the bar must be Green. For a Sell, the bar must be Red.
C. ADX/DI Filter (The Speed Limit Sign)
This uses the Average Directional Index (ADX) and Directional Movement Indicators (DI) to check if a trend is actually in motion and getting stronger.
Must-Have Conditions:
The ADX value must be above 20 (meaning there is a trend, not just random movement).
The ADX line must be rising (meaning the trend is accelerating/getting stronger).
The strategy will only trade when the trend is strong and building momentum.
2. The Trading Action (Entry and Exit)
When all three filters (Chad Filter color change, EMA Trend Bar color, and ADX strength/slope) align, the strategy issues a signal, but it doesn't enter immediately.
Entry Strategy (The "Wait-for-Confirmation" Approach):
When a Buy Signal appears, the strategy sets a "Buy Stop" order at the signal candle's closing price.
It then waits for up to 3 candles (Candles Valid for Entry). The price must move up and hit that Buy Stop price within those 3 candles to confirm the move and enter the trade.
A Sell Signal works the same way but uses a "Sell Stop" at the closing price, waiting for the price to drop and hit it.
Risk Management (Stop Loss and Take Profit):
Stop Loss: To manage risk, the strategy finds a recent significant low (for a Buy) or high (for a Sell) over the last 20 candles and places the Stop Loss there. This is a logical place where the current move would be considered "broken" if the price reaches it.
Take Profit: It uses a fixed Risk:Reward Ratio (set to 1.5 by default). This means the potential profit (Take Profit distance) is $1.50 for every $1.00 of risk (Stop Loss distance).
3. Additional Controls
Time Filter: You can choose to only allow trades during specific hours of the day.
Visuals: It shows a small triangle on the chart where the signal happens and colors the background to reflect the Chad Filter's trend (Green/Red/Grey) and the candle bars to show the EMA trend (Lime/Red).
🎯 Summary of the Strategy's Goal
This strategy is designed to capture strong, confirmed momentum moves. It uses a fast, custom indicator ("Chad Filter") to detect the start of a new move, confirms that move with a slower trend filter (34 EMA), and then validates the move's strength with the ADX. By waiting a few candles for the price to hit the entry level, it aims to avoid false signals.

Braid Filter StrategyAnother of TradeIQ's youtube strategies. It looks a little messy but it combines all the indicators into one so there are no extra panes. This strategy is like a sophisticated set of traffic lights and speed limit signs for trading. It only allows a trade when multiple indicators line up to confirm a strong move, giving it its "Braid Filter" name—it weaves together several conditions.
The strategy is set up to use 100% of your account equity (your trading funds) on a trade and does not "pyramid" (it won't add to an existing trade).
1. The Main Trend Check (The Traffic Lights)
The strategy uses three main filters that must agree before it considers a trade.
A. The "Braid Filter" (Direction & Strength)
This is the heart of the strategy, a custom combination of three different Moving Averages
These averages have fast, medium, and slow settings (3, 7, and 14 periods).
Go Green (Buy Signal): The fastest average is higher than the medium average, AND the three averages are sufficiently separated (not tangled up, which indicates a strong move).
Go Red (Sell Signal): The medium average is higher than the fastest average, AND the three averages are sufficiently separated.
Neutral (Wait): If the averages are tangled or the separation isn't strong enough.
Key Trigger: A primary condition for a signal is when the Chad Filter changes color (e.g., from Red/Grey to Green).
B. The EMA Trend Bars (Secondary Confirmation)
This is a simpler, longer-term filter using a 34-period Exponential Moving Average (EMA). It checks if the current candle's average price is above or below this EMA.
Green Bars: The price is above the 34 EMA (Bullish Trend).
Red Bars: The price is below the 34 EMA (Bearish Trend).
Trades only happen if the signal direction matches the bar color. For a Buy, the bar must be Green. For a Sell, the bar must be Red.
C. ADX/DI Filter (The Speed Limit Sign)
This uses the Average Directional Index (ADX) and Directional Movement Indicators (DI) to check if a trend is actually in motion and getting stronger.
Must-Have Conditions:
The ADX value must be above 20 (meaning there is a trend, not just random movement).
The ADX line must be rising (meaning the trend is accelerating/getting stronger).
The strategy will only trade when the trend is strong and building momentum.
2. The Trading Action (Entry and Exit)
When all three filters (Chad Filter color change, EMA Trend Bar color, and ADX strength/slope) align, the strategy issues a signal, but it doesn't enter immediately.
Entry Strategy (The "Wait-for-Confirmation" Approach):
When a Buy Signal appears, the strategy sets a "Buy Stop" order at the signal candle's closing price.
It then waits for up to 3 candles (Candles Valid for Entry). The price must move up and hit that Buy Stop price within those 3 candles to confirm the move and enter the trade.
A Sell Signal works the same way but uses a "Sell Stop" at the closing price, waiting for the price to drop and hit it.
Risk Management (Stop Loss and Take Profit):
Stop Loss: To manage risk, the strategy finds a recent significant low (for a Buy) or high (for a Sell) over the last 20 candles and places the Stop Loss there. This is a logical place where the current move would be considered "broken" if the price reaches it.
Take Profit: It uses a fixed Risk:Reward Ratio (set to 1.5 by default). This means the potential profit (Take Profit distance) is $1.50 for every $1.00 of risk (Stop Loss distance).
3. Additional Controls
Time Filter: You can choose to only allow trades during specific hours of the day.
Visuals: It shows a small triangle on the chart where the signal happens and colors the background to reflect the Chad Filter's trend (Green/Red/Grey) and the candle bars to show the EMA trend (Lime/Red).
🎯 Summary of the Strategy's Goal
This strategy is designed to capture strong, confirmed momentum moves. It uses a fast, custom indicator ("Chad Filter") to detect the start of a new move, confirms that move with a slower trend filter (34 EMA), and then validates the move's strength with the ADX. By waiting a few candles for the price to hit the entry level, it aims to avoid false signals.

Range Trading StrategyOVERVIEW
The Range Trading Strategy is a systematic trading approach that identifies price ranges
from higher timeframe candles or trading sessions, tracks pivot points, and generates
trading signals when range extremes are mitigated and confirmed by pivot levels.
CORE CONCEPT
The strategy is based on the principle that when a candle (or session) closes within the
range of the previous candle (or session), that previous candle becomes a "range" with
identifiable high and low extremes. When price breaks through these extremes, it creates
trading opportunities that are confirmed by pivot levels.
RANGE DETECTION MODES
1. HTF (Higher Timeframe) Mode:
Automatically selects a higher timeframe based on the current chart timeframe
Uses request.security() to fetch HTF candle data
Range is created when an HTF candle closes within the previous HTF candle's range
The previous HTF candle's high and low become the range extremes
2. Sessions Mode:
- Divides the trading day into 4 sessions (UTC):
* Session 1: 00:00 - 06:00 (6 hours)
* Session 2: 06:00 - 12:00 (6 hours)
* Session 3: 12:00 - 20:00 (8 hours)
* Session 4: 20:00 - 00:00 (4 hours, spans midnight)
- Tracks high, low, and close for each session
- Range is created when a session closes within the previous session's range
- The previous session's high and low become the range extremes
PIVOT DETECTION
Pivots are detected based on candle color changes (bullish/bearish transitions):
1. Pivot Low:
Created when a bullish candle appears after a bearish candle
Pivot low = minimum of the current candle's low and previous candle's low
The pivot bar is the actual bar where the low was formed (current or previous bar)
2. Pivot High:
Created when a bearish candle appears after a bullish candle
Pivot high = maximum of the current candle's high and previous candle's high
The pivot bar is the actual bar where the high was formed (current or previous bar)
IMPORTANT: There is always only ONE active pivot high and ONE active pivot low at any
given time. When a new pivot is created, it replaces the previous one.
RANGE CREATION
A range is created when:
(HTF Mode) An HTF candle closes within the previous HTF candle's range AND a new HTF
candle has just started
(Sessions Mode) A session closes within the previous session's range AND a new session
has just started
Or Range Can Be Created when the Extreme of Another Range Gets Mitigated and We Have a Pivot low Just Above the Range Low or Pivot High just Below the Range High
Range Properties:
rangeHigh: The high extreme of the range
rangeLow: The low extreme of the range
highStartTime: The timestamp when the range high was actually formed (found by looping
backwards through bars)
lowStartTime: The timestamp when the range low was actually formed (found by looping
backwards through bars)
highMitigated / lowMitigated: Flags tracking whether each extreme has been broken
isSpecial: Flag indicating if this is a "special range" (see Special Ranges section)
RANGE MITIGATION
A range extreme is considered "mitigated" when price interacts with it:
High is mitigated when: high >= rangeHigh (any interaction at or above the level)
Low is mitigated when: low <= rangeLow (any interaction at or below the level)
Mitigation can happen:
At the moment of range creation (if price is already beyond the extreme)
At any point after range creation when price touches the extreme
SIGNAL GENERATION
1. Pending Signals:
When a range extreme is mitigated, a pending signal is created:
a) BEARISH Pending Signal:
- Triggered when: rangeHigh is mitigated
- Confirmation Level: Current pivotLow
- Signal is confirmed when: close < pivotLow
- Stop Loss: Current pivotHigh (at time of confirmation)
- Entry: Short position
Signal Confirmation
b) BULLISH Pending Signal:
- Triggered when: rangeLow is mitigated
- Confirmation Level: Current pivotHigh
- Signal is confirmed when: close > pivotHigh
- Stop Loss: Current pivotLow (at time of confirmation)
- Entry: Long position
IMPORTANT: There is only ever ONE pending bearish signal and ONE pending bullish signal
at any given time. When a new pending signal is created, it replaces the previous one
of the same type.
2. Signal Confirmation:
- Bearish: Confirmed when price closes below the pivot low (confirmation level)
- Bullish: Confirmed when price closes above the pivot high (confirmation level)
- Upon confirmation, a trade is entered immediately
- The confirmation line is drawn from the pivot bar to the confirmation bar
TRADE EXECUTION
When a signal is confirmed:
1. Position Management:
- Any existing position in the opposite direction is closed first
- Then the new position is entered
2. Stop Loss:
- Bearish (Short): Stop at pivotHigh
- Bullish (Long): Stop at pivotLow
3. Take Profit:
- Calculated using Risk:Reward Ratio (default 2:1)
- Risk = Distance from entry to stop loss
- Target = Entry ± (Risk × R:R Ratio)
- Can be disabled with "Stop Loss Only" toggle
4. Trade Comments:
- "Range Bear" for short trades
- "Range Bull" for long trades
SPECIAL RANGES
Special ranges are created when:
- A range high is mitigated AND the current pivotHigh is below the range high
- A range low is mitigated AND the current pivotLow is above the range low
In these cases:
- The pivot value is stored in an array (storedPivotHighs or storedPivotLows)
- A "special range" is created with only ONE extreme:
* If pivotHigh < rangeHigh: Creates a range with rangeHigh = pivotLow, rangeLow = na
* If pivotLow > rangeLow: Creates a range with rangeLow = pivotHigh, rangeHigh = na
- Special ranges can generate signals just like normal ranges
- If a special range is mitigated on the creation bar or the next bar, it is removed
entirely without generating signals (prevents false signals)
Special Ranges
REVERSE ON STOP LOSS
When enabled, if a stop loss is hit, the strategy automatically opens a trade in the
opposite direction:
1. Long Stop Loss Hit:
- Detects when: position_size > 0 AND position_size <= 0 AND low <= longStopLoss
- Action: Opens a SHORT position
- Stop Loss: Current pivotHigh
- Trade Comment: "Reverse on Stop"
2. Short Stop Loss Hit:
- Detects when: position_size < 0 AND position_size >= 0 AND high >= shortStopLoss
- Action: Opens a LONG position
- Stop Loss: Current pivotLow
- Trade Comment: "Reverse on Stop"
The reverse trade uses the same R:R ratio and respects the "Stop Loss Only" setting.
VISUAL ELEMENTS
1. Range Lines:
- Drawn from the time when the extreme was formed to the mitigation point (or current
time if not mitigated)
- High lines: Blue (or mitigated color if mitigated)
- Low lines: Red (or mitigated color if mitigated)
- Style: SOLID
- Width: 1
2. Confirmation Lines:
- Drawn when a signal is confirmed
- Extends from the pivot bar to the confirmation bar
- Bearish: Red, solid line
- Bullish: Green, solid line
- Width: 1
- Can be toggled on/off
STRATEGY SETTINGS
1. Range Detection Mode:
- HTF: Uses higher timeframe candles
- Sessions: Uses trading session boundaries
2. Auto HTF:
- Automatically selects HTF based on current chart timeframe
- Can be disabled to use manual HTF selection
3. Risk:Reward Ratio:
- Default: 2.0 (2:1)
- Minimum: 0.5
- Step: 0.5
4. Stop Loss Only:
- When enabled: Trades only have stop loss (no take profit)
- Trades close on stop loss or when opposite signal confirms
5. Reverse on Stop Loss:
- When enabled: Hitting a stop loss opens opposite trade with stop at opposing pivot
6. Max Ranges to Display:
- Limits the number of ranges kept in memory
- Oldest ranges are purged when limit is exceeded
KEY FEATURES
1. Dynamic Pivot Tracking:
- Pivots update on every candle color change
- Always maintains one high and one low pivot
2. Range Lifecycle:
- Ranges are created when price closes within previous range
- Ranges are tracked until mitigated
- Mitigation creates pending signals
- Signals are confirmed by pivot levels
3. Signal Priority:
- Only one pending signal of each type at a time
- New signals replace old ones
- Confirmation happens on close of bar
4. Position Management:
- Closes opposite positions before entering new trades
- Tracks stop loss levels for reverse functionality
- Respects pyramiding = 1 (only one position per direction)
5. Time-Based Drawing:
- Uses time coordinates instead of bar indices for line drawing
- Prevents "too far from current bar" errors
- Lines can extend to any historical point
USAGE NOTES
- Best suited for trending and ranging markets
- Works on any timeframe, but HTF mode adapts automatically
- Sessions mode is ideal for intraday trading
- Pivot detection requires clear candle color changes
- Range detection requires price to close within previous range
- Signals are generated on bar close, not intra-bar
The strategy combines range identification, pivot tracking, and signal confirmation to
create a systematic approach to trading breakouts and reversals based on price structure, past performance does not in any way predict future performance

Hyper SAR Reactor Trend StrategyHyperSAR Reactor Adaptive PSAR Strategy
Summary
Adaptive Parabolic SAR strategy for liquid stocks, ETFs, futures, and crypto across intraday to daily timeframes. It acts only when an adaptive trail flips and confirmation gates agree. Originality comes from a logistic boost of the SAR acceleration using drift versus ATR, plus ATR hysteresis, inertia on the trail, and a bear-only gate for shorts. Add to a clean chart and run on bar close for conservative alerts.
Scope and intent
• Markets: large cap equities and ETFs, index futures, major FX, liquid crypto
• Timeframes: one minute to daily
• Default demo: BTC on 60 minute
• Purpose: faster yet calmer PSAR that resists chop and improves short discipline
• Limits: this is a strategy that places simulated orders on standard candles
Originality and usefulness
• Novel fusion: PSAR AF is boosted by a logistic function of normalized drift, trail is monotone with inertia, entries use ATR buffers and optional cooldown, shorts are allowed only in a bear bias
• Addresses false flips in low volatility and weak downtrends
• All controls are exposed in Inputs for testability
• Yardstick: ATR normalizes drift so settings port across symbols
• Open source. No links. No solicitation
Method overview
Components
• Adaptive AF: base step plus boost factor times logistic strength
• Trail inertia: one sided blend that keeps the SAR monotone
• Flip hysteresis: price must clear SAR by a buffer times ATR
• Volatility gate: ATR over its mean must exceed a ratio
• Bear bias for shorts: price below EMA of length 91 with negative slope window 54
• Cooldown bars optional after any entry
• Visual SAR smoothing is cosmetic and does not drive orders
Fusion rule
Entry requires the internal flip plus all enabled gates. No weighted scores.
Signal rule
• Long when trend flips up and close is above SAR plus buffer times ATR and gates pass
• Short when trend flips down and close is below SAR minus buffer times ATR and gates pass
• Exit uses SAR as stop and optional ATR take profit per side
Inputs with guidance
Reactor Engine
• Start AF 0.02. Lower slows new trends. Higher reacts quicker
• Max AF 1. Typical 0.2 to 1. Caps acceleration
• Base step 0.04. Typical 0.01 to 0.08. Raises speed in trends
• Strength window 18. Typical 10 to 40. Drift estimation window
• ATR length 16. Typical 10 to 30. Volatility unit
• Strength gain 4.5. Typical 2 to 6. Steepness of logistic
• Strength center 0.45. Typical 0.3 to 0.8. Midpoint of logistic
• Boost factor 0.03. Typical 0.01 to 0.08. Adds to step when strength rises
• AF smoothing 0.50. Typical 0.2 to 0.7. Adds inertia to AF growth
• Trail smoothing 0.35. Typical 0.15 to 0.45. Adds inertia to the trail
• Allow Long, Allow Short toggles
Trade Filters
• Flip confirm buffer ATR 0.50. Typical 0.2 to 0.8. Raise to cut flips
• Cooldown bars after entry 0. Typical 0 to 8. Blocks re entry for N bars
• Vol gate length 30 and Vol gate ratio 1. Raise ratio to trade only in active regimes
• Gate shorts by bear regime ON. Bear bias window 54 and Bias MA length 91 tune strictness
Risk
• TP long ATR 1.0. Set to zero to disable
• TP short ATR 0.0. Set to 0.8 to 1.2 for quicker shorts
Usage recipes
Intraday trend focus
Confirm buffer 0.35 to 0.5. Cooldown 2 to 4. Vol gate ratio 1.1. Shorts gated by bear regime.
Intraday mean reversion focus
Confirm buffer 0.6 to 0.8. Cooldown 4 to 6. Lower boost factor. Leave shorts gated.
Swing continuation
Strength window 24 to 34. ATR length 20 to 30. Confirm buffer 0.4 to 0.6. Use daily or four hour charts.
Properties visible in this publication
Initial capital 10000. Base currency USD. Order size Percent of equity 3. Pyramiding 0. Commission 0.05 percent. Slippage 5 ticks. Process orders on close OFF. Bar magnifier OFF. Recalculate after order filled OFF. Calc on every tick OFF. No security calls.
Realism and responsible publication
No performance claims. Past results never guarantee future outcomes. Shapes can move while a bar forms and settle on close. Strategies execute only on standard candles.
Honest limitations and failure modes
High impact events and thin books can void assumptions. Gap heavy symbols may prefer longer ATR. Very quiet regimes can reduce contrast and invite false flips.
Open source reuse and credits
Public domain building blocks used: PSAR concept and ATR. Implementation and fusion are original. No borrowed code from other authors.
Strategy notice
Orders are simulated on standard candles. No lookahead.
Entries and exits
Long: flip up plus ATR buffer and all gates true
Short: flip down plus ATR buffer and gates true with bear bias when enabled
Exit: SAR stop per side, optional ATR take profit, optional cooldown after entry
Tie handling: stop first if both stop and target could fill in one bar

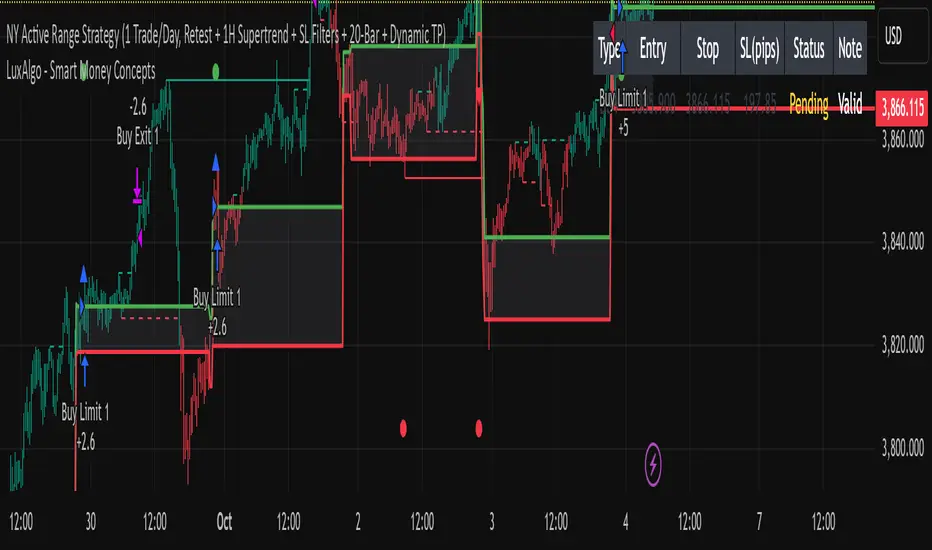
15min ACTIVE Rangeevery 9:30 am New York Time, Gold prints a high Volume 15 min Candle: "ACTIVE RANGE"
Every time gold prints a candle in which it has a higher candle than the current "ACTIVE RANGE" there would be a new "ACTIVE RANGE"
Breakout and retest the ACTIVE Range
KCandle Strategy 1.0# KCandle Strategy 1.0 - Trading Strategy Description
## Overview
The **KCandle Strategy** is an advanced Pine Script trading system based on bullish and bearish engulfing candlestick patterns, enhanced with sophisticated risk management and position optimization features.
## Core Logic
### Entry Signal Generation
- **Pattern Recognition**: Detects bullish and bearish engulfing candlestick formations
- **EMA Filter**: Uses a customizable EMA (default 25) to filter trades in the direction of the trend
- **Entry Levels**:
- **Long entries** at 25% of the candlestick range from the low
- **Short entries** at 75% of the candlestick range from the low
- **Signal Validation**: Orange candlesticks indicate valid setup conditions
### Risk Management System
#### 1. **Stop Loss & Take Profit**
- Configurable stop loss in pips
- Risk-reward ratio setting (default 2:1)
- Visual representation with colored lines and labels
#### 2. **Break-Even Management**
- Automatically moves stop loss to break-even when specified R:R is reached
- Customizable break-even offset for added protection
- Prevents losing trades after reaching profitability
#### 3. **Trailing Stop System**
- **Activation Trigger**: Activates when position reaches specified R:R level
- **Distance Control**: Maintains trailing stop at defined distance from entry
- **Step Management**: Moves stop loss forward in incremental R steps
- **Dynamic Protection**: Locks in profits while allowing for continued upside
### Advanced Features
#### Position Management
- **Pyramiding Support**: Optional multiple position entries with size reduction
- **Order Expiration**: Pending orders automatically cancel after specified bars
- **Position Sizing**: Percentage-based allocation with pyramid level adjustments
#### Visual Interface
- **Real-time Monitoring**: Comprehensive information panel with all strategy metrics
- **Historical Tracking**: Visual representation of past trades and levels
- **Color-coded Indicators**: Different colors for break-even, trailing, and standard stops
- **Debug Options**: Optional labels for troubleshooting and optimization
## Key Parameters
### Basic Settings
- **EMA Length**: Trend filter period
- **Stop Loss**: Risk per trade in pips
- **Risk/Reward**: Target profit ratio
- **Order Validity**: Duration of pending orders
### Risk Management
- **Break-Even R:R**: Profit level to trigger break-even
- **Trailing Activation**: R:R level to start trailing
- **Trailing Distance**: Stop distance from entry when trailing
- **Trailing Step**: Increment for stop loss advancement
## Strategy Benefits
1. **Objective Entry Signals**: Based on proven candlestick patterns
2. **Trend Alignment**: EMA filter ensures trades align with market direction
3. **Robust Risk Control**: Multiple layers of protection (SL, BE, Trailing)
4. **Profit Optimization**: Trailing stops maximize winning trade potential
5. **Flexibility**: Extensive customization options for different market conditions
6. **Visual Clarity**: Complete visual feedback for trade management
## Ideal Use Cases
- **Swing Trading**: Medium-term positions with trend-following approach
- **Breakout Trading**: Capturing momentum from engulfing patterns
- **Risk-Conscious Trading**: Suitable for traders prioritizing capital preservation
- **Multi-Timeframe**: Adaptable to various timeframes and instruments
---
*The KCandle Strategy combines traditional technical analysis with modern risk management techniques, providing traders with a comprehensive tool for systematic market participation.*

Mikey’s Strategy (AutoEMA+)
⚙️ Core Idea:
A long-only EMA crossover strategy that automatically selects the optimal EMA length (5–25) based on historical performance using a custom scoring system.
🎯 Entry Conditions:
Price crosses above the selected EMA.
(Optional) Price is above HTF EMA200 (higher timeframe trend).
(Optional) ADX is above a minimum threshold.
(Optional) Volume is above average × multiplier.
A cooldown period has passed since the last exit.
❌ Exit Condition:
Price closes fully below the EMA (current candle: high, low, and close all below),
and the previous candle was above or touched the EMA.
🧠 Auto EMA Selection Logic:
Scans EMAs in the range (e.g., 8–21) every N bars.
Scores each EMA based on:
Time price spent above the EMA
Respect for EMA (touches)
Trend consistency
Distance from EMA (when above)
Picks the EMA with the highest valid score, and updates only if it’s significantly better.
🛡️ Risk Management:
No pyramiding (1 position max).
Cooldown period after exit.
No hard stop loss or take profit.
📊 Visuals & Alerts:
Plots the selected EMA and optional HTF EMA200.
Entry markers and info label on the chart.
Alerts for valid entries and filtered signals.

Imbalance No SL📊 Strategy Name: Imbalance No SL
This strategy specially trades on price jumps (true imbalances) in the market, takes advantage of momentum only, and as soon as the opposite signal and profit is received, the trade is closed immediately.
Imbalance No SL strategy specially generates buy and sell signals based on "Imbalance" logic, without any fixed Stop Loss.
🔍 Core Logic
Imbalance Detection
Bullish Imbalance : When the low of the current candle is above the high of the previous candle.
(i.e. a jump type gap occurred in the market – demand is high, price went straight up)
Bearish Imbalance : When the high of the current candle is below the low of the previous candle.
(i.e. the market suddenly fell down)
Creating Visual Box and Label on Signal:
As soon as bullish imbalance is found, green box & IMB BULL label is displayed on the chart.
Bearish has red box & IMB BEAR label.
Trade Entry Logic
BUY on Bullish Imbalance: If there is already a buy or neutral position, then a new “BUY” signal will fire.
SELL on Bearish Imbalance: If already in sell or neutral position, then new “SELL” signal will fire.
You can set quantity/lot size from ‘qty’ input field.
Trade Average Calculation
Buy/Sell maintains average price and their count (so that if averaging is done then correct P&L is calculated).
Trade Exit Logic (Profit Booking/Signal Reverse)
If your buy is going on and bearish imbalance is formed + price is above your average, then buy will be closed (profit condition).
If sell is going on and bullish imbalance is formed + price is below average, then sell will be closed.
Chart Cleaning/Management
Only keep the label and box of the latest signal on the chart, old boxes/labels are automatically deleted.
Alert
You can get alert on bullish or bearish signal (by using alert feature of TradingView).
✅ Simple Explanation for User
This strategy buys or sells directly at the gap (imbalance).
Whenever there is a clear signal of momentum in the market (breakout of the gap), then the trade entry takes place.
When there is an imbalance in the opposite direction and profit is made, the system closes the trade (closes).
There is no fixed stop-loss, risk management is handled by trade averaging/close.
You will know at every point on the visually chart that at which bar the buy, sell and exit took place.
⚠️ What to remember?
If the market is in trend then this script gives very good signals.
In choppy/sideways market, some loss trades can also come because there is no SL.
Big profit or big loss – both depend on the imbalance signal and market speed.

Mutanabby_AI | ATR+ | Trend-Following StrategyThis document presents the Mutanabby_AI | ATR+ Pine Script strategy, a systematic approach designed for trend identification and risk-managed position entry in financial markets. The strategy is engineered for long-only positions and integrates volatility-adjusted components to enhance signal robustness and trade management.
Strategic Design and Methodological Basis
The Mutanabby_AI | ATR+ strategy is constructed upon a foundation of established technical analysis principles, with a focus on objective signal generation and realistic trade execution.
Heikin Ashi for Trend Filtering: The core price data is processed via Heikin Ashi (HA) methodology to mitigate transient market noise and accentuate underlying trend direction. The script offers three distinct HA calculation modes, allowing for comparative analysis and validation:
Manual Calculation: Provides a transparent and deterministic computation of HA values.
ticker.heikinashi(): Utilizes TradingView's built-in function, employing confirmed historical bars to prevent repainting artifacts.
Regular Candles: Allows for direct comparison with standard OHLC price action.
This multi-methodological approach to trend smoothing is critical for robust signal generation.
Adaptive ATR Trailing Stop: A key component is the Average True Range (ATR)-based trailing stop. ATR serves as a dynamic measure of market volatility. The strategy incorporates user-defined parameters (
Key Value and ATR Period) to calibrate the sensitivity of this trailing stop, enabling adaptation to varying market volatility regimes. This mechanism is designed to provide a dynamic exit point, preserving capital and locking in gains as a trend progresses.
EMA Crossover for Signal Generation: Entry and exit signals are derived from the interaction between the Heikin Ashi derived price source and an Exponential Moving Average (EMA). A crossover event between these two components is utilized to objectively identify shifts in momentum, signaling potential long entry or exit points.
Rigorous Stop Loss Implementation: A critical feature for risk mitigation, the strategy includes an optional stop loss. This stop loss can be configured as a percentage or fixed point deviation from the entry price. Importantly, stop loss execution is based on real market prices, not the synthetic Heikin Ashi values. This design choice ensures that risk management is grounded in actual market liquidity and price levels, providing a more accurate representation of potential drawdowns during backtesting and live operation.
Backtesting Protocol: The strategy is configured for realistic backtesting, employing fill_orders_on_standard_ohlc=true to simulate order execution at standard OHLC prices. A configurable Date Filter is included to define specific historical periods for performance evaluation.
Data Visualization and Metrics: The script provides on-chart visual overlays for buy/sell signals, the ATR trailing stop, and the stop loss level. An integrated information table displays real-time strategy parameters, current position status, trend direction, and key price levels, facilitating immediate quantitative assessment.
Applicability
The Mutanabby_AI | ATR+ strategy is particularly suited for:
Cryptocurrency Markets: The inherent volatility of assets such as #Bitcoin and #Ethereum makes the ATR-based trailing stop a relevant tool for dynamic risk management.
Systematic Trend Following: Individuals employing systematic methodologies for trend capture will find the objective signal generation and rule-based execution aligned with their approach.
Pine Script Developers and Quants: The transparent code structure and emphasis on realistic backtesting provide a valuable framework for further analysis, modification, and integration into broader quantitative models.
Automated Trading Systems: The clear, deterministic entry and exit conditions facilitate integration into automated trading environments.
Implementation and Evaluation
To evaluate the Mutanabby_AI | ATR+ strategy, apply the script to your chosen chart on TradingView. Adjust the input parameters (Key Value, ATR Period, Heikin Ashi Method, Stop Loss Settings) to observe performance across various asset classes and timeframes. Comprehensive backtesting is recommended to assess the strategy's historical performance characteristics, including profitability, drawdown, and risk-adjusted returns.
I'd love to hear your thoughts, feedback, and any optimizations you discover! Drop a comment below, give it a like if you find it useful, and share your results.

Market Open Impulse [LuciTech]Market Open Impulse Strategy
The Market Open Impulse Strategy is designed to capture significant price movements that occur at market open (2:30 PM UK time). This strategy identifies impulsive candles with high volatility and enters trades based on the direction and strength of the initial market reaction.
How It Works:
The strategy activates exclusively at 2:30 PM UK time during market open sessions. It uses ATR-based volatility filtering to identify impulsive candles that exceed a configurable multiplier (default 1.5x ATR). Long entries are triggered when an impulsive candle closes above its midpoint and above the opening price, while short entries occur when an impulsive candle closes below its midpoint and below the opening price.
Risk management is handled through precise stop loss placement at the opposite extreme of the impulse candle (high for short positions, low for long positions). Take profit levels are calculated using a configurable risk-reward ratio with a default setting of 3:1. Position sizing is automatically calculated based on the percentage risk per trade, and an optional breakeven feature can move the stop loss to the entry price at specified profit levels.
The strategy incorporates time-based filtering to ensure trades only occur during the specified market open window. Visual indicators highlight qualifying impulsive candles and plot all entry and exit levels for clear trade management. The system offers flexible risk management with customizable risk percentage, risk-reward ratios, and breakeven settings, along with multiple stop loss calculation methods including both ATR-based and candle-based options.
Key Parameters:
Market open timing is fully configurable through hour and minute settings for strategy activation. The impulse ATR multiple sets the minimum volatility threshold required for trade qualification, with visual highlighting available for qualifying setups. Risk management parameters include the percentage of account equity to risk per trade, target profit multiples relative to initial risk, and the profit level threshold for breakeven stop loss adjustment. Users can choose between ATR-based or candle-based stop loss calculation methods and adjust technical parameters for volatility calculation including ATR length and smoothing methods.
Applications:
This strategy is particularly effective for trading market open volatility and momentum, capturing institutional order flow during key timing windows, executing short-term swing trades on significant price impulses, and trading markets with predictable opening patterns and consistent volatility characteristics.
