Hilly 2.0 Advanced Crypto Scalping Strategy - 1 & 5 Min ChartsHow to Use
Copy the Code: Copy the script above.
Paste in TradingView: Open TradingView, go to the Pine Editor (bottom of the chart), paste the code, and click “Add to Chart.”
Check for Errors: Verify no errors appear in the Pine Editor console. The script uses Pine Script v5 (@version=5).
Select Timeframe:
1-Minute Chart: Use defaults (emaFastLen=7, emaSlowLen=14, rsiLen=10, rsiOverbought=80, rsiOversold=20, slPerc=0.5, tpPerc=1.0, useCandlePatterns=false).
5-Minute Chart: Adjust to emaFastLen=9, emaSlowLen=21, rsiLen=14, rsiOverbought=75, rsiOversold=25, slPerc=0.8, tpPerc=1.5, useCandlePatterns=true.
Apply to Chart: Use a liquid crypto pair (e.g., BTC/USDT, ETH/USDT on Binance or Coinbase).
Verify Signals:
Green “BUY” or “EMA BUY” labels and triangle-up arrows below candles.
Red “SELL” or “EMA SELL” labels and triangle-down arrows above candles.
Green/red background highlights for signal candles.
Arrows use size.normal for consistent visibility.
Backtest: Use TradingView’s Strategy Tester to evaluate performance over 1–3 months, checking Net Profit, Win Rate, and Drawdown.
Demo Test: Run on a demo account to confirm signal visibility and performance before trading with real funds.
Search in scripts for "candle"

MTF FVG Confluence v6 — JSON Alerts via alert()This strategy combines multi-timeframe confluence with candlestick analysis and fair value gaps (FVGs) to generate structured long/short entries. It aligns Daily and 4H EMA trends with 1H MACD momentum, then confirms with engulfing candles and FVG zones for precision entries. Risk management is built-in, featuring stop-loss, 3R take-profit targets, and optional break-even logic, with dynamic JSON alerts for webhook automation.
Categories:
Candlestick analysis
Chart patterns
Cycles

LANZ Strategy 5.0 [Backtest]🔷 LANZ Strategy 5.0 — Rule-Based BUY Logic with Time Filter, Session Limits and Auto SL/TP Execution
This is the backtest version of LANZ Strategy 5.0, built as a strategy script to evaluate real performance under fixed intraday conditions. It automatically places BUY and SELL trades based on structured candle confirmation, EMA trend alignment, and session-based filters. The system simulates real-time execution with precise Stop Loss and Take Profit levels.
📌 Built for traders seeking to simulate clean intraday logic with fully automated entries and performance metrics.
🧠 Core Logic & Strategy Conditions
✅ BUY Signal Conditions:
Price is above the EMA200
The last 3 candles are bullish (close > open)
The signal occurs within the defined session window (NY time)
Daily trade limit has not been exceeded
If all are true, a BUY order is executed at market, with SL and TP set immediately.
🔻 SELL Signal Conditions (Optional):
Exactly inverse to BUY (below EMA + 3 bearish candles). Disabled by default.
🕐 Operational Time Filter (New York Time)
You can fully customize your intraday window:
Start Time: e.g., 01:15 NY
End Time: e.g., 16:00 NY
The system evaluates signals only within this range, even across midnight if configured.
🔁 Trade Management System
One trade at a time per signal
Trades include a Stop Loss (SL) and Take Profit (TP) based on pip distance
Trade result is calculated automatically
Each signal is shown with a triangle marker (BUY only, by default)
🧪 Backtest Accuracy
This version uses:
strategy.order() for entries
strategy.exit() for SL and TP
strategy.close_all() at the configured manual closing time
This ensures realistic behavior in the TradingView strategy tester.
⚙️ Flow Summary (Step-by-Step)
On every bar, check:
Is the time within the operational session?
Is the price above the EMA?
Are the last 3 candles bullish?
If conditions met → A BUY trade is opened:
SL = entry – X pips
TP = entry + Y pips
Trade closes:
If SL or TP is hit
Or at the configured manual close time (e.g., 16:00 NY)
📊 Settings Overview
Timeframe: 1-hour (ideal)
SL/TP: Configurable in pips
Max trades/day: User-defined (default = 99 = unlimited)
Manual close: Adjustable by time
Entry type: Market (not limit)
Visuals: Plotshape triangle for BUY entry
👨💻 Credits:
💡 Developed by: LANZ
🧠 Strategy logic & execution: LANZ
✅ Designed for: Clean backtesting, clarity in execution, and intraday logic simulation

ORB 5M + VWAP + Braid Filter + TP 2R o Niveles PreviosORB 5-Minute Breakout Strategy Summary
Strategy Name:
ORB 5M + VWAP + Braid Filter + TP 2R or Previous Levels
Timeframe:
5-minute chart
Trading Window:
9:35 AM to 11:00 AM (New York time)
✅ Entry Conditions:
Opening Range: Defined from 9:30 to 9:35 AM (first 5-minute candle).
Breakout Entry:
Long trade: Price breaks above the opening range high.
Short trade: Price breaks below the opening range low.
Confirmation Filters (All must be met):
Strong candle (green for long, red for short).
VWAP in the direction of the trade.
Braid Filter by Mango2Juice supports the breakout direction (green for long, red for short).
📉 Stop Loss:
Placed at the opposite side of the opening range.
🎯 Take Profit (TP):
+2R (Risk-to-Reward Ratio of 2:1),
or
Closest of the following: previous day’s high/low or premarket levels.
⚙️ Additional Rules:
Only valid signals between 9:35 and 11:00 AM.
Only one trade per breakout direction per day.
Filter out "trap candles" (very small or indecisive candles).
Avoid trading after 11:00 AM.
📊 Performance Goals:
Maintain a high Profit Factor (above 3 ideally).
Focus on tickers with good historical performance under this strategy (e.g., AMZN, PLTR, CVNA).

IU BBB(Big Body Bar) StrategyDESCRIPTION
The IU BBB (Big Body Bar) Strategy is a price action-based trading strategy that identifies high-momentum candles with significantly larger body sizes compared to the average. It enters trades when a strong bullish or bearish move occurs and manages risk using an ATR-based trailing stop-loss system.
USER INPUTS:
- Big Body Threshold – Defines how many times larger the candle body should be compared to the average body ( default is 4 ).
- ATR Length – The period for the Average True Range (ATR) used in the trailing stop-loss calculation ( default is 14 ).
- ATR Factor – Multiplier for ATR to determine the trailing stop distance ( default is 2 ).
LONG CONDITION:
- The current candle’s body is greater than the average body size multiplied by the Big Body Threshold.
- The closing price is higher than the opening price (bullish candle).
SHORT CONDITION:
- The current candle’s body is greater than the average body size multiplied by the Big Body Threshold.
- The closing price is lower than the opening price (bearish candle).
LONG EXIT:
- ATR-based trailing stop-loss dynamically adjusts, locking in profits as the price moves higher.
SHORT EXIT:
- ATR-based trailing stop-loss dynamically adjusts, securing profits as the price moves lower.
WHY IT IS UNIQUE:
- Unlike traditional momentum strategies, this system adapts to volatility by filtering trades based on relative candle size.
- It incorporates an ATR-based trailing stop-loss, ensuring risk management and profit protection.
- The strategy avoids choppy market conditions by only trading when significant momentum is present.
HOW USERS CAN BENEFIT FROM IT:
- Catch Strong Price Moves – The strategy helps traders enter trades when the market shows decisive momentum.
- Effective Risk Management – The ATR-based trailing stop ensures that winning trades remain profitable.
- Works Across Markets – Can be applied to stocks, forex, crypto, and indices with proper optimization.
- Fully Customizable – Users can adjust sensitivity settings to match their trading style and time frame.

Sniper Trade Pro (ES 15-Min) - Topstep Optimized🔹 Overview
Sniper Trade Pro is an advanced algorithmic trading strategy designed specifically for E-mini S&P 500 (ES) Futures on the 15-minute timeframe. This strategy is optimized for Topstep 50K evaluations, incorporating strict risk management to comply with their max $1,000 daily loss limit while maintaining a high probability of success.
It uses a multi-confirmation approach, integrating:
✅ Money Flow Divergence (MFD) → To track liquidity imbalances and institutional accumulation/distribution.
✅ Trend Confirmation (EMA + VWAP) → To identify strong trend direction and avoid choppy markets.
✅ ADX Strength Filter → To ensure entries only occur in trending conditions, avoiding weak setups.
✅ Break-Even & Dynamic Stop-Losses → To reduce drawdowns and protect profits dynamically.
This script automatically generates Buy and Sell signals and provides built-in risk management for automated trading execution through TradingView Webhooks.
🔹 How Does This Strategy Work?
📌 1. Trend Confirmation (EMA + VWAP)
The strategy uses:
✔ 9-EMA & 21-EMA: Fast-moving averages to detect short-term momentum.
✔ VWAP (Volume-Weighted Average Price): Ensures trades align with institutional volume flow.
How it works:
Bullish Condition: 9-EMA above 21-EMA AND price above VWAP → Confirms buy trend.
Bearish Condition: 9-EMA below 21-EMA AND price below VWAP → Confirms sell trend.
📌 2. Liquidity & Money Flow Divergence (MFD)
This indicator measures liquidity shifts by tracking momentum changes in price and volume.
✔ MFD Calculation:
Uses Exponential Moving Average (EMA) of Momentum (MOM) to detect changes in buying/selling pressure.
If MFD is above its moving average, it signals liquidity inflows → bullish strength.
If MFD is below its moving average, it signals liquidity outflows → bearish weakness.
Why is this important?
Detects when Smart Money is accumulating or distributing before major moves.
Filters out false breakouts by confirming momentum strength before entry.
📌 3. Trade Entry Triggers (Candlestick Patterns & ADX Filter)
To avoid random entries, the strategy waits for specific candlestick confirmations with ADX trend strength:
✔ Bullish Entry (Buy Signal) → Requires:
Bullish Engulfing Candle (Reversal confirmation)
ADX > 20 (Ensures strong trending conditions)
MFD above its moving average (Liquidity inflows)
9-EMA > 21-EMA & price above VWAP (Trend confirmation)
✔ Bearish Entry (Sell Signal) → Requires:
Bearish Engulfing Candle (Reversal confirmation)
ADX > 20 (Ensures strong trending conditions)
MFD below its moving average (Liquidity outflows)
9-EMA < 21-EMA & price below VWAP (Trend confirmation)
📌 4. Risk Management & Profit Protection
This strategy is built with strict risk management to maintain low drawdowns and maximize profits:
✔ Dynamic Position Sizing → Automatically adjusts trade size to risk a fixed $400 per trade.
✔ Adaptive Stop-Losses → Uses ATR-based stop-loss (0.8x ATR) to adapt to market volatility.
✔ Take-Profit Targets → Fixed at 2x ATR for a Risk:Reward ratio of 2:1.
✔ Break-Even Protection → Moves stop-loss to entry once price moves 1x ATR in profit, locking in gains.
✔ Max Daily Loss Limit (-$1,000) → Stops trading if total losses exceed $1,000, complying with Topstep rules.

MFS-3 Bars Pattern Strategy3 Bar Pattern Strategy
Detects an Ignite Candle followed by a Pullback Candle followed by a Confirmation Candle.
A Box will be drawn around the setup and three arrows will identify I, P, C (Ignite, Pullback, Confirmation) the setup.
The strategy will calculate a Stop Loss below the Low Price of the Ignite candle and a Take Profit at 2 times the Stop Loss giving a Risk to Reward Ratio of 1:2.
Extra conditions are included to reduce false triggers:
- A down trend must be detected using 3 SMA (Long, Medium, Short) that should be aligned from Long to Short one above the other.
- The Ignite Candle's body must be BELOW the Short SMA
An input form is available to adjust some strategy parameters.
Performance Note
----------------------
Trading conditions are very strict, so most of the time, no signals will be detected in the Strategy window.
This strategy should only be one of many strategies used for trade setups.
Hope you enjoy it.

Liquid Pours XtremeStrategy Description: Liquid Pours Xtreme
The Liquid Pours Xtreme is an innovative trading strategy that combines the analysis of specific time-based patterns with price comparisons to identify potential opportunities in the forex market. Designed for traders seeking a structured methodology based on clear rules, this strategy offers integration with Telegram for real-time alerts and provides visual tools to enhance trade management.
Key Features:
Analysis of Specific Time Patterns: The strategy captures and compares closing prices at two key moments during the trading day, identifying recurring patterns that may indicate future market movements.
Dynamic SL and TP Levels Implementation: Utilizes tick-based calculations to set Stop-Loss and Take-Profit levels, adapting to the current market volatility.
Advanced Telegram Integration: Provides detailed alerts including information such as the asset, signal time, entry price, and SL/TP levels, facilitating real-time decision-making.
Complete Customization: Allows users to adjust key parameters, including operation schedules, weekdays, and visual settings, adapting to different trading styles.
Enhanced Chart Visualization: Includes visual elements like candle color changes based on signal state, event markers, and halos to highlight important moments.
Default Strategy Properties: Specific configuration for optimal risk management and simulation.
How the Strategy Works
Capturing Prices at Key Moments:
- The strategy records the closing price at two user-defined specific times. These times typically correspond to periods of high market volatility, such as the opening of the European session and the US pre-market.
- Rationale: Volatility and trading volume usually increase during these times, presenting opportunities for significant price movements.
Generating Signals Based on Price Comparison:
- Buy Signal: If the second closing price is lower than the first, it indicates possible accumulation and is interpreted as a bullish signal.
- Sell Signal: If the second closing price is higher than the first, it suggests possible distribution and is interpreted as a bearish signal.
- Signals are only generated on selected trading days, allowing you to avoid days with lower liquidity or higher risk.
Calculating Dynamic SL and TP Levels:
- Stop-Loss (SL) and Take-Profit (TP) levels are calculated based on the entry price and a user-defined number of ticks, adapting to market volatility.
- The strategy offers the option to base these levels on the close of the signal candle or the open of the next candle, providing flexibility according to the trader's preference.
- SL and TP boxes are drawn on the chart for visual reference, facilitating trade management.
Automatic Execution and Alerts:
- Upon signal generation, the strategy automatically executes a market order (buy or sell).
- Sends a detailed alert to your Telegram channel, including essential information for quick decision-making.
Visual Elements:
- Colors candles based on the signal state: buy, sell, or neutral, allowing for quick trend identification.
- Provides a smooth color transition between signal states and uses markers and halos to highlight important events and signals on the chart.
Trade Management:
- Manages open trades with automatic exit conditions based on the established SL and TP levels.
- Includes mechanisms to prevent exceeding TradingView's limitations on boxes and labels, ensuring optimal script performance.
Originality and utility:
- This strategy incorporates a unique approach focusing on specific time patterns and their relationship to institutional activity in the market.
How to Use the Strategy
Add the Script to the Chart:
- Go to the indicators menu in TradingView.
- Search for " Liquid Pours Xtreme " and add it to your chart.
Set Up Telegram Alerts:
- Enter your Telegram Chat ID in the script parameters to receive alerts.
- Customize the Buy and Sell alert messages as desired.
Configure Time Patterns:
- Set the hours and minutes for the two times you want to compare closing prices, aligning them with relevant market sessions or events.
Set SL and TP Parameters:
- Define the number of ticks for the Stop-Loss and Take-Profit levels, adapting them to the asset you're trading and your risk tolerance.
- Choose the basis for SL and TP calculation (close of the signal candle or open of the next candle).
Select Trading Days:
- Enable or disable trading on specific days of the week, allowing you to avoid days with lower activity or unexpected volatility.
Customize Visual Elements:
- Adjust the colors and styles of visual elements to enhance readability and suit your personal preferences.
Monitor the Strategy:
- Observe the chart for signals and use Telegram alerts to stay informed of new opportunities, even when you're not at your terminal.
Testing and Optimization:
- Use TradingView's backtesting features to evaluate the historical performance of the strategy with different parameters.
- Adjust and optimize the parameters based on the results and your own analysis.
Adjust the Strategy Properties:
- Ensure that the strategy properties (order size, commission, slippage) are aligned with your trading account and platform to obtain realistic results.
Strategy Properties (Important)
This script backtest is conducted on M30 EURUSD , using the following backtesting properties:
Initial Capital: $10,000
Order Size: 50,000 Contracts (equivalent to 0.5% of the capital)
Commission: $0.20 per order
Slippage: 1 tick
Pyramiding: 1 order
Verify Price for Limit Orders: 0 ticks
Recalculate on Order Execution: Enabled
Recalculate on Every Tick: Enabled
Recalculate After Order Filled: Enabled
Bar Magnifier for Backtesting Precision: Enabled
We use these properties to ensure a realistic preview of the backtesting system. Note that default properties may vary for different reasons:
- Order Size: It is essential to calculate the contract size according to the traded asset and desired risk level.
- Commission and Slippage: These costs can vary depending on the market and instrument; there is no default value that might return realistic results.
We strongly recommend all users adjust the Properties within the script settings to align with their accounts and trading platforms to ensure the results from the strategies are realistic.
Backtesting Results:
- Net Profit: $4,037.50 (40.37%)
- Total Closed Trades : 292
- Profitability Percentage: 26.71%
- Profit Factor: 1.369
- Max Drawdown: $769.30 (6.28%)
- Average Trade: $13.83 (0.03%)
- Average Bars in Trades: 11
These results were obtained under the mentioned conditions and properties, providing an overview of the strategy's historical performance.
Interpreting Results:
- The strategy has demonstrated profitability in the analyzed period, although with a win rate of 26.71%, indicating that success relies on a favorable risk-reward ratio.
- The profit factor of 1.369 suggests that total gains exceed total losses by that proportion.
- It is crucial to consider the maximum drawdown of 6.28% when evaluating the strategy's suitability to your risk tolerance.
Risk Warning:
Trading leveraged financial instruments carries a high level of risk and may not be suitable for all investors. Before deciding to trade, you should carefully consider your investment objectives, level of experience, and risk tolerance. Past performance does not guarantee future results. It is essential to conduct additional testing and adjust the strategy according to your needs.
---
What Makes This Strategy Original?
Time-Based Pattern Approach: Unlike conventional strategies, this strategy focuses on identifying time patterns that reflect institutional activity and macroeconomic events that can influence the market.
Advanced Technological Integration: The combination of automatic execution and customized alerts via Telegram provides an efficient and modern tool for active traders.
Customization and Adaptability: The wide range of adjustable parameters allows the strategy to be tailored to different assets, time zones, and trading styles.
Enhanced Visual Tools: Incorporated visual elements facilitate quick market interpretation and informed decision-making.
Additional Considerations
Continuous Testing and Optimization: Users are encouraged to perform additional backtesting and optimize parameters according to their own observations and requirements.
Complementary Analysis: Use this strategy in conjunction with other indicators and fundamental analysis to reinforce decision-making.
Rigorous Risk Management: Ensure that SL and TP levels, as well as position sizing, align with your risk management plan.
Updates and Support: I am committed to providing updates and improvements based on community feedback. For inquiries or suggestions, feel free to contact me.
---
Example Configuration
Assuming you want to use the strategy with the following parameters:
Telegram Chat ID: Your unique Telegram Chat ID
First Time (Hour:Minute): 6:30
Second Time (Hour:Minute): 7:30
SL Ticks: 100
TP Ticks: 400
SL and TP Basis: Close of the Signal Candle
Trading Days: Tuesday, Wednesday, Thursday
Simulated Initial Capital: $10,000
Risk per Trade in Simulation: $50 (-0.5% of capital)
Slippage and Commissions in Simulation: 1 tick of slippage and $0.20 commission per trade
---
Conclusion
The Liquid Pours Xtreme strategy offers an innovative approach by combining specific time analysis with robust risk management and modern technological tools. Its original and adaptable design makes it valuable for traders looking to diversify their methods and capitalize on opportunities based on less conventional patterns.
Ready for immediate implementation in TradingView, this strategy can enrich your trading arsenal and contribute to a more informed and structured approach to your operations.
---
Final Disclaimer:
Financial markets are volatile and can present significant risks. This strategy should be used as part of a comprehensive trading approach and does not guarantee positive results. It is always advisable to consult with a professional financial advisor before making investment decisions.
---

Innocent Heikin Ashi Ethereum StrategyHello there, im back!
If you are familiar with my previous scripts, this one will seem like the future's nostalgia!
Functionality:
As you can see, all candles are randomly colored. This has no deeper meaning, it should remind you to switch to Heikin Ashi. The Strategy works on standard candle stick charts, but should be used with Heikin Ashi to see the actual results. (Regular OHLC calculations are included.)
Same as in my previous scripts we import our PVSRA Data from @TradersReality open source Indicator.
With this data and the help of moving averages, we have got an edge in the market.
Signal Logic:
When a "violently green" candle appears (high buy volume + tick speed) above the 50 EMA indicates a change in trend and sudden higher prices. Depending on OHLC of the candle itself and volume, Take Profit and Stop Loss is calculated. (The price margin is the only adjustable setting). Additionally, to make this script as simple and easily useable as possible, all other adjustable variables have been already set to the best suitable value and the chart was kept plain, except for the actual entries and exits.
Basic Settings and Adjustables:
Main Input 1: TP and SL combined price range. (Double, Triple R:R equally.)
Trade Inputs: All standard trade size and contract settings for testing available.
Special Settings:
Checkbox 1: Calculate Signal in Heikin Ashi chart, including regular candle OHLC („Open, High, Low, Close“)
Checkbox 2/3: Calculate by order fill or every tick.
Checkbox 4: Possible to fill orders on bar close.
Timeframe and practical usage:
Made for the 5 Minute to 1 hour timeframe.
Literally ONLY works on Ethereum and more or less on Bitcoin.
EVERY other asset has absolute 0% profitability.
Have fun and share with your friends!
Thanks for using!
Example Chart:

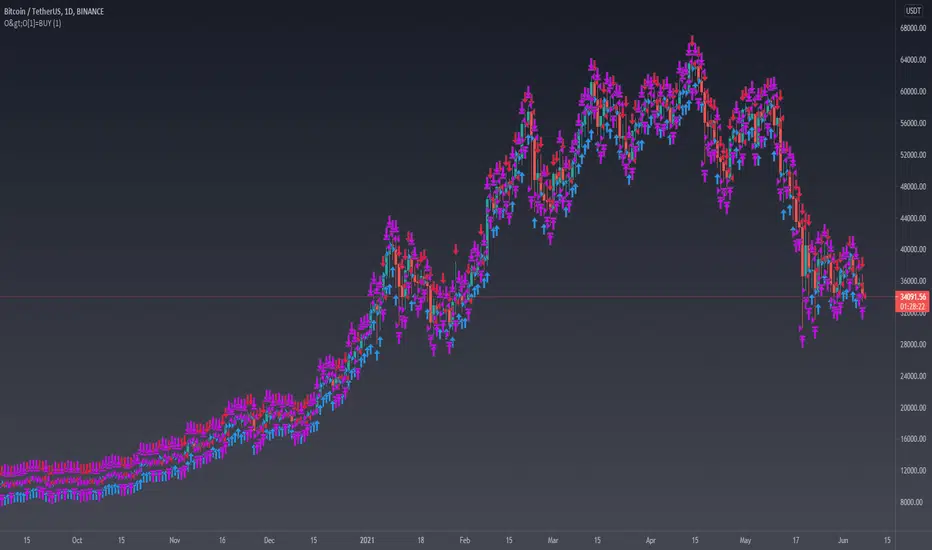
BTC 5 min SHBHilalimSB A Wedding Gift 🌙
What is HilalimSB🌙?
First of all, as mentioned in the title, HilalimSB is a wedding gift.
HilalimSB - Revealing the Secrets of the Trend
HilalimSB is a powerful indicator designed to help investors analyze market trends and optimize trading strategies. Designed to uncover the secrets at the heart of the trend, HilalimSB stands out with its unique features and impressive algorithm.
Hilalim Algorithm and Fixed ATR Value:
HilalimSB is equipped with a special algorithm called "Hilalim" to detect market trends. This algorithm can delve into the depths of price movements to determine the direction of the trend and provide users with the ability to predict future price movements. Additionally, HilalimSB uses its own fixed Average True Range (ATR) value. ATR is an indicator that measures price movement volatility and is often used to determine the strength of a trend. The fixed ATR value of HilalimSB has been tested over long periods and its reliability has been proven. This allows users to interpret the signals provided by the indicator more reliably.
ATR Calculation Steps
1.True Range Calculation:
+ The True Range (TR) is the greatest of the following three values:
1. Current high minus current low
2. Current high minus previous close (absolute value)
3. Current low minus previous close (absolute value)
2.Average True Range (ATR) Calculation:
-The initial ATR value is calculated as the average of the TR values over a specified period
(typically 14 periods).
-For subsequent periods, the ATR is calculated using the following formula:
ATRt=(ATRt−1×(n−1)+TRt)/n
Where:
+ ATRt is the ATR for the current period,
+ ATRt−1 is the ATR for the previous period,
+ TRt is the True Range for the current period,
+ n is the number of periods.
Pine Script to Calculate ATR with User-Defined Length and Multiplier
Here is the Pine Script code for calculating the ATR with user-defined X length and Y multiplier:
//@version=5
indicator("Custom ATR", overlay=false)
// User-defined inputs
X = input.int(14, minval=1, title="ATR Period (X)")
Y = input.float(1.0, title="ATR Multiplier (Y)")
// True Range calculation
TR1 = high - low
TR2 = math.abs(high - close )
TR3 = math.abs(low - close )
TR = math.max(TR1, math.max(TR2, TR3))
// ATR calculation
ATR = ta.rma(TR, X)
// Apply multiplier
customATR = ATR * Y
// Plot the ATR value
plot(customATR, title="Custom ATR", color=color.blue, linewidth=2)
This code can be added as a new Pine Script indicator in TradingView, allowing users to calculate and display the ATR on the chart according to their specified parameters.
HilalimSB's Distinction from Other ATR Indicators
HilalimSB emerges with its unique Average True Range (ATR) value, presenting itself to users. Equipped with a proprietary ATR algorithm, this indicator is released in a non-editable form for users. After meticulous testing across various instruments with predetermined period and multiplier values, it is made available for use.
ATR is acknowledged as a critical calculation tool in the financial sector. The ATR calculation process of HilalimSB is conducted as a result of various research efforts and concrete data-based computations. Therefore, the HilalimSB indicator is published with its proprietary ATR values, unavailable for modification.
The ATR period and multiplier values provided by HilalimSB constitute the fundamental logic of a trading strategy. This unique feature aids investors in making informed decisions.
Visual Aesthetics and Clear Charts:
HilalimSB provides a user-friendly interface with clear and impressive graphics. Trend changes are highlighted with vibrant colors and are visually easy to understand. You can choose colors based on eye comfort, allowing you to personalize your trading screen for a more enjoyable experience. While offering a flexible approach tailored to users' needs, HilalimSB also promises an aesthetic and professional experience.
Strong Signals and Buy/Sell Indicators:
After completing test operations, HilalimSB produces data at various time intervals. However, we would like to emphasize to users that based on our studies, it provides the best signals in 1-hour chart data. HilalimSB produces strong signals to identify trend reversals. Buy or sell points are clearly indicated, allowing users to develop and implement trading strategies based on these signals.
For example, let's imagine you wanted to open a position on BTC on 2023.11.02. You are aware that you need to calculate which of the buying or selling transactions would be more profitable. You need support from various indicators to open a position. Based on the analysis and calculations it has made from the data it contains, HilalimSB would have detected that the graph is more suitable for a selling position, and by producing a sell signal at the most ideal selling point at 08:00 on 2023.11.02 (UTC+3 Istanbul), it would have informed you of the direction the graph would follow, allowing you to benefit positively from a 2.56% decline.
Technology and Innovation:
HilalimSB aims to enhance the trading experience using the latest technology. With its innovative approach, it enables users to discover market opportunities and support their decisions. Thus, investors can make more informed and successful trades. Real-Time Data Analysis: HilalimSB analyzes market data in real-time and identifies updated trends instantly. This allows users to make more informed trading decisions by staying informed of the latest market developments. Continuous Update and Improvement: HilalimSB is constantly updated and improved. New features are added and existing ones are enhanced based on user feedback and market changes. Thus, HilalimSB always aims to provide the latest technology and the best user experience.
Social Order and Intrinsic Motivation:
Negative trends such as widespread illegal gambling and uncontrolled risk-taking can have adverse financial effects on society. The primary goal of HilalimSB is to counteract these negative trends by guiding and encouraging users with data-driven analysis and calculable investment systems. This allows investors to trade more consciously and safely.
What is BTC 5 min ☆SHB Strategy🌙?
BTC 5 min ☆SHB Strategy is a strategy supported by the HilalimSB algorithm created by the creator of HilalimSB. It automatically opens trades based on the data it receives, maintaining trades with its uniquely defined take profit and stop loss levels, and automatically closes trades when necessary. It stands out in the TradingView world with its unique take profit and stop loss markings. BTC 5 min ☆SHB Strategy is close to users' initiatives and is a strategy suitable for 5-minute trades and scalp operations developed on BTC.
What does the BTC 5 min ☆SHB Strategy target?
The primary goal of BTC 5 min ☆SHB Strategy is to close trades made by traders in short timeframes as profitably as possible and to determine the most effective trading points in low time periods, considering the commission rates of various brokerage firms. BTC 5 min ☆SHB Strategy is one of the rare profitable strategies released in short timeframes, with its useful interface, in addition to existing strategies in the markets. After extensive backtesting over a long period and achieving above-average success, BTC 5 min ☆SHB Strategy was decided to be released. Following the completion of test procedures under market conditions, it was presented to users with the unique visual effects of ☆SB.
BTC 5 min ☆SHB Strategy and Heikin Ashi
BTC 5 min ☆SHB Strategy produces data in Heikin-Ashi chart types, but since Heikin-Ashi chart types have their own calculation method, BTC 5 min ☆SHB Strategy has been published in a way that cannot produce data in this chart type due to BTC 5 min ☆SHB Strategy's ideology of appealing to all types of users, and any confusion that may arise is prevented in this way. Heikin-Ashi chart types, especially in short time intervals, carry significant risks considering the unique calculation methods involved. Thus, the possibility of being misled by the coder and causing financial losses has been completely eliminated. After the necessary conditions determined by the creator of BTC 5 min ☆SHB are met, BTC 5 min ☆SHB Heikin-Ashi will be shared exclusively with invited users only, upon request, to users who request an invitation.
Key Features:
+HilalimSHB Algorithm: This algorithm uses a dynamic ATR-based trend-following mechanism to identify the current market trend. The strategy detects trend reversals and takes positions accordingly.
+Heikin Ashi Compatibility: The strategy is optimized to work only with standard candlestick charts and automatically deactivates when Heikin Ashi charts are in use, preventing false signals.
+Advanced Chart Enhancements: The strategy offers clear graphical markers for buy/sell signals. Candlesticks are automatically colored based on trend direction, making market trends easier to follow.
Strategy Parameters:
+Take Profit (%): Defines the target price level for closing a position and automates profit-taking. The fixed value is set at 2%.
+Stop Loss (%): Specifies the stop-loss level to limit losses. The fixed value is set at 3%.
The shared image is a 5-minute chart of BTCUSDC.P with a fixed take profit value of 2% and a fixed stop loss value of 3%. The trades are opened with a commission rate of 0.063% set for the USDT trading pair on Binance.🌙

Megabar Breakout (Range & Volume & RSI)Hey there,
This strategy is based on the idea that certain events lead to what are called Megabars. Megabars are bars that have a very large range and volume. I wanted to verify whether these bars indicate the start of a trend and whether one should follow the trend.
Summary of the Code:
The code is based on three indicators: the range of the bar, the volume of the bar, and the RSI. When certain values of these indicators are met, a Megabar is identified. The direction of the Megabar indicates the direction in which we should trade.
Why do I combine these indicators?
I want to identify special bars that have the potential to mark the beginning of a breakout. Therefore, a bar needs to exhibit high volume, have a large range (huge price movement), and we also use the Relative Strength Index (RSI) to assess potential momentum. Only if all three criteria are met within one candle, do we use this as an identifier for a megabar.
Explanation of Drawings on the Chart:
As you can see, there is a green background on my chart. The green background symbolizes the time when I'm entering a trade. Only if a Megabar happens during that time, I'm ready to enter a trade. The time is between 6 AM and 4 PM CET. It's just because I prefer that time. Also, the strategy draws an error every time a Megabar happens based on VOL and Range only (not on the RSI). That makes it pretty easy to go through your chart and check the biggest bars manually. You can activate or deactivate these settings via the input data of the strategy.
When Do We Enter a Trade?
We wait for a Megabar to happen during our trading session. If the Megabar is bullish, we open a LONG trade at the opening price of the next candle. If the Megabar is bearish, we open a SHORT trade at the opening price of the next candle.
Where Do We Put Our Take Profit & Stop Loss?
The default setting is TP = 40 Pips and SL = 30 Pips. In that case, we are always trading with a risk-reward ratio of 1.33 by default. You can easily change these settings via the input data of the strategy.
Strategy Results
The criteria for Megabars were chosen by me in a way that makes Megabars something special. They are not intended to occur too frequently, as the fundamental idea of this strategy would otherwise not hold. This results in only 37 closed trades within the last 12 months. If you change the criterias for a megabar to a milder one, you will create more Megabars and therefore more trades. It's up to you. I have adapted this strategy to the 30-minute chart of the EURUSD. In the evaluation, we consider a period of 12 months, which I believe is sufficient.
My default settings for the indicators look like this:
Avg Length Vol 20
Avg Multiplier Vol 3
Avg Length Range 20
Avg Multiplier Range 4
Value SMA RSI for Long Trades 50
Value SMA RSI for Short Trades 70
IMPORTANT: The current performance overview does not display the results of these settings. Please change the settings to my default ones so that you can see how I use this strategy.
I do not recommend trading this strategy without further testing. The script is meant to reflect a basic idea and be used as a tool to identify Megabars. I have made this strategy completely public so that it can be further developed. One can take this framework and test it on different timeframes and different markets.

SeongMo_MA_V3(Elliot_helper)Made to make it easier to count Elliott waves.
If you renew your new high price, you'll continue your new high price
When the new low is renewed, the new low is continued.
If you are within the range of the previous candle, use the ratio of the difference between the median value of the previous candle and the closing price of the current candle to determine whether to continue the high or low price.
If a can with a tail that updates a new high price and a new low price at the same time comes out, the phrase "Check_candle!" appears to mean that you should check it with a lower time zone candle.

"NoSKi Hammer/Star /w angle of ema Backtester % Applied the angle of ema filter to stars formed in an uptrend, and hammers in a downtrend to try to pick good trading entries
Uses the average angle of the ema over the last 20 bars
(Please note: the angle calculation default value is calibrated for BTCUSD . There is no way currently to code it to be used across multiple pairs. The price to bar ratio has to be adjusted for other trading pairs. Please research price to bar ratio if unfamiliar). I have used a rough calculation so it can be used on other charts but won't be 100% accurate
Strategy uses % take profit and stop loss settings, and only enters one trade at a time (wont show entry if already in a position).
Separate ATR settings for filtering the size of hammer and star candles. (can filter out candles which are too large or small)
Red background colour is for when ema is at or below the set -ve angle slope. Green is for positive angle. Default is set at -45 and 45 degrees.
Big thankyou to ZenAndTheArtOfTrading for hammer and star coding, and Cosmic Angle - by cosmic_indicators for calculating the angle of emas.
Code was borrowed and used directly from these scripts.

FTB Strategy (Automated)Hey traders!
This is a profitable strategy script I created to teach my students how to automate their scripts using 3rd party APIs (more info available in my profile link at the bottom of this page).
What Is This?
This strategy is called the "Follow The Bear" strategy.
It's a forex trading strategy designed for one purpose and one purpose only: to take advantage of a recurring pattern on EURUSD's 1-Hour chart during the European market open.
The basic explanation is this:
During the European open we want to see a rally followed by a swing high shooting star / reversal pinbar candle. This typically means that traders buying EURUSD during the European/London open are now trapped long, and as price begins to retrace they are forced to sell, fueling a short-term retracement.
This strategy takes advantage of that pattern by aggressively selling short with a tight stop-loss above the pinbar candle and a conservative target.
There are many ways to trade this pattern, but this script represents my personal method for trading it.
It is not 100% accurate (no strategy is), but it does have a considerably high win rate over the past 6+ years considering its simplicity and I've been trading it for several months and can attest to its edge over the markets (at least through the Oanda data feed which is what I use).
The strategy rules are this:
Market: EURUSD
Timeframe: 1-Hour
Direction: Short Only
Timezone: 6AM-10AM GMT
Days: Tuesday, Wednesday, Thursday
Entry: Close of Pinbar Setup
Stop: 2 pips above signal candle
Target: 1:1
Risk: Up to you (backtest first! I use 1%)
The rule for the pinbar/shooting star candle pattern is that the candle must both open and close in the lower 50% of the bar's total size.
Automation
This script is already prepared to be auto-traded through a 3rd-party API that was created to relay TradingView alerts to your broker to execute and manage trades.
Sorry for the lack of information - due to TradingView's house rules I cannot go into any more detail here, but if you're interested in automating this script there is more info available in the resources offered under my profile link at the bottom of this page.
Disclaimer
The material and the resources offered here are for educational purposes only. Always do your own research and only execute trades based on your own personal judgement.
Trading foreign currencies can be a challenging and potentially profitable opportunity for investors. However, before deciding to participate in the forex market, you should carefully consider your investment objectives, level of experience, and risk appetite. Most importantly, do not invest money you cannot afford to lose.
There is considerable exposure to risk in any foreign exchange transaction. Any transaction involving currencies involves risks including, but not limited to, the potential for changing political and/or economic conditions that may substantially affect the price or liquidity of a currency, investments in foreign exchange speculation may also be susceptible to sharp rises and falls as the relevant market values fluctuate.
The leveraged nature of forex trading means that any market movement will have an equally proportional effect on your deposited funds. This may work against you as well as for you. Not only may investors get back less than they invested, but in the case of higher risk strategies, investors may lose the entirety of their investment. It is for this reason that when speculating in such markets it is advisable to use only risk capital.
Trading foreign exchange on margin carries a high level of risk, and may not be suitable for all investors. Past performance is not indicative of future results. The possibility exists that you could sustain a loss of some or all of your initial investment and therefore you should not invest money that you cannot afford to lose. You should be aware of all the risks associated with foreign exchange trading, and seek advice from an independent financial advisor if you have any doubts.

Bullish Engulfing Backtest This is a bullish reversal pattern formed by two candlesticks. Following a downtrend,
the first candlestick is a down candlestick which is followed by an up candlestick
which has a long real body that engulfs or contains the real body of the prior bar.
The Engulfing pattern is the reverse of the Harami pattern.
WARNING:
- For purpose educate only
- This script to change bars colors.

Intra Bullish Strategy - Profit Ping v4.0ProfitPing 4.0 is a high-precision intraday swing trading strategy designed for global equity markets, including the US, South Africa, and Australia. The system identifies high-probability BUY and EXIT signals using a confluence of technical indicators and real-time volume dynamics.
🧠 Key Features:
Dual EMA Crossover (7 & 14) for short-term trend confirmation
Volume Spike Detection based on 20-period moving average
RSI Momentum Filter (ideal zone: 55–65) to avoid overbought entries
MACD Histogram & Signal Line Sync for trend momentum validation
Candlestick Pattern Filtering (e.g. bullish engulfing, flags, breakout candles)
Multi-Timeframe Confirmation (optional) for intraday trend alignment
Dynamic Risk-to-Reward Logic built into alert framework
Webhook-compatible JSON alerts for automation to Google Sheets, Power BI, and IBKR
🛠️ Alert System:
BUY alert triggers when all bullish conditions align
EXIT alert triggers only if a previous BUY exists for that ticker
Trade status is updated live in Google Sheets and integrated with Power BI dashboards
Orphaned EXITs (no matched BUY) are tracked separately for accuracy review
🔄 Ideal For:
Traders seeking 1:2 to 1:5 risk/reward setups
Automation-focused workflows (via TradingView → Google Sheets → Power BI)
Swing traders wanting clean visual logs, automated P&L tracking, and optional IBKR execution

Liquidity + Internal Market Shift StrategyLiquidity + Internal Market Shift Strategy
This strategy combines liquidity zone analysis with the internal market structure, aiming to identify high-probability entry points. It uses key liquidity levels (local highs and lows) to track the price's interaction with significant market levels and then employs internal market shifts to trigger trades.
Key Features:
Internal Shift Logic: Instead of relying on traditional candlestick patterns like engulfing candles, this strategy utilizes internal market shifts. A bullish shift occurs when the price breaks previous bearish levels, and a bearish shift happens when the price breaks previous bullish levels, indicating a change in market direction.
Liquidity Zones: The strategy dynamically identifies key liquidity zones (local highs and lows) to detect potential reversal points and prevent trades in weak market conditions.
Mode Options: You can choose to run the strategy in "Both," "Bullish Only," or "Bearish Only" modes, allowing for flexibility based on market conditions.
Stop-Loss and Take-Profit: Customizable stop-loss and take-profit levels are integrated to manage risk and lock in profits.
Time Range Control: You can specify the time range for trading, ensuring the strategy only operates during the desired period.
This strategy is ideal for traders who want to combine liquidity analysis with internal structure shifts for precise market entries and exits.
This description clearly outlines the strategy's logic, the flexibility it provides, and how it works. You can adjust it further to match your personal trading style or preferences!

TMA StrategyThe **TMA Strategy** is a trend-following strategy that leverages **Smoothed Moving Averages (SMMA)** and **candlestick patterns** to identify high-probability trading opportunities. It is designed for traders who want to capture strong trends while minimizing noise from short-term fluctuations.
**Key Features:**
✔ **Multiple Smoothed Moving Averages (SMMA):** Uses 21, 50, 100, and 200-period SMMAs to identify market trends and key support/resistance zones.
✔ **Candlestick Pattern Confirmation:** Incorporates **3-line strike** and **engulfing candle** patterns to confirm trade entries.
✔ **Dynamic Trend Filter:** A **2-period EMA** ensures that trades align with the dominant trend, reducing false signals.
✔ **Customizable Session Filter:** Allows users to enable/disable trading within specific market sessions (New York, London, Tokyo, etc.), ensuring trades are executed only during high-liquidity hours.
✔ **Risk Management:** Uses predefined exit conditions based on EMA/SMMA crossovers to lock in profits and minimize losses.
**Trading Logic:**
📌 **Long Entry:**
- Bullish Engulfing or 3-Line Strike pattern appears.
- Price is above the 200 SMMA.
- 2 EMA confirms an uptrend.
- Trade executes if session filter allows.
📌 **Short Entry:**
- Bearish Engulfing or 3-Line Strike pattern appears.
- Price is below the 200 SMMA.
- 2 EMA confirms a downtrend.
- Trade executes if session filter allows.
📌 **Exit Conditions:**
- Long trades exit when EMA(2) crosses **below** SMMA(200).
- Short trades exit when EMA(2) crosses **above** SMMA(200).
**Ideal Markets & Timeframes:**
✅ Best suited for **Forex, Stocks, and Crypto** markets.
✅ Works well on **higher timeframes (15m, 1H, 4H, Daily)** for stronger trend confirmation.
📢 **Disclaimer:**
This strategy is for educational purposes only. Backtest results do not guarantee future performance. Always use proper risk management and test in a demo account before live trading.
🚀 **Try the TMA Strategy now and enhance your trend-following approach!**

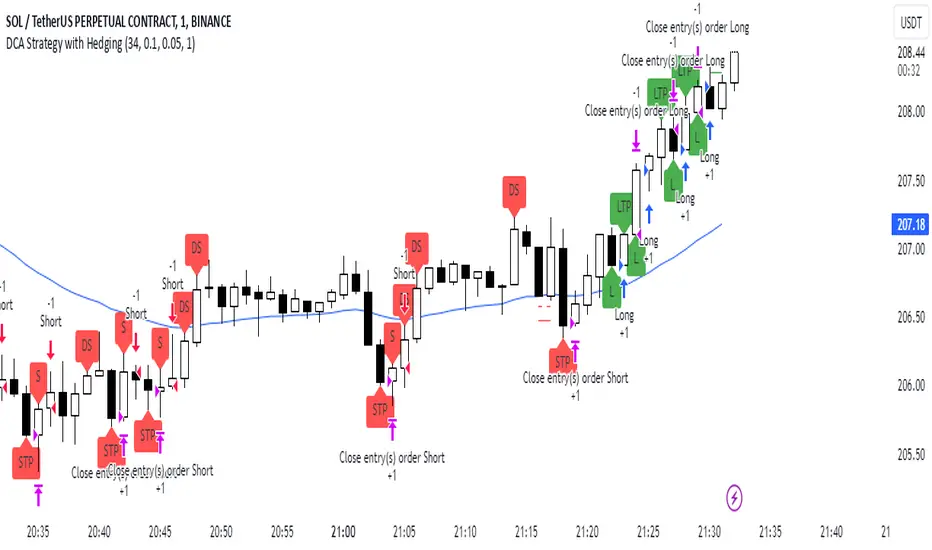
DCA Strategy with HedgingThis strategy implements a dynamic hedging system with Dollar-Cost Averaging (DCA) based on the 34 EMA. It can hold simultaneous long and short positions, making it suitable for ranging and trending markets.
Key Features:
Uses 34 EMA as baseline indicator
Implements hedging with simultaneous long/short positions
Dynamic DCA for position management
Automatic take-profit adjustments
Entry confirmation using 3-candle rule
How it Works
Long Entries:
Opens when price closes above 34 EMA for 3 candles
Adds positions every 0.1% price drop
Takes profit at 0.05% above average entry
Short Entries:
Opens when price closes below 34 EMA for 3 candles
Adds positions every 0.1% price rise
Takes profit at 0.05% below average entry
Settings
EMA Length: Controls the EMA period (default: 34)
DCA Interval: Price movement needed for additional entries (default: 0.1%)
Take Profit: Profit target from average entry (default: 0.05%)
Initial Position: Starting position size (default: 1.0)
Indicators
L: Long Entry
DL: Long DCA
S: Short Entry
DS: Short DCA
LTP: Long Take Profit
STP: Short Take Profit
Alerts
Compatible with all standard TradingView alerts:
Position Opens (Long/Short)
DCA Entries
Take Profit Hits
Note: This strategy works best on lower timeframes with high liquidity pairs. Adjust parameters based on asset volatility.
Indian NIFTY Correlation Daytrade/Swing StrategyINTRODUCTION :
This is a daytrading/swing strategy designed mainly for indian market where internally has been adapted to NIFTY market and as well using for internal calculations the values of the candles from NIFTY asset.
With it we search to use with the most correlated asset from the indian market.
For this example I choosed BANKNIFTY
STRATEGY:
The strategy initially uses as candle values the data from the NIFTY asset.
With them I am dividing the work into two calculation parts such as :
-For first part logic, I am doing calculations regarding the volatility of NIFTY, where I initially take into consideration INDIAVIX to have an idea of the expected implied volatility of NIFTY asset and then I compare it with different tools such as ATR, BB and Percentile location of the volatility.
Based on all these factors I take into account the location of the volatility which is atm and if there is a possibility of a strong movement(trend) or sidemarket situation.
-Once I am done with the values of the volatility, the next process in the script logic is to start looking into the trend.
For it I am using different tools such as volume checker, support and resistence key points, pivot points, price actions patterns and different moving averages.
-Risk management part : once we are done with calculation for the entry, the next part is to have an idea where to exit. In this case I am making use of a dynamic risk management which is compressed from multiple ideas such as : we can exit if there were a big gap on the next day in our initial direction, we can also exit based of an internal daily ATR calculation value(we use initially 15min timeframe chart) and lastly if we are around some key points like support/resistence or other different chart patterns like double top, double bot and so on.
CASE EXAMPLE:
As I said before we are initially using for calculation the NIFTY chart with 15min timeframe. With it we can apply to any indian etf,stocks,future. All the assets are going to have the same time of entry and the same time of exit(we get this from NIFTY) and we plot it on the chart we are using, so its key point to look for assets which have a min 75-80% correlation with NIFTY. For this example I used BANKNIFTY chart.
So a type of entry would be this way
Lets assume NIFTY50 is on 19.000 level
INDIAVIX level is currently at 11 which can be translated : 11 / sqrt(250)
So 11 means that on a yearly base we expect the asset to move 11% upwards or downwards
and in a year we have aprox 250 days. So we divide the 11 by sqrt of 250 to get an idea of a daily expected move from the implied volatility of india VIX
11/15.87 = +-0.69%
So INDIAVIX tells us that the values for today nifty is 19000+0,69% and 19000-0.69%
After that I am looking into the daily ATR, and I see that the expected is around 0.8% and is ascending over the last 2 weeks.
Lastly I am looking at the percentile which is currently the volatility on both ATR and INDIAVIX, and I get a value of 90th percentile.
With this my biased is that we are going to expect a short trend, but i cant confirm on the volatility alone so next step is start looking into technical analysis.
I look at volume and is increasing, I look at different price actions paterns and pivots and I see a lower low and a lower high (a descending pattern).
I also see the price is below the key MA like SMA50/100/200, VWAP and so on.
With all of this I get more confirmation that the asset is in a short trend.
Internally once a certain specific % of confirmation from all the logics is achieved, it will trigger a long/short entry, so in this case lets assume we have 80% of our indicators pointing to the short, is going to enter a short.
Now for a long scenario the scene would be , indiavix is around 9,5, ATR is descending. We are around 40th percentile of the volatility.
Our asset is above multiple moving averages, vwap , etc
We have an increasing volume towards bullish side.
And so on( overall 75% of our indicators are pointing towards the long side)
Now for the exit, since we are dealing with a daytrade/swing mentality, short on average we keep the trade open for a less period of time than long ( 19 bars of 15min candles, compared to 57 bars of 15min for long) , so most of the times for short we are going to exit next day and if the trend is still in our favour we re enter the trade.
For long we can stay much more time, sometimes even weeks and we exit mainly when the % of confirmation of indicators point out a reversal/short confirmation fo a big pice action pattern.
STRATEGY RESULTS
For strategy analysis I have used BANKNIFTY NSE with deep history to get access to data from 2011 until present( giving more than 2500 trades) .
For inputs I am using 0.02% comission total ( the comission applied from ZERODHA indian exchange is close to 0.0175% total) so I used it a bit higher in order to take into account some slippages.
For capital THE REASON I USED 100% of the capital allocation is to make a proper comparison with the buy an hold from the same period
Lets assume we had an account of 1M ruppes initially in 2011, we start using 100% of it and then the new values automatically compounded with the new profits and losses so directly compare with 1M of rupees in shares on BANKNIFTY ETFs bought in 2011(buy n hold) until present day.
STRATEGY ACCESS
Strategy is free to be tested for everyone, just let me know in private that you wish to get access to it.

TENKAN SCALPER STRATEGYTENKAN SCALP is a fully automatic trading system.
It is a continuation of our previous ichimoku release. This time however we throw out the rule book and use ICHIMOKU in a very different way.
It applies non traditional money management tactics.
While most trading strategies rely on a stop loss and a take profit target to manage risk. This strategy uses either no stop loss at all or a time based stop loss.
You might ask yourself the question why would you keep a trade open if it goes against you? Here are a phew reasons why the script does what it does.
Forex Markets consolidate most of the time. If you wait long enough your Take Profit will get hit anyways most of the time
You don't have to risk everything per trade. I keep my orders small so to keep some powder to get into some more trades
All the extra trades you take while one trade is in drawdown limit the drawdown as they provide cashflow
On lower timeframes the markets are so chaotic that a stop loss is very likely to get hit by a wick
About backtest below
This backtest uses a spread of 2 pips for entries and a default position size of 100% of equity. This is only possible on exchanges where spread is low and you have 10:1 leverage or more. It does not represent results obtainable without leverage. Do take into account that there are a lot of forex exchanges that provide this leverage, however a 2 pip spread is not always guaranteed and only applies to major pairs.
This backtest does not use the TIME BASED STOPS functionality.
Always start with small position sizing and see how the strategy performs before adding risk.
Explanation of variables:
Chikou(lagging span): pink line, this is price plotted 26 bars ago. People ignore the power of this it is crucial to see how chikou behaves towards past price action as seen in the chart below where we got an entry at red arrow because chikou bounced from past fractal bottom.
Kijun-Sen(base line): Black line or color coded line. This is the equilibrium of last 26 candles. To me this is the most important line in the system as it attracts price.
Kijun = (Highest high of 26 periods + Lowest low of 26 periods) ÷ 2
Tenkan-Sen(conversion line): Blue line. This is the equilibrium of last 9 candles. In a strong uptrend price stays above this line.
Tenkan = (Highest high of 9 periods + Lowest low of 9 periods) ÷ 2
Senkou A (Leading span A)= Pink cloud line, this is the average of the 2 components projected 26 bars in the future.
Senkou A = (Tenkan + Kijun) ÷ 2
Senkou B (Leading span B) = Green cloud line, this is the 52 day equilibrium projected 26 bars in the future.
Senkou B = (Highest high of prior 52 periods + Lowest low of prior 52 periods) ÷ 2
projection: Script uses same function for variable calculation and substracts a number on each next bar as to make a projection of where the variable will be in future bars if price stayed the same. This works as ICHIMOKU calculations use the middle point of a past set of data. The shorter that amount of bars will be in line with the data that it will be restricted to in future if price stayed the same.
Detection of Market Environment
To enter trades the script uses a lot of ICHIMOKU concepts. Contrary to how most people trade ICHIMOKU this script takes an environment that ICHIMOKU identifies as trending upwards and shorts in that environment. The same will be applied to a downtrend where it will open LONGS.
List of CRITERIA for a trend:
Grapling Hook: this is a component based on the chikou span (closing price displaced 26 bars into the past). The script will use an ATR based range to define a possible future projection to the CHIKOU line. For a market to be bullish there should be no price action happening within this area. Market is free to move upwards. Vice versa for bearish .
Kumo Cloud: script will check if price is above the cloud for bullish trend and below cloud for bearish trend .
Chikou above Kijun: script will check if the chikou line is above the KIJUN line of 26 bars ago. This is further confirmation that price is trending high enough compared to it's past data. Vice versa for downtrend.
Kijun projection: script will check if past Kijun is lower than future projected Kijun. This to ensure we get an equilibrium in our favour in the future. Vice versa for downtrend
Tenkan projection: script will check if future Tenkan-sen will be higher than Kijun-sen for an uptrend. Vice versa for downtrend.
Cloud projection: script will check if in 9 bars the Senkou Span A will be higher than Senkou Span B for an uptrend. Vice versa for downtrend.
Example:
This script does not visualise the prediction lines like I show in the example. I show them here to clarify how the script works.
Usage
Backtests are not indicative of future results, although a trader may want to use a strategy script to have a deeper understanding of how their strategy responds to varying market conditions, or as a tool for identifying possible flaws for a strategy that may be indicative of good or bad performance in the future.
Strategy Settings:
Minimum Body Size (atr): this is the minimum ATR a signal bar needs to be for entry. This is useful because our TP is based on previous bar.
Lot size per trade: this setting does not impact backtest. It is used to for the signals to let tradingconnect.com know your position size.
Direction: do you want to trade longs or shorts. I personally use both a long bot and a short bot at the same time.
Positions Allowed: the amount of positions the script will keep open as a maximum. You do not want to open too many positions, this is for risk management.
Close all positions at drawdown: if total open positions loss gets to this % target it will close all positions.
MetaTrader Prefix: when the script sends a signal it will put this text right before the symbol name from syminfo.ticker
MetaTrader Suffix: when the script sends a signal it will put this text right after the symbol name from syminfo.ticker
Charts below are some examples on how the script handles orders on default settings:
without time based SL
with time based SL
how it handles pyramiding
www.tradingview.com
Tradingconnector.com:
For full automation of the forex market the script uses this connector to execute trade on MT4. The alerts the script sends using the alerts() function call are structured in a way tradingconnector will recognise and send directly to MT4. You can find documentation about this tool on their own website.
Personal recommendation is to start with a minimum lot size and track performance, if you are comfortable scale the size up. You can do that by increasing the lot size setting in the script and making a new alert. Make sure to delete the old one.
How to access
You can see the Author's Instructions below to visit our telegram to get more information on how to get access.

Trend Follower Intraday [ Adjustable TF ]Trend Follower Intraday for 3 minute Time-Frame (Adjustable) , that has the time condition for Indian Markets as well.
Unlike the Free Scripts - Risk Management , Position Sizing , Partial Exit etc. are also included .
Send us a Message to know more about the strategy.
// ══════════════════════════════════════════════════════════════════════════ //
The Timing can be changed to fit other markets, scroll down to "TIME CONDITION" to know more.
The commission is also included in the strategy .
The basic idea is when ,
1) EMA1 crosses above EMA2 , is a Long condition .
2) EMA1 crosses below EMA2 , is a Short condition .
3) Green Section indicates Long position.
4) Red Section indicates Short position.
5) Allowed hours specifies the trade entry timing.
6) ATR STOP is the stop-loss value on chart , can be adjusted in INPUTS.
7) Target 1 is the 1st target value on chart , can be adjusted in INPUTS.
8) RISK is Maximum Risk per trade for the intraday trade can be changed .
9) Total Capital used can be adjusted under INPUTS.
10) ATR TRAIL is used for trailing after entry, as mentioned in the inputs below.
11) Check trades under the list of trades .
12) Trade only in liquid stocks .
13) Risk only 1-5% of total capital.
14) Inputs can be changed for better back-test results, but also manually check the trades before setting alerts
15) SQUARE OFF TIME - As you change the time frame , also change the square-off time to the candle's closing time.
Eg: For 3min Time-frame , Hour = 2Hrs | Minute = 57min
16) Strategy stops for the day if you have a loss .
17) COMMISSION value is set to 20Rs and SLIPPAGE value is set to 2 . Go to properties to change it .
*The input values and the results are mentioned under "BACKTEST RESULTS" below*
// ══════════════════════════════ //
// ————————> RISK MANAGEMENT <——————— //
// ══════════════════════════════ //
Risk management is done based on max loss per trade and can be adjusted in the INPUTS.
// ═══════════════════════════ //
// ————————> POSITION SIZE <——————— //
// ═══════════════════════════ //
Quantity of each trade is different based on the loss
// ═════════════════════════ //
// ————————> PROPERTIES <——————— //
// ═════════════════════════ //
COMMISSION , SLIPPAGE ,RECALCULATE is already mentioned in the code.
COMMISSION can be charges , based on the broker charges.
// ═══════════════════════════════//
// ————————> TIME CONDITION <————————— //
// ═══════════════════════════════//
The time can be changed in the INPUT.
The Indian Markets open at 9:15am and closes at 3:30pm.
The 'Allowed hours' under Inputs specifies the time at which Entries should happen .
"Close All" function closes all the trades before 3pm , at the open of the next candle.
To change the time to close all trades , check INPUT.
All open trades get closed by 3pm , because some brokers don't allow you to place fresh intraday orders after 3pm .
// ═══════════════════════════════════════════════ //
// ————————> BACKTEST RESULTS ( 123 CLOSED TRADES ) <————————— //
// ═══════════════════════════════════════════════ //
INPUTS can be changed for better Back-Test results.
The strategy applied to NSE:JSWENERGY (3 min Time-Frame and with a capital of 3,00,000 ) gives us 81% profitability , as shown below
It was tested for a period a 6 months with a Profit Factor of 1.957 ,net Profit of 43,000Rs .
Sharpe Ratio = 0.745
Sortino Ratio = 2.091
No strategy in the world promises 100% profits in all market conditions , so always define your risk before trading.
Also check Back-Test results manually ,before setting Alerts
The Graph has a Linear Curve with Consistent Profits.
The INPUTS are as follows,
1) EMA1 ————————————————> 38
2) EMA2 ————————————————> 118
3) ALLOWED HRS ———————————> 9:35 TO 14:30
4) ATR STOP ——————————————> 3.2
5) RISK ——————————————————> 3000
6) ATR TRAIL ———————————————> 2.6
7) TARGET 1 ————————————————> 2.4
8) MAX POSITION VALUE ——————————> 3,00,000
8) MAX DRAWDOWN —————————————> 9,000
8) SQUARE-OFF ————————————————> 14:57
NSE:JSWENERGY
Apply it to your charts Now !
NSE:JSWENERGY
Send us a message for FREE TRIALS | Instant Access
Thank You ☺

open>open[1]=BUY_else_SELLsimple script. enter rule is open>open =BUY_else_SELL (open means open price 1 candle ago, so basically its if price now greater than price 1 candle ago...)
exit rule is Trailing Stop.
1 trade per candle, here on daily chart BTCUSDT with binance commision included in result.
254 million percent profit....
😲