GM+For a Short Trade:
When a bullish candle (close > open) is larger than the previous candle and the MACD histogram for the past three bars is consecutively lower (suggesting weakening upward momentum), the script enters a short position.
For a Long Trade:
When a bearish candle (close < open) is larger (in body size) than the previous candle and the MACD histogram for the past three bars is consecutively higher (suggesting the downward move is losing strength), the script enters a long position.
Position Management:
There are no stop loss or take profit levels. The position is closed only when an opposite signal appears.
Search in scripts for "candle"

Flux Charts - PAT Automation💎 GENERAL OVERVIEW
The PAT Automation is a powerful and versatile tool designed to help traders rigorously test their trading strategies against historical market data. With an array of advanced settings, traders can fine-tune their strategies, assess performance, and identify key improvements before deploying in live trading environments. This backtester offers a wide range of configurable settings, explained within this write-up.
Features of the PAT Automation:
Step By Step : Configure your strategy step by step, which will allow you to have OR & AND logic in your strategies.
Highly Configurable : Offers multiple parameters for fine-tuning trade entry and exit conditions.
Multi-Timeframe Analysis : Allows traders to analyze multiple timeframes simultaneously for enhanced accuracy.
Provides advanced stop-loss, take-profit, and break-even settings.
Incorporates volume-based conditions, liquidity grabs , order blocks , market structures and fair value gaps for refined strategy execution.
🚩 UNIQUENESS
The PAT Automation stands out from conventional backtesting tools due to its unparalleled flexibility, precision, and advanced trading logic integration. Key factors that make it unique include:
✅ Comprehensive Strategy Customization – Unlike traditional backtesters that offer basic entry and exit conditions, PAT Automation provides a highly detailed parameter set, allowing traders to fine-tune their strategies with precision.
✅ Multi-Timeframe Price Action Features – This is the first-ever tool that allows traders to backtest price action with multi-timeframe features such as Fair Value Gaps (FVGs), Inversion Fair Value Gaps (IFVGs), Order Blocks & Breaker Blocks.
✅ Customizable Take-Profit Conditions – Offers various methods to set take-profit exits, including using core features from price action, and fixed exits like ATR, % change or price change, enabling traders to tailor their exit strategies to specific market behaviors.
✅ Customizable Stop-Loss Conditions – Provides several ways to set up stop losses, including using concepts from price action and trailing stops or fixed exits like ATR, % change or price change, allowing for dynamic risk management tailored to individual strategies.
✅ Integration of External Indicators – Allows the inclusion of other indicators or data sources from TradingView for creating strategy conditions, enabling traders to enhance their strategies with additional insights and data points.
By integrating these advanced features, PAT Automation ensures that traders can rigorously test and optimize their strategies with great accuracy and efficiency.
📌 HOW DOES IT WORK?
The first setting you will want to set it the pyramiding setting. This setting controls the number of simultaneous trades in the same direction allowed in the strategy. For example, if you set it to 1, only one trade can be active in any time, and the second trade will not be entered unless the first one is exited. If it is set to 2, the script will handle both of them at the same time. Note that you should enter the same value to this pyramiding setting, and the pyramiding setting in the "Properties" tab of the script for this to work.
For deep backtesting, you can set "Max Distance To Last Bar" to "Unlimited". If you encounter any memory issues, try decreasing this setting to a lower value.
You can enable and set a backtesting window that will limit the entries to between the start date & end date.
Then, you can enter your desired settings to Price Action features like FVGs, IFVGs, Order Blocks, Breaker Blocks, Liquidity Grabs, Market Structures, EQH & EQL and Volume Imbalances. You can also enable and set up to 3 timeframes, which you can use later on when customizing your strategies enter / exit conditions.
Entry Conditions
From the "Long Conditions" or the "Short Conditions" groups, you can set your position entry conditions. For settings like "initial capital" or "order size", you can open the "Properties" tab, where these are handled.
The PAT Automation can use the following conditions for entry conditions :
1. Order Block (OB)
Detection: Triggered when an Order Block forms or is detected
Retest: Triggered when price retests an Order Block. A retest is confirmed when a candle enters an Order Block and closes outside of it.
Retracement: Triggered when price touches an Order Block
Break: Triggered when an Order Block is invalidated by candle close or wick, depending on the user's input.
2. Breaker Block (BB)
Detection: Triggered when a Breaker Block forms or is detected
Retest: Triggered when price retests a Breaker Block. A retest is confirmed when a candle enters a Breaker Block and closes outside of it.
Retracement: Triggered when price touches a Breaker Block
Break: Triggered when a Breaker Block is invalidated by candle close or wick, depending on the user's input.
3. Fair Value Gap (FVG)
Detection: Triggered when an FVG forms or is detected
Retest: Triggered when price retests an FVG. A retest is confirmed when a candle enters an FVG and closes outside of it.
Retracement: Triggered when price touches an FVG
Break: Triggered when an FVG is invalidated by candle close or wick, depending on the user's input.
4. Inversion Fair Value Gap (IFVG)
Detection: Triggered when an IFVG forms or is detected
Retest: Triggered when price retests an IFVG. A retest is confirmed when a candle enters an IFVG and closes outside of it.
Retracement: Triggered when price touches an IFVG
Break: Triggered when an IFVG is invalidated by candle close or wick, depending on the user's input.
5. Break of Structure (BOS)
Detection: Triggered when a BOS forms or is detected
6. Change of Character (CHoCH)
Detection: Triggered when a CHoCH forms or is detected
7. Change of Character Plus (CHoCH+)
Detection: Triggered when a CHoCH+ forms or is detected
8. Volume Imbalance (VI)
Detection: Triggered when a Volume Imbalance forms or is detected
9. Equal High (EQH)
Detection: Triggered when an EQH is detected
10. Equal Low (EQL)
Detection: Triggered when an EQL is detected
11. Buyside Liquidity Grab
Detection: Triggered when a liquidity grab occurs at Buyside Liquidity (BSL).
12. Sellside Liquidity Grab
Detection: Triggered when a liquidity grab occurs at Sellside Liquidity (SSL).
🕒 TIMEFRAME CONDITIONS
The PAT Automation supports Multi-Timeframe (MTF) features, just like the Price Action Toolkit. When setting an entry condition, you can also choose the timeframe.
To set up MTF conditions, navigate to the 'Timeframes' section in the settings, select your desired timeframes, and enable them. You can choose up to three timeframes.
Once you've selected your timeframes, you can use them in your strategy. When setting long and short entry / exit conditions, you can choose from Timeframe 1, Timeframe 2, or Timeframe 3.
External Conditions
Users can use external indicators on the chart to set entry conditions.
The second dropdown in the external condition settings allows you to choose a conditional operator to compare external outputs. Available options include:
Less Than or Equal To: <=
Less Than: <
Equal To: =
Greater Than: >
Greater Than or Equal To: >=
The position entry conditions work like this ;
Each side has 5 Price Action conditions and 1 Source condition. Each condition can be enabled or disabled using the checkbox on the left side.
For Price Action Conditions, you can set a direction: "Any", "Bullish" or "Bearish".
Then a Price Action Feature, like "FVG" or "Order Block".
The last part of our constructed condition is the alert type, which you can select between "Detection", "Retest", "Retracement" or "Break".
Now you should have a constructed condition, which should look like "Bullish Order Block Retest".
You can select which timeframe should this condition work on from Timeframe 1, 2 or 3. If you select "Any Timeframe", the condition will work for all timeframes.
Lastly select the step of this condition from 1 to 6.
The Source Condition
The last condition on each side is a source condition that is different from the others. Using this condition, you can create your own logic using other indicators' outputs on your chart. For example, suppose that you have an EMA indicator in your chart. You can have the source condition to something like "EMA > high".
The Step System
Each condition has a step number, and conditions are in topological order based on them.
The conditions are executed step by step. This means the condition with step 2 cannot be executed before the condition with step 1 is executed.
Conditions with the same step numbers have "OR" logic. This means that if you have 2 conditions with step 3, the condition with step 4 can trigger after only one of the step 3 conditions is executed.
➕ OTHER ENTRY FEATURES
The PAT Automation allows traders to choose when to execute trades and when not to execute trades.
1. Only Take Trades
This setting lets users specify the time period when their strategy can open or execute trades.
2. Don't Take Trades
This setting lets users specify time periods when their strategy can't open or execute trades.
↩️ EXIT CONDITIONS
1. Exit on Opposite Signal
When enabled, a long position will close when short entry conditions are met, and a short position will close when long entry conditions are met.
2. Exit on Session End
When enabled, positions will be closed at the end of the trading session.
📈 TAKE PROFIT CONDITIONS
There are several methods available for setting take profit exits and conditions.
1. Entry Condition TP
Users can use entry conditions as triggers for take-profit exits. This setting can be found under the long and short exit conditions.
2. Fixed TP
Users can set a fixed TP for exits. This setting can be found under the long and short exit conditions. Users can choose between the following:
Price: This method triggers a TP exit when price reaches a specified level. For example, if you set the Price TP to 10 and buy NASDAQ:TSLA at $190, the trade will automatically exit when the price reaches $200 ($190 + $10).
Ticks: This method triggers a TP exit when price moves a specified number of ticks.
Percentage (%): This method triggers a TP exit when price moves a specified percentage.
ATR: This method triggers a TP exit based on a specified multiple of the Average True Range (ATR).
📉 STOP LOSS CONDITIONS
There are several methods available for setting stop-loss exits and conditions.
1. Entry Condition SL
Users can use entry conditions as triggers for stop-loss exits. This setting can be found under the long and short exit conditions.
2. Fixed SL
Users can set a fixed SL for exits. This setting can be found under the long and short exit conditions. Users can choose between the following:
Price: This method triggers a SL exit when price reaches a specified level. For example, if you set the Price SL to 10 and buy NASDAQ:TSLA at $200, the trade will automatically exit when the price reaches $190 ($200 - $10).
Ticks: This method triggers a SL exit when price moves a specified number of ticks.
Percentage (%): This method triggers a SL exit when price moves a specified percentage.
ATR: This method triggers a SL exit based on a specified multiple of the Average True Range (ATR).
3. Trailing Stop
An explanation & example for the trailing stop feature is present on the write-up within the next section.
Exit conditions have the same logic of constructing conditions like the entry ones. You can construct a Take-Profit Condition & a Stop-Loss Condition. Note that the Take-Profit condition will only work if the position is in profit, regardless of if it's triggered or not. The same applies for the Stop-Loss condition, meaning that it will only work if the position is in loss.
You can also set a Fixed TP & Fixed SL based on the price movement after the position is entered. You have options like "Price", "Ticks", "%", or "Average True Range". For example, you can set a Fixed TP like "5%", and the position will be entered once it moves 5% up in a long position.
Trailing Stop
For the Fixed SL, you also have a "Trailing" stop option, which you can set it's activation level as well. The Trailing stop activation level and it's value are expressed in ticks. Check this scenerio for an example :
We have a ticker with a tick value of $1. Our Trailing Stop is set to 10 ticks and activation level is set to 30 ticks.
We buy 1 contract when the price is $100.
When the price becomes $110, we are in $10 (10 ticks) profit and the trailing stop is now activated.
The current price our stop's on is $110 - $30 (30 ticks), which is the level of $80.
The trailing stop will only move if the price moves up the highest high the price has been after we entered the position.
Let's suppose that price moves up $40 right after our trailing stop is activated. The price will now be $150, and our trailing stop will sit on $150 - $30 (30 ticks) = $120.
If the price is down the $120 level, our stop loss will be triggered.
There is also a "Hard SL" option designed for a backup stop-loss when trailing stops are enabled. You can enable & set this option and if the price goes down before our trailing stop even activates, the position will be exited.
You can also move stop-loss to the break-even (entry price of the position) after a certain profit is achieved using the last setting of the exit conditions. Note that for this to work, you will need to have a Fixed SL set-up.
➕ OTHER EXIT FEATURES
1. Move Stop Loss to Breakeven
This setting allows the strategy to automatically move the SL to Breakeven (BE) when the position is in profit by a certain amount. Users can choose between the following:
Price: This method moves the SL to BE when price reaches a specified level.
Ticks: This method moves the SL to BE when price moves a specified number of ticks.
Percentage (%): This method moves the SL to BE when price moves a specified percentage.
ATR: This method moves the SL to BE when price moves a specified multiple of the Average True Range (ATR).
Example Entry Scenario
To give an example , check this scenario; out conditions are :
LONG CONDITIONS
Bullish Order Block Detection, Step 1
Bullish CHoCH Detection, Step 2
Bullish Volume Imbalance Detection, Step 2
Bullish IFVG Retest, Step 3
First, the strategy needs to detect a Bullish Order Block in order to start working.
After it's detected, now it's looking for either a CHoCH, or a Volume Imbalance to proceed to the next step, the reason for this is that they both have the same step number.
After one of them is detected, the strategy will consistently check all IFVGs for a retest. If the retest occurs, a long position will be entered.
⏰ ALERTS
This indicator uses TradingView's strategy alert system. All entries and exits will be sent as an alert if configured. It's possible to further customize these alerts to your liking. For more information check TradingView's strategy alert customization page: www.tradingview.com
⚙️ SETTINGS
1. Backtesting Settings
Pyramiding: Controls the number of simultaneous trades allowed in the strategy. This setting must have the same value that is entered on the script's properties tab on the settings pane.
Max Distance to Last Bar: Determines the depth of historical data used to prevent memory overload.
Enable Custom Backtesting Period: Restricts backtesting to a specific date range.
Start & End Time Configuration: Define precise start and end dates for historical analysis.
2. Fair Value Gaps Settings
Zone Invalidation: Select between "Wick" and "Close" invalidation.
Filtering: Choose between "Average Range" and "Volume Threshold".
FVG Sensitivity: Ranges from Extreme to Low to detect FVGs with varying strictness.
Allow Gaps: Enables analysis on tickers that have different open-close price gaps.
3. Inversion Fair Value Gaps Settings
Zone Invalidation: Choose between "Wick" and "Close".
4. Order Block Settings
Swing Length: Adjusts the minimum number of bars required for OB formation.
Zone Invalidation Method: Select between "Wick" and "Close".
5. Breaker Block Settings
Zone Invalidation: Set invalidation method as "Wick" or "Close".
6. Liquidity Grabs Settings
Pivot Length: Adjusts the number of bars used to detect liquidity grabs.
Wick-Body Ratio: Defines the proportion of wick-to-body size for liquidity grab detection.
7. Multi-Timeframe Analysis
Enable Up to Three Timeframes: Select and analyze trades across multiple timeframes.
8. Market Structures
Swing Length: Defines the number of bars required for structure shifts.
Includes BOS, CHoCH, CHoCH+ Detection.
9. Equal Highs & Lows
ATR Multiplier: Defines the sensitivity of equal highs/lows detection.
10. Volume Imbalances
Gap Size Sensitivity: Ranges from "Ultra" to "Low".
Disable Overnight Gaps: Filters out volume imbalances occurring due to overnight gaps.
11. Entry Conditions for Long & Short Trades
Multiple Conditions (1-6): Configure up to six independent conditions per trade direction.
Condition Types: Options include Detection, Retest, Retracement, and Break.
Timeframe Specification: Choose between "Any Timeframe", "Timeframe 1", "Timeframe 2", or "Timeframe 3".
Trade Execution Filters: Restrict trades within specific trading sessions.
12. Exit Conditions for Long & Short Trades
Exit on Opposite Signal: Automatically exit trades upon opposite trade conditions.
Exit on Session End: Closes all positions at the end of the trading session.
Multiple Take-Profit (TP) and Stop-Loss (SL) Configurations:
TP/SL based on % move, ATR, Ticks, or Fixed Price.
Hard SL option for additional risk control.
Move SL to BE (Break Even) after a certain profit threshold.

VRS (Vegas Reversal Strategy)It is based on the reversal of the price after an accentuated volatility of the previous day. It is tested only on BTC, TF Day, and has an activation value equal to a spike of minimum 2.4% amplitude, a value that I have left in the settings free to be modified if it is found valid for other assets.
In the settings you can change how many of the latest longs or shorts I want to view in the past, colors and various aesthetics.
When the system detects a spike at the end of the day from 2.4% onwards it will signal the direction of Reversal, generating the 3 TP, dotted lines.
Entry into the market must be done at the close of the candle day, unfortunately at night time if you want to enter on the tick.
Stop above/below the spike that generated the condition.
If the Day2 candle closes FULL inside the spike, immediate and early closing of the operation.
There cannot be two consecutive Day events: if you are Long or Short and have taken a stop on the next candle, even if the latter generates another entry, this must not be activated.
TP 1 and 2 are both mandatory at 33% of the position, TP3, based on the current movement, can be considered to be left to run to the bitter end or in any case to structuring confirmations of a slowdown in the price.
Upon reaching TP1 it is mandatory to move the STOP to even.
In the event of the presence of extremely strong directional movements, for example Long direction, an opposite activation, Short, must be done but with reduced capital, on the contrary an activation in the same direction as the trend movement can be done with a surcharge. Always pay attention to Money Management and Risk Management.
Always manage Risk and Money Management in an adequate, technical and sustainable manner in relation to your capital. A fair exposure per transaction is between 1% and 2% of the capital.

FreedX Backtest Plus█ Our new FreedX Backtest PLUS template enhances TradingView backtesting with smart features like Mean Reversion, Flexible Volatility, Liquidation Filter, and Better Trend Filtering, making strategies more effective. It lets users set up automated alerts easily. This guide explains how to make the most of these improved features.
The Trading Date Settings feature in our TradingView script allows you to refine their backtesting parameters by specifying trading dates and hours. This feature enhances the accuracy of the backtest by aligning it with specific time frames and days, ensuring that the strategy is tested under relevant market conditions.
Features:
⚙️ Enable Trading Between Specific Dates:
🎯 Purpose:
→ Allows you to limit the backtesting of their strategy to a specific date range.
💡 How to Use:
→ Input the Start Date and End Date for the backtest period.
→ The script will execute the strategy only within this specified date range.
⚙️ Enable Trading Between Specific Hours:
🎯 Purpose:
→ Allows you to limit the backtesting of their strategy to a specific hour range.
💡 How to Use:
→ Input the start and end hour for in Trading Session section.
→ The script will execute the strategy only within this specified hour range.
⚙️ Enable Trading on Specified Days of the Week:
🎯 Purpose:
→ Gives you the option to conduct backtesting on selected days of the week, tailoring the strategy to particular market behaviours that may occur on these days.
💡 How to Use:
→ Select the days of the week for the backtest.
→ The script will activate the trading strategy only on these chosen days.
█ BUY/SELL TRIGGER SETTINGS
The Buy/Sell Trigger Settings feature is designed to provide users with flexibility in defining the conditions for 'LONG' and 'SHORT' signals based on various indicator types. This customization is crucial for tailoring strategies to different trading styles and market conditions.
Features:
⚙️ Single-Line Plotted Indicators :
🎯 Purpose:
→ Enables you to select a single-line plotted indicator as a source for backtesting. You can define specific levels to trigger 'LONG' or 'SHORT' signals.
💡 How to Use:
→ Choose a Single-Line Plotted indicator as the source.
→ Set the top and bottom levels for the indicator.
→ The script triggers 'LONG' signals at the bottom level and 'SHORT' signals at the top level.
⚙️ Two-Line Plotted Indicators :
🎯 Purpose:
→ Allows backtesting with two-line cross plot sources. Signals are generated based on the crossover of these lines.
💡 How to Use:
→ Select two lines as 'Source 1' and 'Source 2' for the indicator.
→ The script triggers a 'LONG' signal when 'Source 1' crosses above 'Source 2'.
→ Conversely, a 'SHORT' signal is triggered when 'Source 2' crosses above 'Source 1'.
⚙️ Custom Signals :
🎯 Purpose:
→ This setting enables users to define their own criteria for LONG, SHORT, and CLOSE signals based on custom indicator outputs.
💡 How to Use:
→ Select the custom source for your signals.
→ Define the output values that correspond to each signal type (e.g., “1” for 'LONG', “-1” for SHORT, and “0” for CLOSE).
→ The script will trigger signals according to these custom-defined values.
█ TP/SL SETTINGS
The TP/SL (Take Profit/Stop Loss) Settings feature is designed to give users control over their profit securing and risk mitigation strategies. This feature allows for setting custom TP and SL levels, which can be critical in managing trades effectively.
Features:
Custom TP/SL Levels for Long/Short Signals:
🎯 Purpose:
→ Enables users to set specific percentage levels for Take Profit and Stop Loss on long and short signals.
💡 How to Use:
→ In the TP/SL Settings, input the desired percentage for Take Profit (TP) and Stop Loss (SL).
→ For example, to secure a profit at a 10% price increase on LONG signals, set the “Long TP Percentage” to “10”.
█ STRATEGY SETTINGS
Strategy Settings provide a range of options to customize the trading strategy. These settings include leverage, position direction changes, and more, allowing users to tailor their strategy to their risk tolerance and market view.
Features:
⚙️ Enable Reverse Position:
🎯 Purpose:
→ Automatically closes a current position and opens a new one in the opposite direction upon detecting a signal for a market trend change.
🎯 Example:
→ If a LONG signal is received while in a SHORT position, the script will close the SHORT position and open a LONG position.
💡 How to Use:
→ Activate this feature in the Strategy Settings.
⚙️ Enable Spot Mode:
🎯 Purpose:
→ Disables short orders, using short signals only for closing long positions.
💡 How to Use:
→ Select the 'Spot Mode' option in the Strategy Settings.
⚙️ Enable Invert Signals:
🎯 Purpose:
→ Inverts all indicator signals, changing LONG signals to SHORT and vice versa.
💡 How to Use:
→ Opt for the 'Invert Signals' feature in the Strategy Settings.
⚙️ Enable Trailing Stop:
🎯 Purpose:
→ Triggers a trailing stop order on the exchange instead of a standard stop market order.
☢️ Caution:
→ The backtesting of this feature on TradingView may not accurately reflect actual strategy performance due to discrepancies between TradingView and exchange mechanisms.
💡 How to Use:
→ Select 'Trailing Stop' in the Strategy Settings.
⚙️ Enable Realistic TP & SL:
🎯 Purpose:
→ Goal is protect the user from unrealistic stop loss and take profit prices in live exchange trading conditions.
→ That feature continuously checks the take profit, stop loss and move stop loss prices to prevent unrealistic values. It changes their values according to (minimum realistic percent %)
💡 How to Use:
→ Select 'Enable Realistic TP & SL' in the Strategy Settings. Write min allowed percents.
█ LIMITER SETTINGS
Limiter Settings provide a range of options to customize the trading strategy. These settings include drawdown limits,contract limit, tradable ratio, for allowing users to tailor their strategy to their risk tolerance and market view.
⚙️ Leverage :
🎯 Purpose:
→ Allows users to apply leverage to their trades.
☢️ Caution:
→ High leverage can significantly increase the risk of liquidation.
→ High leverage and a high stop-loss price may override your fixed stoploss percentage, adjusting the stop-loss to the liquidation price.
💡 How to Use:
→ Set the desired leverage ratio in the Strategy Settings.
⚙️ Drawdown Limit:
🎯 Purpose:
→ Sets a maximum drawdown limit, automatically halting the strategy if this limit is reached, thereby controlling risk.
💡 How to Use:
→ Input the maximum drawdown limit (default: 100, min: 0, max: 100).
⚙️ Contract Limit:
🎯 Purpose:
→ Sets a maximum contract limit, beyond which the compound effect cannot be used. This is important to prevent market manipulation through large-volume orders.
💡 How to Use:
→ Input the maximum contract limit (min: 0).
⚙️ Tradable Ratio:
🎯 Purpose:
→ Sets a tradable ratio, it uses that ratio calculating entry cost for position. Main purpose is cash-out and cash-in according to balance change.
💡 How to Use:
→ Input the tradable ratio percent (default: 98, min: 0.1, max: 100).
█ CASH-OUT SETTINGS
Cash-Out Settings offer a money-saving mechanism that prevents entering positions with the entire balance due to cashed-out funds. It functions with a webhook alerts, but the 'Override Allocation %' option must be enabled.
⚙️ Cash-out Threshold %:
🎯 Purpose:
→ It is cash-out mechanism, it saves money with a target threshold.
💡 How to Use:
→ Input the threshold (min: 0).
⚙️ Cash-out Per Profitable Trades %:
🎯 Purpose:
→ It is cash-out mechanism, it saves money from every trade with a percent like commission.
💡 How to Use:
→ Input save percent% (min: 0).
█ ADAPTIVE VOLATILITY STRATEGY SETTINGS
Advanced Strategy Settings offer sophisticated methods for managing Stop Loss (SL) and Take Profit (TP) using the Average True Range (ATR). These settings are ideal for traders who want to incorporate volatility into their exit strategies.
Features:
⚙️ Enable ATR Stop Loss:
🎯 Purpose:
→ Automatically sets the Stop Loss price using the Average True Range at the time of entry.
💡 How to Use:
→ Activate 'ATR Stop Loss' to have the SL price calculated based on the current ATR.
⛓ Enable ATR Trailing Stop:
→ Dynamically updates the Stop Loss price with each new bar, according to the Average True Range.
→ Activate 'ATR Trailing Stop'.
→ Set the ATR Period to define the number of bars for ATR calculation.
→ Adjust the ATR SL Multiplier to determine the stop loss distance.
→ Modify the ATR TP Multiplier for setting the take profit distance.
⚙️ Enable ATR Take Profit:
🎯 Purpose:
→ Sets the Take Profit price based on the Average True Range at the time of entry.
💡 How to Use:
→ Choose 'ATR Take Profit' for TP price determination using ATR.
⚙️ Enable ATR Limit Entry:
🎯 Purpose:
→ Trade can not open in candle close price. Price should hit target price that based on average true range value.
💡 How to Use:
→ Choose 'ATR Limit Entry' for entry price determination using ATR.
⛓ Enable ATR Limit Entry Trailing Price:
→ Dynamically updates the entry price with each new bar, according to the Average True Range.
→ Activate 'ATR Limit Entry Trailing Price'.
→ Set the ATR Period to define the number of bars for ATR calculation.
→ Adjust the ATR SL Multiplier to determine the stop loss distance.
→ Modify the ATR TP Multiplier for setting the take profit distance.
█ TREND FILTERING SETTINGS
Trend Filtering Settings are designed to align trading strategies with the prevailing market trend, enhancing the precision of trade entries and exits. These settings utilize moving averages for trend analysis and decision-making.
Features:
⚙️ Enable Moving Average Filtering:
🎯 Purpose:
→ Limits trades based on moving average trends, blocking short trades in an uptrend and vice versa.
💡 How to Use:
→ Enable 'Trend Filtering'.
→ Set Fast and Slow MA Lengths for trend analysis.
→ Select the Timeframe for moving averages.
→ Choose the Moving Average Type for trend filtering.
🎯 Note:
→ Be cautious with timeframe selections; lower timeframes than the base may cause inconsistencies.
⛓ Exit on Trend Reversal:
→ Automatically closes a position when a market trend reversal is detected.
→ Turn on 'Exit on Trend Reversal' in the settings.
⛓ Ignore Counter Signals:
→ Ignores counter signals during trending market way.
→ If the trend way is long. All short signals will ignore and vice versa.
⛓ Enable Drawing On Chart:
→ Visually represents the trend filter directly on the chart for easy reference.
→ Activate 'Drawing On Chart' to see the trend filter overlaid on the trading chart.
⚙️ Enable Adx Filtering:
🎯 Purpose:
→ Limits trades based on adx value, blocking trades if trend strength is not enough or vice versa for invert mode.
💡 How to Use:
→ Enable 'Adx Filtering'.
→ Set Smoothing and Lengths for adx trend analysis.
→ Select level barrier for trend strength.
⚙️ Enable Custom Filtering:
🎯 Purpose:
→ Limits trades based on custom sources, blocking trades according to custom trades.
💡 How to Use:
→ Enable 'Custom Filtering'.
→ Select fast source.
→ Select slow source.
→ Enable lag mode.
█ MEAN REVERSION FILTERING SETTINGS
Mean Reversion Filtering Settings are designed to align trading strategies during accumulation market conditions. They set a distance from a line to permit trading. The purpose is to ensure that when the price strays too far from the mean line, it should revert back. In accumulation markets, price movements are generally horizontal. In such situations, mean reversion will operate like a grid, enabling profitable trades with low drawdown. However, when the market structure begins to trend, mean reversion filters may not be as profitable as in accumulation markets. For instance, let's say the price is rising and we are shorting the market until it reaches the mean price line. As the price goes up and the mean also rises, we will end up closing the position at a higher price, rendering the mean reversion system non-profitable. Therefore, consider this filter wisely; greater distances might work better in trending markets.
Features:
⚙️ Enable Kairi Filter:
🎯 Purpose:
→ Blocks trades based on distance percent between price and moving average.
💡 How to Use:
→ Enable 'Kairi Filter'.
→ Set Length and Distance Percent.
⛓ Enable Trend Drawing On Chart:
→ Visually represents the trend filter directly on the chart for easy reference.
→ Enable 'Drawing On Chart' to see the allowed regions overlaid on the trading chart with arrows.
⚙️ Enable VWAP Filter:
🎯 Purpose:
→ Blocks trades based on distance percent between price and volume weighted average price.
💡 How to Use:
→ Enable 'VWAP Filter'.
→ Set Timeframe as minutes and distance as percent.
⛓ Exit on Crossing with VWAP:
→ Automatically closes a position when the closing price of a candle crosses the VWAP.
→ Choose "Enable", 'Exit on Crossing with VWAP' in the settings.
⛓ Enable Drawing On Chart:
→ Visually represents the trend filter directly on the chart for easy reference.
→ Enable 'Drawing On Chart' to see the allowed regions overlaid on the trading chart with arrows.
█ LIQUIDATION FILTER SETTINGS
Liquidation filter compares the volume data of futures and spot markets.
Large differences in volume indicate unexpected market conditions, such as massive trading activities, which may signal liquidations.
Features:
⚙️ Enable Liquidation Filter:
🎯 Purpose:
→ Blocks trades based on extra ordinary volume differences in spot and futures market.
💡 How to Use:
→ Enable 'Liquidation Filter'.
→ Set behavior to react during that market conditions.
→ Set base amount to filter volume. This amount changes according to timeframe, you should find right amounts.
→ Liquidation candle count means, it is sum of liquidated candle count in last 20 bars.If you set 0, it means feature is disabled.
→ Detection, try to select the spot and perpetual symbols automatically, symbol names varies, it do not support all symbols, you should choose manually in that situation.
█ AUTOMATED ALERT SETTINGS
Automated Alert Settings are designed to integrate your TradingView script with webhook alerts. These settings allow for enhanced strategy execution and management.
Features:
Enable Webhook Alerts:
🎯 Purpose:
→ Trigger BUY, SELL, CHANGE_DIRECTION or MOVE_STOP_LOSS .
💡 How to Use:
→ Enable 'Webhook Alerts' in the settings.
→ Enter your Strategy Key.
→ Optionally, activate 'Override Allocation Percentage' to bypass the preset allocation percentage.
☢️ Caution:
→ Overriding the allocation percentage may result in trade entry errors due to misalignment between entry cost and available balance.
Enable Custom Alerts:
🎯 Purpose:
→ User can produce unique messages for different purposes.
💡 How to Use:
→ Enable 'Custom Alerts' in the settings.
→ Enter your message format type.
█ DEBUGGING SETTINGS
Debugging Settings are crucial for users who want to analyze and optimize their strategies. These settings provide tools for visualizing alerts on charts and accessing detailed data outputs.
Features:
⚙️ Enable Alert Plotting:
🎯 Purpose:
→ Allows users to visualize trading alerts directly on the chart, aiding in strategy analysis and refinement.
💡 How to Use:
→ Activate 'Alert Plotting' to draw alerts on the chart.
☢️ Caution:
→ It is recommended to disable this feature when creating actual trading alerts, as it can cause latency in signal processing.
⚙️ Enable Debugger Mode:
🎯 Purpose:
→ Facilitates strategy debugging by providing detailed data output in the TradingView Data Window.
💡 How to Use:
→ Turn on 'Debugger Mode' to access real-time data and metrics relevant to your strategy.
⚙️ Enable Table:
🎯 Purpose:
→ Facilitates strategy debugging by providing detailed data output in the TradingView Table on chart.
💡 How to Use:
→ Turn on 'Table' to access last closed candle data and metrics relevant to your strategy.
█ ADDITIONAL SETTINGS
⚙️ Enable Bar Magnifier
⚙️ Enable Using standard OHLC

Narrow Range StrategyNarrow Range Strategy :
INTRODUCTION :
This strategy is based on the Narrow Range Day concept, implying that low volatility will generate higher volatility in the days ahead. The strategy sends us buy and sell signals with well-defined profit targets. It's a medium/long-term strategy. There's also a money management method that allows us to reinvest part of the profits or reduce the size of orders in the event of substantial losses.
NARROW RANGE (NR) DAY :
A Narrow Range Day is a day in which price variations are included in those of a specific day some time before. The high and low of this specific day form the "reference range". In general, we compare these variations with those of 4 or 7 days ago. The mathematical formula for finding an NR4 is :
If low > low(4) and high < high(4) :
nr = true
This implies that the current low is greater than the low of 4 days ago, and the current high is smaller than the high of 4 days ago. So today's volatility is lower than that of 4 days ago, and may be a sign of high volatility to come.
PARAMETERS :
Narrow Range Length : Corresponds to the number of candles back to compare current volatility. The default is 4, allowing comparison of current volatility with that of 4 candles ago.
Stop Loss : Percentage of the reference range on which to set an exit order to limit losses. The minimum value is 0.001, while the maximum is 1. The default value is 0.35.
Fixed Ratio : This is the amount of gain or loss at which the order quantity is changed. The default is 400, which means that for each $400 gain or loss, the order size is increased or decreased by an amount chosen by the user.
Increasing Order Amount : This is the amount to be added to or subtracted from orders when the fixed ratio is reached. The default is $200, which means that for every $400 gain, $200 is reinvested in the strategy. On the other hand, for every $400 loss, the order size is reduced by $200.
Initial capital : $1000
Fees : Interactive Broker fees apply to this strategy. They are set at 0.18% of the trade value.
Slippage : 3 ticks or $0.03 per trade. Corresponds to the latency time between the moment the signal is received and the moment the order is executed by the broker.
Important : A bot was used to test NR4 and NR7 with all possible Stop Losses in order to find out which combination generates the highest return on BITSTAMP:ETHUSD while limiting the drawdown. This strategy is the most optimal with an NR4 and a SL of 35% of the reference range size in 5D timeframe.
BUY AND SHORT SIGNALS :
When an NR is spotted, we create two stop orders on the high and low of the reference range. As soon as there's a breakout from this reference range (shown in blue on the chart), we open a position. We're LONG if there's a breakout on the high and SHORT if there's a breakout on the low. Executing a stop order cancels the second stop order.
RISK MANAGEMENT :
This strategy is subject to losses. We manage our risk with Stop Losses. The user is free to enter a SL as a percentage of the reference range. The maximum amount risked per trade therefore depends on the size of the range. The larger the range, the greater the risk. That's why we have set a maximum Stop Loss to 10% to limiting risks per trade.
The special feature of this strategy is that it targets a precise profit objective. This corresponds to the size of the reference range at the top of the high if you're LONG, or at the bottom of the low if you're short. In the same way, the larger the reference range, the greater the potential profits.
The risk reward remains the same for all trades and amounts to : 100/35 = 2.86. If the reference range is too high, we have set a SL to 10% of the trade value to limit losses. In that case, the risk reward is less than 2.86.
MONEY MANAGEMENT :
The fixed ratio method was used to manage our gains and losses. For each gain of an amount equal to the value of the fixed ratio, we increase the order size by a value defined by the user in the "Increasing order amount" parameter. Similarly, each time we lose an amount equal to the value of the fixed ratio, we decrease the order size by the same user-defined value. This strategy increases both performance and drawdown.
NOTE :
Please note that the strategy is backtested from 2017-01-01. As the timeframe is 5D, this strategy is a medium/long-term strategy. That's why only 37 trades were closed. Be careful, as the test sample is small and performance may not necessarily reflect what may happen in the future.
Enjoy the strategy and don't forget to take the trade :)

HTF star - trailingDescription:
The HTF - Stars (Highertimeframe Stars) Strategy Script is designed to explore the behavior of a strategy using multiple timeframes. This experimental script focuses on identifying star candle patterns on a chosen higher timeframe and capturing subsequent price movements on a lower timeframe. By leveraging the power of star candle patterns forming on a higher timeframe, this strategy aims to capture potential trading opportunities on a shorter timeframe.
Key Features:
Multiple Timeframe Analysis: The strategy script allows you to be on a lower timeframe while searching for star candle patterns on a higher timeframe using the security function. This approach enables you to take advantage of higher timeframe insights and potentially capture favorable price movements on a shorter timeframe.
Star Candle Pattern Detection: The script identifies star candle patterns on the chosen higher timeframe. After the candle closes, a buy or sell order is executed on the lower timeframe, signaling a potential trading opportunity based on the detected pattern.
Trailing Stop: The strategy utilizes a trailing stop feature to manage trades. The trailing stop is set at a specified ATR (Average True Range) distance above or below the candle closes. This mechanism allows you to capture potential profits if the price moves in the anticipated direction and then reverses.
Mean Reversion Potential: During backtesting, it was observed that shorting stars above the 360 MA (Moving Average) and taking long positions on stars below the 360 MA yielded the most profitable results in the current market conditions. This suggests that star candle patterns in this context may serve as potential mean reversion signals. However, user inputs allow for customization, enabling you to experiment with different trading approaches when a star candle is detected.
Backtesting Feature: The script includes a backtesting feature that uses a percentage of equity, with 1% of equity set as the default. It displays a table presenting various statistics about the strategy's performance, providing valuable insights into its historical results.
Adjustable User Inputs: The script offers multiple adjustable settings, each accompanied by tooltips explaining their functionality. This flexibility allows you to fine-tune the strategy according to your preferences and experiment with different parameters to optimize its performance.
Disclaimer:
The HTF - Stars Strategy Script is provided for experimental and educational purposes only. Trading in the financial markets involves risk, and you should only trade with funds that you can afford to lose. The information presented in this script does not constitute financial advice or investment recommendations. Always conduct your own research and due diligence before making any investment decisions. The creator of this script shall not be held responsible for any losses or damages incurred from the use of this script. Historical performance is not indicative of future results.
Please note that past performance is not necessarily indicative of future results. Trading the markets involves risk, and there is no guarantee that the strategy described will be profitable for you. It is important to thoroughly test the strategy, adapt it to your trading style, and use proper risk management techniques.

ETH Climber Snake [ETHUSDT 60MIN]BEST PERFORMANCE: FTX:ETHUSDT 6H timeframe
The concept of Climber Snake is to detect the uptrend first and then take the advantage of each correction while the price is rising, while it hold during the bearish trend.
I'm using SAR indicator to detect the trend and Smooth HA Candles MTF v1 indicator made by @RafaelZioni to detect the correction waves

Indian Scalper 2025 – PSAR + SMA50 + RSI≤50 + High Volume (75%)Best 1-min / 2-min scalping strategy for NIFTY, BANKNIFTY, FINNIFTY & liquid stocks in 2025
✓ PSAR flip + SMA-50 trend filter
✓ RSI ≤50 (avoids chasing)
✓ Only high-volume candles (bright colour)
✓ Loud mobile alerts with price & SL
✓ 1:2+ RR with PSAR trailing
Works like magic 9:15–11:30 AM and 2–3:20 PM
Made with love for the Indian trading community ♥

SmartMoneyConcept ProFlow StrategySmartMoneyConcept ProFlow is a complete SMC-based algo built for trending markets and clean volatility phases – especially on crypto pairs like BTC, ETH and perpetual futures.
It combines:
• Smart Money swing structure (BOS / CHoCH)
• Dynamic Support & Resistance levels
• Order Block–style gap detection
• Volatility normalization (ATR / Range / BBWidth)
• SuperTrend trend filter
• ATR & Volume-based exits, TP lock and session control
The goal: fewer random trades, more focused entries when structure + volatility + trend are in sync.
1. Core Idea
Smart Structure Levels (S/R)
– The strategy builds dynamic support/resistance using swing highs/lows.
– Breakouts above resistance or below support, with enough volatility (filter), become primary trade signals.
BOS / CHoCH Engine
– Tracks Break of Structure (BOS) and Change of Character (CHoCH).
– BOS up/down help define the current trend bias.
– CHoCH highlights potential reversals after a confirmed BOS in the opposite direction.
Order Block Gap Logic
– Detects displacement candles with gaps (based on ATR) to approximate OB-style “impulsive moves”.
– Bullish gaps can add confluence for long entries, bearish gaps for shorts.
Volatility-Aware Entries
– Uses normalized volatility (via ATR, Range or BBWidth).
– Filters out breakouts in dead, low-vol environments and focuses on moves with real expansion.
2. Trend & Risk Management Stack
SuperTrend Filter
– Optional “Only With SuperTrend Direction” to restrict entries to the current ST trend.
– ST flips can also force exits if you want to exit as soon as the main trend changes.
ATR-Based Stops & Trails
– ATR distance check to avoid ultra-tight stops that get chopped instantly.
– Three modes:
• StopOnly – classic fixed ATR stop.
• TrailOnly – trailing ATR-style stop.
• StopAndTrail – initial fixed stop that later trails with price.
Volume-Based Exits (Optional)
– Exit on extremely low volume (move losing participation).
– Or on opposite volume spikes (strong counter-pressure against your position).
– Or use Both for a more active volume management.
TP Lock Logic
– When unrealized profit reaches a chosen value, the position is closed and a “lock” can be applied.
– Use this lock to:
• block same-direction re-entries for that side, or
• allow them again depending on your preference.
3. Anti-Churn & Session Control
Anti-Churn Controls
– Minimum bars between entries.
– Cooldown after an ATR exit.
– Limit of max entries per bar.
Session Filter
– Restrict trading to a specific hourly window (e.g. main market session).
– Option to force close positions outside your active session.
– Handy for intraday traders who don’t want overnight or low-liquidity exposure.
4. SmartMoney Preset Modes
Preset Mode:
• EtherFlux – more flexible, for general breakout & volatility trading.
• SmartMoney – SMC-focused preset:
– Adjusted length, volatility filter and ATR settings.
– Option to disable exits from the strategy side (for manual risk control).
Switching presets automatically tunes multiple internal parameters so you don’t have to micromanage every input each time.
5. Visual Layer
This script has a complete visual suite to help you “read the tape”:
– Bar Colors by position and SuperTrend bias.
– Support / Resistance dots and lines (stepline style).
– Order Block markers (bullish / bearish gap labels).
– BOS / CHoCH labels to track structure shifts in real-time.
– Liquidation Zones (visual only)
• Approximate long and short liquidation areas based on assumed leverage.
• Shaded zones on the chart for quick liquidity map.
– Status Labels
• Session status (ACTIVE / OFF / DISABLED).
• Current position (LONG / SHORT / FLAT).
• TP Lock status (longs locked / shorts locked / no lock).
All visuals are designed for dark charts but also work on light themes with minor tweaks.
6. Quick Input Guide
• Levels Period & Volatility Filter – main structure sensitivity and breakout quality.
• Volatility Method – ATR / Range / BBWidth normalization for the vol filter.
• ATR Stop & Management – core risk rules: ATR multiplier, stop/trail mode, min ATR distance.
• SuperTrend Settings – trend bias and ST-flip exits.
• SmartMoney Preset – quick switch between EtherFlux and SmartMoney tuning.
• Volume Exits – low volume / opposite spike / both.
• Session Filter – hour-based trading window + optional forced flat outside session.
• Follow-Signal Mode – flip from long→short or short→long when signal reverses (signal-based rotation).
• TP Lock – secure profits at a fixed amount and optionally block same-direction re-entries.
• Liq Zones – visual only, for liquidity map (no direct trade logic).
How to Use (My Suggestion)
Start on 15m–4H charts for liquid pairs (BTC, ETH, majors).
Choose your preset:
– EtherFlux for more general breakout + vol trading.
– SmartMoney if you want stricter SMC behaviour.
Turn on SuperTrend + ATR stops for cleaner risk management.
Forward-test in replay / paper trading before using real capital.
Use the visual BOS/CHoCH + Liq Zones as context , not as blind signals.
Important
This is a backtest & research tool . It is not financial advice and does not guarantee profits. Always combine it with your own risk management, position sizing, and forward-testing before going live. Trading leveraged products and crypto can result in partial or full loss of capital.

Classic Wave: The Easy WayClassic Wave is a simple strategy with few rules and no over-optimization. Despite its simplicity, it is backed by a nearly century-long historical track record, delivering excellent returns on the weekly chart of the SPX (TVC).
I also recommend observing its strong performance on the SPY (weekly), which is the perfect instrument for executing this strategy with futures in the future.
Strategy Rules and Parameters
When a bullish candle closes above the 20-period EMA, we place the stop-loss below the low of that candle and target a risk-reward ratio of 1:1.
A second, more profitable variant is to change the risk-reward ratio in the code to 2:1.
-Total capital: $10,000
-We use 10% of the total capital per trade.
-Commissions: 0.1% per trade.
The code construction is simple and very well detailed within the script itself.
Risk-Reward Ratio 2:1
Using a 2:1 risk-reward ratio reduces the win rate but significantly increases profitability.
Across the full historical data of the SPX index (weekly), the system would have generated 236 trades, with a win rate of 51.27% and a profit factor of 2.53.
From January 1, 2023, to November 28, 2025, the system would have generated 5 trades, with an 80% win rate and a profit factor of 9.244.
What makes this system so good?
-It takes advantage of the long-term bullish bias of U.S. stock indices and traditional markets.
-It filters out a lot of noise thanks to the weekly timeframe.
-It uses simple parameters with no over-optimization.
Final Notes:
This strategy has consistently outperformed the returns offered by most traditional funds over time, with fewer drawdowns and significantly less stress. I hope you like it.

EMA 12-26-100 Momentum Strategy# Triple EMA Multi-Signal Momentum Strategy
## 📊 Overview
**Triple EMA Multi-Signal** is a comprehensive trend-following momentum strategy designed specifically for cryptocurrency markets. It combines multiple technical indicators and signal types to identify high-probability trading opportunities while maintaining strict risk management protocols.
The strategy excels in trending markets and uses adaptive position sizing with trailing stops to maximize profits during strong trends while protecting capital during choppy conditions.
## 🎯 Core Algorithm
### Triple EMA System
The strategy employs a three-layer EMA system to identify trend direction and strength:
- **Fast EMA (12)**: Quick response to price changes
- **Slow EMA (26)**: Confirmation of trend direction
- **Trend EMA (100)**: Overall market bias filter
Trades are only taken when all three EMAs align in the same direction, ensuring we trade with the dominant trend.
### Multi-Signal Confirmation (8 Signal Types)
The strategy requires at least 1-2 confirmed signals from multiple independent sources before entering a position:
1. **EMA Crossover** - Fast EMA crossing Slow EMA (primary signal)
2. **MACD Cross** - MACD line crossing signal line (momentum confirmation)
3. **RSI Reversal** - RSI bouncing from oversold/overbought zones
4. **Price Action** - Strong bullish/bearish candles (>60% of range)
5. **Volume Spike** - Above-average volume confirmation
6. **Breakout** - Price breaking 20-period high/low with volume
7. **Pullback to EMA** - Trend continuation after healthy retracement
8. **Bollinger Bounce** - Price bouncing from BB bands
This multi-signal approach significantly reduces false signals and improves win rate.
## 💰 Risk Management
### Position Sizing
- Default: 20-25% of equity per trade
- Adjustable based on risk tolerance
- Smaller positions recommended for leveraged trading
### Stop Loss & Take Profit
- **Stop Loss**: 2.0% (tight control of risk)
- **Take Profit**: 5.5% (2.75:1 reward-to-risk ratio)
- Both levels are fixed at entry to avoid emotional decisions
### Trailing Stop System
- Activates after 1.8% profit
- Trails at 1.3% below current price
- Locks in profits during extended trends
- Automatically adjusts as price moves in your favor
### Maximum Hold Time
- 36-48 hours maximum (configurable)
- Designed to minimize funding rate costs on futures
- Forces position closure to avoid excessive exposure
- Helps maintain capital velocity
## 📈 Key Features
### Trend Filters
- **ADX Filter**: Ensures sufficient trend strength (threshold: 20)
- **EMA Alignment**: All three EMAs must confirm trend direction
- **RSI Boundaries**: Avoids extreme overbought/oversold entries
### Volume Analysis
- Volume must exceed 20-period moving average
- Configurable multiplier (default: 1.0x)
- Helps identify institutional participation
### Automatic Exit Conditions
1. Take Profit target reached
2. Stop Loss triggered
3. Trailing stop activated
4. Trend reversal (EMA cross in opposite direction)
5. Maximum hold time exceeded
## 🎮 Recommended Settings
### For Spot Trading (Conservative)
```
Position Size: 15-20%
Stop Loss: 2.5%
Take Profit: 6.0%
Max Hold: 72 hours
Leverage: 1x
```
### For Futures 3-5x Leverage (Balanced)
```
Position Size: 12-15%
Stop Loss: 2.0%
Take Profit: 5.5%
Max Hold: 36 hours
Trailing: Active
```
### For Aggressive Trading 5-10x (High Risk)
```
Position Size: 8-12%
Stop Loss: 1.5%
Take Profit: 4.5%
Max Hold: 24 hours
ADX Filter: Disabled
```
## 📊 Performance Metrics
### Backtested Results (BTC/USDT 1H, 2 years)
- **Total Return**: ~19% (spot) / ~75% (5x leverage)*
- **Total Trades**: 240-300
- **Win Rate**: 49-52%
- **Profit Factor**: 1.25-1.50
- **Max Drawdown**: ~18-22%
- **Average Trade**: 0.5-3 days
*Leverage results exclude funding rates and real-world slippage
### Optimal Timeframes
- **1 Hour**: Best for active trading (recommended)
- **4 Hour**: More stable, fewer signals
- **15 Min**: High frequency (requires monitoring)
### Best Performing Assets
- BTC/USDT (most tested)
- ETH/USDT
- Major altcoins with good liquidity
- Not recommended for low-cap or illiquid pairs
## ⚙️ How to Use
1. **Add to Chart**: Apply strategy to 1H BTC/USDT chart
2. **Adjust Settings**: Configure risk parameters based on your preference
3. **Review Signals**: Green = Long, Red = Short, labels show signal count
4. **Monitor Performance**: Check strategy tester for detailed statistics
5. **Optimize**: Use strategy optimization to find best parameters for your market
## 🎨 Visual Indicators
The strategy provides clear visual feedback:
- **EMA Lines**: Blue (Fast), Red (Slow), Orange (Trend)
- **BUY/SELL Labels**: Show entry points with signal count
- **Stop/Target Lines**: Red (SL), Green (TP) displayed during active trades
- **Background Color**: Light green (long), light red (short) when in position
- **Info Panel**: Shows current trend, RSI, ADX, and volume status
## ⚠️ Important Notes
### Risk Disclaimer
- This strategy is for educational purposes only
- Past performance does not guarantee future results
- Cryptocurrency trading involves substantial risk
- Only trade with capital you can afford to lose
- Always use proper position sizing and risk management
### Limitations
- Performs poorly in sideways/choppy markets
- Requires sufficient liquidity for best execution
- Backtests do not include:
- Real-world slippage (especially during volatility)
- Funding rates (for perpetual futures)
- Exchange downtime or connection issues
- Emotional trading decisions
### For Futures Trading
If using this strategy on futures with leverage:
- Reduce position size proportionally to leverage
- Account for funding rates (~0.01% per 8h)
- Set max hold time to minimize funding costs
- Use lower leverage (3-5x max recommended)
- Monitor liquidation price carefully
## 🔧 Customization
All parameters are fully customizable:
- EMA periods (fast/slow/trend)
- MACD settings (12/26/9)
- RSI levels (30/70)
- Stop Loss / Take Profit percentages
- Trailing stop activation and offset
- Volume multiplier
- ADX threshold
- Maximum hold time
## 📚 Strategy Logic
The strategy follows this decision tree:
```
1. Check Trend Direction (EMA alignment)
↓
2. Scan for Entry Signals (8 types)
↓
3. Confirm with Filters (ADX, Volume, RSI)
↓
4. Enter Position with Fixed SL/TP
↓
5. Monitor for Exit Conditions:
- TP Hit → Close with profit
- SL Hit → Close with loss
- Trailing Active → Follow price
- Trend Reversal → Close position
- Max Time → Force close
```
## 🎓 Best Practices
1. **Start Conservative**: Use smaller position sizes initially
2. **Track Performance**: Monitor actual vs backtested results
3. **Optimize Regularly**: Market conditions change, adapt parameters
4. **Combine with Analysis**: Don't rely solely on automated signals
5. **Manage Emotions**: Stick to the system, avoid manual overrides
6. **Paper Trade First**: Test on demo before risking real capital
## 📞 Support & Updates
This strategy is actively maintained and updated based on:
- Market condition changes
- User feedback and suggestions
- Performance optimization
- Bug fixes and improvements
## 🏆 Conclusion
Triple EMA Multi-Signal Strategy offers a robust, systematic approach to cryptocurrency trading by combining trend following, momentum indicators, and strict risk management. Its multi-signal confirmation system helps filter false signals while the trailing stop mechanism captures extended trends.
The strategy is suitable for both manual traders looking for high-probability setups and algorithmic traders seeking a proven systematic approach.
**Remember**: No strategy wins 100% of the time. Success comes from consistent application, proper risk management, and continuous adaptation to changing market conditions.
---
*Version: 1.0*
*Last Updated: November 2025*
*Tested on: BTC/USDT, ETH/USDT (1H, 4H timeframes)*
*Recommended Capital: $5,000+ for optimal position sizing*

NEXT GEN INSPIRED BY OLIVER VELEZDYOR NFA
1. Initial Setup & Application
Load the Strategy to your desired chart (e.g., EURUSD M5, as suggested by the script's backtest).
Overlay: Ensure the script is set to overlay=true (which it is) so the signals and Moving Averages plot directly on the price chart.
Equity Management: Review the initial strategy settings for capital and position sizing:
Initial Capital: Defaults to 10,000.
Default Qty Type: Set to strategy.percent_of_equity (22%), meaning 22% of your available equity is used per trade. Adjust this percentage based on your personal risk tolerance.
2. Reviewing Key Indicator Inputs
The script uses default values that are optimized, but you can adjust them in the settings panel:
Fast EMA: Defaults to 9 (e.g., a 9-period Exponential Moving Average).
Slow EMA: Defaults to 21 (e.g., a 21-period Exponential Moving Average). These EMAs define the short-term trend.
ATR: Defaults to 14 (Average True Range). Used to dynamically calculate volatility for SL/TP distances.
Final R:R: Defaults to 4.5 (minimum R:R required for a signal). This is the core of the strategy's high reward goal.
3. Interpreting Entry Signals
A trade signal is generated only when all conditions—EMA trend, "Elephant Logic" momentum, and non-ranging market—are met.
Long Signal: Appears as a green triangle (▲) below the bar, labeled "COMBO".
Short Signal: Appears as a red triangle (▼) above the bar, labeled "COMBO".
Live Plan: Upon signal, a detailed label is immediately plotted on the chart showing the FULL BATTLE PLAN:
SL: Calculated Stop Loss price.
TP: Calculated Take Profit price (based on the Final R:R).
Risk/Reward Pips: The calculated pips for the trade's risk and reward.
R:R = 1:4.5: The exact Risk-to-Reward ratio.
4. Understanding Market Conditions & Visuals
The script provides visuals to help you understand the current market state:
Trend EMAs: The 9 EMA (green) and 21 EMA (purple/magenta) are plotted to show the underlying trend.
Long trades only fire when Price > 9 EMA > 21 EMA.
Short trades only fire when Price < 9 EMA < 21 EMA.
Ranging Market (Rejection): Bars turn a light gray/silver when the proprietary "Reject Ranging" logic is active, indicating a low-volatility period. No new trades will be taken during these bars.
Momentum Bar: Bars turn a gold/yellow color when the "Elephant Logic" (high-momentum, large-body candles over 2-3 periods) is detected, highlighting powerful price movement.
5. Execution and Exit Logic
The strategy handles entry, scaling, and exit automatically:
Entry: A market order is placed (strategy.entry) immediately upon the bar where the longSetup or shortSetup condition is met.
Scaling Out (+1R): If the trade moves favorably by an amount equal to the initial risk (1R), the script closes a portion of the position (strategy.close with comment "+1R"). This partial exit locks in profit equivalent to the initial risk.
Re-entry (Pyramiding): After the +1R exit, the strategy attempts a re-entry (LONG RE/SHORT RE diamond plot) if the price meets certain criteria near the 9 EMA, trying to capitalize on further trend continuation.
Final Exits:
Take Profit: A limit order is set at the calculated TP level (stopDist * minRR).
Stop Loss: A stop order is set at the calculated SL level (stopDist * 1.3), slightly wider than the initial SL distance, likely to account for spread/slippage, ensuring the maximum loss is defined.
Trailing Stop: A trailing stop is applied to the re-entry positions (LONG RE/SHORT RE) to protect profits as the market moves further in the direction of the trade.

TitanEdge Algo Suite — 4H BTC & ETH (Delta Exchange Ready)TitanEdge Algo Suite — 4H BTC & ETH (Delta Exchange Ready)
TitanEdge Algo Suite is a next-generation trading system that fuses volatility-adaptive logic, order-block structure, SuperTrend direction filtering, and ATR-based exits into a single modular framework.
It’s engineered for 4-hour BTC and ETH swing trading, delivering institutional-grade entries, dynamic risk control, and precise exits.
⚙️ Core Features
1. Volatility Oscillator (0–100)
• Filters trades by volatility intensity.
• Uses ATR, Range, or Bollinger Band Width normalization.
• Trades trigger only when market volatility is high — filtering out sideways or weak trends.
• Ensures trades occur during real momentum expansions.
2. Breakout + Order Block Engine
• Detects pivot highs/lows to confirm authentic breakout levels.
• Identifies “smart money” gaps — institutional imbalance zones often leading to strong reversals or continuations.
• Captures both breakout continuations and order-block reversals.
• Works as a hybrid structure detector combining price action and volatility alignment.
3. SuperTrend Directional Filter
• Optional filter that only allows trades in the direction of the SuperTrend.
• Can automatically close trades when a SuperTrend flip occurs.
• Provides strong trend-following bias and helps avoid countertrend traps.
4. ATR-Based Stop & Trailing System
• Adaptive stop-loss and trailing logic that expands or tightens based on volatility.
• Supports three modes: StopOnly, TrailOnly, and StopAndTrail.
• Works in both ATR-based distance or percentage-based configuration.
• Keeps losing trades small and lets winning trades extend dynamically.
5. Volume-Based Exit Logic
• Detects low-volume exhaustion to identify momentum loss.
• Detects opposite-volume spikes as early reversal signals.
• Optional hybrid “Both” mode combines both detection methods for stronger reliability.
• Ideal for markets where volume surges indicate smart money exits or trap formations.
6. Session Filter & Anti-Churn Control
• Restrict trading hours (optional; not required for crypto).
• Prevents repeated signals and noise-based entries through minimum bars between trades.
• Cooldown logic ensures disciplined trading and avoids strategy overlap.
• Prevents multiple entries in a single bar and filters unconfirmed breakouts.
7. SmartMoney Preset Mode
• Institutional-grade configuration automatically adjusting volatility, ATR, and structural logic.
• Mimics smart money behavior by prioritizing clean structure and high liquidity volatility zones.
• Great for traders who want simplified institutional logic without manual tuning.
Optimized for 4H BTC & ETH
TitanEdge performs best on BTCUSDT and ETHUSDT pairs in the 4-hour timeframe.
The 4H chart captures high-volatility institutional swings, eliminates intraday noise, and provides clear order-block setups.
This timeframe aligns with BTC/ETH volatility cycles, providing consistent signals and cleaner trend confirmation.
Recommended settings for 4H charts:
• Levels Period: 25
• Volatility Filter: 20
• volatility oscillator Auto: disable ( it depend upon your plan test with Disable/enable)
• Volatility Method: BBWidth
• ATR Multiplier: 1.8
• ATR Stop %: 5
• SuperTrend ATR Length: 10
• SuperTrend Factor: 3
• ATR Mode: StopAndTrail
• Hold Bars: 1
• Volume Exit: Disable (Both)
• Session Filter: Off (Crypto runs 24/7)
Entry Logic
• Long Entry: Price breaks above resistance (pivot high), volatility above threshold, and optional SuperTrend confirmation.
• Short Entry: Price breaks below support (pivot low), volatility above threshold, and optional bearish SuperTrend confirmation.
• Additional Entry: Triggered by order-block gaps (smart money imbalances) in volatility expansion phases.
• Trades only when both direction and volatility align to ensure precision entries.
Exit Logic
• ATR Stop and Trail dynamically manage open trades.
• SuperTrend Flip forces exit on trend reversal.
• Volume Exit triggers when volume momentum drops or opposite spike occurs.
• Optional session close exit to flatten trades outside hours.
• Logic prevents premature exits with “Hold Bars” delay after entry.
Why You Need TitanEdge Algo Suite
• Trades only during high-volatility, strong-momentum phases — no false breakouts or choppy trades.
• ATR risk control automatically adjusts to each market’s volatility conditions.
• Identifies institutional order-blocks and clean breakouts for precise entries.
• SuperTrend filter adds directional bias, boosting win-rate consistency.
• Volume exit logic ensures profits are protected when market momentum fades.
• Works 24/7 across all major crypto pairs — fully automated and customizable.
• Built for 4H swing trades — fewer but higher-quality setups.
• Fully compatible with TradingView alerts and bot integration for hands-free execution.
How TitanEdge Makes Profit
• TitanEdge only trades during volatility expansion, when breakout continuation probability is statistically high.
• ATR dynamic stops prevent large losses by scaling protection according to real volatility.
• Trend filtering keeps positions aligned with major market flows.
• Order-block detection ensures entries are based on price structure rather than random signals.
• Volume-based exits secure profits early when momentum weakens.
• SmartMoney Preset provides optimal balance between trade frequency, accuracy, and drawdown control.
• The system compounds edge by maintaining trade discipline — fewer but stronger trades over time.
Delta Exchange Integration (TradingView Bot Ready)
TitanEdge is fully compatible with TradingView alert webhooks and can connect to Delta Exchange or any bot-supported broker.
Alert JSON message format:
{"symbol":"{{ticker}}","side":"{{strategy.order.action}}","qty":1,"trigger_time":"{{timenow}}","strategy_id":"code"}
qty 1 represent 1 lot so if you want to take trade with 5 lots or 0.05eth and write
{"symbol":"{{ticker}}","side":"{{strategy.order.action}}","qty":5,"trigger_time":"{{timenow}}","strategy_id":"code"}
Steps to automate:
Create an alert on TradingView using “Once Per Bar Close”.
Paste your bot or automation webhook URL.
Paste the JSON above as the message.
Configure your bot or API bridge (like PineConnector, AutoView, or WunderTrading) to route signals to Delta Exchange.
On Delta, use BTCUSD or ETHUSD Perpetual pairs with moderate leverage (3x–5x).
Enable Cross Margin for smooth drawdown handling.
Test first on Delta Testnet for safety.
Why 4H BTC & ETH Works Best
• 4H candles capture true volatility swings and filter lower-timeframe noise.
• Aligns with institutional liquidity cycles in BTC and ETH.
• ATR and volume-based stops perform optimally on larger bars.
• Smoother equity curve and less drawdown compared to intraday trading.
• Ideal for traders seeking structured, medium-term trades with high reward-to-risk.
Unique Edge
• Combines breakout, order-block, and volatility principles into one adaptive model.
• Incorporates volatility normalization (ATR/BBWidth) for multi-market adaptability.
• Dynamic ATR stops and trailing protect capital during unstable phases.
• Volume and trend exits create layered protection systems.
• 4H optimization eliminates noise and provides clear institutional alignment.
• SmartMoney preset auto-configures settings to mimic large-player behavior.
• Fully automated via webhooks — no manual execution required.
• Modular design lets you customize each component for different trading styles.
TradingView Bot Integration
TitanEdge is fully plug-and-play with all TradingView-compatible bots.
Each alert sends structured JSON data containing direction, symbol, and quantity, ready for execution on your connected broker.
You can route the data to:
• PineConnector (MT4/MT5 bridge)
• WunderTrading
• AutoView
• Custom Node/REST API handler
This makes TitanEdge a professional-grade strategy suitable for semi-automatic or fully automated crypto trading setups.
Professional Recommendations
• Timeframe: 4H
• Instruments: BTCUSDT, ETHUSDT
• Exchange: Delta Exchange (Perpetual Futures)
• Leverage: 3x–5x
• Session Filter: Off (crypto 24/7)
• Risk per trade: 0.5%–1% of total equity
• Alert Type: Once Per Bar Close
• Volatility Filter: 25–35 depending on market activity
• Always use realistic slippage and fees for backtests.
Summary
TitanEdge Algo Suite is a complete trading framework built to deliver institutional-quality precision with full automation support.
It captures powerful volatility expansions on 4H BTC and ETH charts using clean structure, adaptive stops, and directional trend filters.
Every feature — from entry logic to exits — is designed to protect capital and amplify performance through disciplined, volatility-aware execution.
TitanEdge is not just another script — it’s a professional-grade algorithm that combines volatility intelligence, structural precision, and adaptive risk control.
TitanEdge Algo Suite = Smart Logic × Trend Discipline × Adaptive Risk Control
Optimized for BTC & ETH on 4H charts. Built for traders who demand precision, control, and consistency.

Freedom Candlestick v5.0.5The is a momentum trading strategy for futures. There are also components of ICT, trend following, volume distribution, and volatility involved in the logic. We are currently using it on NQ and GC. We are also in the process of building a set up to work with ES.

AIBTC Automated Trading Strategy🧠 AIBTC Automated Trading Strategy
Overview:
The AIBTC Automated Trading Strategy is a fully autonomous system designed for 4-hour timeframes (4H). It dynamically identifies support and resistance levels based on price action, and automatically executes trades when valid breakouts occur above resistance or below support. The system adapts in real time to changing market volatility, ensuring stable performance across different market conditions.
⚙️ Strategy Logic
Dynamic Support & Resistance Detection
The strategy uses an adaptive Pivot Point algorithm that adjusts parameters according to market volatility (ATR) and price deviation (Standard Deviation).
When volatility increases, the algorithm automatically widens its detection range and recalibrates channel width for better accuracy.
All support and resistance levels are detected dynamically — no manual configuration is required.
Trend & Volatility Filtering
The system applies ADX (Average Directional Index) to measure trend strength.
When ADX > 25, only strong levels are considered valid to avoid noise during weak trends.
ATR-based volatility adjustments automatically optimize lookback periods and detection sensitivity.
Breakout Signal Detection
A long position is triggered when price breaks above resistance with a valid breakout margin (default filter: 0.1%).
A short position is triggered when price breaks below support with the same breakout filter applied.
This breakout filter effectively minimizes false breakouts and improves signal quality.
Fully Automated Execution
The system is designed for both backtesting and live simulation.
All buy/sell entries are executed automatically without manual input once conditions are met.
🕒 Recommended Timeframe
4-hour (4H) candles
Suitable for short-to-medium term swing trading, balancing signal precision and trade frequency.
📊 Key Features
✅ Fully Automated — Executes long/short positions on valid breakouts
✅ Adaptive Parameters — Automatically adjusts to changing volatility
✅ Trend-Aware Filtering — Uses ADX to avoid false signals in ranging markets
✅ Multi-Asset Compatibility — Works on BTC, ETH, or any high-liquidity instrument
⚠️ Disclaimer
This strategy is a technical and algorithmic tool, not financial advice.
Always backtest and simulate before using it on live markets.
During periods of extreme volatility, signals may delay or show false breakouts — consider using stop-loss mechanisms accordingly.

LW Outside Day Strategy[SpeculationLab]This strategy is inspired by the “Outside Day” concept introduced by Larry Williams in Long-Term Secrets to Short-Term Trading, and has been extended with configurable risk management tools and realistic backtesting parameters.
Concept
The “Outside Day” is a classic price action pattern that reflects strong market rejection or continuation pressure.
An Outside Bar occurs when the current bar’s high exceeds the previous high and the low falls below the previous low.
A body-size filter ensures only significant candles are included.
Entry Logic
Buy setup: Price closes below the previous low (bullish rejection).
Sell setup: Price closes above the previous high (bearish rejection).
Only confirmed bars are used (no intrabar signals).
Stop-Loss Modes
Prev Low/High: Uses the previous swing point ± ATR-based buffer.
ATR: Dynamic stop based on Average True Range × multiplier.
Fixed Pips: User-defined fixed distance (for forex testing).
Take-Profit Modes
Prev High/Low (PHL): Exits near the opposite swing.
Risk-Reward (RR): Targets a user-defined multiple of the stop distance (default = 2 : 1).
Following Price Open (FPO): Exits on the next bar’s open if price opens in profit (used to test overnight price continuation).
Risk Management & Backtest Settings
Default risk per trade is set at 10% of account equity (user-adjustable).
Commission = 0.1% and slippage = 2 ticks are applied to simulate realistic conditions.
For reliable statistics, test on data that yields over 100 trades.
Suitable for daily and 4-hour timeframes across stocks, forex, and crypto markets.
Visual Elements
Green and red triangles show entry signals.
Stop-loss (red) and take-profit (green) reference lines are drawn for clarity.
Optional alerts notify when a valid setup forms.
Disclaimer
This script is for educational and research purposes only.
It does not constitute financial advice or guarantee profits.
Always backtest thoroughly and manage your own risk.
Enhancements over Classic Outside Bar Models
Adjustable stop and target logic with ATR and buffer multipliers.
“Following Price Open” exit logic for realistic day-end management.
Optimized to avoid repainting and bar-confirmation issues.
Built with realistic trading costs and position sizing.
策略逻辑
外包线识别
当日最高价高于前一日最高价,且当日最低价低于前一日最低价,即形成外包线。
同时过滤掉较小实体的 K 线,仅保留实体显著大于前一根的形态。
方向过滤
收盘价低于前一日最低价 → 视为买入信号。
收盘价高于前一日最高价 → 视为卖出信号。
止损设置(可选参数)
前低/高止损:以形态前低/前高为止损,带有缓冲倍数。
ATR 止损:根据平均波动率(ATR)动态调整。
固定点数止损:按照用户设定的点数作为止损范围。
止盈设置(可选参数)
前高/低止盈(PHL):以前高/前低为目标。
固定盈亏比(RR):根据用户设定的风险回报比自动计算。
隔夜开盘(FPO):若次日开盘价高于进场价(多单)或低于进场价(空单),则平仓。
信号标记
在图表中标注买入/卖出信号(三角形标记)。
绘制止损与目标位参考线。
使用说明
适用周期:建议用于 日线图(Daily)。
适用市场:股票、外汇、加密货币等各类市场均可。
提示:此策略为历史研究与学习用途,不构成投资建议。实际交易请结合自身风险管理。

Larry Williams Oops StrategyThis strategy is a modern take on Larry Williams’ classic Oops setup. It trades intraday while referencing daily bars to detect opening gaps and align entries with the prior day’s direction. Risk is managed with day-based stops, and—unlike the original—all positions are closed at the end of the session (or at the last bar’s close), not at a fixed profit target or the first profitable open.
Entry Rules
Long setup (bullish reversion): Today opens below yesterday’s low (down gap) and yesterday’s candle was bearish. Place a buy stop at yesterday’s low + Filter (ticks).
Short setup (bearish reversion): Today opens above yesterday’s high (up gap) and yesterday’s candle was bullish. Place a sell stop at yesterday’s high − Filter (ticks).
Longs are only taken on down-gap days; shorts only on up-gap days.
Protective Stop
If long, stop loss trails the current day’s low.
If short, stop loss trails the current day’s high.
Exit Logic
Positions are force-closed at the end of the session (in the last bar), ensuring no overnight exposure. There is no take-profit; only stop loss or end-of-day flat.
Notes
This strategy is designed for intraday charts (minutes/seconds) using daily data for gaps and prior-day direction.
Longs/shorts can be enabled or disabled independently.

Kz GC1! ORBStrategy that trades breakouts on GC1! futures on the 5min timeframe. It also works on MGC1! for lower drawdown and to manage Apex and Top Step accounts with the lower risk.
Risk Disclaimer:
Past results as well as strategy tester reports do not indicate future performance. Guarantees do not exist in trading. By using this strategy you risk losing all your money.
Important:
It trades all days that markets are open. Set times may be seen on settings. Trades multiple times a day sometimes.
It works on the 5 and 15min timeframe only. Results are better on 5min timeframe.
The settings are optimized already for GC1! on the 5min timeframe.
How it works:
Every trading day it measures the range of the first 15min candle of pre-selected hours. As soon as price closes above or below on the 15min timeframe, it will trade the breakout targeting a set risk to reward ratio. SL on the opposite side of the range.
Settings:
Hourly Trading Hours: These are the times that worked best for this strategy. All boxes should be checked for best results. Excluded times were when it performed bad which is why those times have been left out.
ORB Formation Period: This setting determines on which timeframe candle has to close outside the opening range box in order to take a trade. It's set to 15min by default because this is what worked by far the best
Entry Type: Entries are immediate instead of waiting for a pull back to enter on a limit order.
Limit Orders: If enabled, the strategy will place a pending order x points from the current price, instead of a market order. Immediate orders are enabled by default for a better performance. Important: It doesn't actually place a limit order. The strategy will just wait for a pullback and then enter with a market order. It's more like a hidden limit order.
Limit Order Offset Points: If you have limit orders enabled, this setting determines how many points from the current price the limit order will be placed.
FVG Detection Type: How fast it detects the fair value gaps. Standard detection over immediate had better performance
Risk Type: You can chose either between Fixed USD Amount, Risk per Trade in % or Fixed Contract Size. By default it's set to fixed contract size.
Risk Amount (USD or Contracts): This setting is to set how many USD or how many contracts you want to risk per trade. Make sure to check which risk type you have selected before you choose the risk amount.
Take Profit Multiplier: This is simply the total SL size in points multiplied by x.
Example: If you put 2, you get a 2:1 Risk to Reward Ratio. By Default it's set to 2.5 because this gave the best results in backtests.
Stop Loss Padding: This is simply the buffer in points that is added to the SL for safety reasons. If you have it on 0, the SL will be at the exact price of the opposite side of the range. By default it's set to 5 because this is what delivered the best results in backtests.
Stop Loss Placement: This determines where the stop loss gets placed for the order. It has been set to ORB Range by default as this delivered the best results.
Max Trades Per Hour: This allows the user to decide how many trades are taken an hour. 1 is been set to default for best results
Visual Settings: Check boxes to show orb range, FVG's, Entry points, and trade visualization boxes.
Backtest Settings:
For the backtest the commissions were set to 1.29USD per contract and .35USD for micros which is the highest amount Tradovate charges Margin was not accounted for because typically on prop accounts you can use way more contracts than you need for the extremely low max drawdown. Margin would be important on personal accounts but even there typically it's not an issue at all especially because this strategy runs on the 15min timeframe so it won't use a lot of contracts anyways.
Why the source code is hidden:
The source code is hidden because I invested a lot of time and money into developing this strategy and optimizing it with paid 3rd party software.

Killzones SMT + IFVG detectorKillzones SMT + IFVG Detector
Summary
This strategy implements a specific intraday workflow inspired by ICT-style concepts.
It combines:
Killzone session levels (recording untouched highs/lows)
SMT divergence between NQ and ES (exclusive sweep logic)
IFVG confirmation (3-bar imbalance + width filter + inversion guard)
and an optional smart exit engine
The components are not simply mashed together: they interact in sequence.
A setup only confirms if all conditions line up (time window → untouched level sweep → divergence → valid IFVG → confirmation candle → risk filter).
Workflow
Killzones & session levels
Tracks highs/lows inside default killzones (19:00–23:00, 01:00–04:00, 08:30–10:00, 11:00–12:00, 12:30–15:00, chart timezone).
Stores untouched levels forward; sweeps trigger candidate signals.
SMT divergence (exclusive sweep)
Bullish SMT : one index sweeps its low while the other remains above its session low.
Bearish SMT : one index sweeps its high while the other remains below its session high.
Detection supports “Sweep (Cross)” or “Exact Tick.”
Session IDs are tracked so once a side has fired, later re-touches can’t re-trigger .
IFVG confirmation
Locks the first valid 3-bar IFVG after SMT.
Confirmation requires a candle close beyond the IFVG boundary in the direction of the close.
IFVGs must meet a minimum width filter (default 1.0 point).
Inversion guard: ignores IFVGs already inverted before SMT.
Optional “re-lock” keeps tracking the latest IFVG until confirmation/expiry.
Smart exit engine
Initial stop from opposite wick (+ buffer).
Fixed TP (default 40 points).
Dynamic stop escalation at progress thresholds (BE → 50% → 80% of target).
Safety gates
Weekend lockout (Fri 16:40 → Sun 18:00).
Same-bar sweep of high & low cancels setups.
Max initial stop filter skips oversized setups.
Optional cooldown bars.
Alerts
SMT Bullish/Bearish : divergence detected this bar.
Confirm Long/Short : IFVG confirmation triggered.
Default Strategy Properties (used in screenshots/backtests)
Initial capital: $25,000
Order size: 1 contract
Commission: $1.25 per contract per side
Slippage: 2 ticks
Backtest window: Jun 16, 2025 – Sep 14, 2025
These settings are intentionally conservative. If you change them, your results will differ.
How to use
Apply on an NQ or ES futures chart (1–5 min).
Choose your killzones and detection mode.
Select confirmation symbol (NQ, ES, or “Sweeper”).
Enable/disable IFVG re-lock.
Review signals and use alerts for automation if desired.
Limitations
Strict filters reduce trade count; extend backtest window for more samples.
Works best on NQ/ES; not validated elsewhere.
Past performance is not indicative of future results.
This is an educational tool ; not financial advice.


Tweezers Bottom Strategy 5m - Long OnlyTweezers Bottom 5m Strategy – Catch Reversals Like a Pro!
Looking for fast, precise entries on the 5-minute chart? This strategy automatically detects the Tweezers Bottom candlestick pattern and opens long positions at the perfect moment. Signals appear as ▲ arrows on the chart, making it incredibly easy to spot high-probability setups.
Risk and Reward Perfectly Managed: Stop-loss is set just 0.1% below entry, and take-profit at 0.3% above, giving you a clear, controlled trading edge. All levels are visualized on the chart with lines and labels, so you always know where your risk and profit targets are.
Ideal for scalpers and short-term traders across Forex, crypto, and stocks. Enter reversals before the crowd, maximize your winning trades, and automate your trading with minimal risk!
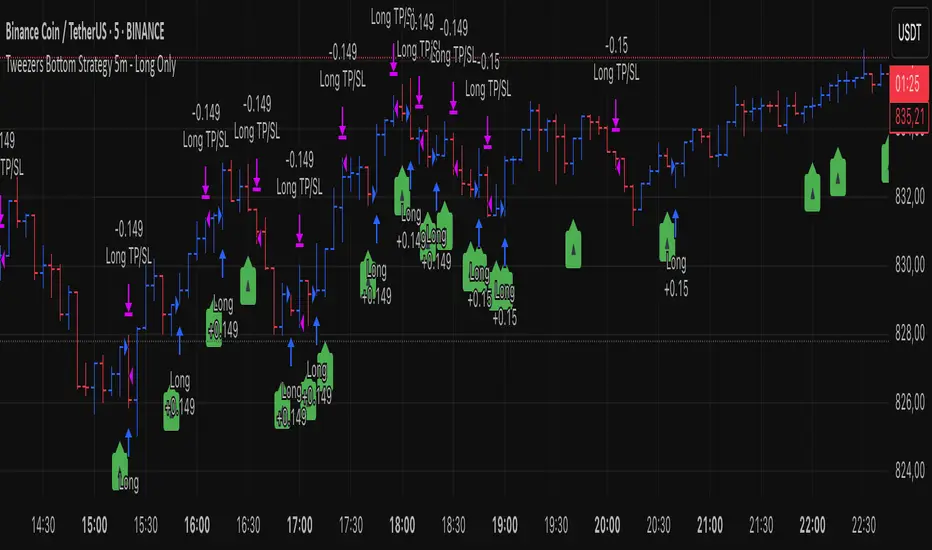
KAMAL PRO GRNC ALGO STRATEGY candles breakout strategy for all index and commodities and forex and crypto trade.and also use for algo trade
CryptoPulse AI### CryptoPulse AI Strategy
This strategy combines Bollinger Bands, multi-timeframe EMAs (200 and 50), and candlestick wick detection for crypto trading signals. Long entries trigger on downward wicks breaking lower BB with upward EMA trend; shorts on upward wicks breaking upper BB with downward EMA trend. Includes ATR-based risk management, position sizing, and R:R targets. Overlay on any chart; supports leverage (100% margin). Visual lines/labels for TP/SL/entries; alerts for webhooks.
- **Account Balance (Default: 10000)**: Initial balance for calculating risk and position size; increase for larger accounts.
- **BB Length (Default: 20)**: Periods for Bollinger Bands basis and deviation; shorter for more signals, longer for smoothing.
- **BB Multiplier (Default: 2.0)**: Std dev factor for band width; higher widens bands, reducing false breakouts.
- **Wick to Body Ratio (Default: 1.1)**: Min wick size vs. body for valid signals (1.1 = 10% larger); higher requires stronger wicks.
- **Risk Per Trade (%) (Default: 2.0)**: Account percentage risked per trade; lower for conservative sizing.
- **Risk:Reward Ratio (Default: 6.0)**: Target profit multiple of risk; higher aims for bigger wins.
- **SL Multiplier (Default: 9.0)**: ATR factor for stop loss distance; adjust based on volatility.
- **Line Length (bars) (Default: 25)**: Bars to extend TP/SL/entry lines; longer for better visibility.
- **Label Position (Default: left)**: Text placement relative to lines (left/right); choose for chart clarity.
- **ATR Period (Default: 14)**: Periods for ATR volatility measure; affects SL and position size.
- **EMA Timeframe (Default: 5 min)**: Resolution for EMA 200/50 calculation; use lower TFs for finer trend confirmation.
- **Visuals**: BB plots (blue basis, green upper, red lower); EMA200 (red), EMA50 (green); red/green lines/labels for sell/buy entries, SL (red), TP (green).
- **Alerts**: Conditions for buy/sell signals with webhook messages for integration (e.g., Bitget).
