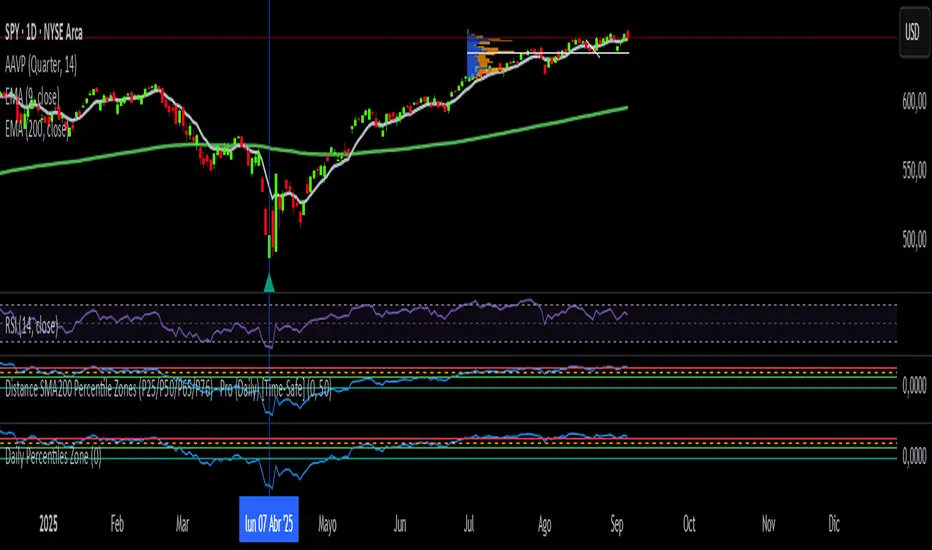
Daily SMA200 Distance – Percentile Zones PROIndicator Description — Weekly/Daily SMA200 Distance – Percentile Zones
The SMA200 Distance – Percentile Zones indicator measures the percentage distance between the price and its 200-period Simple Moving Average (SMA200), and classifies it into historical percentile zones.
This tool helps traders and investors understand the market context of an asset relative to its long-term trend:
Cheap Zone (< P25): price at historically low levels compared to SMA200.
Value Zone (P25–P50): neutral range, where price trades around its long-term average.
Acceptable Zone (P50–P65): moderately high levels, still reasonable within an uptrend.
Not Recommended Zone (P65–P76): overextended territory, with increasing correction risk.
Very Expensive Zone (≥ P76): extreme levels, historically linked to overvaluation and potential market tops.
Percentiles are calculated dynamically from the entire historical dataset (since the SMA200 becomes available), providing a robust and objective statistical framework for decision-making.
✅ In summary:
This indicator works as a quantitative valuation map — showing whether the asset is cheap, fairly valued, acceptable, risky, or very expensive relative to its historical behavior against the SMA200.
Search in scripts for "daily"
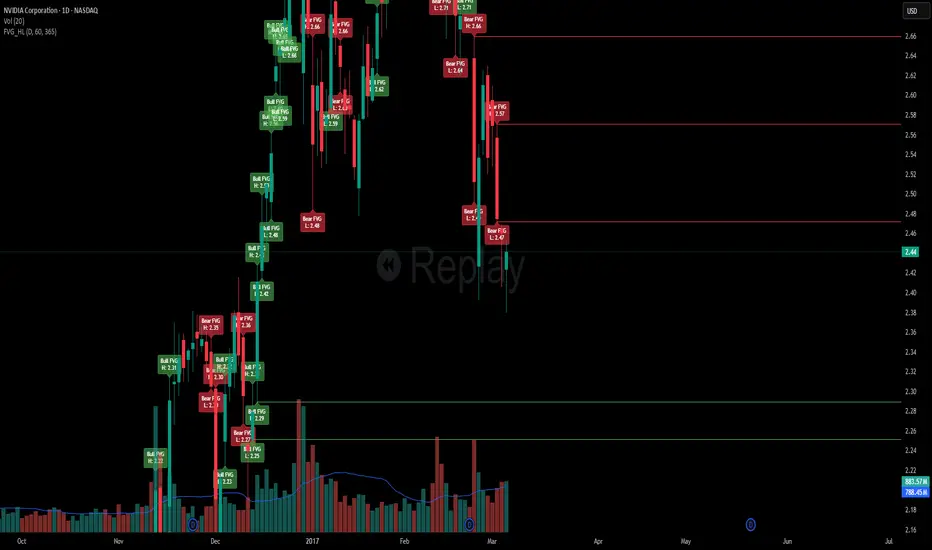
Daily FVG H/L with Sweep RemovalThis indicator marks swing highs or lows of the daily candles from which the fair value gaps were created.
It gives you insight to crucial prices such as the highs and lows by this indicator and whether they have been swept or not.
The first reaction of the high or low will be counted as a sweep.
Once we run the high or low created by the reaction, then the indicator will mark that as a used high or low and will get rid of the line drawn to mark the high/low.
This can be used to watch important levels being swept which can sometimes indicate potential reversals on lower time frames.
Note : this indicator does not give you 100% accurate results or reliability and it requires you to conduct further research on the markets to create a reliable strategy.
This indicator may be of benefit if merged with other technical indicators or can support your technical strategies.
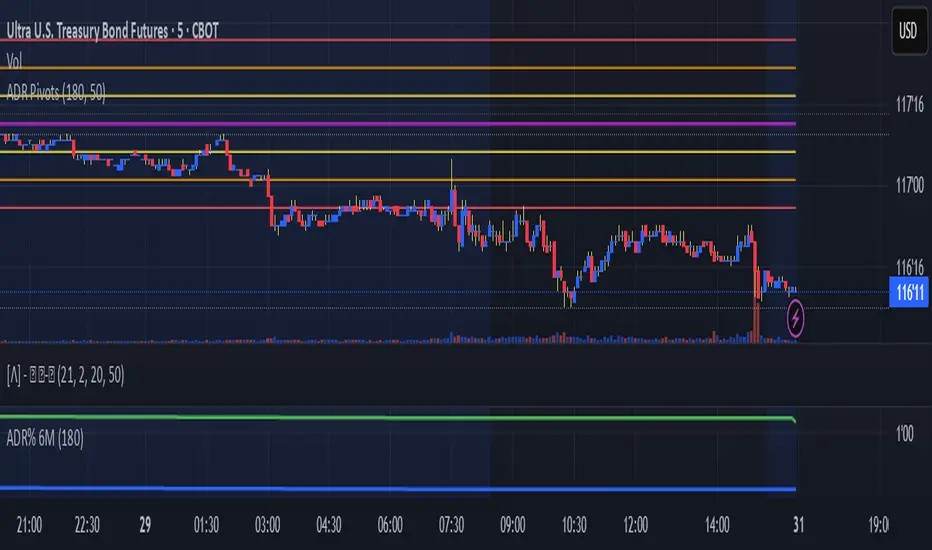
JoeySS Daily Pivot PointsDaily Pivots based on ADR with mods to ADR calcs. Pivot is based on previous day VPOC. Levels should encompass expected daily range based on the ADR calculations.
Daily Fractals Custom Timeframe Candles - Fractal Analysis Tool
📊 Overview
Custom Timeframe Candles is a powerful Pine Script indicator that displays higher timeframe (HTF) candles directly on your current chart, enabling seamless fractal analysis without switching between timeframes.
Perfect for traders who want to analyze daily candles while trading on hourly charts, or any other timeframe combination.
✨ Key Features
🎯 Multi-Timeframe Analysis
- Display any higher timeframe candles on your current chart
- Real-time updates of the current HTF candle as price moves
- Configurable number of candles (1-10) to display
🎮 How to Use
1. Add to Chart : Apply the indicator to any timeframe chart
2. Select HTF : Choose your desired higher timeframe (e.g., "1D" for daily)
3. Configure Display : Set number of candles, colors, and position
4. Analyze : View HTF context while trading on lower timeframes
📈 Perfect For Backtest
Unlike basic HTF displays, this indicator provides:
- Live Updates: Current candle updates in real-time
- Complete OHLC: Full candle structure with wicks
- Flexible Count: Display exactly what you need
- Stable Performance: No crashes during replay/backtesting
- Professional Design: Clean, customizable appearance
📝 Notes
- Works on all timeframes and instruments
- Requires higher timeframe data availability
- Compatible with replay mode and backtesting
---
by Rock9808
Daily HOD / LOD Anchored VWAP (24/7 Markets)mart Daily HOD/LOD Anchored VWAP (Auto Detect + Alerts)
This indicator automatically anchors VWAP at the High of Day (HOD) and Low of Day (LOD) for each session/day.
No more manual anchoring — the script tracks intraday highs and lows in real-time and resets cleanly at the start of each trading day or session.
✨ Features
✅ Auto-anchored AVWAP at daily High and Low
✅ Works for stock markets (with fixed sessions) and crypto markets (24/7)
✅ Clean reset every session/day
✅ Separate AVWAP lines for HOD and LOD
✅ Customizable colors & line widths
✅ Alerts included 🚨 (get notified instantly when a new High/Low AVWAP starts)
📈 Use Cases
Spot true intraday support/resistance levels
Track where institutions may be defending positions
Combine with price action, orderflow, or volume profile strategies
Perfect for intraday trading, scalping, and swing entries
⚡ Alerts
New HOD AVWAP → Fires when price makes a fresh high of day, starting a new anchored VWAP.
New LOD AVWAP → Fires when price makes a fresh low of day, starting a new anchored VWAP.
🛠️ Settings
Show/hide HOD or LOD VWAP
Customize line colors and thickness
Works seamlessly across stocks, futures, forex, and crypto
💡 Pro Tip:
AVWAP from the high and low of the day often acts as a magnet for price. Watch how price reacts when revisiting these levels — confluence with other indicators = high-probability setups.
⚠️ Disclaimer:
This script is for educational purposes only. It is not financial advice. Always manage your own risk.
Daily Start Vertical Lines (≤1H)This indicator automatically plots vertical lines at the start of each new trading day, based on the selected chart’s timezone. Unlike the default daily session boundaries (which often start at 17:00 New York time), this tool ensures that lines are drawn precisely at 00:00 midnight of the chart’s timezone.
🔹 Features:
Plots a vertical line at every new day start (midnight).
Fully time-zone aware → lines adjust automatically when you change the chart’s timezone.
Customizable line style, width, and color.
Option to limit plotting to specific timeframes (e.g., show only on ≤ 1H charts).
Lightweight & optimized (does not clutter higher-timeframe charts).
🔹 Use Cases:
Quickly identify daily boundaries for intraday analysis.
Helps scalpers and day traders align trades with new day opens.
Useful for strategies that depend on daily session resets.
This tool is especially helpful for traders who want clarity when working across different time zones.

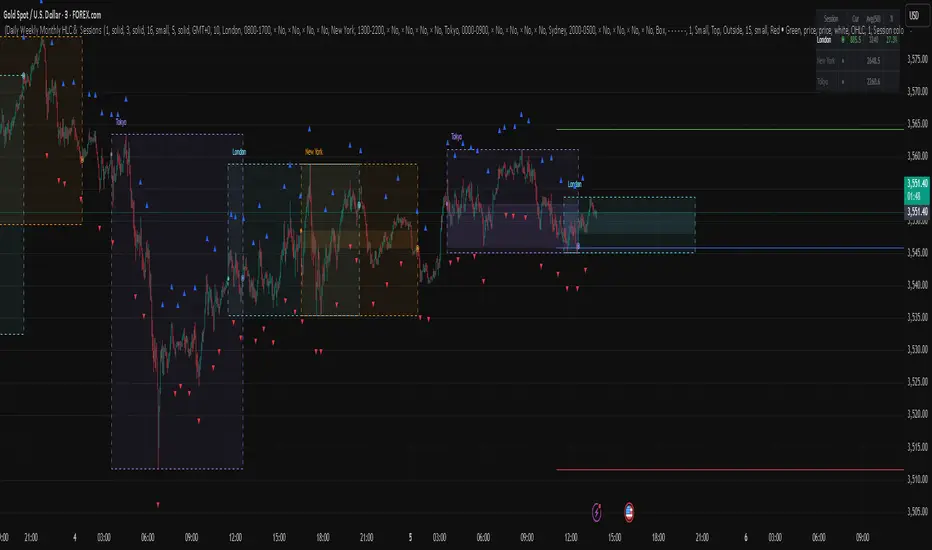
Daily Weekly Monthly HLC (بهداد)خطوط مهم روزانه هفتگی ماهانه This is an indicator that shows the closing lines and the highest and lowest prices for daily, weekly and monthly periods. In addition, we can divide the entire weekly period into several parts.
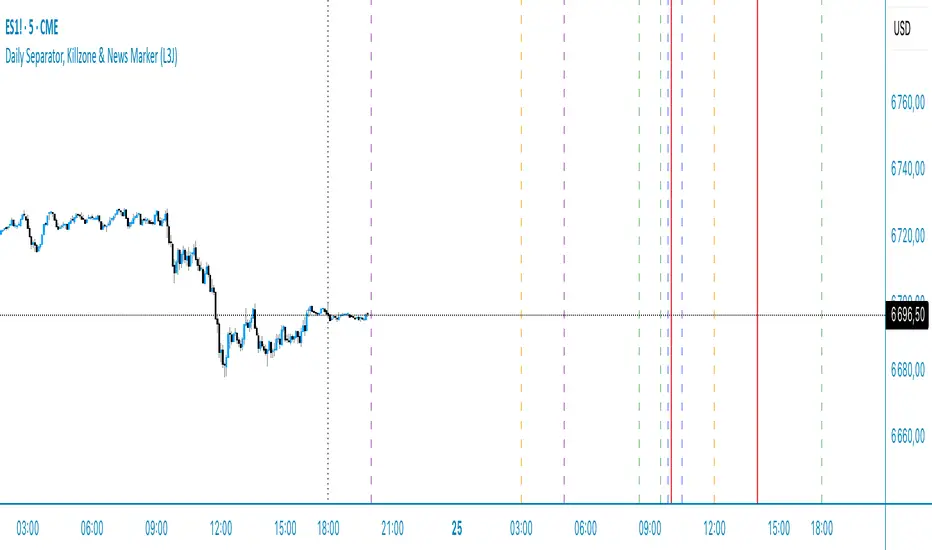
Daily Separator & Killzone marker (L3J)The “Daily Separator (L3J)” is a tool built for day traders who want a clean intraday structure around key U.S. market times and a professional trading-day model. It visually segments trading days, marks critical intraday timestamps (pre-market, cash open, killzone), and aligns with routines inspired by ICT concepts.
Important note: internal code comments and notes are written in French.
What the script does
Draws clear, configurable vertical lines to separate each trading day.
Supports two trading-day models:
- CME 18:00–17:00 (anchored on the Asian session, common for indices/futures)
- Calendar 00:00–23:59 (midnight-to-midnight)
Plots four key intraday rays in UTC‑4:
- 08:30 — U.S. pre-market open
- 09:30 — U.S. cash market open
- 09:50 — killzone start (per my routine)
- 10:30 — killzone end (per my routine)
Smart display logic: each day’s marker stays visible until the time is reached, then auto-hides to keep charts clean.
Object-budget control: caps the number of historical separators to preserve performance.
Day trading strengths (ICT-friendly)
Robust CME anchoring: day switches at the Asian session start in UTC‑4, which better reflects U.S. liquidity flow than calendar midnight.
Focused killzone: highlights 09:50–10:30 for impulse setups, rebalancing, and liquidity events around the open.
Clean readability: fully customizable colors, styles, and widths; markers auto-remove after their window.
Inputs (end‑user labels in French)
- Timezone: choose the time zone (default UTC‑4) for session alignment.
- Day separator:
- Day type: “CME 18:00–17:00” or “Calendrier 00:00–23:59”
- Color, style (solid, dashed, dotted), width
- Max number of visible separators (performance control)
Session (CME): Asian session window used as the anchor (default 18:00–16:00 UTC‑4)
ndependent intraday markers:
- Pre‑Market Open 08:30
- Market Open 09:30
- Killzone Open 09:50
- Killzone Close 10:30
- Each with show/hide, color, style, and width settings
Best practices
U.S. indices ( CME_MINI:ES1! , CME_MINI:NQ1! ) and U.S. equities: favor the “CME 18:00–17:00” mode for a more liquidity‑centric read.
ICT day trading: form directional bias around 09:30, execute between 09:50–10:30 as initial volatility structures.
Multi‑timeframe use: keep it on execution charts (1–5 min) and context charts (15–60 min) for time alignment.
Technical notes
Created by L3J.
Pine Script v6, overlay=true, controlled object budget.
Deterministic time calculations via Pine built‑ins.
All times are expressed in UTC‑4 to align with U.S. practice; adjust the timezone input as needed.
- Internal code comments/notes are written in French.
If this script helps you structure your sessions better, consider leaving a like and sharing it with other intraday traders.
Happy trading, everyone!
Daily Buy/Sell Triggers + ATR TargetsThis tool gives you a once-per-day, objective ATR map: Buy Trigger above the open, Sell Trigger below the open, clean ATR targets, and FULL ATR extremes. It’s designed for clarity, precision, and zero intraday repainting so you can plan the session and execute with confidence.
This indicator prints a new, static grid of intraday levels every New York 18:00 (end of the NY trading day). The grid is anchored at the day’s open and spaced by the Daily ATR so you get tick-precise Buy Trigger, Sell Trigger, intermediate ATR targets, and the FULL ATR bounds for the session.
The levels act as objective support/resistance and intraday measuring sticks for continuation, mean-reversion, and range expansion trades.
What you see on the chart
A thin midline at the Daily Open (anchor).
Green lines above, red lines below, spaced at your chosen ATR multiples.
Text at the far right for:
Buy trigger
Sell trigger
FULL ATR (both sides)
Intermediate targets are unlabeled to keep the chart clean (they’re still tradable S/R).
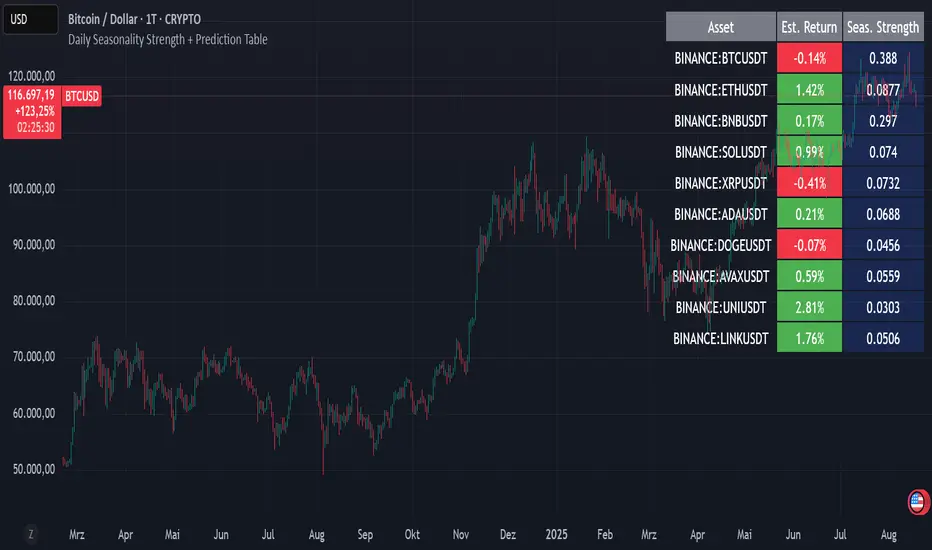
Daily Seasonality Strength + Prediction TableDaily Seasonality Strength + Prediction Table
Return Estimates:
This indicator uses historical price data to calculate average returns for each day (of the week or month) and uses these to predict the next day’s return.
Seasonality Strength:
It measures seasonality strength by comparing predicted returns with actual returns, using the inverse of MSE (higher values mean stronger seasonality).
supports up to 10 assets
This script is for informational and educational purposes only. It does not constitute financial, investment, or trading advice. I am not a financial advisor. Any decisions you make based on this indicator are your own responsibility. Always do your own research and consult with a qualified financial professional before making any investment decisions.
Past performance is no guarantee of future results. The value of the instruments may fluctuate and is not guaranteed
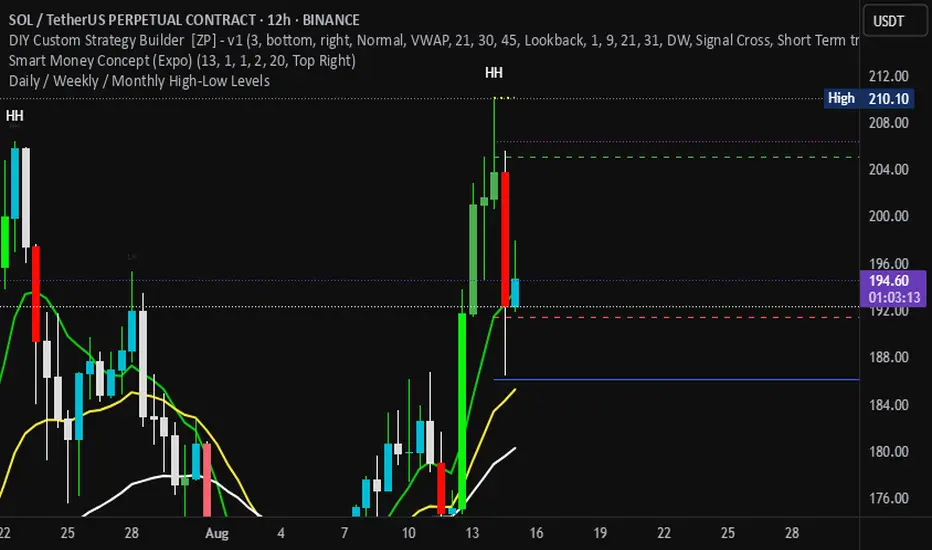
Daily / Weekly / Monthly High-Low Levels (Arindam )How it works:
Daily levels are taken from the previous day.
Weekly levels are from the previous week.
Monthly levels are from the previous month.
They extend across the chart for visual reference.
You can customize colors, line styles, or whether they reset each session.
Do you want me to also add labels on the right side (e.g., “Daily High”, “Weekly Low”) so the lines are clearly marked?
Daily Pivot Points + R1 S1 R2 S2 with PricesThis indicator automatically plots daily pivot points (PP) along with the first and second resistance (R1, R2) and support (S1, S2) levels on your chart. Each level is clearly labeled with its price, making it easy to identify key areas for potential reversals or breakouts. Perfect for day traders and swing traders looking for reliable intraday support and resistance zones.

Daily Levels3 simple daily levels
Todays Open will label any historical points an yesterdays close
There are plenty of these available but they all seemed overly complex so I adapted this to suit my needs
This indicator plots customizable daily session levels (Today's Open, Previous High/Low/Close) on intraday charts, with options for historical days back, session start/close times, labels, colours, and visibility. Ideal for forex and stock traders analysing prior sessions.

Daily EMA Cloud on Smaller TimeframesSee the daily cloud on any time frame... Colors and Exponential Moving Average (EMA) are adjustable settings.
Daily Engulfing Zones Visually appear Daily Engulfing Zones on the chart. Combine with your favorite oscillator indicator to create a solid setup. Bullish EZ is marked by green arrow/zone. Bearish EZ is marked by red arrow/zone.

Daily EMA-21/34/50The EMAs and color coding can be changed, by default it contains 21/34/50 on Daily, The script can be edited to suit the timeframe whichever wanted

Daily EMAs (8, 21 & 50) with BandDescription:
This script plots the Daily EMAs (8, 21, and 50) on any intraday or higher timeframe chart. It provides a clear, multi-timeframe view of market trends by using daily exponential moving averages (EMAs) and a dynamic visual band. I use this on the major indexes to decide if I should be mostly longing or shorting assets.
-In addition to identifying the trend structure, the 8-Day EMA often serves as a key area where buyers or sellers may become active, depending on the market direction:
-In an uptrend, the 8 EMA can act as a dynamic support zone, where buyers tend to re-enter on pullbacks.
-In a downtrend, the same EMA may act as resistance, where sellers become more aggressive.
-The script also includes a colored band between the 8 and 21 EMAs to highlight the short-term trend bias:
-Green fill = 8 EMA is above the 21 EMA (bullish structure).
Blue fill = 8 EMA is below the 21 EMA (bearish structure).
The 50-Day EMA is included to give additional context for intermediate-term trend direction.
Features:
- Daily EMA levels (8, 21, and 50) calculated regardless of current chart timeframe.
- 8 EMA acts as a potential buyer/seller zone based on trend direction.
- Color-coded band between 8 and 21 EMAs:
- Green = Bullish short-term bias
- Blue = Bearish short-term bias
- Customizable price source and EMA offset.
- Suitable for trend trading, pullback entries, and higher-timeframe confirmation.
Use Cases:
Identify key dynamic support/resistance areas using the 8 EMA.
Assess short-, medium-, and intermediate-term trend structure at a glance.
Enhance confluence for entry/exit signals on lower timeframes.

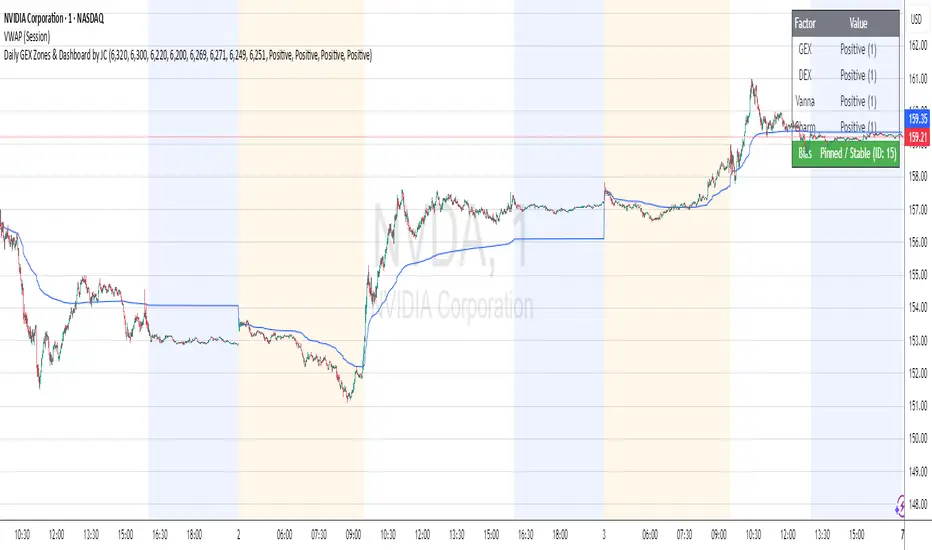
Daily GEX Zones & Dashboard by JCThis script plots daily options-driven gamma zones alongside a live sentiment dashboard to help traders visualize dealer positioning, support/resistance clusters, and expected price behavior.
Features:
📅 Date-based GEX Zones: Automatically draws GEX Resistance, GEX Support, Max Pain Zone, and Zero Gamma Line for a specific trading day.
📊 Gamma Flow Dashboard: Displays real-time GEX, DEX, Vanna, and Charm flows using intuitive dropdowns (Negative, Neutral, Positive) — no manual number typing.
🔢 Combo ID Calculation: Combines your gamma flow selections into a single Combo ID, quantifying net positioning pressure.
🎯 Automatic Bias Classification: Instantly highlights whether the day’s gamma structure is likely Pinned/Stable, Unpinned/Wild, Choppy, or Trap/Expansion — color-coded for quick reading.
📈 Zero Gamma Lines: Plots two critical levels where gamma flips from long to short, providing valuable confluence for intraday support/resistance.
How to Use:
1️⃣ Pick your target date (e.g., current day) to activate the GEX boxes.
2️⃣ Enter the day’s Resistance Wall, Support Wall, Max Pain, and Zero Gamma levels from your option chain analysis.
3️⃣ Use the radio-style dropdowns to select sentiment for GEX, DEX, Vanna, and Charm based on your interpretation of open interest, hedging, dealer flow, and market structure.
4️⃣ The dashboard will auto-calculate your Combo ID and bias class.
Designed for:
SPX, SPY, QQQ, NVDA, or any high-liquidity underlying with active options flow.
Active day traders, gamma scalpers, and market makers tracking dealer positioning.
Tip:
Combine with price action levels, VWAP, and intraday structure for high probability trade zones.
Daily Trading Barometer (DTB) with DJIA OverlayThe "Daily Trading Barometer (DTB) with DJIA Overlay" is a custom technical indicator designed to identify intermediate-term overbought and oversold conditions in the stock market, inspired by Edson Gould's original DTB methodology. This indicator combines three key components:
A 7-day advance-decline oscillator, a 20-day volume oscillator, and a 28-day DJIA price ratio, normalized into a composite index scaled around 110–135. Values below 110 signal potential oversold conditions, while values above 135 indicate overbought territory, aiding in timing market reversals.
The overlay of a normalized DJIA plot allows for visual correlation with the broader market trend. Use this tool to anticipate turning points in oscillating markets, though it’s best combined with other indicators for confirmation. Ideal for traders seeking probabilistic insights into bear or bull market transitions.
How to use -
If the DTB line (blue) and normalized DJIA (orange) are under the green dashed line, high probability for a long and reversal.
Use with the symbol SPX/QQQ
Dow Jones Industrial Average - DJIA

Daily Open Line (9:30-16:00)This indicator automatically plots a horizontal line at each day's opening price during regular trading hours (9:30 AM to 4:00 PM, US Eastern Time).
The line starts exactly at the opening bar of the day and ends at the close (16:00).
Each day, a new line is drawn, making it easy to visualize and reference the daily open price throughout the session.
Useful for intraday traders to identify key support/resistance and monitor price action relative to the open.
You can customize the color, line width, and whether to display the open price label.

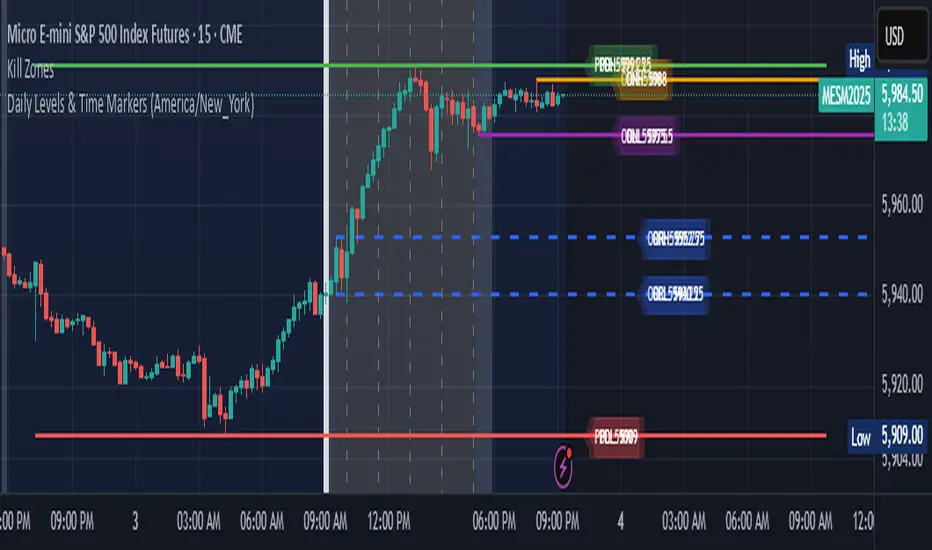
Daily Levels & Time MarkersKey Features:
Price Level Tracking:
Previous Day High/Low (PDH/PDL) - Shows yesterday's highest and lowest prices as horizontal lines
Overnight High/Low (ONH/ONL) - Tracks the highest and lowest prices during overnight sessions (4:00 PM to 9:30 AM ET)
Opening Range High/Low (ORH/ORL) - Captures the price range during the first 30 minutes of regular trading (9:30-10:00 AM ET)
Visual Elements:
Draws horizontal lines for previous day levels that extend across the chart
Creates rays (extending lines) for overnight and opening range levels that project forward from when they were established
Uses different colors and line styles for each level type (solid lines for daily levels, dashed for opening range)
Adds text labels showing the exact price values (PDH, PDL, ONH, ONL, ORH, ORL)
Time Markers:
Draws vertical dashed lines at key trading times: 10:00 AM, 11:30 AM, 1:00 PM, 2:30 PM, and 4:00 PM ET
Uses Eastern Time zone by default but allows customization
Customization Options:
Toggle each feature on/off independently
Customize colors for all line types
Adjust timezone settings
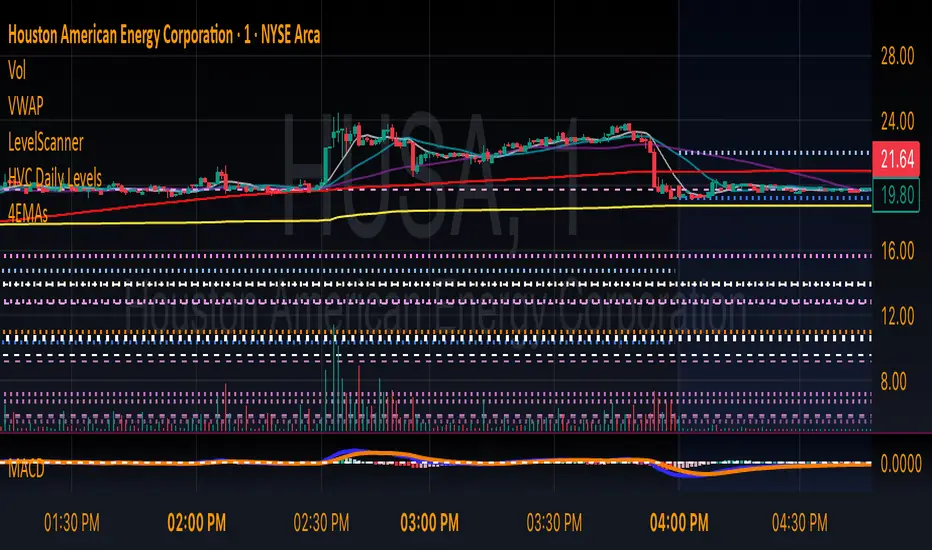
HVC Daily LevelsDaily High Volume Candle Levels Marked on all Timeframes
HVC Level Sentinel v6 — High Volume Candle Levels
HVC Level Sentinel v6 automatically detects and highlights “High Volume Candles” (HVCs) — bars with the highest trading volume in a rolling, user-defined window (e.g., 30 days). This tool helps you spot key price levels where significant trading activity occurred, which can act as important support or resistance zones.
Features
Customizable Lookback: Choose how many bars to look back for HVC detection (default: 30 days, adjustable).
Automatic Highlighting: HVC candles are highlighted on your chart with a customizable color.
Level Lines: Draws horizontal lines at the Open, High, Low, and Close of each recent HVC, so you can easily track these key levels.
Line Fading: Only the most recent N HVCs (user-adjustable) have lines, with older lines fading out or disappearing for clarity.
Per-Line Control: Turn on/off Open, High, Low, and Close lines individually in the settings.
Fully Customizable: Adjust colors, line styles, widths, and opacity to fit your chart style.
How It Works
On each new bar, the script checks if the current bar’s volume is the highest in the last N bars.
If so, it marks the bar as an HVC and draws lines at its O/H/L/C (if enabled).
You can highlight all HVCs historically, but only the most recent N will have lines for a clean, focused chart.
Use Cases
Identify major breakout or reversal points driven by high volume.
Track where institutional or “smart money” activity may have occurred.
Use HVC levels as dynamic support/resistance for entries, exits, or stop placement.
Tip :
Adjust the lookback window and number of HVCs with lines to match your trading style—shorter for active trading, longer for swing/position trading.