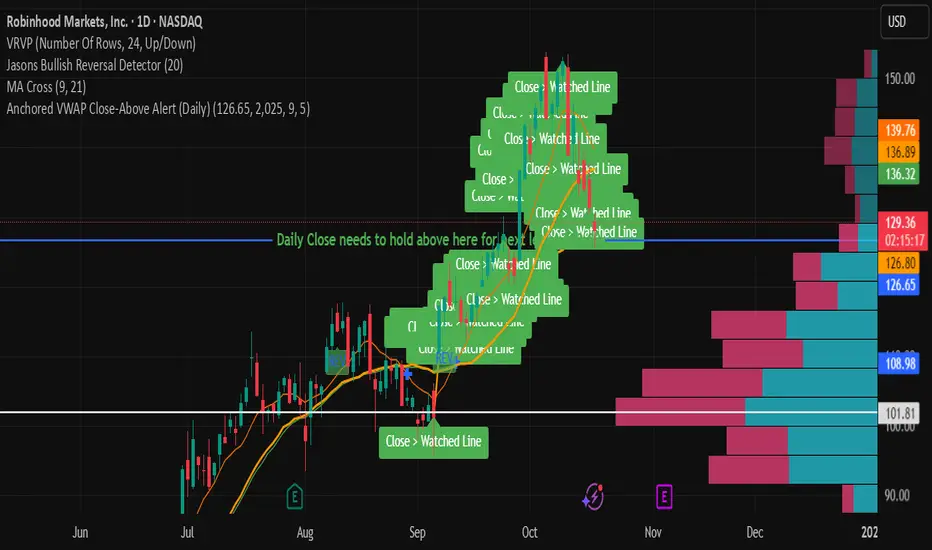
Anchored VWAP Close-Above Alert (Daily)This indicator is a daily anchored VWAP (Volume-Weighted Average Price) tracker that alerts you when price closes above a key pivot line you’ve defined — either dynamically (anchored VWAP from a date like 9/5) or statically (a fixed level like 126.65).
Here’s how each piece works:
1. The anchor date
You give it a date — say September 5, 2025. The script starts calculating VWAP from that day forward. That line represents the average price buyers and sellers have transacted at since that anchor. It’s a kind of “fair-value line” for that period.
2. The logic
Every bar after that date, it adds up (price × volume) and divides by total volume — giving a running VWAP from that starting point. You can instead lock it to a flat number (like 126.65) if you don’t want it recalculating.
3. The alert trigger
Once per day — when the daily candle closes — it checks:
“Did price close above my watched line?”
If yes, it fires an alert (and can draw a label) to tell you that the day’s candle reclaimed that level.
4. The why
That kind of move — a daily close reclaiming a major anchored VWAP — often signals a shift in sentiment or trend strength. Traders watch it to confirm rebounds or invalidations of downside moves.
So in your context:
You anchored to 9/5 (the downside pivot).
You want to know if price closes back above that VWAP (~126.65).
If it does, the alert lights up — confirming the “reclaim” you mentioned in your note.
It’s basically your guard dog for the daily close reclaim.
Search in scripts for "daily"
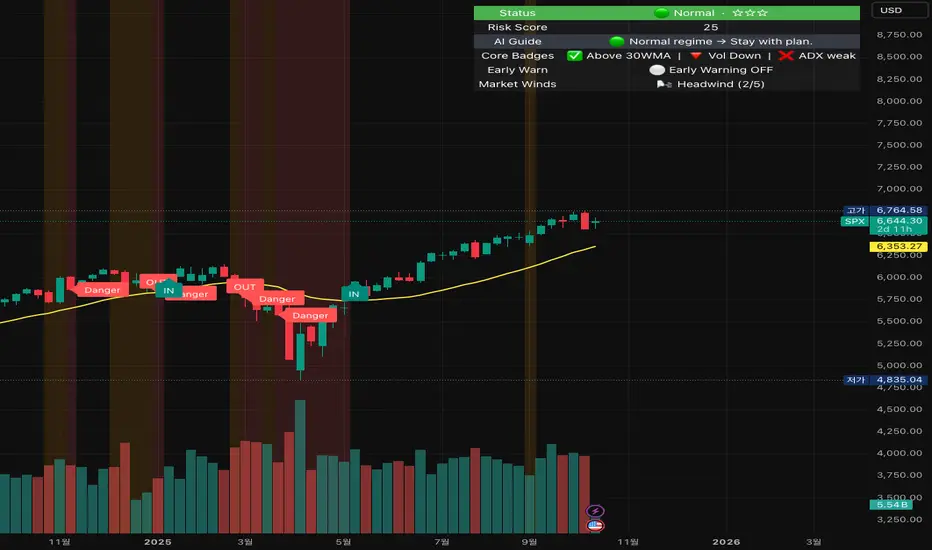
Crash Survival Indicator (SPX, Weekly/Daily)Short description
SPX-focused risk context tool using 30WMA/ATR/ADX and distance to 30WMA, with optional Hindenburg-Omen breadth and macro add-ons. Weekly is primary; Daily provides early-warning. Educational only.
Full description (English first)
What it is
Crash Survival Indicator (CSI) is a rules-based risk context indicator for the S&P 500 index (SPX). It helps keep decisions data-driven during stress by combining four weekly conditions into a weighted risk score and presenting them in a readable dashboard. Optional breadth (Hindenburg Omen cluster proxy) and macro add-ons give additional context. This is not a buy/sell system.
Why it’s original and useful
Weekly core with confirmation: Four classic conditions (30WMA regime, ATR(14) trend, ADX(14) > 20 & rising, and % distance from 30WMA) feed a 0–100 score. A 2-of-3 gate (WMA down / ATR up / ADX>20↑) must confirm before “Danger,” reducing false spikes.
Daily Early-Warning: A separate daily preview flags conditions approaching the Danger threshold (with a streak filter). It’s a heads-up only, not a timeframe switch.
Scope control to avoid confusion: Signals (labels/alerts) are restricted to SPX on Weekly/Daily by design. The dashboard can be shown SPX-only or on all symbols (configurable).
Clarity for all users: Beginner card view (plain badges) and Pro table view (detailed chips) improve readability without hiding logic.
How it works (mechanics)
Weekly core (primary frame)
30WMA regime: price vs 30-week WMA; IN/OUT labels on crosses.
ATR(14): rising ATR counts as volatility stress.
ADX(14): risk weight when ADX > 20 and rising.
Distance to 30WMA: % deviation flags potential overheat.
Scoring & thresholds: Weighted sum → Caution ≥ 40, Danger ≥ 60 (defaults). Danger also requires the 2-of-3 gate above.
Daily Early-Warning: Uses daily versions of the same ideas to detect near-Danger conditions with a streak requirement (heads-up only).
Optional breadth (Hindenburg Omen proxy): Elevated new highs and new lows while the NYSE Composite is above its 50DMA, with deteriorating breadth momentum; requires cluster confirmation to reduce noise.
Optional macro add-ons: VIX regime, DXY strength, credit stress (HYG/LQD vs MA), and TNX trend each add adjustable weights.
Inputs (overview)
Scope & Mode: SPX primary/alt tickers; signal restriction to SPX + Weekly/Daily; dashboard visibility (SPX-only vs all symbols); Beginner or Pro display.
Label Policy: Weekly-only / Weekly-core + Daily-early (default) / All (W/D); lookback windows and minimum bar gaps to prevent clutter.
Scoring: Weights for 30WMA down, ATR up, ADX>20↑, Overheat; Caution/Danger thresholds; Overheat % (distance).
Hindenburg Omen (optional): NYSE Composite and High/Low/AD series; cluster requirement.
Macro add-ons (optional): Symbols + weights for VIX, DXY, HYG, LQD, TNX.
Early Warning (Daily): Near-Danger buffer and streak length.
Visuals & Alerts: Background shading, labels on/off, font size, dashboard position, runtime
alerts.
Alerts (contextual; not trade signals)
OUT — 30WMA Down Break (Weekly)
IN — 30WMA Reclaim (Weekly)
Risk ≥ Danger + 2-of-3 Gate
Hindenburg Omen Cluster detected
Early Warning (Daily near Danger, streak)
Alerts provide context only. They are not buy/sell instructions.
Intended use and limitations
Use the Weekly panel for decisions; treat Daily Early-Warning as a heads-up.
Best used as risk framing alongside your own process (position sizing, liquidity, event risk).
Breadth/macro inputs depend on your data source; if unavailable, keep add-ons off.
No forward-looking data or lookahead; designed to avoid repainting.
Disclaimer
For educational purposes only. Not financial advice, not an investment recommendation, and not a solicitation to buy or sell any security. Past performance does not guarantee future results. Users are solely responsible for their decisions and regulatory compliance.
Optional Korean addendum (append after English)
한국어 안내 요약: 본 지표는 위기 상황에서 감정보다 데이터를 우선할 수 있도록 리스크 맥락을 제공합니다. 주봉이 핵심, 일봉은 조기경보(Heads-up)이며, 매수/매도 신호가 아닙니다. 심프님의 프로토타입 철학을 살리되 SPX 한정 신호, 라벨/알림 정책, 선택형 오멘/매크로 기능, 초보/프로 대시보드 등 가독성을 개선했습니다. 투자 판단과 책임은 전적으로 사용자에게 있습니다.
Privacy & format
Visibility: Public
Source: Protected (no source disclosure), compliant with Publishing Rules
Language: English title & description first; Korean addendum optional
Screenshot guidance (for your gallery)
Weekly SPX showing dashboard at “Danger” with an OUT label.
Weekly SPX with Hindenburg Omen Cluster label and shaded background.
Daily SPX with Early-Warning label as weekly approaches Danger.
Beginner vs Pro dashboard comparison on SPX.
Author certification (paste if needed)
I certify this publication contains no promotions, links, or solicitations, complies with TradingView House Rules and Script Publishing Rules, uses Pine v5, and is intended solely for educational purposes with no performance claims.
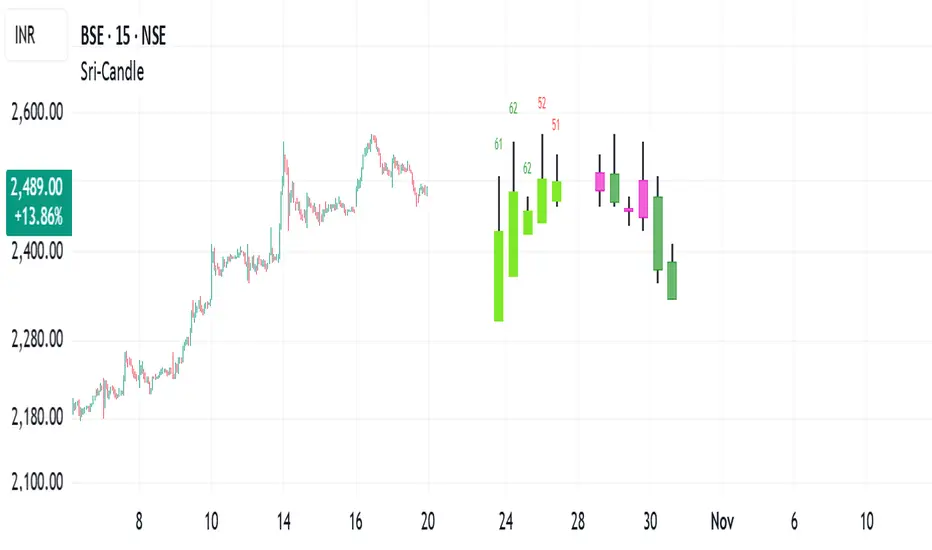
Sri - Daily & Weekly Candle Strength Sri - Daily & Weekly Candle Strength
Short Title: Sri-Candle
Overlay: Yes
Description:
The Sri - Daily & Weekly Candle Strength indicator is designed to visually display recent daily and weekly candle activity directly on your chart, highlighting buyer and seller dominance for each candle. It helps traders quickly assess the strength of bullish vs bearish pressure over recent periods and can be used with both Normal and Heikin Ashi candles. This tool is particularly useful for swing traders, position traders, and technical analysts who want a clear view of candle momentum without switching timeframes.
Features:
Multi-Timeframe Candles:
Displays the last several daily candles and weekly candles on your chart.
Supports Normal or Heikin Ashi candles for both daily and weekly views.
Candle Strength Analysis:
Calculates buyer strength and seller strength as percentages based on candle body relative to the total candle range.
Highlights the dominant strength (higher of buyer or seller) above each candle.
Option to round dominant strength percentages to whole numbers.
Customizable Colors:
Set separate bullish and bearish colors for daily and weekly candles.
Customize wick colors independently for daily and weekly candles.
Positioning and Layout Options:
Adjust horizontal offset, candle thickness, and gap between candles for both daily and weekly candles.
Choose label positions for date labels (Top, Bottom, Absolute level).
Flexible Text Display:
Choose label text size (Tiny, Small, Normal, Large, Huge).
Daily candles display the day of the month on the candle optionally.
Dynamic Candle Rendering:
Each candle is plotted as a box with wicks, accurately reflecting open, high, low, and close.
Dominant strength percentage label is colored green for bullish dominance and red for bearish dominance.
Inputs:
Daily Settings:
Show Daily Candles – Toggle daily candle visibility.
Daily Candle Type – Choose between Normal or Heikin Ashi.
Daily Timeframe – Select Daily (D), Weekly (W), or Monthly (M).
Bull Candle Color (D) – Color for bullish daily candles.
Bear Candle Color (D) – Color for bearish daily candles.
Wick Color (D) – Color for candle wicks.
Horizontal Offset (D) – Distance from current bar to start drawing.
Candle Thickness (D) – Width of candle boxes.
Gap Between Candles (D) – Space between consecutive candles.
Daily Label Position – Position for the date label.
Absolute Level – Y-axis level when using absolute label position.
Strength Label Text Size – Size of the dominant strength label.
Round Dominant % (No Decimals) – Round the displayed strength to whole numbers.
Weekly Settings:
Show Weekly Candles – Toggle weekly candle visibility.
Weekly Candle Type – Choose Normal or Heikin Ashi.
Weekly Timeframe – Select Daily (D), Weekly (W), or Monthly (M).
Bull Candle Color (W) – Color for bullish weekly candles.
Bear Candle Color (W) – Color for bearish weekly candles.
Wick Color (W) – Wick color for weekly candles.
Horizontal Offset (W) – Distance from current bar for weekly candles.
Candle Thickness (W) – Width of weekly candle boxes.
Gap Between Candles (W) – Space between consecutive weekly candles.
How It Works:
The script fetches candle data using the request.security() function for the selected timeframe and type (Normal or Heikin Ashi).
Each candle’s buyer and seller strength is calculated as:
Buyer Strength (%) = ((Close - Low) / (High - Low)) * 100
Seller Strength (%) = ((High - Close) / (High - Low)) * 100
Candles are drawn as boxes with wicks on the chart at the specified horizontal offset.
The dominant strength is displayed above each candle, colored green for bullish dominance or red for bearish dominance.
Daily candles can optionally show the day of the month as a label.
Use Cases:
Quickly identify recent bullish or bearish trends on daily and weekly timeframes.
Compare strength of buyers vs sellers across multiple periods.
Combine with other technical indicators for multi-timeframe analysis.
ICT Daily Levels & Liquidity Zones [HatefBW]ICT Daily Levels & Liquidity Zones
This indicator automatically detects and plots the daily high and low levels for the current day and the two previous days.
Each level dynamically tracks the exact candle that created it, allowing traders to identify where short-term liquidity pools form across multiple timeframes.
What makes this tool unique:
• Three-day structure: Displays current, previous, and 2-day-old highs/lows for contextual price action.
• Dynamic mapping: On lower timeframes, each level aligns precisely with the candle that created the daily high or low.
• Full customization: Traders can toggle each day’s levels, colors, label size, and extension behavior independently.
• Adaptive logic: Lines automatically extend or stay fixed depending on the chosen setting, avoiding chart clutter.
This tool helps ICT traders and smart money practitioners visualize daily liquidity zones — potential areas of stop hunts or institutional targeting.
The script is originally coded by @HatefBW from scratch, with no reused or modified open-source code

BMSB Watchlist Alert - Daily w/ 1% Proximity# Bull Market Support Band - Daily Updates with Proximity Alerts
## Overview
This indicator tracks the Bull Market Support Band (20-week SMA and 21-week EMA) with daily resolution updates and proximity warnings. The weekly moving averages update every day on your chart, giving you more frequent signals than traditional weekly-only scripts.
## What It Does
The script monitors price action relative to the BMSB and generates alerts for:
- Price crossing above or below either the 20W SMA or 21W EMA
- Price coming within 1% of either moving average (early warning system)
This proximity feature is useful for catching potential support/resistance tests before they actually happen, giving you advance notice to prepare for entries or exits.
## Key Features
- Weekly MAs that update daily for more responsive monitoring
- Configurable proximity threshold (default 1%, adjustable from 0.1% to 5%)
- Visual proximity zones shown as dotted lines around each MA
- Color-coded background highlighting (green when above both MAs, red when below both, orange when in proximity zone)
- On-chart labels for crosses and proximity warnings
- Status table showing current position relative to the band
## Setup for Watchlist Alerts
1. Add the indicator to any chart
2. Create alerts using these conditions:
- "BMSB Cross Alert" - fires on actual crosses
- "BMSB Proximity Alert" - fires when entering the 1% zone
3. Set interval to 1 day (recommended) or 4 hour for more frequent checks
4. Use "Once Per Bar Close" for the trigger option
5. Apply the same alert to your entire watchlist
## Settings
You can toggle on/off:
- Cross above alerts
- Cross below alerts
- Proximity alerts
- Proximity percentage adjustment
- Visual elements (labels, MA lines, proximity zones)
## Notes
The BMSB is commonly used in crypto markets to identify bull market pullback support levels. This implementation adds the proximity warning system to help you anticipate potential tests of these key levels rather than waiting for confirmed crosses.
Works on any timeframe but designed for daily monitoring of weekly moving averages.

NS ND - EVR - Daily Bias - TRFxVolume & Price Action Signals
What It Does
Combines three proven trading methodologies: Effort vs Result (EVR), No Supply/No Demand (NS/ND), and Daily Bias tracking for intraday traders.
Features
Effort vs Result (EVR)
- **Bullish**: Green triangle below bar when price sweeps previous low with high volume and significant wick
- **Bearish**: Red triangle above bar when price sweeps previous high with high volume and significant wick
- Identifies potential reversals where volume doesn't match price movement
No Supply / No Demand (NS/ND)
- **No Demand (Red dot)**: Up-candle with declining volume - buyers weakening
- **No Supply (Green dot)**: Down-candle with declining volume - sellers weakening
- Grey dots = unconfirmed, colored dots = confirmed within lookahead period
- Based on Volume Spread Analysis (VSA) principles
Daily Bias Label
Top-right corner shows market direction:
- **BULLISH ↑** - Closed above Previous Day High
- **BEARISH ↓** - Closed below Previous Day Low
- **BULLISH/BEARISH REV** - Swept level but closed back inside
- **RANGE ↔** - Trading between PDH/PDL
## Settings
- **EVR**: Toggle on/off, volume multiplier, wick %, inside bars, transparency
- **NS/ND**: Toggle on/off, lookahead bars (default: 10)
- **Daily Bias**: Toggle label display
## Best For
✓ Intraday trading (1m-1h timeframes)
✓ Reversal setups
✓ Volume analysis
✓ Confluence trading (all signals align)
How to Use
1. Enable components you want (all can be toggled independently)
2. Trade EVR signals in direction of Daily Bias
3. Look for NS/ND confirmation at key levels
4. Wait for colored dots (confirmed signals) over grey (unconfirmed)
**Note**: Works on intraday timeframes only. NS/ND signals may repaint during confirmation period.

CRT + Daily Bias - Milana Trades
This indicator merges Candle Range Theory (CRT) with a Daily & Weekly Bias model, offering traders a complete view of both short-term price traps and higher-timeframe market direction. It is designed to highlight potential liquidity traps, reversals, and directional bias in a structured and visually intuitive format.
🔹 1. Candle Range Theory (CRT)
The CRT module detects false breakout candles (trap candles) and plots key high/low levels to mark significant turning points.
Bullish CRT
Occurs when price makes a lower low than the previous candle but closes bullish (close > open).
→ Suggests a possible upside reversal.
Bearish CRT
Occurs when price makes a higher high than the previous candle but closes bearish (close < open).
→ Suggests a possible downside reversal.
When a CRT is detected:
Dotted lines and levels are drawn from the trap candle’s high/low.
Labels such as CRT, CRT H, and CRT L appear for easy visualization.
Previous CRT structures can auto-clear when new traps form.
Alerts trigger once a trap is confirmed on candle close.
🔹 2. Daily & Weekly Bias
The Bias module determines market direction using daily and weekly candle structure. It evaluates:
Breaks above/below previous highs and lows.
Failed breaks (false moves beyond prior levels).
Inside bars (neutral range conditions).
Bias Logic Summary:
Close Above Previous High → Bullish
Close Below Previous Low → Bearish
Failed Break Above → Bearish
Failed Break Below → Bullish
Inside Range → Neutral
Both Daily and Weekly bias values are displayed in an on-chart table for quick context.
⚠️ Note:
The bias readings are technical references, not trading signals. Always combine them with your own analysis, context, and market awareness.
🔹 3. Bias Table
A clean table (top-right by default) displays:
Timeframe (Daily / Weekly)
Current Bias (Bullish, Bearish, Neutral)
Reason for bias (breakout, failure, or inside bar)
The table is fully customizable, allowing you to adjust:
Header and text colors
Background and border styles
Display of specific timeframes (Daily / Weekly)
🔹 4. Alerts
Real-time alerts notify you when:
Bullish CRT is detected
Bearish CRT is detected
Alerts only trigger on candle close for accuracy and reduced false signals.
🔹 5. Settings
CRT Module
Length: Number of bars CRT levels extend.
Clear Broken: Automatically removes old CRT levels when new traps form.
Trap Candle Colors: Customize bullish/bearish candle highlights.
Line & Label Style: Full control of label size, color, and line styling.
Bias Module
Show Table: Toggle on/off.
Show Daily / Weekly Bias: Select which to display.
Color Customization: Set colors for bias states and table design.
🔹 6. How to Use
Watch for CRT labels forming near major or liquidity areas.
Check the Daily/Weekly Bias Table for trend confirmation.
Align CRT signals with the bias direction for higher-probability setups.
Use alerts to stay informed without constantly monitoring charts.

Dynamic Levels This indicator plots key price levels (Open, High, Low, Mid, Close) from multiple higher timeframes (Monday, Daily, Weekly, Monthly, Yearly).
It allows you to track how price interacts with important reference levels without switching timeframes.
🔑 Features
✅ Monday levels (MO, MH, MM)
By default: shows the last completed Monday (fixed values).
Option: “live mode” to update Monday High/Low/Mid while Monday’s candle is forming.
✅ Daily levels (DO, DH, DL, DM, DC)
Live: Daily High/Low/Mid update dynamically while today’s candle is forming.
Previous Daily Close (DC) is always fixed.
✅ Weekly levels (WO, WH, WL, WM)
Live: Weekly High/Low/Mid update dynamically while this week’s candle is forming.
Weekly Open is fixed.
✅ Monthly levels (MO(n), MH(n-1), ML(n-1), MM(n-1), MC(n-1))
Shows last completed month’s values (constant, never changing).
Current Monthly Open is also shown (naturally fixed).
✅ Yearly levels (YO(n), YH(n-1), YL(n-1), YM(n-1), YC(n-1))
Shows last completed year’s values (constant, never changing).
Current Yearly Open is also shown (naturally fixed).
🎨 Customization
Toggle each level (on/off) in indicator settings.
Individual color settings for Monday, Daily, Weekly, Monthly, and Yearly.
Adjustable line width and transparency.
Optional short labels (MO, DO, WM, etc.) displayed on the right side of the chart.
🔄 Dynamic Logic
Daily and Weekly → update dynamically while their candle is forming.
Monday, Monthly, and Yearly → use fixed values from the last completed bar (do not “breathe”).
📌 Use cases
Quickly see where price stands relative to previous close, current open, or mid-levels.
Use Monday Open/High/Mid as strong intraday references.
Use Monthly/Yearly levels as long-term support/resistance zones.
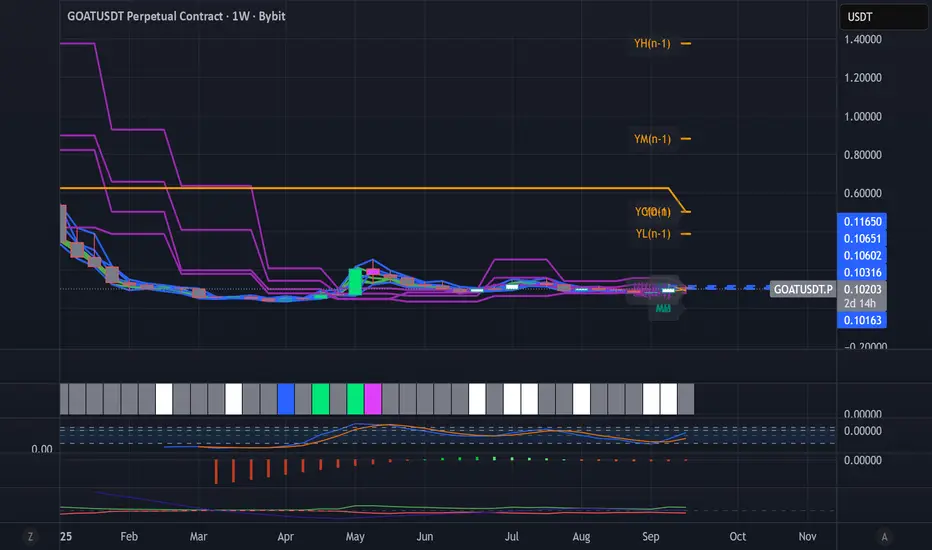
Key Levels: Daily, Weekly, Monthly [BackQuant]Key Levels: Daily, Weekly, Monthly
Map the market’s “memory” in one glance—yesterday’s range, this week’s chosen day high/low, and D/W/M opens—then auto-clean levels once they break.
What it does
This tool plots three families of high-signal reference lines and keeps them tidy as price evolves:
Chosen Day High/Low (per week) — Pick a weekday (e.g., Monday). For each past week, the script records that day’s session high and low and projects them forward for a configurable number of bars. These act like “memory levels” that price often revisits.
Daily / Weekly / Monthly Opens — Plots the opening price of each new day, week, and month with separate styling. These opens frequently behave like magnets/flip lines intraday and anchors for regime on higher timeframes.
Auto-pruning — When price breaks a stored level, the script can automatically remove it to reduce clutter and refocus you on still-active lines. See: (broken levels removed).
Why these levels matter
Liquidity pockets — Prior day’s high/low and the daily open concentrate stops and pending orders. Mapping them quickly reveals likely sweep or fade zones. Example: previous day highs + daily open highlighting liquidity:
Context & regime — Monthly opens frame macro bias; trading above a rising cluster of monthly opens vs. below gives a clean top-down read. Example: monthly-only “macro outlook” view:
Cleaner charts — Auto-remove broken lines so you focus on what still matters right now.
What it plots (at a glance)
Past Chosen Day High/Low for up to N prior weeks (your choice), extended right.
Current Daily Open , Weekly Open , and Monthly Open , each with its own color, label, and forward extension.
Optional short labels (e.g., “Mon High”) or full labels (with week/month info).
How breaks are detected & cleaned
You control both the evidence and the timing of a “break”:
Break uses — Choose Close (more conservative) or Wick (more sensitive).
Inclusive? — If enabled, equality counts (≥ high or ≤ low). If disabled, you need a strict cross.
Allow intraday breaks? — If on, a level can break during the tracked day; if off, the script only counts breaks after the session completes.
Remove Broken Levels — When a break is confirmed, the line/label is deleted automatically. (See the demo: )
Quick start
Pick a Day of Week to Track (e.g., Monday).
Set how many weeks back to show (e.g., 8–10).
Choose how far to extend each family (bars to the right for chosen-day H/L and D/W/M opens).
Decide if a break uses Close or Wick , and whether equality counts.
Toggle Remove Broken Levels to keep the chart clean automatically.
Tips by use-case
Intraday bias — Watch the Daily Open as a magnet/flip. If price gaps above and holds, pullbacks to the daily open often decide direction. Pair with last day’s high/low for sweep→reversal or true breakout cues. See:
Weekly structure — Track the week’s chosen day (e.g., Monday) high/low across prior weeks. If price stalls near a cluster of old “Monday Highs,” look for sweep/reject patterns or continuation on reclaim.
Macro regime — Hide daily/weekly lines and keep only Monthly Opens to read bigger cycles at a glance (BTC/crypto especially). Example:
Customization
Use wicks or bodies for highs/lows (wicks capture extremes; bodies are stricter).
Line style & thickness — solid/dashed/dotted, width 1–5, plus global transparency.
Labels — Abbreviated (“Mon High”, “D Open”) or full (month/week/day info).
Color scheme — Separate colors for highs, lows, and each of D/W/M opens.
Capacity controls — Set how many daily/weekly/monthly opens and how many weeks of chosen-day H/L to keep visible.
What’s under the hood
On your selected weekday, the script records that session’s true high and true low (using wicks or body-based extremes—your choice), then projects a horizontal line forward for the next bars.
At each new day/week/month , it records the opening price and projects that line forward as well.
Each bar, the script checks your “break” rules; once broken, lines/labels are removed if auto-cleaning is on.
Everything updates in real time; past levels don’t repaint after the session finishes.
Recommended presets
Day trading — Weeks back: 6–10; extend D/W opens: 50–100 bars; Break uses: Close ; Inclusive: off; Auto-remove: on.
Swing — Fewer daily opens, more weekly opens (2–6), and 8–12 weeks of chosen-day H/L.
Macro — Show only Monthly Opens (1–6 months), dashed style, thicker lines for clarity.
Reading the examples
Broken lines disappear — decluttering in action:
Macro outlook — monthly opens as cycle rails:
Liquidity map — previous day highs + daily open:
Final note
These are not “signals”—they’re reference points that many participants watch. By standardising how you draw them and automatically clearing the ones that no longer matter, you turn a noisy chart into a focused map: where liquidity likely sits, where price memory lives, and which lines are still in play.

Spiderlines BTCUSD - daily/weekly📘 Documentation – Daily and Weekly Spider Lines for Bitcoin
🔹 Purpose of the Script
This script draws dynamic “Spider Lines” in the Bitcoin chart.
The lines connect certain historical candles with a reference candle and extend to the right.
These act as guideline levels that can serve as potential support or resistance zones.
🔹 How It Works
The script operates in two modes, depending on the active chart timeframe:
Weekly Mode (timeframe.isweekly)
The reference date is July 1, 2019.
The number of weeks since that date is calculated.
This defines the connection candle (connection_candle).
Several predefined offsets (e.g., +32, +34, +36 …) are added to the reference to determine starting candles.
Lines are drawn from these candles toward the connection candle.
→ Line color: green
Daily Mode (timeframe.isdaily)
Same reference date: July 1, 2019.
The number of days since that date is calculated.
Again, a connection candle is set.
A different set of offsets (e.g., +224, +238, +252 …) defines the starting candles.
Lines are drawn accordingly.
→ Line color: red
🔹 Line Logic
Each line connects:
Start → bar_index at high
End → bar_index at close
Lines are extended indefinitely to the right (extend.right).
Appearance: dashed style, width 2.
🔹 Error Handling
If a calculated candle index does not exist in the chart history (e.g., chart data does not go back far enough),
a label is plotted in the chart showing the message:
"Daily idx out of range: 252"
This way, missing lines can be diagnosed easily.
🔹 Color Convention
Weekly Spider Lines → Green
Daily Spider Lines → Red
🔹 Use Cases
Visualization of historical cyclic line patterns.
Helps in technical chart analysis: spotting potential reaction zones in price movement.
Designed mainly for long-term traders and analysts observing Bitcoin in Daily or Weekly timeframes.
🔹 Limitations
Works only on Daily and Weekly charts.
Requires chart data going back to July 1, 2019.
Based purely on fixed offsets → not a classical indicator like Moving Averages or RSI.

EMA + RSI Daily Bias Clarity Indi📊 EMA + RSI Daily Bias • Clarity Panel
This indicator is built for clarity, structure, and confidence in trading.
It combines EMAs, RSI, and a Daily Bias filter into one panel that helps you quickly understand trend, momentum, and alignment without cluttering your chart.
It does not provide signals or financial advice — instead, it simplifies your decision-making process by presenting conditions in a clear format.
🔧 Features
📈 Customizable EMAs (Fast & Slow)
Define short-term vs. medium-term trend direction.
Adjust the lengths for scalping, intraday, or swing trading.
🎯 RSI Integration
Tracks momentum on your active timeframe.
Highlights overbought (OB) and oversold (OS) conditions.
Used to filter entries and avoid chasing stretched moves.
🧭 Daily Bias (Higher Timeframe RSI)
Pulls RSI from the Daily chart (or chosen HTF).
Helps confirm if your local trade setup is aligned with higher timeframe momentum.
✨ Clarity Panel with Emojis
Displays Trend, HTF Bias, RSI reading, and State.
States include:
⏳ WAIT → No alignment or unclear conditions.
🟢 / 🔴 CONFIRM → Trend, RSI, and bias all align for a setup.
💰 COLLECT → RSI stretched to OB/OS, take partials or be cautious.
⚡ Optional Chart Markers
BUY/SELL labels appear when conditions align.
Alerts can be enabled for CONFIRM and COLLECT conditions.
💡 How to Use
Start with EMAs → Check if price is trending above or below EMAs to determine short-term direction.
Look at Daily Bias → See if RSI bias from higher timeframe (Daily by default) agrees with your local setup.
Check RSI → If RSI is neutral, WAIT. If RSI confirms momentum with trend + bias, CONFIRM. If RSI is stretched into OB/OS, COLLECT.
Use Panel for Quick Reads → The panel gives you a “dashboard” view of conditions so you don’t second-guess.
Combine with Your Own Strategy → This script is best used as a clarity filter to stay disciplined, not as a standalone signal generator.
📊 Example Workflow
Price above both EMAs ✅
Daily Bias shows BULL ✅
RSI at 62 (above midline, not yet overbought) ✅
→ Panel shows 🟢 CONFIRM → consider entering long.
Later, RSI rises to 72 (overbought) → Panel switches to 💰 COLLECT → take profits or tighten stops.
⚠️ Disclaimer
This script is for clarity and educational purposes only.
It does not provide financial advice, signals, or guaranteed profits.
Always use proper risk management and combine with your own trading plan.

ATR - Daily vs CurrentThis script provides a comprehensive view of the Average True Range (ATR) for both the current trading day and a multi-day lookback, giving traders real-time insight into volatility and potential daily price movement. Key features include:
ATR Table:
- Average ATR: 14-day ATR, representing typical daily volatility.
- Today’s ATR: Current day ATR, showing how much the price has moved so far.
- % of Avg ATR Used: Calculates the percentage of the average ATR that has been realized today, helping assess if a move is near exhaustion.
Possible Daily ATR Range Lines:
- Horizontal lines drawn from today’s open representing ±50% and ±100% of the 14-day ATR, providing a visual guide for potential price extremes.
- Lines are updated once per day and extend from the right to the left, clearly marking possible intraday range limits.
Color-coded for clarity:
- Green = +50% ATR
- Red = -50% ATR
- Lime = +100% ATR
- Maroon = -100% ATR
Usage:
- Useful for day traders and intraday scalpers to track volatility and potential price targets.
- Helps in risk management, setting stops, and estimating realistic intraday moves.
- Provides visual cues for when price has consumed a significant portion of expected daily range.
Note: ATR is a statistical measure; the lines represent possible ranges, not guaranteed targets. Daily market conditions may prevent price from reaching full ATR.

Emre AOI Zonen Daily & Weekly (mit Alerts, max 60 Pips)This TradingView indicator automatically highlights Areas of Interest (AOI) for Forex or other markets on Daily and Weekly timeframes. It identifies zones based on the high and low of the previous period, but only includes zones with a width of 60 pips or less.
Features:
Daily AOI Zones in blue, Weekly AOI Zones in yellow with 20% opacity, so candlesticks remain visible.
Persistent zones: AOI boxes stay on the chart until the price breaks the zone.
Multiple zones: Supports storing multiple Daily and Weekly AOIs simultaneously.
Break Alerts: Sends alerts whenever a Daily or Weekly AOI is broken, helping traders spot key levels in real-time.
Fully automated: No manual drawing needed; zones are updated and extended automatically.
Use Case:
Ideal for traders using a top-down approach, combining Weekly trend analysis with Daily entry signals. Helps identify support/resistance, supply/demand zones, and critical price levels efficiently.

DEE's Indicator v2 — Daily Range, Averages & Previous High/Low🇺🇸 English
This indicator is designed to help traders analyze market volatility and daily price ranges.
It includes the following features:
• 5-bar analysis: Shows high-low ranges and percentage changes of the last 5 bars.
• Daily Average Range: Calculates daily average ranges based on the last 5 bars.
• Daily AVG Lines: Plots expected top and bottom range levels based on the daily average.
• Previous Day High/Low: Automatically draws lines from the previous day's high and low.
• Timeframe Separators: Adds visual separators between days, months, and years.
• Optional arrows: Displays arrow markers for the last detected bars used in the calculation.
Use cases:
● Intraday traders can quickly measure daily progress compared to the average daily range.
● Swing traders can identify support/resistance levels from previous daily highs and lows.
● Risk managers can monitor when current volatility deviates significantly from the average.
⚠️ Notes:
The script does not generate buy/sell signals; it provides analytical tools only.
All displayed information is for visual/educational purposes and should be combined with your own trading strategy.
👉 Don’t forget to adjust the settings to suit your needs.
If you are using a multi-chart layout with different timeframes and apply this indicator to each chart, the 5-bar data will be calculated separately based on each chart’s TF. However, the “Daily AVG” section will always show the same value for the 1D timeframe.
🇺🇿 O‘zbekcha
Ushbu indikator treyderlarga bozor volatilligi va kundalik narx diapazonlarini tahlil qilishda yordam berish uchun mo‘ljallangan.
Unda quyidagi funksiyalar mavjud:
• 5-bar tahlili: So‘nggi 5 ta bar diapazoni (high–low) va foiz o‘zgarishini ko‘rsatadi.
• Kundalik o‘rtacha diapazon: So‘nggi 5 ta bar asosida o‘rtacha kundalik diapazonni hisoblaydi.
• AVG Lines: Daily AVGning yuqori va pastki diapazon darajalarini chizadi.
• Oldingi kunning High/Low darajalari: Avtomatik ravishda oldingi kunning high va low darajalarini chizadi.
• Vaqt ajratgichlari: Kunlar, oylar va yillar orasiga vizual ajratgich qo‘shadi.
• Ixtiyoriy strelkalar: Hisoblash uchun foydalanilgan so‘nggi barlarda strelka belgilarini ko‘rsatadi.
Qo‘llanilishi:
● Intraday treyderlar kundalik natijani o‘rtacha kundalik diapazon bilan tezda solishtira olishadi.
● Swing treyderlar oldingi kunning high va low darajalaridan qo‘llab-quvvatlash/qarshilik darajalarini aniqlashlari mumkin.
● Risk-menejerlar hozirgi volatillik o‘rtachadan sezilarli darajada og‘ib ketganini kuzatishlari mumkin.
⚠️ Eslatma:
Ushbu indikator sotib olish/sotish signallarini bermaydi; u faqat tahliliy vosita sifatida ishlatiladi.
Ko‘rsatilgan barcha ma’lumotlar vizual/ta’limiy maqsadlarda mo‘ljallangan bo‘lib, o‘z strategiyangiz bilan birgalikda qo‘llanilishi lozim.
👉 Sozlamalarni ehtiyojlaringizga qarab moslashtirishni unutmang.
Agar siz multi-chart rejimida turli timeframelar bilan ishlasangiz va ushbu indikatorni har bir grafikda qo‘llasangiz, 5 ta bar haqidagi ma’lumotlar har bir grafikning o‘z TFiga qarab hisoblanadi. Ammo “Daily AVG” bo‘limida esa faqat 1D timeframe uchun bir xil qiymat ko‘rsatiladi.
🇷🇺 Русский
Этот индикатор предназначен для помощи трейдерам в анализе волатильности рынка и дневных ценовых диапазонов.
Он включает в себя следующие функции:
• Анализ 5 свечей: Показывает диапазон high–low и процентные изменения последних 5 свечей.
• Средний дневной диапазон: Рассчитывает средний дневной диапазон на основе последних 5 свечей.
• Линии среднего диапазона (AVG Lines): Строит ожидаемые верхние и нижние уровни диапазона на основе среднего дневного значения.
• Максимум/минимум предыдущего дня: Автоматически наносит линии с уровнями high и low предыдущего дня.
• Разделители временных интервалов: Добавляет визуальные разделители между днями, месяцами и годами.
• Опциональные стрелки: Показывает стрелки на последних свечах, использованных в расчётах.
Применение:
● Интрадей-трейдеры могут быстро измерять дневное движение по сравнению со средним дневным диапазоном.
● Свинг-трейдеры могут определять уровни поддержки/сопротивления по максимумам и минимумам предыдущего дня.
● Риск-менеджеры могут контролировать ситуации, когда текущая волатильность значительно отклоняется от среднего.
⚠️ Примечания:
Этот индикатор не генерирует сигналы на покупку/продажу; он предоставляет только аналитические инструменты.
Вся отображаемая информация предназначена для визуальных/образовательных целей и должна использоваться совместно с вашей торговой стратегией.
👉 Не забудьте настроить параметры под свои нужды.
Если вы работаете в режиме мульти-графика с разными таймфреймами и применяете этот индикатор на каждом графике, данные по 5 барам будут рассчитываться отдельно для каждого ТФ. Однако в разделе “Daily AVG” всегда отображается одно и то же значение для таймфрейма 1D.
© Dilshod Nurmatov Shuhratovich | deetradesonline | 2025

Volume Spikes + Daily VWAP SD BandsVolume Spikes + Daily VWAP SD Bands
This indicator combines volume spike detection to help traders identify potential absorption zones with daily VWAP and standard deviation bands , key price levels, continuation opportunities, and possible institutional bias.
Features:
Volume Spike Detection
Highlights candles with unusually high volume relative to a configurable SMA.
Optional filters:
Local highs/lows only (Only Use Valid Highs & Lows)
Candle shapes: Hammer / Shooter only
Candle color match: bullish spikes on green, bearish on red
Plots small circles above/below bars for bullish and bearish volume spikes.
Alerts available for both bullish and bearish spikes.
Interpretation: Volume spikes at local highs/lows can indicate absorption, where one side absorbs aggressive buying/selling pressure.
Daily VWAP
Calculates volume-weighted average price (VWAP) for the current day.
Optionally shows previous day’s VWAP for reference.
Plot lines are customizable with optional circles on lines for visual clarity.
Labels on the last bar show exact VWAP values.
Institutional Bias Insight: Price above both current and previous VWAPs may indicate bullish positioning; price below both VWAPs may indicate bearish positioning. Many professional traders consider this a clue to institutional bias, but it’s not guaranteed. Always confirm with volume, delta, or orderflow analysis.
Standard Deviation Bands
Optional x1 and x2 SD bands around the daily VWAP.
Visual fill between bands shows price volatility zones.
Can be used to identify potential support/resistance or absorption zones.
Use Case: Price bounces off first SD band may indicate continuation signals, especially when volume spikes occur at those levels.
Customizable Visuals
Colors for bullish and bearish volume spikes
VWAP and SD band colors and thickness
Optional circles and filled bands for better readability
Alerts
Bullish / Bearish Volume Spikes
Supports TradingView alert system for automated notifications
Advanced Use Cases:
Combine with Cumulative Delta or Orderflow tools to confirm true absorption zones.
Identify high-volume rejection candles signaling possible trend continuation.
Use VWAP positioning relative to price to assess potential institutional bias, keeping in mind it is probabilistic, not guaranteed.
Visualize intraday VWAP levels and volatility with SD bands for better trade timing.
Settings: Fully customizable, including volume multiplier, SMA length, session filter, candle shape, color options, and VWAP/SD display preferences.

Weekly and Daily EMA levelsThis Pine Script indicator provides important weekly and daily levels for lower time frame traders, whom trades based on reaction of these levels.
Dedicated to Prof Michael G
Key Features:
Multi-timeframe EMAs: Shows 12, 21, 50, 100, and 200 period EMAs from both Weekly and Daily timeframes
Horizontal dotted lines: Uses plot.style_linebr to create the dotted/dashed line effect
Works on all timeframes: The lines will appear on any chart timeframe you're viewing
Customizable: Individual toggles for each EMA period and timeframe
Settings Available:
Toggle Weekly/Daily EMAs on/off
Enable/disable individual EMA periods (12, 21, 50, 100, 200)
Customize colors for each EMA line
Adjust line width
Optional labels showing current EMA values
How to Use:
Copy the code into TradingView's Pine Editor
Click "Add to Chart"
Adjust settings in the indicator's Style tab as needed
The weekly EMAs appear with slightly more opacity (30%) while daily EMAs have higher transparency (60%) to help distinguish between timeframes. The lines will automatically update as new bars form and will be visible regardless of what timeframe you're currently viewing on your chart.

Dynamic 50% Line [Daily and Weekly Range]This indicator automatically plots the 50% retracement level (midpoint) of the daily and weekly trading ranges. It helps traders identify key support/resistance zones where price may react, offering insights into potential reversal or continuation areas.
Auction Market Theory & the 50% Level
At its core, this indicator is built on Auction Market Theory (AMT), which views price movement as an ongoing auction process where buyers and sellers compete to establish value. The 50% midpoint represents fair value—the equilibrium where price is most likely to balance before continuing its trend or reversing.
When price deviates too far from this level, it often returns to balance (mean reversion) or accepts new value (breakout). By tracking the daily and weekly 50% lines, traders can:
Identify high-probability reversal zones (where price may reject fair value).
Spot trend continuation areas (where price accepts higher/lower value).
Align with institutional order flow, as large players often use these levels for execution.
This makes the indicator particularly powerful for traders who follow volume profile, order flow, or ICT concepts, as it visually maps the market’s ongoing auction process.
Features:
✅ Automated Daily & Weekly Midpoints – Calculates the 50% level from the high/low of each session.
✅ Customizable Line Styles – Choose between solid, dotted, or dashed lines for better visibility.
✅ Clear Labeling – Optional text labels show "50% Level" or custom text at your preferred position (left, middle, or right).
✅ Flexible Styling – Adjust line colors, thickness, and text size to match your chart theme.
How It Works:
Daily 50% Line: Resets at 6 PM NY time (new trading day).
Weekly 50% Line: Resets on Sunday at 6 PM NY time (new trading week).
The midpoint is calculated as:
(High + Low) / 2
Lines extend 500 bars forward for easy visibility.
Why Use This Indicator?
Unlike static Fibonacci tools, this dynamic indicator auto-updates the 50% level as new highs/lows form, saving time and improving accuracy. Whether you trade forex, stocks, or crypto, these levels often act as strong magnets for price action.
Pre-Market & Daily Volume Analysis - BlueThunderMain Purpose
Identifies when pre-market or daily volume is significantly higher than average, which often signals important news, earnings reactions, or institutional activity that could lead to strong price movements.
Key Features
Pre-Market Volume Analysis
Tracks volume accumulation during pre-market hours (default: 4:00 AM - 9:30 AM)
Compares to estimated average pre-market volume (calculated as ~12% of average daily volume)
Shows ratio as blue histogram bars - higher bars = more unusual activity
Daily Volume Tracking
Real-time daily volume accumulation throughout the trading session
Compares current day's volume to 20-day average daily volume
Shows ratio as colored line (green/orange/red based on intensity)
Visual Alerts
Background colors change when volume exceeds thresholds
Reference lines at 1.0x (average), 1.5x (high), and 2.5x+ (very high) levels
Pop-up labels with emojis (🚨📈) for extreme volume spikes
Information Dashboard
Real-time table showing:
Current pre-market volume and ratio
Current daily volume progress vs average
Status indicators (Normal/High/Very High)
Session status (Pre-Market/Market Open)
Live time display
Trading Applications
Morning Routine
Pre-market screening: Quickly spot stocks with unusual overnight activity
Gap identification: High pre-market volume often precedes significant gaps
News reaction: Volume spikes typically indicate breaking news or earnings
Day Trading
Entry timing: High volume breakouts have better follow-through
Risk management: Unusual volume = higher volatility expectations
Momentum confirmation: Volume validates price movement strength
Alert Strategy
Set alerts for 1.5x+ pre-market volume to catch early movers
Watch for sustained high daily volume (continuation signal)
Use as confirmation with other technical indicators
Customization Options
Adjustable pre-market hours for different time zones
Separate thresholds for pre-market vs daily volume
Toggle daily volume display on/off
Customizable averaging period (default: 20 days)
Moving Average Exponential (Daily Frozen EMA)This script plots an Exponential Moving Average (EMA) based on the daily timeframe, but with a unique twist:
✅ The EMA value is frozen for the entire current daily session, only updating when a new daily candle begins.
🔍 How it works:
The EMA is calculated using the 1-day timeframe, regardless of the chart's current timeframe.
This EMA value remains fixed throughout the day — it doesn't fluctuate intrabar.
It updates only once the daily candle has closed, providing a stable and reliable reference point during the trading day.
The default is the 5 day EMA but can be changed to any EMA timeframe you desire such as 9, 21, 50, 100. 200, etc.
✨ Additional Features:
✅ Optional smoothing with various moving average types (SMA, EMA, WMA, SMMA, VWMA).
✅ Optional Bollinger Bands on top of the smoothed EMA.
✅ Adjustable settings for EMA length, smoothing type, Bollinger Band deviation, and display options.
🛠️ Use Cases:
Ideal for traders who want a non-reactive EMA during intraday trading.
Helps reduce signal noise by anchoring EMA to higher timeframe structure.
Useful for strategy development where EMA should represent confirmed daily bias only.
Hope this helps, happy trading!

Elite Display# 😎 Elite Display - Simple Chart Info with Style
**Never lose track of what you're looking at!**
A clean, fun way to display your asset name, timeframe, and daily performance directly on your chart. Created by ** ** for traders who like their charts both informative and stylish.
## 📊 **What it shows:**
- Asset name (BTCUSDT) or description (Bitcoin/TetherUS)
- Current timeframe (1H, 4H, 1D, etc.)
- Daily % change with green/red colors
**Example:** `BTCUSDT | 1H | +2.45%`
## 🎨 **Make it yours:**
- **60+ separator styles** - From classic `|` to fun emojis 🚀💎⚡
- **Mood mode** - Separators react to your performance (😄 for gains, 😢 for losses)
- **Position anywhere** - 9 spots on your chart
- **Custom styling** - Colors, fonts, sizes, bold/italic
## 🎯 **Perfect for:**
- Multi-timeframe analysis (never forget which TF you're on!)
- Taking clean screenshots for social media
- Avoiding "wait, what symbol is this?" moments
- Adding a bit of personality to your workspace
## ⚙️ **Super simple setup:**
1. Add to chart
2. Pick what to show (asset/timeframe/both)
3. Choose your style (classic, fun, or reactive mood)
4. Position it wherever you want
5. Done!
**It's just chart info... but way more fun!** 😊
*Works on all markets: Stocks, Crypto, Forex, Commodities*# 📊 TradingHUD - Your Smart Chart Companion
**Transform your charts with the ultimate context display!** Never lose track of your symbol, timeframe, and performance again. This highly customizable indicator brings personality and clarity to your trading workspace.
## 🚀 **Key Features:**
✅ **5 Display Modes:**
- Asset Name (ticker only)
- Full Description (complete name)
- Both combined
- Timeframe Only
- Daily Variation Only
✅ **60+ Separator Styles in 3 Categories:**
- 🎨 **Classic** (15): Professional symbols (|, •, →, ★, etc.)
- 🎉 **Fun** (20): Colorful objects (🚀, 💎, ⚡, 🎯, 💰, etc.)
- 🎭 **Mood** (40+): Reactive yellow faces!
- 😄 **Happy** (21): 😀😊🥰😎🥳 (for green gains)
- 😢 **Sad** (23): 😢😭🥺😞😩 (for red losses)
✅ **Intelligent Variation Display:**
- Daily % change with smart color coding
- Green/red performance tracking
- Only appears on relevant timeframes (intraday + daily)
- Automatically hidden on weekly/monthly
✅ **Ultimate Customization:**
- 9 positioning options anywhere on chart
- Font families: Default or Monospace
- Bold/italic text formatting
- Custom colors and sizes
- Flexible element ordering
## 🎭 **Mood Mode Magic:**
Watch your separators celebrate wins with 😄🤑🚀 or empathize with losses using 😢😭💸. Toggle this emotional feature on/off anytime!
## 💡 **Perfect For:**
- Multi-timeframe analysis
- Screenshot documentation with context
- Avoiding symbol confusion
- Real-time performance tracking
- Adding personality to professional charts
- Social media trading posts
## ⚙️ **Quick Setup:**
1. Add TradingHUD to your chart
2. Select display mode (Asset/Description/Both/etc.)
3. Choose separator style (Classic/Fun/Mood)
4. Position anywhere you want
5. Customize colors, fonts, and formatting
6. Trade with confidence and style!
## 🎯 **Live Examples:**
- **Classic**: `BTCUSDT | 1H | +2.45%`
- **Fun**: `AAPL 🚀 4H 🚀 -1.23%`
- **Happy Mood**: `Gold 😄 1D 😄 +3.67%`
- **Sad Mood**: `BTC 😢 15min 😢 -5.12%`
**Professional meets personality. Context meets creativity. This is TradingHUD.** 📈✨
*Compatible with all markets: Stocks, Crypto, Forex, Commodities, Indices*
ICT Average Daily Range (ADR)📊 ICT Average Daily Range (ADR) Indicator
This indicator implements the Average Daily Range (ADR) concept taught by ICT (Inner Circle Trader). It calculates the average range of previous trading days and projects key levels for the current session, helping traders identify high-probability targets and reversal zones.
━━━━━━━━━━━━━━━━━━━━━━━━━━━━━━━━━━━━━━━━
✨ KEY FEATURES
- Accurate ADR Calculation - Uses only completed trading sessions (excludes current incomplete day)
- ICT Judas Swing Levels - Highlights the critical 1/3 ADR levels where institutional manipulation often occurs
- Two Calculation Modes - New York Midnight (ICT recommended) or Classic Daily
- Customizable Fractional Levels - 1/3, 2/3, 25%, 50%, 75% of ADR
- Smart Labels - Display price levels and percentage from open
- Flexible Visual Style - Separate line styles for different level groups
- Session Dividers - Optional vertical lines at session start
━━━━━━━━━━━━━━━━━━━━━━━━━━━━━━━━━━━━━━━━
📅 WEEKEND SESSION HANDLING
How Forex Sessions Work:
- Monday-Thursday: Full 24-hour sessions
- Friday: Partial session (00:00 to ~17:00 NY time)
- Sunday: Partial session (~17:00 NY to Monday 00:00)
- Saturday: No trading
Impact on ADR:
Both Friday and Sunday are partial sessions which can lower your ADR average. For example: Mon-Thu average 100 pips, Fri 70 pips, Sun 30 pips = 5-day ADR of 80 pips.
Other Markets:
- Crypto: 24/7 trading, no partial days
- Futures/Stocks: No Sunday session
━━━━━━━━━━━━━━━━━━━━━━━━━━━━━━━━━━━━━━━━
🎓 ICT CONCEPTS
Average Daily Range (ADR)
Statistical measure of average price movement per day. Acts as a "magnet" for price - markets tend to fulfill their ADR.
1/3 ADR Levels - "Judas Swing"
ICT's signature concept for identifying manipulation zones. Price often sweeps these levels to trap retail traders before reversing. High-probability reversal areas during London/NY sessions.
━━━━━━━━━━━━━━━━━━━━━━━━━━━━━━━━━━━━━━━━
⚙️ SETTINGS GUIDE
ADR Period: Number of days for calculation (default 5)
- Lower values = More responsive
- Higher values = Smoother levels
Calculation Mode:
- New York Midnight - ICT standard, best for Forex
- Classic Daily - Exchange timezone
Level Display:
- ADR High/Low - Primary targets
- 1/3 Levels - Judas Swing zones
- 2/3 Levels - Trending day targets
- Quarter Levels - 25% and 75%
- 50% Level - Mid-range
Visual Options:
- Separate line styles for each level group
- Customizable colors and width
- Optional labels with price/percentage
━━━━━━━━━━━━━━━━━━━━━━━━━━━━━━━━━━━━━━━━
💡 TRADING TIPS
1. Early Session: If price moves to 1/3 ADR quickly, watch for Judas Swing reversal
2. Mid Session: Use 2/3 levels as continuation targets in trending markets
3. Late Session: ADR completion often marks session extremes
4. Risk Management: Use fractional levels for scaling positions
5. Confluence: Combine with Fair Value Gaps, Order Blocks, and Liquidity Pools
Best Timeframes: 15m, 30m, 1H, 4H for intraday trading
━━━━━━━━━━━━━━━━━━━━━━━━━━━━━━━━━━━━━━━━
📝 NOTES
- Based on concepts taught by ICT (Inner Circle Trader)
- Requires at least 5 completed sessions for full accuracy
- ICT suggested using "New York Midnight" mode
- Weekend sessions handled based on actual market hours
- Be aware that Friday/Sunday partial sessions may lower ADR average
Created with focus on clean implementation and ICT's core teachings.
Average Daily Range in TicksPurpose: The ADR Ticks Indicator calculates and displays the average daily price range of a financial instrument, expressed in ticks, over a user-specified number of days. It provides traders with a measure of average daily volatility, which can be used for position sizing, setting stop-loss/take-profit levels, or assessing market activity.
Calculation: Computes the average daily range by taking the difference between the daily high and low prices, averaging this range over a customizable number of days, and converting the result into ticks (using the instrument's minimum tick size).
Customization: Includes a user input to adjust the number of days for the average calculation and a toggle to show/hide the ADR Ticks value in the table.
Risk Management: Helps traders estimate typical daily price movement to set appropriate stop-loss or take-profit levels.
Market Analysis: Offers insight into average daily volatility, useful for day traders or swing traders assessing whether a market is trending or ranging.
Technical Notes:
The indicator uses barstate.islast to update the table only on the last bar, reducing computational load and preventing overlap.
The script handles different chart timeframes by pulling daily data via request.security, making it robust across various instruments and timeframes.

1H & 2H Candle Panel + Daily Grid v1.2Indicator: "1H & 2H Candle Panel + Daily Grid v1.2"
This powerful indicator combines two key features into one tool:
Daily Grid anchored to the previous day’s close
Multi-Timeframe Candle Panel for comprehensive market analysis
1. Daily Grid Logic
Input:
Grid Distance (Points): Adjustable spacing between grid lines (default: 5.0 pts).
How It Works:
Detects the start of a new trading day using ta.change(time("D")).
Fetches the prior day’s close via request.security().
Draws the following elements at each new session:
Thick Red Line: Previous day’s closing price (key reference level).
8-Point Grid:
4 blue lines above the close (+1x to +4x the grid distance).
4 gold lines below the close (-1x to -4x the grid distance).
Info Label: Displays the exact prior close value.
Automatically clears and redraws all elements daily to avoid clutter.
2. Multi-Timeframe Candle Panel
Timeframes Analyzed:
Current chart TF, 30M, 1H, 2H, 3H, 4H, 6H, 12H, and Daily (1D).
Data Displayed per TF:
Open, Close, High, Low
Price Difference (Close − Open)
Candle Type (Bullish/Bearish)
Time remaining until candle close (hh:mm:ss format)
Visual Output:
A right-aligned table with conditional coloring:
Bullish candles: Green background
Bearish candles: Red background
Current timeframe highlighted in purple.
Optimized Updates:
Uses request.security() for efficient cross-TF data fetching.
Tracks candle closing times via TradingView’s native time_close.
Updates only on the last bar or in real-time (barstate.islast/isrealtime).
3. Confluence Signals
Full Confluence:
Triggers when all timeframes align:
Buy Signal: All candles bullish → Green arrow + alert.
Sell Signal: All candles bearish → Red arrow + alert.
1H Special Confluence:
Activates 30 minutes after the 1H candle opens.
Requires alignment between 1H, 4H, and 6H candles.
Marks entries with price-level arrows (no alerts).
4. Technical Optimizations
Performance:
Dynamically manages graphic objects (no redundant redrawing).
Uses arrays to track grid lines efficiently.
Precision:
Leverages TradingView’s time_close for accurate countdowns.
Formats prices with format.mintick for asset-specific precision.
How to Use
Adjust Grid Distance based on asset volatility.
Monitor the panel for multi-TF trend strength.
Use the daily grid as support/resistance reference.
Confluence signals highlight high-probability setups.
Pro Tip: Combine with volume analysis or RSI for confirmation!
