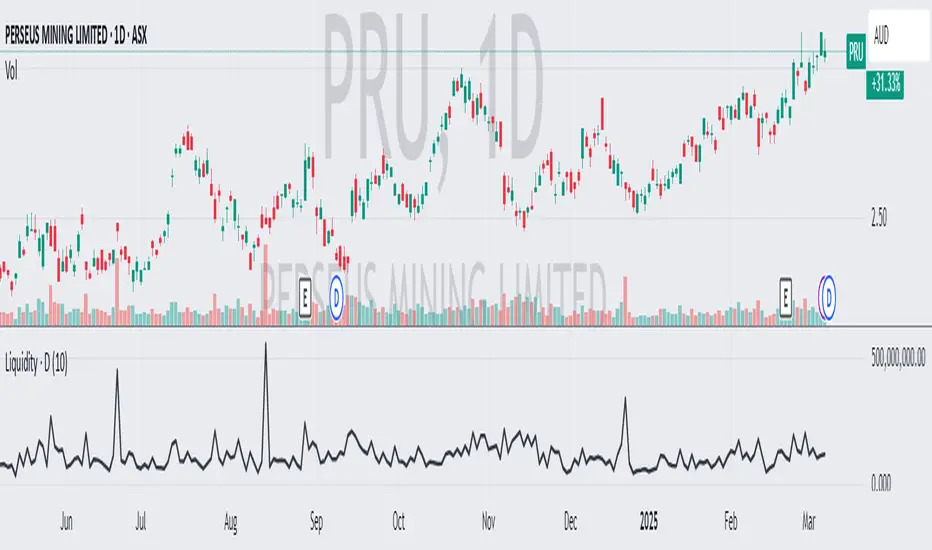
Code Plots - High, Low, Open, Close—Daily, Weekly, & Monthly!!!Custom Code Plots High, Low, Open, Close
Plots Today And/Or Previous Day
Daily, Weekly, & Monthly TimeFrames
Default Settings:
Green = High
Silver = Open
Fuchsia = Close
Red = Low
Current D-W-M = Circles as Plots
Previous D-W-M = Cross as Plots
By Default The Current Days High, Low, Open, Close Plots. There are Check boxes On The Inputs Tab To Turn All Options On And Off.
***Tip - For Intra-Day Trades…I Find It Useful To Plot Previous Days High, Low, Open, Close For Support/Resistance, & Breakout Levels. Plotting the Current Weekly and Monthly Levels Is Also Very Useful.
***If You Trade Daily Charts The Previous Months Levels Are Very Useful as Support/Resistance, & Breakout Levels….
Code For High, Low, Open, Close
pastebin.com
Video On Importing Custom Indicators from PasteBin:
videos.tradingview.com
Search in scripts for "daily"
D_Three Ten Osc on the DailyHi
Let me introduce my D_Three Ten Osc script.
This indicator allows the
user to plot a daily 3-10 Oscillator on a Tick Bar Chart or any intraday interval.
Walter Bressert's 3-10 Oscillator is a detrending oscillator derived
from subtracting a 10 day moving average from a 3 day moving average.
The second plot is an 16 day simple moving average of the 3-10 Oscillator.
The 16 period moving average is the slow line and the 3/10 oscillator is
the fast line.
For more information on the 3-10 Oscillator see Walter Bressert's book
"The Power of Oscillator/Cycle Combinations"
trend&strengthwhen strength > 0, it's a bullish signal. more the strength value bigger ,more bullish.
AP Index - Geomagnetic disturbancesDaily AP index back to 2015-01-01.
Geomagnetic disturbances can be monitored by ground-based magnetic observatories recording the three magnetic field components. The global Kp index is obtained as the mean value of the disturbance levels in the two horizontal field components, observed at 13 selected, subauroral stations . The name Kp originates from "planetarische Kennziffer" ( = planetary index).
The three-hour index ap and the daily indices Ap, Cp and C9 are directly related to the Kp index. In order to obtain a linear scale from Kp, J. Bartels gave the following table to derive a three-hour equivalent range, named ap index.
Geomagnetic Ap Index: The daily index Ap is obtained by averaging the eight values of ap for each day.
Based on the data from Helmholtz Centre Potsdam GFZ German Research Centre for Geosciences.
daily_pivots_beta_persistenttraderDaily central pivots for today and tomorrow are plotted. This is strictly BETA version.
Irrespective of timeframe chosen for the charts, it's DAILY pivots that are plotted.
Pls note that this is made available as-is and I make it clear that I am not responsible for any profilt or loss or any other outcome directly or indirectly arising out of use of this formula.
3 MA(50,100,200)_DAILYDaily Moving Average (50, 100, 200) in one code, indicates daily MA values in all time frames
Daily Levels + Pivot + VWAP + LRC + Bollinger + Session BiasAdded several indicators to help traders to create price action strategy. All lines of this indicator are fully non repaint and will never vanish even in the most volatile condition on any chart even on Renko. Try it...
Daily H/L/M + Open + VWAP + BB + LRC + Session Bias (Robust)This is great indicator to create price action based strategy in all kind of charts including renko. All the line are non repainting and wont vanish even in high volatily in renko or in any other chart. Try it to make your own strategy.
Daily MA + Guppy EMA Clouds + Bar HighlightsThis script is a modular strength dashboard combining:
- Multi-timeframe MAs
- Guppy clouds
- CPR pivots
- Momentum gauges
- Breakout flags
It’s ideal for traders who want layered confirmation across trend, volatility, and support/resistance zones.
Vol - Traded Value (₹ Cr)Daily Traded Volume in Crores.
To know how much of a Stock is trades in Value Terms
Daily Pivot Points - Fixed Until Next Day(GeorgeFutures)We have a pivot point s1,s2,s3 and r1,r2,r3 base on calcul matematics
Daily CMO + Volume Intraday Strategy v6 by Subirrmomentum strategy. buy on next hourly candle after signal. target 5%, sl 1%
Daily Vertical Lines (UTC-4)puts verical line for setup asian
🔎 How this works:
The script uses timestamp() with America/New_York (which corresponds to UTC-4 in summer and UTC-5 in winter — TradingView auto-adjusts with DST).
When the bar’s opening time equals 3:30 PM or 8:00 PM, it draws a vertical dotted line across the chart.
One line will be red (3:30 PM), the other blue (8:00 PM).
Daily High/Low (15m) + EMA Pre-Market H/L + ORBStraightforward:
I built a swing-trading indicator with ChatGPT that plots 15-minute highs and lows, draws pre-market high/low lines, and adds a 15-minute opening-range breakout feature.
Technical:
Using ChatGPT, I developed a swing-trade indicator that calculates 15-minute highs/lows, overlays pre-market high and low levels, and includes a 15-minute Opening Range Breakout (ORB) module.
Promotional:
I created a ChatGPT-powered swing-trading indicator that maps 15-minute highs/lows, marks pre-market levels, and features a 15-minute Opening Range Breakout for clearer entries.
Daily 6 AM & 8 AM CST Linesit help so you can figure out 6am and 8am on cst time in americas very fast.
Daily 9AM Line
Draws a line at 9AM every day at market pre-open
Daily Moving Average to Intraday ChartPlaces 200D, 100D, 50D SMAs as well as the 20D EMA onto intraday charts. (Script v6)
Daily Average 5m Candle SizeThis indicator measures the average size of each 5 min candle then works out the end of day average for you. Very important for profit targets and stops
Daily ATR BandsATR Finder – Volatility Scanner for Smarter Trade Setups
The ATR Finder is a precision tool designed to help traders quickly identify high-volatility assets using the Average True Range (ATR) – a key metric in assessing market momentum and potential breakout zones. By automatically scanning and highlighting tickers or candles with elevated ATR values relative to their recent historical range, this indicator helps you filter for setups that are more likely to experience significant price moves.
Whether you're a day trader seeking intraday momentum or a swing trader looking for setups with strong follow-through potential, the ATR Finder cuts through the noise and visually signals which assets are "on the move." It can be paired with other indicators or price action tools to create a high-conviction trading strategy focused on volatility expansion.
Key Features:
Dynamic ATR Calculation over a user-defined period
Visual Alerts or Color-Coding for above-threshold volatility spikes
Supports Multiple Timeframes for both short- and long-term volatility analysis
Great for spotting breakout opportunities, gap continuations, or trend reversals
Use the ATR Finder to stay ahead of price action and build a watchlist that moves with purpose. Perfect for scalpers, breakout traders, and anyone who respects the power of volatility.
Anchor Buy Sell LevelsDaily Validity:
The indicator generates a single horizontal line (either a Buy Level or a Sell Level) that remains valid throughout the entire trading day.
Source of the Signal:
The level (buy or sell) is determined using candles that were generated before the day in question.
Selection Logic:
When determining the level, the indicator checks past candles in descending order (from the most recent backward).
The very first candle encountered that meets the respective logic (either the buy or sell condition) sets the level.
Buy and Sell Logic:
Buy Signal: Generated when a candle’s close is lower than both the previous candle’s close and the next candle’s close (i.e., a local minimum). The Buy Level is drawn at the low of that qualifying candle.
Sell Signal: Generated when a candle’s close is higher than both the previous candle’s close and the next candle’s close (i.e., a local maximum). The Sell Level is drawn at the high of that qualifying candle.
One Signal per Day:
For any given day, the indicator will display either a Buy Level or a Sell Level—not both. The decision is based on which qualifying candle (and its corresponding condition) is found first when scanning the historical data in descending order.
Daily Session Fibonacci LevelsPlots automatic Fibonacci retracement levels based on the current session high and low.
Levels for the prior and current session can be toggled on/off.
Optional: Toggle to show the Fibonacci Level labels.
Allows for customizable levels and colors; toggles for individual levels.