Search in scripts for "daily"

Synthesis DeFi - Fractals - Daily - v7.0This is a free trial version of SynthesisDeFi.com fractals.
A simplified fractal analysis indicator that identifies key market structure points on daily timeframes. This tool automatically detects trend reversals and plots fractal highs and lows with connecting lines, helping traders visualize major support and resistance levels
Why use Synthesis DeFi fractals?
Harmonic Patterns
Wycoff
Elliot Waves
Dow Theory
Created by Oliver Fujimori | SynthesisDeFi.com
Perfect for swing traders and position traders focused on daily market structure analysis

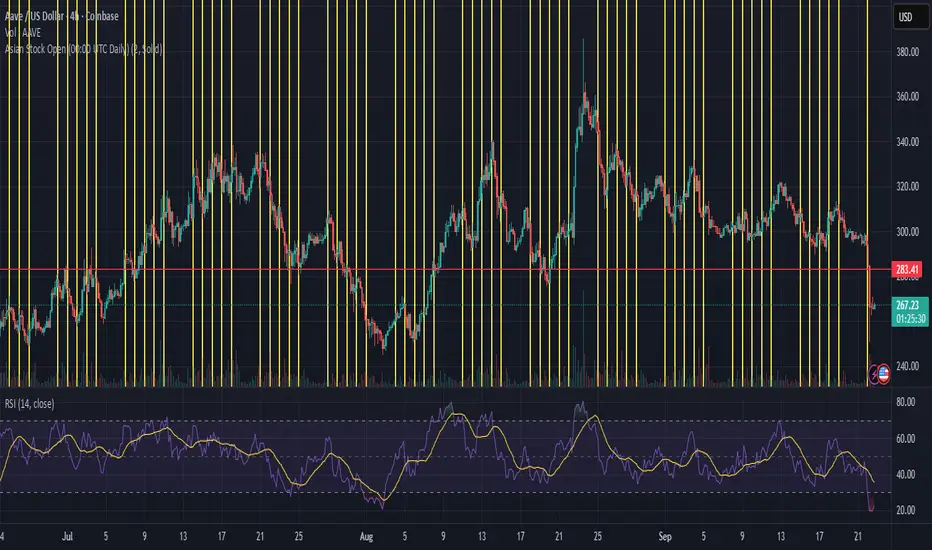
Asian Stock Open (00:00 UTC Daily)Simple TSE daily open indicator, 500 line history, to help prepare for potential weekly open volatility from Asia trading
Smart Money LITE — Daily Sweep → HQ Signals (VWAP • FVG • CHoCH) 🔗 PRO VERSION (VWAP + FVG + CHoCH — full confirmations, all timeframes):
chartedgepro.gumroad.com/l/rmnbhw
Daily liquidity sweep → confluence signals with VWAP, FVG & CHoCH. Works on all timeframes & markets (Indices, Forex, Crypto).
WHAT IT DOES
Smart Money LITE+ highlights high-quality LONG/SHORT signals only after daily liquidity is swept (previous day high/low) with confluence from VWAP, FVG and structure (BOS/CHoCH).
Works on all timeframes and across markets: indices, forex, crypto.
KEY FEATURES (Lite)
• Daily sweep logic (PDH/PDL) + previous day zones
• VWAP + deviation bands (optional) and proximity filter
• 3-bar FVG boxes (visual) with adjustable extension
• ATR/volatility filter, optional HTF trend filter
• Anti-spam cooldown, clean LONG/SHORT labels
• Alerts: HQ LONG / HQ SHORT
HOW TO USE
1. Wait for price to sweep PDH/PDL → indicator opens “signal window”.
2. Look for confluence: VWAP touch/proximity + CHoCH or BOS in direction.
3. Enter with proper risk management (stop beyond swing/zone, partials).
SETTINGS TIPS
• Enable “Require VWAP Confluence?” for strictest setups.
• Use “HTF Trend Filter?” to align with higher-timeframe EMA trend.
• Adjust “After sweep (bars)” to define signal validity window.
• FVGs are visual in Lite — advanced filtering and confirmation are in Pro.
WHO IT'S FOR
Scalpers, intraday, and swing traders looking for objective, visual signals based on liquidity sweeps and VWAP/FVG confluence.
PRO VERSION (full confirmations)
Adds advanced FVG/iFVG logic, more confluence filters, dynamic risk tools and extended alert packages — optimized for all timeframes.
👉 chartedgepro.gumroad.com/l/rmnbhw
NOTES
• For educational purposes only. No financial advice.
• “Lite” is open-source; redistribution of code follows TradingView rules.

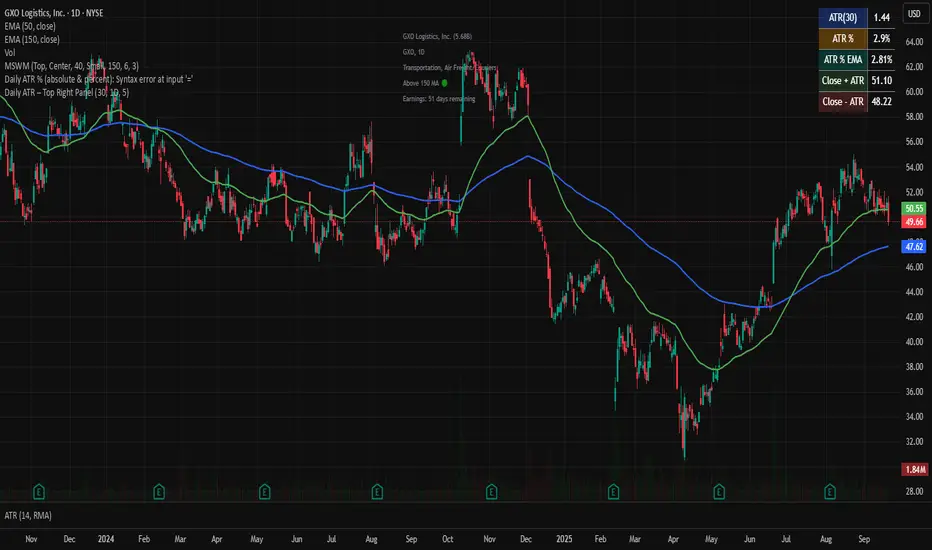
nitai Daily ATR – Top Right PanelThis script calculates the Daily ATR (Average True Range) and displays it in a compact panel on the top-right corner of the chart.
The panel includes:
• ATR in USD (based on a user-defined period, default = 30)
• ATR% – volatility expressed as a percentage of the price
• ATR% EMA – smoothed volatility trend using an Exponential Moving Average
• Close + ATR and Close – ATR – projected upper and lower daily range levels
Use this tool to quickly assess daily volatility, compare stocks by relative movement, and support risk management (e.g., stop-loss placement).
Designed for traders who want a clean and simple volatility dashboard directly on the chart.
BB + OBV + RSI Strategy (Enhanced + Daily Table) Script Brief – *BB + OBV + RSI Strategy (Enhanced + Daily Table)*
This TradingView Pine Script combines **Bollinger Bands (BB)**, **On-Balance Volume (OBV)**, **Relative Strength Index (RSI)**, and **Exponential Moving Average (EMA)** to help traders identify potential trend conditions and market strength.
**Key Features:**
* **Bollinger Bands** (20-period SMA ± 2 Std Dev by default) to track volatility and price extremes.
* **OBV & OBV Moving Average** to confirm buying or selling pressure.
* **RSI** to highlight overbought and oversold zones.
* **200 EMA** as a long-term trend filter.
* **Daily Comparison Table** (top-right corner):
* Displays today’s vs. yesterday’s values for Close, RSI, OBV vs MA, BB Position, and EMA Trend.
* Helps quickly assess whether momentum and trend conditions are strengthening or weakening.
**Usage:**
* The chart shows **BB lines and EMA** for real-time analysis on any timeframe.
* The **table provides higher-timeframe context** (daily values), making it easier to confirm signals across multiple timeframes.
* Best applied with backtesting and proper risk management.

Modified - Pivot Points Standard with Daily H/L/CThis indicator plots Pivot Points Standard with six calculation methods (Traditional, Fibonacci, Woodie, Classic, DM, Camarilla) and flexible anchors (Auto/D/W/M/Q/Y and multi-year). You can restrict pivots to the current day/week/month, choose daily-based data (uses higher-timeframe OHLC; futures use settlement close) or intraday aggregation, and independently style pivots versus previous-period lines with solid/dashed/dotted types and custom widths. Per-level colors are provided (PP/R/S), with R4/R5 and S4/S5 off by default, plus optional labels showing prices positioned left or right. It also draws the previous Day/Week/Month High, Low, and Close across the current period using completed higher-timeframe values (lookahead_off with ), ensuring they always reflect the prior session/period. Rendering is optimized by limiting historical pivot sets and auto-cleaning old lines for smooth performance on any timeframe.

ICT NDOG/NWOGICT NDOG / NWOG — Opening Gap Visualizer
Plots daily (NDOG) and weekly (NWOG) opening gaps.
An opening gap is the price range between the previous close and the new session’s open.
Features:
• Optional border lines at gap high/low.
• Optional Consequent Encroachment line (50%).
• Optional Quadrant lines (25% and 75%).
• Color customization
• Custom NDOG and NWOG amount (separated)
*Also included in ICT ULT (All In One) Indicator
*Feel free to suggest improvement in the comments

Dani u nedelji + midnight open @mladja123This indicator breaks the weekly timeframe into cycles and marks the midnight open for each day. It helps traders visualize weekly structure, identify key daily openings, and track market rhythm within the week. Perfect for analyzing trend patterns, swing setups, and session-based strategies.

Aggressive Phase + Daily Buy Visual Screener — v6Aggressive Phase + Daily Buy Visual Screener — v6 for bullish, neutral and bearish zone identification

Average Daily Range TrackerAverage Daily Range Tracker
This indicator helps you measure volatility in real time by tracking the Average Daily Range (ADR) and comparing it to the current day’s price action.
🔑 Features
Calculates the ADR over a user-defined lookback period (default = 14 days).
Displays today’s developing range (High–Low) as the session unfolds.
Shows what % of the ADR has already been consumed intraday.
Visual progress bar makes it easy to see how close today is to its historical average range.
Optional ADR plot available in a separate pane.
📈 How traders use it
Spot when a market has already made its “typical” daily move.
Adjust intraday trade expectations: avoid chasing after the bulk of the move is done.
Use % of ADR consumed as a volatility filter for setups.
Combine with support/resistance to identify exhaustion zones.
⚙️ Customization
Lookback length for ADR calculation.
Progress bar size and color.
Optional toggle to plot ADR in its own panel.

Auto Daily High/Low/50%This indicator automatically plots the current daily high and low, as well as the midrange.

Key Daily LevelsKey Daily Levels Indicator
This lightweight indicator is designed to automatically plot the most essential price levels for intraday traders, helping you visualize key areas of support and resistance without cluttering your chart.
Features:
Opening Range (ORB) : Calculates and displays the high and low of a user-defined opening period (e.g., the first 30 minutes). The levels appear only after the range is established.
Pre-Market High & Low : Identifies the highest and lowest prices from the pre-market session and draws a line segment for each level from the 9:30 AM open until 11:00 AM. These lines remain visible for the rest of the day for reference.
Previous Day's High & Low (PDH/PDL) : Plots the prior day's final high and low, which are critical reference points for the current session.
Current Day's High & Low (CDH/CDL) : Tracks and plots the current session's high and low in real-time.
Customization : All levels can be toggled on or off. Optional text labels are available to clearly identify each line on the chart.
Intraday Focus : The indicator is automatically enabled on intraday timeframes and disabled by default on daily or higher charts to ensure a clean workspace.

Market Sessions & Daily Range ProThis tool is designed for market visualization. It displays the real trading sessions (Asia, Europe, and America) together with the daily range (00:00–24:00). Boxes and labels show daily highs, lows, open/close levels, and current extremes. The purpose is to provide traders with a clear visual map of how price behaves across sessions and within the daily structure.

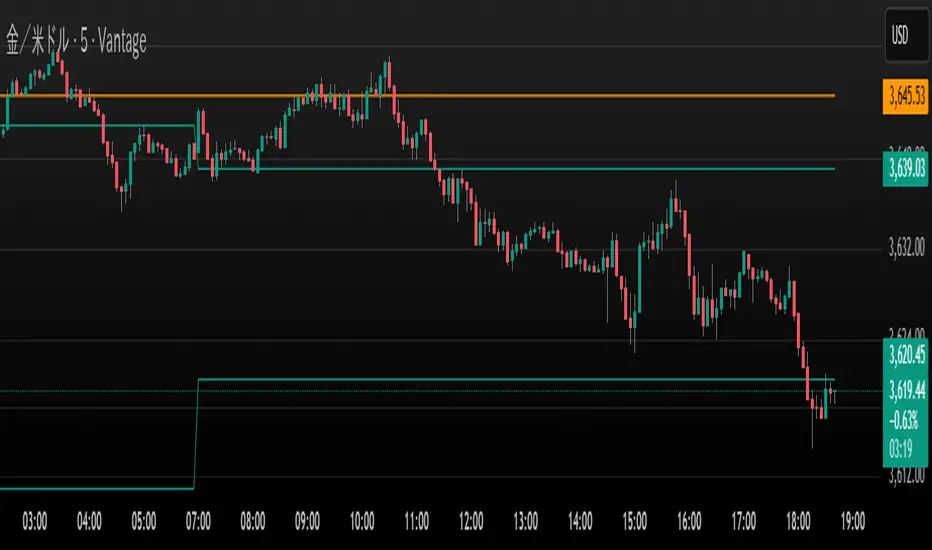
LevelsThis Indicator is meant to plot some of the most common levels that traders use.
The display of these levels is highly customizable, as you can choose the line type , color , thickness and whether it shows you no label, price only, reduced label or full label next to the line. All labels (except for "no Label") will show the price at this level.
Also You have the option to mark the start on each timeframe with either a individually colored background or a vertical line where you can choose the line style and color.
Full List of available Levels and Optional inputs to these levels:
Previous HTF Candle Levels:
• Previous HTF Candle Open
• Previous HTF Candle High
• Previous HTF Candle Low
• Previous HTF Candle Close
Optional:
• Choose any higher timeframe
• Mark start of new HTF candle
Session Levels:
• Session Open
• Session High
• Session Low
• Session Close
Optional:
• Choose any time as start and end of your session
• Mark start of session
• Mark full session
Daily Levels:
• Current Day Open
• Current Day High
• Current Day Low
• Previous Day Open
• Previous Day High
• Previous Day Low
• Previous Day Close
Optional:
• Choose start of day (standard, NY Midnight, custom start time)
• Mark start of day
Weekly Levels:
• Current Week Open
• Current Week High
• Current Week Low
• Previous Week Open
• Previous Week High
• Previous Week Low
• Previous Week Close
Optional:
• Mark start of Week
Monthly Levels:
• Current Month Open
• Current Month High
• Current MonthLow
• Previous Month Open
• Previous Month High
• Previous Month Low
• Previous Month Close
Optional:
• Mark start of Month

HTF Bias Signals (Daily EMA Bias + LTF EMA Cross)clean, flexible indicator (Pine v5). It defines higher-timeframe (HTF) bias from Daily and/or Weekly EMAs, then only fires entries on your chart’s timeframe when that bias agrees with a simple fast/slow EMA trigger. It also includes alertconditions so you can automate alerts.


Monthly weekly daily Naked LevelsFor example, if the day closes positive and the next day closes negative, or vice versa, you have a daily level. The next time the price returns to this level, you can consider it an S/R level.
This indicator shows these levels until the first touch.
Double Inside Bar Scanner [Daily]Double Inside Bar Scanner . Captures Double Inside based on last 2 daily Bars
Liquidity Grab Entry Signals [Daily Enhanced]Liquidity Grab Entry Signals is a powerful tool designed to detect intraday reversal opportunities around daily high/low liquidity zones.
Core features: – Plots current daily high/low levels
– Identifies price interaction with these key zones
– Confirms rejection via strong engulfing candles
– Plots real-time long/short entry signals directly on chart
– Includes alerts for both long and short setups
This script is ideal for scalpers and intraday traders looking to exploit stop hunts, liquidity sweeps, and false breakouts.
Optimized for instruments like US30, NAS100, Gold, BTC and more.
Customize the sensitivity buffer to suit your asset and timeframe.
Use this in combination with VWAP, FVG or Smart Money concepts for enhanced confirmation.
---
Built for: 1s–15m charts
Includes: Alerts + Custom Settings
Type: Non-repainting
Trade with clarity around the most manipulated price levels of the day.

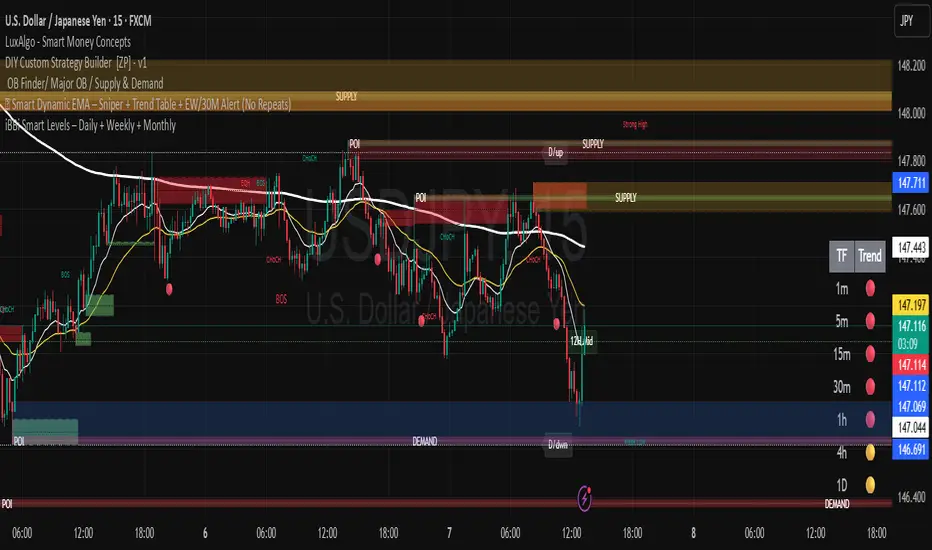
iBBi Smart Levels – Daily + Weekly + MonthlyThis is a level indicator. In trading levels make lots of difference - this indicator gives us, daily, weekly and monthly levels. Then, it gives last 12-hours high and low level. This means at any given time you will have these EIGHT LEVELS available to you.