Short Volume [Nic]Daily Short Volume shows short volume (red) and total volume (green). This can be helpful in determining a build up of short interest before a crash (or squeeze), or if the mark up of a stock is from short covering or legitimate buyers.
Search in scripts for "daily"

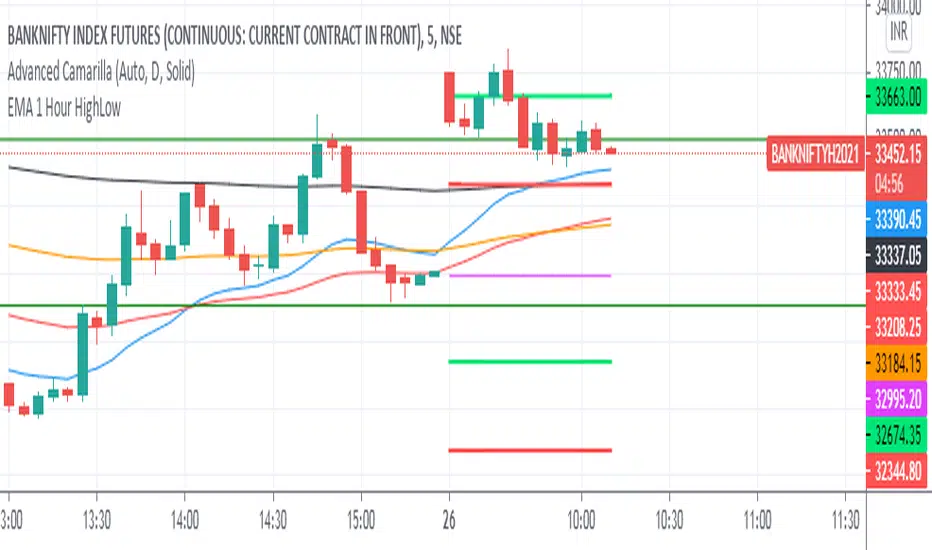
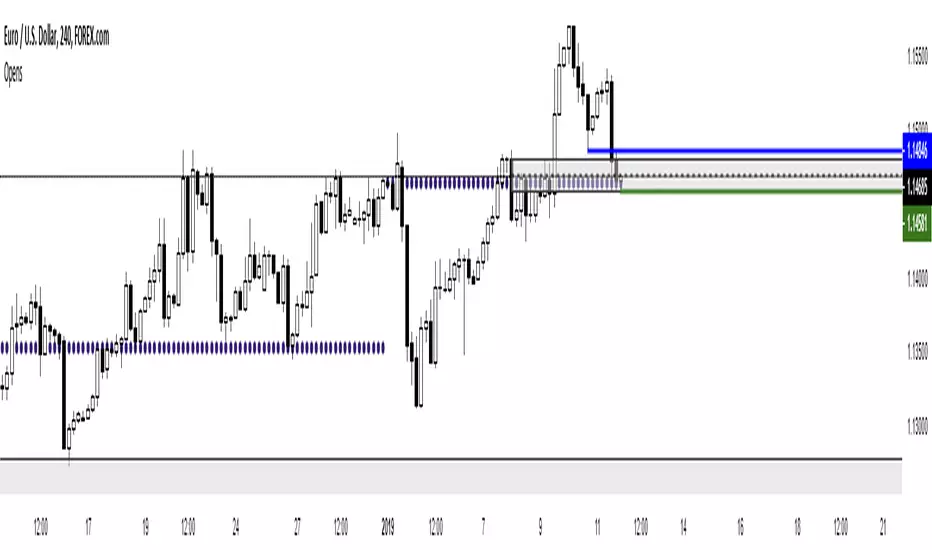
1st Hour High and Low ISRDaily Range :
1st Hour High and Low From Market Start Time
ISR = Initial Support Resistance
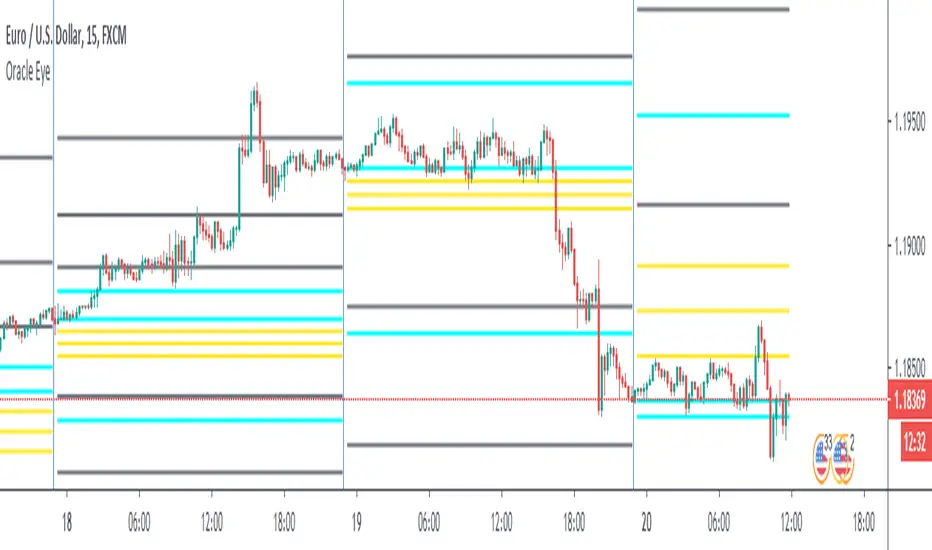
Daily Ranges Dividers 1-5-15MinThis Range Indicator divides days based on New York Time. It works properly on the 1-5-15Min Chart. You can also use it on the 1h Chart, but you have to tick the apposite option in the Indicator Settings to do so. Enabling it on the 1h Chart, won't show it properly on the other timeframes, but you can always switch it back to the default and use it on the 1-5-15Min chart without any problems

Daily Average True RangeIf you want to get an idea if the current range (low to high) is extended or not?
This script should help you to get an idea relative to the ATR.
Further comments you find in the script.
Feel free to modify upon your needs.
Jonas
NB: Due to issues around the "security" function, the recommended patch of Trading View was implemented.

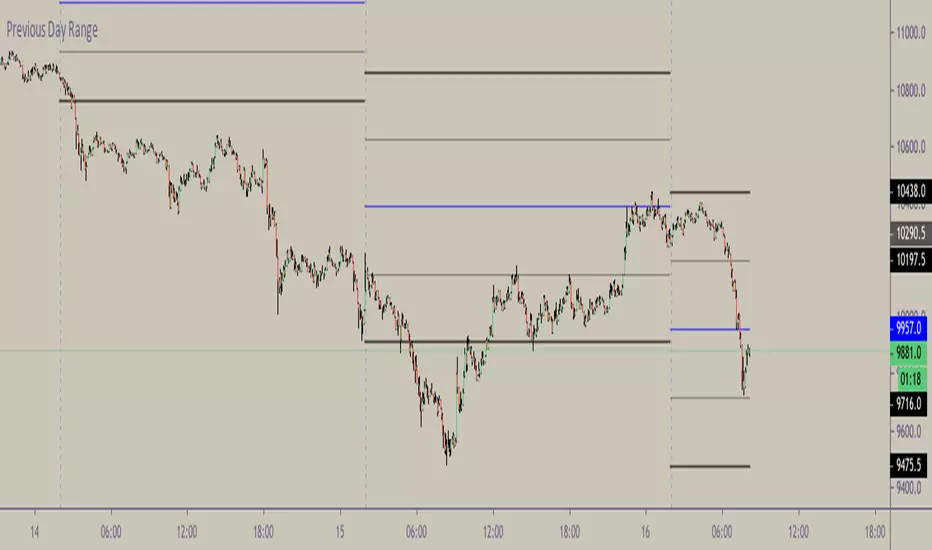
Daily Reference Points for Intra-hour ChartsI worked with pivot script which I believe was created by @HPotter but somehow, I can't look it up.
This script fixes one issue I have with several pivot points script I had honour to see. When the new day starts, sometimes, there is a line connecting old pivot points and new ones. I managed to remove it.
Compared to the script I worked with, I converted the code from v.1 to v.4, added middle pivots and added previous day's close, high and low which are superior levels compared to any pivot calculation.
This script will show only on the 1m, 5m, 15m and 30m charts, so you don't need to turn it off when you check higher timeframe for macroanalysis.

Bank Math LevelsDaily and weekly Bank Math levels for Oil.Thanks to @randy.brown228 for sharing the calculations

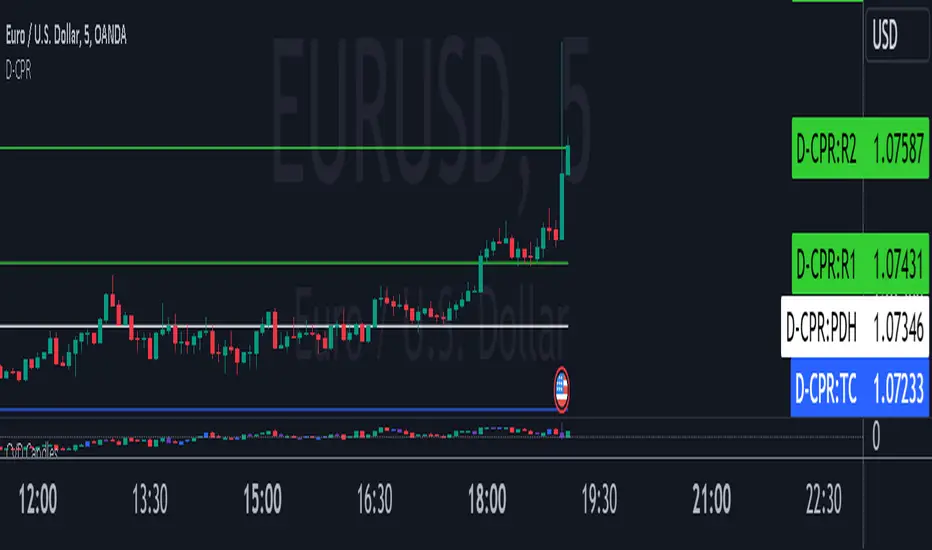
Daily CPRThis script will plot the CPR and support/resistance lines on your chart for smaller time frame so that you use them for Intraday trading. This script also plots the previous day's high (PDH) and the previous day's low (PDL).
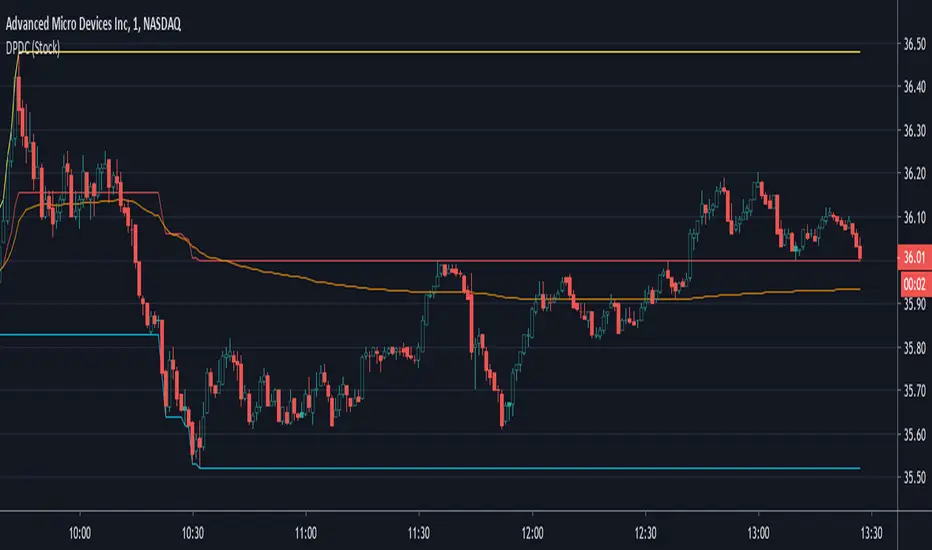
Daily Progressive Donchian ChannelsThis is the first script that I publish.
His main goal is to help identify the extreme of the day and to compare the VWAP with the average DPDC to find meaningful resistance and support.
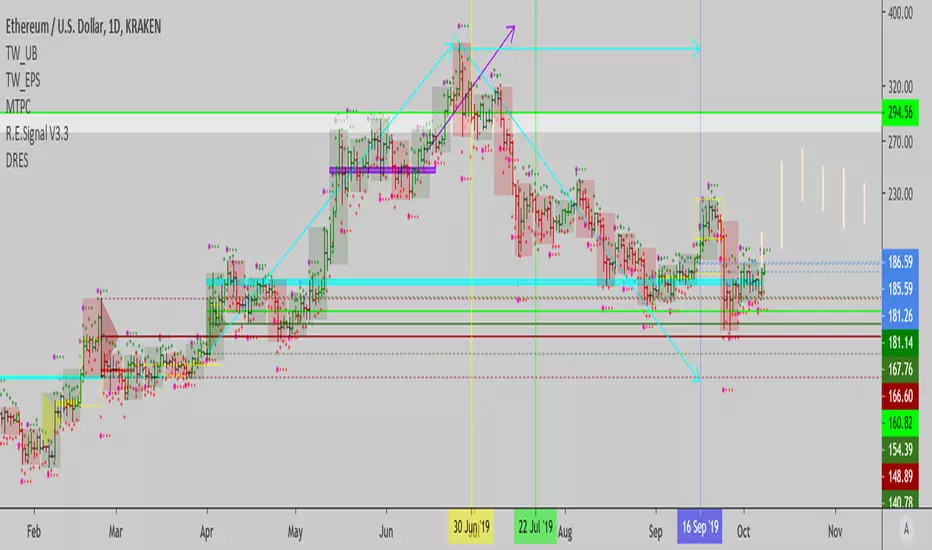
Daily Range Exhaustion SignalThis tool plots the average true range distance from each bar's open, up and down, so you can tell when a bar moves by more than the average distance a day's range usually travels. It's an interesting concept, but not something I use a lot of the time. Looking at the range relative to the last bar's range, is what I normally do to find bouts of strength or weakness, and to determine if these moves have follow through or not.
You may experiment with this indicator to see if it helps in your price action analysis. Usually, bigger than 1 ATR moves don't keep going for much more, unless there's some outrageous news related to the move.
This idea came from a conversation with Yacine Kanoun here, and I coded it into an indicator.
Credit where credit is due (right Yacine?)...
Cheers,
Ivan Labrie.


Daily Real-Time Relative Volume *Eastern Time Zone Only*Calculates the current relative volume in real-time compared to the inputted moving average length.
*VOLUME MUST CHANGE on the current chart, once loaded, with the indicator before the script activates and presents the current relative volume*
On high volume stocks the script should activate almost immediately on low volume stocks it may take a little while.
Relative Volume that equals or exceeds the High Volume Threshold set will color the column either red or green (based on current and previous days close).
Relative Volume that is below the Low Volume Threshold set will color the column yellow.
Relative volume between the Low and High Volume Thresholds set will color the column black.


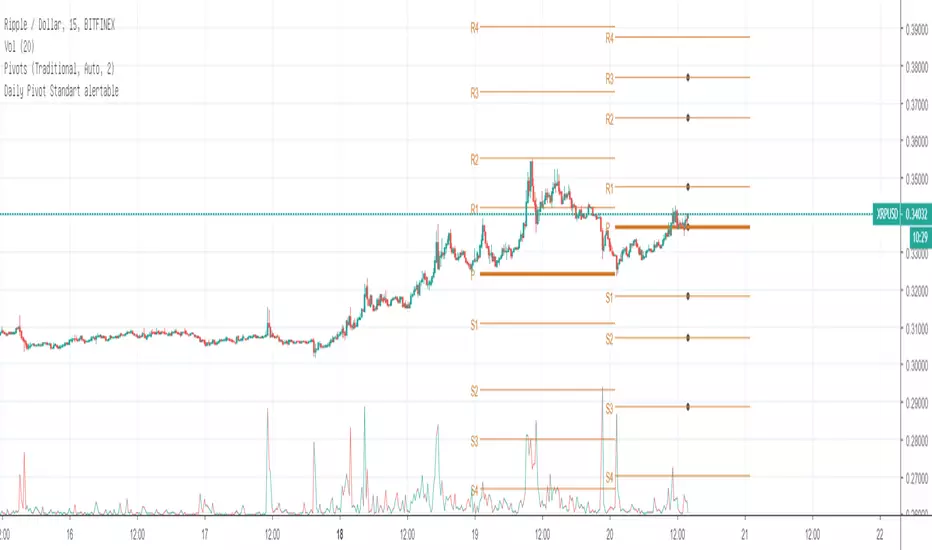
Daily Pivot Standart alertableWith this Indicator u can set allert between the Pivot points s15.directupload.net
So it is useful for scalping
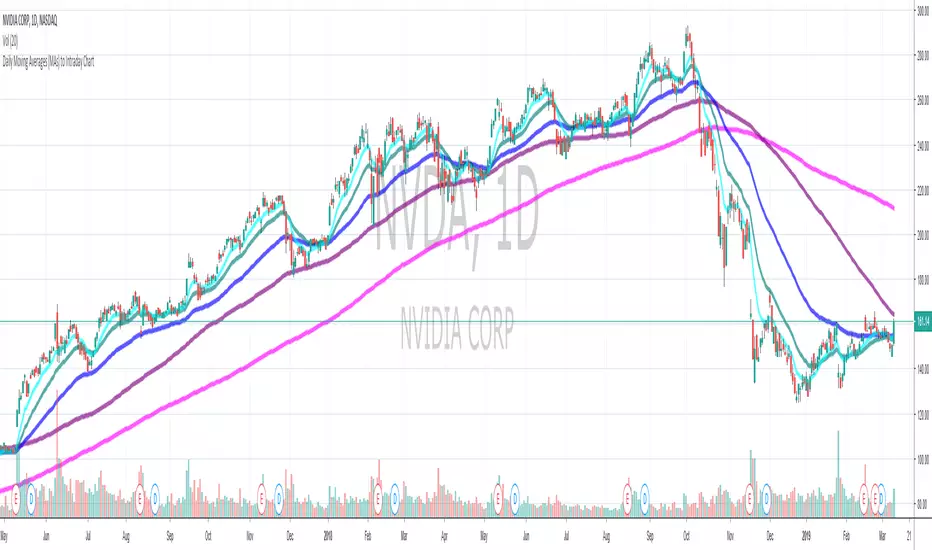
Daily Moving Average to Intraday Chart BradleyRUses Robertob's Script with Mike's colors for Warrior Pro Students.

