MACD + RSI + EMA + BB + ATR Day Trading StrategyEntry Conditions and Signals
The strategy implements a multi-layered filtering approach to entry conditions, requiring alignment across technical indicators, timeframes, and market conditions .
Long Entry Requirements
Trend Filter: Fast EMA (9) must be above Slow EMA (21), price must be above Fast EMA, and higher timeframe must confirm uptrend
MACD Signal: MACD line crosses above signal line, indicating increasing bullish momentum
RSI Condition: RSI below 70 (not overbought) but above 40 (showing momentum)
Volume & Volatility: Current volume exceeds 1.2x 20-period average and ATR shows sufficient market movement
Time Filter: Trading occurs during optimal hours (9:30-11:30 AM ET) when market volatility is typically highest
Exit Strategies
The strategy employs multiple exit mechanisms to adapt to changing market conditions and protect profits :
Stop Loss Management
Initial Stop: Placed at 2.0x ATR from entry price, adapting to current market volatility
Trailing Stop: 1.5x ATR trailing stop that moves up (for longs) or down (for shorts) as price moves favorably
Time-Based Exits: All positions closed by end of trading day (4:00 PM ET) to avoid overnight risk
Best Practices for Implementation
Settings
Chart Setup: 5-minute timeframe for execution with 15-minute chart for trend confirmation
Session Times: Focus on 9:30-11:30 AM ET trading for highest volatility and opportunity
Search in scripts for "entry"

Perfect OrderEntry Point
How to Entry
Perfect Order Entry
SMA5,13,21 & EMA75,90,200
Please enjoy your entry


Entry / TP / SL Alert Bands (Simple & Stable)
Get an alert before you reach your take profit or stop loss. Set as a percentage over the distance to your stop loss and take profit and improve your Money Management

Estrategia Momentum Seguro (EMS) Entry and exit signals, this indicator helps or suggests where to enter, exit, or place a stop loss.

Raeinex Momentum Liquidity IndexEntry arrow signals with volumetric momentum (buying and selling pressure) and the possibility to use all entry signals as liquidity area for price retest.

Momentum Swing 1–3 Weeks
✅ Entry (LONG) Conditions
Price above EMA9 and SMA20
SMA20 > SMA50 (trend confirmation)
MACD above the signal line
RSI between 50–65 (healthy momentum)
Volume at least 20% above the 20-day average
When all conditions align, a LONG signal is generated.
✅ Exit (SELL) Conditions
Price closes below EMA9
MACD gives a bearish crossover
Or TP/SL levels are hit
Position is closed.
✅ Multi-Stage Take Profit
TP1: ATR × 1.5 → closes 50% of the position
TP2: ATR × 3.0 → closes remaining 50%
✅ Stop Loss
ATR × 1.5 dynamic SL
✅ What This Strategy Aims For
Catching early trend continuation signals
Filtering weak / low-volume breakouts
Exiting when momentum fades
Eliminating emotional decision-making through rules
📌 Note
Backtest performance may vary by symbol and volatility. Proper risk management is strongly recommended.

ENTRY CONFIRMATION V2An indicator from candle man. Helps determine whether supply and demand zone are truly supply or demand.

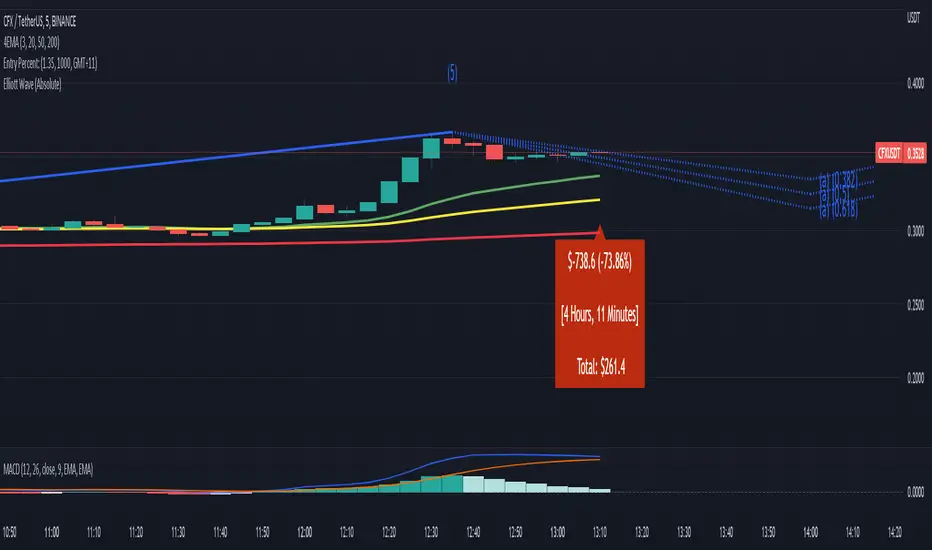
Entry Percent: EssamThis Pine Script code is designed to perform the task of computing and showcasing the profit percentage, profit value, and the duration for which a specific asset is held, all in real-time. The script effectively leverages the built-in resources to provide a seamless and robust experience, as it presents the calculated figures in an easily readable format on the chart, without causing any lag or disruptions to the chart.
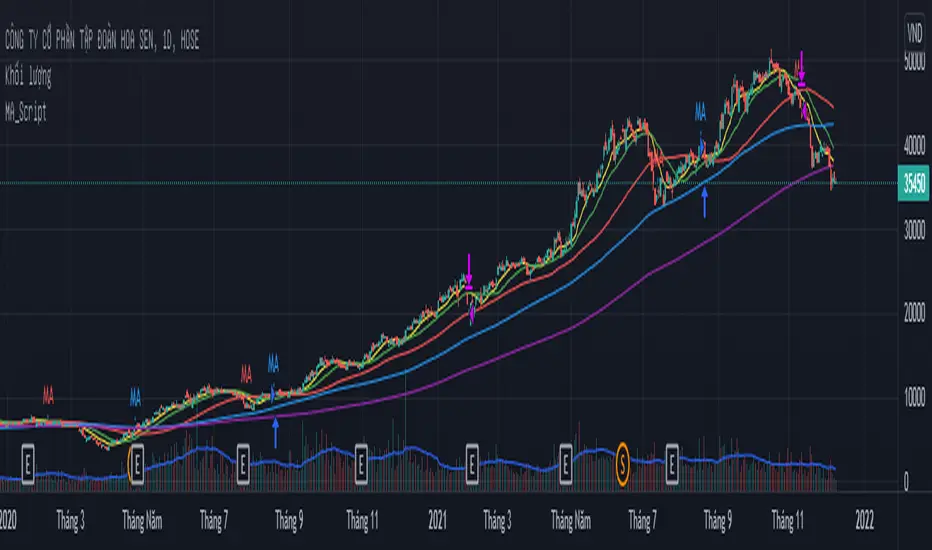
MA_Script- Entry Point : base on MA20, MA50, MA100, MA200.
- Exit Point : base on stop loss, MA and trailing stop.
sa-strategy with HTF-TSLEntry- based on HA close above HMA confirmation done with ST and HTF ATR
Exit- based on close below ATR which works as trailing SL

[MV] %B with SMA + Volume Based Colored Bars
Entry Signal when %B Crosses with SMA and this is more meaningful if it supports colored bars.
Black Bar when prices go down and volume is bigger than 150% of its average, that indicates us price action is supported by a strong bearish volume
Blue Bar when prices go up and volume bigger than 150% of its average, that indicates us price action is supported by a strong bullish volume
VBC author @KIVANCfr3762

FX Sniper: T3-CCI Strategy - With 100 IndicatorsEntry signal when moving above -100, sell signal when going below 100

Amazing Crossover SystemEntry Rules
BUY when the 5 EMA crosses above the 10 EMA from underneath and the RSI crosses above the 50.0 mark from the bottom.
SELL when the 5 EMA crosses below the 10 EMA from the top and the RSI crosses below the 50.0 mark from the top.
Make sure that the RSI did cross 50.0 from the top or bottom and not just ranging tightly around the level.
How to setup Alert:
1) Add the Amazing Crossover System to your chart via Indicators
2) Find your currency pair
3) Set the timeframe on the chart to 1 hour
4) Press 'Alt + A' (create alert shortcut)
5) Set the following criteria for the alert:
Condition = 'Amazing Crossover System', Plot, ' BUY Signal'
The rest of the alert can be customized to your preferences
5) Repeat steps 1 - 4, but set the Condition = 'Amazing Crossover System', Plot, ' SELL Signal'

Stocks: QQQ Daily ATR% + Premarket Range (% of ATR)## Stocks/ETFs: QQQ Premarket Range (% of Daily ATR) — ORB Trading Guide
### What this indicator does
This indicator is built for **stocks and ETFs** like **QQQ** and is meant to support **Opening Range Breakout (ORB)** trading.
It measures the **Premarket Range** from **04:00 to 09:30** (exchange time), then compares that move to QQQ’s **typical full-day movement** using **Daily ATR(14)**.
The goal is simple:
> **Before the open, decide whether the day is more likely to behave like a “chop day” or an “expansion day,” and then choose the ORB style that matches.**
---
## Key terms (plain English)
### Daily ATR(14)
ATR stands for **Average True Range**.
On the **daily** timeframe, ATR(14) estimates QQQ’s **typical daily movement** over the last 14 trading days.
Think of it as:
> “On a normal day, QQQ tends to move about *X* dollars.”
---
### ATR% (vs Daily Close)
This converts ATR into a percent of price so you can compare volatility over time:
Think of it as:
> “QQQ’s typical daily move is about *X%* of its price.”
---
### Premarket Range (04:00–09:30)
This is the distance between the **premarket high** and **premarket low** during the session window:
**04:00 → 09:30**
Think of it as:
> “How much QQQ already moved before the bell.”
---
### Premarket Range % of ATR
This is the core measurement:
It answers:
> “How much of a normal day’s movement already happened before the open?”
Examples:
* **20%** = quiet premarket (small move)
* **60%** = active premarket (big move already happened)
---
## How to interpret the Regime label
This script classifies the day into one of three “regimes”:
### **CHOP-LEANING** (Premarket Range < 25% of Daily ATR)
Premarket was quiet. The open is more likely to be:
* range-bound
* full of fakeouts
* slower follow-through
### **NEUTRAL** (25%–50%)
Normal premarket activity. Either outcome is possible:
* trend or chop
* you must let the open confirm it
### **EXPANSION-LEANING** (Premarket Range > 50%)
Premarket was very active. The open is more likely to:
* move faster
* expand range quickly
* have stronger directional pushes (or sharp swings)
**Important:** Expansion does not guarantee a clean trend. It means **movement is more likely**.
---
# How I use this indicator with ORB (my rules)
This indicator is not a buy/sell signal by itself.
I use it to decide **which ORB style to trade**.
## Step 1 — Check the “Regime” before the open
* If the indicator reads **EXPANSION-LEANING**, I treat it like a momentum environment.
* If the indicator reads **CHOP-LEANING**, I treat it like a confirmation environment.
* If it reads **NEUTRAL**, I stay selective and let price action confirm.
---
## Step 2 — ORB Execution Rules
### ✅ If **EXPANSION-LEANING** (momentum day)
**Goal:** Catch the move early and avoid missing the breakout.
**My ORB plan:**
* Build my opening range using the **5-minute ORB**
* Enter on a **break of the ORB level**
* Use the **1-minute timeframe** for the actual entry trigger
**How I confirm the break:**
* I want a clean break through the ORB level (not just a wick touch)
* If price snaps immediately back inside the ORB, I avoid chasing
This approach fits expansion days because QQQ can move fast after the open and waiting for perfect retests can cause you to miss the push.
---
### ✅ If **CHOP-LEANING** (confirmation day)
**Goal:** Avoid fakeouts and only enter when the break proves itself.
**My ORB plan:**
* Build my opening range using a **15-minute ORB**
* I do **not** enter on the first break
* I wait for a **break and retest**
* Then I use the **5-minute timeframe** to confirm the retest holds before entry
This fits chop days because breaks fail more often, so I require confirmation before committing.
---
### ✅ If **NEUTRAL**
**Goal:** Reduce low-quality trades.
**My ORB plan:**
* Treat it as “wait and see”
* Only take the break if price shows strong conviction (hold outside ORB)
* If price is whipping in and out of the range, I skip the trade
---
## Best practices
* Works best on **1m / 5m / 15m charts** so the premarket high/low is captured accurately.
* Premarket session time uses the symbol’s **exchange time**.
* Use proper risk management—QQQ can move fast, especially on expansion days.
---
## Disclaimer
This script is for educational purposes only and is not financial advice. Trading involves risk. Always use risk management and test any approach before trading live.

Futures: NQ Overnight Range (% of Daily ATR)## Futures: NQ Overnight Range (% of Daily ATR) — ORB Trading Guide
### What this indicator does
This indicator is built for **NQ / MNQ futures** and is meant to support **Opening Range Breakout (ORB)** trading.
Because futures trade nearly 24 hours, a lot of important movement happens during **Asia + London**. This script measures the **Overnight Range** from **18:00 to 09:30** (exchange time), then compares it to the market’s **typical full-day movement** using **Daily ATR(14)**.
The goal is simple:
> **Before the open, decide whether the day is more likely to behave like a “chop day” or an “expansion day,” and then choose the ORB style that matches.**
---
## Key terms (plain English)
### Daily ATR(14)
ATR is the average daily movement over the last 14 days.
Think of it as:
> “On a normal day, NQ tends to move about *X* points.”
---
### Overnight Range (18:00–09:30)
This is the distance between the **overnight high** and **overnight low** from 18:00 to 09:30.
Think of it as:
> “How much NQ already moved before the cash open.”
---
### Overnight Range % of ATR
This is the “volatility meter” for the day:
It answers:
> “How much of a normal day’s movement already happened overnight?”
---
## How to interpret the Regime label
This script classifies the day into one of three “regimes”:
### **CHOP-LEANING** (Overnight Range < 25% of Daily ATR)
Overnight was quiet. The open is more likely to be:
* range-bound
* full of fakeouts
* slower follow-through
### **NEUTRAL** (25%–50%)
Normal overnight activity. Either outcome is possible:
* trend or chop
* you must let the open confirm it
### **EXPANSION-LEANING** (Overnight Range > 50%)
Overnight was very active. The open is more likely to:
* move faster
* expand range quickly
* have stronger directional pushes (or sharp swings)
**Important:** Expansion does not guarantee a clean trend. It means **movement is more likely**.
---
# How I use this indicator with ORB (my rules)
This indicator is not a buy/sell signal by itself.
I use it to decide **which ORB style to trade**.
## Step 1 — Check the “Regime” before the open
* If the indicator reads **EXPANSION-LEANING**, I treat it like a momentum environment.
* If the indicator reads **CHOP-LEANING**, I treat it like a confirmation environment.
* If it reads **NEUTRAL**, I stay selective and let price action confirm.
---
## Step 2 — ORB Execution Rules
### ✅ If **EXPANSION-LEANING** (momentum day)
**Goal:** Catch the move early and avoid missing the breakout.
**My ORB plan:**
* Build my opening range using the **5-minute ORB**
* Enter on a **break of the ORB level**
* Use the **1-minute timeframe** for the actual entry trigger
**How I confirm the break:**
* I want a clean break through the ORB level (not just a wick touch)
* If price snaps immediately back inside the ORB, I avoid chasing
This approach fits expansion days because the market can move quickly and waiting for perfect retests can cause you to miss the push.
---
### ✅ If **CHOP-LEANING** (confirmation day)
**Goal:** Avoid fakeouts and only enter when the break proves itself.
**My ORB plan:**
* Build my opening range using a **15-minute ORB**
* I do **not** enter on the first break
* I wait for a **break and retest**
* Then I use the **5-minute timeframe** to confirm the retest holds before entry
This fits chop days because breaks fail more often, so I require confirmation before committing.
---
### ✅ If **NEUTRAL**
**Goal:** Reduce low-quality trades.
**My ORB plan:**
* Treat it as “wait and see”
* Only take the break if price shows strong conviction (hold outside ORB)
* If price is whipping in and out of the range, I skip the trade
---
## Best practices
* This indicator works best on **1m / 5m / 15m charts** so the overnight high/low is captured accurately.
* Times are based on the symbol’s **exchange time**.
* Use proper risk management—futures can move fast, especially on expansion days.
---
## Disclaimer
This script is for educational purposes only and is not financial advice. Futures trading carries significant risk. Always use risk management and test any approach before trading live.
---

Anh Nga 6.0 Split (Dynamic + MACD + PC)The script **Anh Nga 6.0 Split** is a professional-grade TradingView strategy designed for high-precision trading (specifically optimized for Gold/XAUUSD). It combines trend-following, momentum oscillators, and multi-timeframe analysis with a built-in automation bridge for **PineConnector** (MT4/MT5).
Here is a breakdown of how the strategy works for users.
---
## 1. Core Logic: How it Triggers
The strategy uses a "filter-first" approach, meaning it only looks for trades when multiple conditions align:
* **Primary Signal:** Uses the **Wave Trend (WT)** oscillator. It looks for "Gold Crosses" (long) or "Death Crosses" (short) when momentum is at extreme levels.
* **Trend Filter:** A dual Moving Average system (Fast 70 / Slow 140). It only buys if the price is above both and sells if below both.
* **MACD MTF Filter:** A "Big Brother" check. It looks at the MACD histogram on the **15-minute** and **30-minute** timeframes to ensure you aren't trading against the higher-timeframe momentum.
* **Overextension Guard:** It calculates the distance from the Fast MA using **ATR**. If the price has "run too far" from the average, it skips the trade to avoid buying the top or selling the bottom.
---
## 2. The "Split" Execution (Advanced Sizing)
The strategy classifies trades into two quality tiers based on **Bollinger Band Zones**:
| Trade Type | Condition | Position Size |
| --- | --- | --- |
| **AAA Zone** | Price is close to the Basis (Mean) | **100%** of your base lot |
| **B Zone** | Price is slightly stretched | **80%** of your base lot |
**Automated Partial Exits:**
When a trade is entered, it splits the position into two orders:
1. **Partial Runner (65%):** Aimed at a closer "TP1" to lock in profits early.
2. **Final Runner (35%):** Aimed at the full Risk:Reward target.
* **Break-Even Logic:** Once the first target is hit, the script automatically sends a command to move the Stop Loss to the entry price (BE).
---
## 3. Risk Management & Guards
* **Reversal Guard:** Prevents "revenge trading" by enforcing a cooldown period (default 5 bars) after an exit before you can trade in the opposite direction.
* **Dynamic Stop Loss:** Uses a **Bollinger Band Multiplier (1.7x)** to place stops outside of immediate market noise.
* **Max SL Filter:** If the market is too volatile and the calculated Stop Loss is larger than your "Max SL Dollars" (e.g., $35), the strategy will skip the trade entirely.
---
## 4. PineConnector Automation
The script is pre-configured to talk to MetaTrader 4/5 via **PineConnector**.
* It generates formatted alert messages containing your **License ID**, **Magic Number**, and **Volume**.
* It handles `buy`, `sell`, `modify` (for Break-Even), and `closeall` commands automatically.
### Visual Guide
* **Teal Line:** Fast Moving Average ().
* **White Line:** Slow Moving Average ().
* **Green/Red Zones:** Visual "AAA" and "B" zones for entry quality.
* **Red/Green Lines:** Active Stop Loss and Take Profit levels currently being tracked.
---

Deep Early Pullback ScannerIdentifies high-probability early entry setups in trending stocks. It high lights small-bodied red pullback candles within an uptrend, signaling potential continuation moves before conventional UT Bot buy signal triggers

Brahmastra Moving Average ADX🔱 BRAHMASTRA MOVING AVERAGE ADX 🔱
━━━━━━━━━━━━━━━━━━━━━━━━━━━━━━━━━━
A precision trend detection system that fuses the Average Directional Index (ADX) with a dynamic Weighted Moving Average (WMA) to deliver crystal-clear trend signals.
█ HOW IT WORKS
━━━━━━━━━━━━━━
This indicator analyzes both TREND STRENGTH (via ADX) and TREND DIRECTION (via +DI/-DI) to color-code the moving average:
🟢 GREEN MA = Strong Uptrend (ADX > threshold + Bullish bias)
🔴 RED MA = Strong Downtrend (ADX > threshold + Bearish bias)
⚫ GRAY MA = Ranging/Weak Trend (ADX below threshold)
█ KEY FEATURES
━━━━━━━━━━━━━━
✅ ADX-Based Trend Confirmation - Only signals when trend strength is confirmed
✅ Color-Coded WMA - Instantly identify trend direction at a glance
✅ Buy/Sell Signals - Visual markers on trend reversals
✅ Real-Time Info Panel - Live ADX, +DI/-DI values, and trend status
✅ Customizable Visuals - Adjust colors, line width, and fill zones
✅ Built-In Alerts - Get notified on trend changes
█ SETTINGS
━━━━━━━━━━
- DI Length (default: 14) - Period for +DI/-DI calculation
- ADX Smoothing (default: 14) - Smoothing period for ADX
- ADX Trend Threshold (default: 18) - Minimum ADX to confirm trend
- MA Length (default: 9) - Period for the Weighted Moving Average
█ HOW TO USE
━━━━━━━━━━━━
1. TREND TRADING: Enter long when MA turns GREEN, short when RED
2. RANGE FILTER: Avoid trades when MA is GRAY (ranging market)
3. CONFIRMATION: Use the info panel to verify ADX strength before entry
4. ALERTS: Set up alerts to catch trend changes automatically
█ BEST TIMEFRAMES
━━━━━━━━━━━━━━━━━
Works on all timeframes. Recommended: 15M, 1H, 4H, Daily
█ CREDITS
━━━━━━━━━
Developed by Brahmastra Trading Systems
Inspired by the legendary ADX indicator by J. Welles Wilder Jr.
━━━━━━━━━━━━━━━━━━━━━━━━━━━━━━━━━━
💡 Like & Follow for more premium indicators!

Breakout Targets [AlgoAlpha]🟠 OVERVIEW
This script identifies consolidation zones and provides automated breakout targets with risk management levels. It focuses on finding periods where price action compresses and then tracks the subsequent breakout from these ranges. When a price breakout is confirmed, the script automatically projects three take-profit (TP) levels and a stop-loss (SL) based on current market volatility. This helps traders move from identifying a range to executing a trade with predefined exit points without manual calculation.
🟠 CONCEPTS
The script uses a relationship between Weighted Moving Averages (WMA) and Exponential Moving Averages (EMA) of price ranges to detect consolidation. When these moving averages cross, it triggers the detection of recent pivot highs and lows to draw a visual "box" or channel. This channel represents the current trading range. Once price closes outside this box, the script uses the Average True Range (ATR) to determine the volatility-adjusted distance for the stop loss. The take-profit levels are then calculated as multiples of this risk distance, ensuring a consistent reward-to-risk approach.
🟠 FEATURES
Dynamic box drawing that highlights potential supply and demand zones within the range.
Real-time breakout signals with bullish (green) and bearish (red) markers.
Automated trade projection including Entry, SL, and three TP levels.
Integrated alert system for breakouts and hits on any profit or loss target.
🟠 USAGE
Setup : Add the script to your chart and adjust the "Range Detection Period." A higher period will find larger, more significant ranges, while a lower period will find smaller, short-term consolidation zones.
Read the chart : Look for the grey boxes on your chart; these represent areas where the market is "coiling." A green arrow label indicates a bullish breakout from the top of the box, while a red arrow indicates a bearish breakout from the bottom. Once a breakout occurs, follow the projected horizontal levels for your trade management.
Settings that matter : The Stop Loss ATR Multiplier is the most critical setting for risk; increasing it will give the trade more room to breathe but will also push your TP levels further away. The Prevent Overlap toggle is useful for keeping the chart clean by ensuring the script doesn't draw new boxes until the current range has been resolved.

Big Candle Identifier with RSI Divergence and Advanced Stops1. Strategy Objective
The main goal of this strategy is to:
Identify significant price momentum (big candles).
Enter trades at opportune moments based on market signals (candlestick patterns and RSI divergence).
Limit initial risk through a fixed stop loss.
Maximize profits by using a trailing stop that activates only after the trade moves a specified distance in the profitable direction.
2. Components of the Strategy
A. Big Candle Identification
The strategy identifies big candles as indicators of strong momentum.
A big candle is defined as:
The body (absolute difference between close and open) of the current candle (body0) is larger than the bodies of the last five candles.
The candle is:
Bullish Big Candle: If close > open.
Bearish Big Candle: If open > close.
Purpose: Big candles signal potential continuation or reversal of trends, serving as the primary entry trigger.
B. RSI Divergence
Relative Strength Index (RSI): A momentum oscillator used to detect overbought/oversold conditions and divergence.
Fast RSI: A 5-period RSI, which is more sensitive to short-term price movements.
Slow RSI: A 14-period RSI, which smoothens fluctuations over a longer timeframe.
Divergence: The difference between the fast and slow RSIs.
Positive divergence (divergence > 0): Bullish momentum.
Negative divergence (divergence < 0): Bearish momentum.
Visualization: The divergence is plotted on the chart, helping traders confirm momentum shifts.
C. Stop Loss
Initial Stop Loss:
When entering a trade, an immediate stop loss of 200 points is applied.
This stop loss ensures the maximum risk is capped at a predefined level.
Implementation:
Long Trades: Stop loss is set below the entry price at low - 200 points.
Short Trades: Stop loss is set above the entry price at high + 200 points.
Purpose:
Prevents significant losses if the price moves against the trade immediately after entry.
D. Trailing Stop
The trailing stop is a dynamic risk management tool that adjusts with price movements to lock in profits. Here’s how it works:
Activation Condition:
The trailing stop only starts trailing when the trade moves 200 ticks (profit) in the right direction:
Long Position: close - entry_price >= 200 ticks.
Short Position: entry_price - close >= 200 ticks.
Trailing Logic:
Once activated, the trailing stop:
For Long Positions: Trails behind the price by 150 ticks (trail_stop = close - 150 ticks).
For Short Positions: Trails above the price by 150 ticks (trail_stop = close + 150 ticks).
Exit Condition:
The trade exits automatically if the price touches the trailing stop level.
Purpose:
Ensures profits are locked in as the trade progresses while still allowing room for price fluctuations.
E. Trade Entry Logic
Long Entry:
Triggered when a bullish big candle is identified.
Stop loss is set at low - 200 points.
Short Entry:
Triggered when a bearish big candle is identified.
Stop loss is set at high + 200 points.
F. Trade Exit Logic
Trailing Stop: Automatically exits the trade if the price touches the trailing stop level.
Fixed Stop Loss: Exits the trade if the price hits the predefined stop loss level.
G. 21 EMA
The strategy includes a 21-period Exponential Moving Average (EMA), which acts as a trend filter.
EMA helps visualize the overall market direction:
Price above EMA: Indicates an uptrend.
Price below EMA: Indicates a downtrend.
H. Visualization
Big Candle Identification:
The open and close prices of big candles are plotted for easy reference.
Trailing Stop:
Plotted on the chart to visualize its progression during the trade.
Green Line: Indicates the trailing stop for long positions.
Red Line: Indicates the trailing stop for short positions.
RSI Divergence:
Positive divergence is shown in green.
Negative divergence is shown in red.
3. Key Parameters
trail_start_ticks: The number of ticks required before the trailing stop activates (default: 200 ticks).
trail_distance_ticks: The distance between the trailing stop and price once the trailing stop starts (default: 150 ticks).
initial_stop_loss_points: The fixed stop loss in points applied at entry (default: 200 points).
tick_size: Automatically calculates the minimum tick size for the trading instrument.
4. Workflow of the Strategy
Step 1: Entry Signal
The strategy identifies a big candle (bullish or bearish).
If conditions are met, a trade is entered with a fixed stop loss.
Step 2: Initial Risk Management
The trade starts with an initial stop loss of 200 points.
Step 3: Trailing Stop Activation
If the trade moves 200 ticks in the profitable direction:
The trailing stop is activated and follows the price at a distance of 150 ticks.
Step 4: Exit the Trade
The trade is exited if:
The price hits the trailing stop.
The price hits the initial stop loss.
5. Advantages of the Strategy
Risk Management:
The fixed stop loss ensures that losses are capped.
The trailing stop locks in profits after the trade becomes profitable.
Momentum-Based Entries:
The strategy uses big candles as entry triggers, which often indicate strong price momentum.
Divergence Confirmation:
RSI divergence helps validate momentum and avoid false signals.
Dynamic Profit Protection:
The trailing stop adjusts dynamically, allowing the trade to capture larger moves while protecting gains.
6. Ideal Market Conditions
This strategy performs best in:
Trending Markets:
Big candles and momentum signals are more effective in capturing directional moves.
High Volatility:
Larger price swings improve the probability of reaching the trailing stop activation level (200 ticks).
