CM_MACD_Ult_MTF + Entry SignalsThis script is an enhanced and updated version of the classic CM_Ult_MacD_MTF originally created by ChrisMoody.
It preserves the full functionality, look, and behavior of the original multi-timeframe MACD, including:
Multi-timeframe MACD calculation
4-color histogram based on momentum direction
Optional MACD and Signal line display
Optional crossover dots
Color-changing MACD line on signal cross
Zero-line reference
This upgraded version adds entry signals based on MACD/Signal crossovers:
New Features Added
LONG @ price label when MACD crosses above Signal
SHORT @ price label when MACD crosses below Signal
Labels appear directly at the crossover point
Full support for Pine Script® v6, making it compatible with TradingView’s latest publishing requirements
Why this version?
The original script was written in an older Pine version and was no longer publishable.
This version keeps the full visual identity and logic of the classic MACD while adding modern compatibility and helpful trading signals.
Credits
Original concept and visual framework: ChrisMoody
Added features, Pine v6 migration, and enhancements: tgambinox
Search in scripts for "entry"

Liquidity Hunt Detector PDH/PDL [SmartFoxy]Liquidity Hunt Detector PDH/PDL
The Liquidity Hunt Detector (LHD) is designed to identify and anticipate liquidity grabs around the:
• Previous Day High (PDH);
• Previous Day Low (PDL).
It builds dynamic trigger levels that highlight where price may deliver its first impulse before reaching PDH/PDL.
The Liquidity Hunt Detector (LHD) identifies high-probability reversals and continuations around the Previous Day High (PDH) and Previous Day Low (PDL).
It dynamically tracks the market’s move from the session open, builds trigger levels toward PDH/PDL, and highlights where liquidity is most likely to be taken.
When price taps a Trigger Up/Down level, the indicator generates Long/Short signals with optional confirmation from the integrated MA Ribbon , ensuring only high-quality, trend-aligned setups are shown.
When price interacts with these trigger levels, the indicator generates signals that help traders evaluate the market structure and prepare for potential entries.
Designed for Forex, Crypto, Indices, Stocks , the LHD provides a clean and intuitive structure for navigating intraday liquidity grabs, session impulses, and directional bias shifts.
The indicator is built from three fully independent modules, each of which can be used separately:
Liquidity Hunt Detector (LHD)
Moving Average Ribbon (MA Ribbon)
Previous Day High/Low (PDH/PDL) levels
Liquidity Hunt Detector (LHD) Logic
1.1 Display LHD – Enables or disables the entire Liquidity Hunt Detector module.
1.2 Max Days – Number of previous days used to generate PDH/PDL levels.
1.3 GMT – Corrects all time-based calculations based on your broker/session timezone.
1.4 Calculation Method (Point A Logic)
1) Static Method
Point A = the session’s opening price.
Trigger lines are calculated strictly as a percentage of the move A → PDH or A → PDL.
Intraday fluctuations do not affect the calculation.
2) Dynamic Method
Point A updates using the current intraday high/low:
• If price forms a new low, Point A updates for the PDH-side calculations;
• If price forms a new high, Point A updates for the PDL-side calculations.
This produces trigger lines that reflect the true live market structure rather than a fixed opening reference.
1.5 Main OTT Time (Operational Trading Time)
This is the core time window during which the indicator:
• updates Point A;
• calculates trigger levels;
• validates PDH/PDL;
• draws AB / AC movement structure;
• generates entry signals.
Outside this window, no new signals or recalculations occur.
⚠ If your broker’s first candle opens at a non-standard time (e.g., 00:08), adjust the OTT start time to avoid visual artifacts.
1.6 Show Line A – Displays the opening price level (Point A) until the end of the OTT window.
Style, width, and color are customizable.
1.7 Show Line AB — Price Movement Toward PDH.
Static Method – Single line: A → PDH
Dynamic Method – Two segments:
• A → Daily Low;
• Daily Low → PDH.
If PDH is swept, the “B” label switches to Sweep PDH.
1.8 Show Line AC – Price Movement Toward PDL.
Static Method – Single line: A → PDL
Dynamic Method – Two segments:
• A → Daily High;
• Daily High → PDL.
If PDL is swept, the “C” label switches to Sweep PDL.
1.9 Show Trigger Up Line (LONG Trigger) – Defines the level where the Long signal can activate.
By default, at 50% of the A → PDH movement.
When price touches this line, the script may:
• show a LONG label;
• trigger an alert.
All visual parameters are customizable.
1.10 Show Trigger Up Line (LONG Trigger)
Same logic as Trigger Up, but based on A → PDL.
1.11 Show Main Zone (OTT Zone) – Visual background highlighting of the active OTT window.
Helps instantly see:
• whether signals are allowed;
• how much time remains in the trading window?
Color and opacity are adjustable.
1.12 Upper Zone (toward PDH) – Tracks the protected area towards PDH.
Updates dynamically with new highs.
1.13 Lower Zone (toward PDL) – Tracks the zone toward PDL.
Updates dynamically with new lows.
1.14 Show Labels – Displays reference labels (A, B, C, Trigger Up, Trigger Down).
Label size is customizable.
1.15 Add Price – Adds the exact price value to each label.
1.16 Change Color after Sweep PDH or PDL – After PDH or PDL is broken, the indicator automatically recolors lines and labels to visually confirm the sweep.
1.17 Show SHORT Label – Displays the SHORT entry label when all conditions for a bearish signal are met.
Style parameters are set in the previous blocks.
1.18 Alert on Bearish Trigger Down – Triggers an alert when the price activates the bearish trigger.
1.19 Show LONG Label – Displays the LONG entry label when bullish conditions are met.
Style parameters are set in the previous blocks.
1.20 Alert on Bullish Trigger Up – Triggers an alert when the price activates the bullish trigger.
1.21 Alerts Active Time – Defines a custom time interval during which trigger signals are allowed.
Even if price touches a trigger level,
❗ signals will NOT be generated outside this allowed time.
Useful for:
• avoiding Asian session signals;
• reducing noise in low-liquidity periods.
1.22 Labels and Alerts Display Mode
Two settings modes:
• On Trigger (Instant Mode) – Signals appear immediately when price touches the trigger.
• On Candle Close (Conservative Mode) – Signals form only after the candle closes beyond the trigger level.
A more conservative option.
1.23 Delay LHD Signal Until MA Ribbon Confirms Direction – If enabled, LHD signals will NOT fire until the MA Ribbon produces a matching directional signal.
Logic:
• Price hits the trigger → LHD conditions become “armed”;
• The indicator waits;
• When MA Ribbon confirms trend direction (Long/Short);
• The final LHD label + alert is generated.
This ensures LHD trades are filtered and aligned with MA-based trend confirmation.
⚠ Works only when the MA Ribbon module is active.

PLANBXPRESS PSYCHOLOGICAL LEVEL ENTRY MODELThis Indicator merges multiple professional trading concepts into one visual tool — helping traders identify momentum shifts, entry zones, and daily trading plans with volume confirmation.
It automatically detects trend direction, generates dynamic take-profit & stop-loss levels, and overlays key daily reference points such as VWAP, pivot, support, and resistance zones based on ATR and trend context.
⚙️ Main Components
1️⃣ Signal System
Detects trend bias using SMA-based logic.
Generates entry price, TP1–TP3, and SL dynamically from recent impulse ranges.
Updates signals automatically when trend bias changes or previous targets are hit.
Visual levels are drawn directly on the chart.
2️⃣ Volume Analysis
Compares current volume against a moving average (SMA).
Classifies volume as:
🟢 Strong (above 1.5× average)
🟡 Average
🔴 Weak (below 0.8× average)
Displays the current volume strength and trend bias in an on-chart table.
3️⃣ Auto Day Plan
Uses multi-timeframe ATR calculations to define:
Support / Resistance zones
Pivot & Balance areas
Daily VWAP
Auto Targets (ATR-based expansion levels)
Adapts automatically to selected base timeframe (1H, 4H, or Daily).
4️⃣ Trend Context
Dual EMA system (50 & 200) to confirm bullish/bearish structure.
Aligns expected direction with VWAP & pivot location for context-aware bias.
🎯 What You Get on Chart
📈 Automatic LONG/SHORT signals
🎯 TP1, TP2, TP3, and SL levels
📊 Volume strength meter
🧭 VWAP, pivot, support/resistance & balance zones
🎨 Clean visual layout for intraday and swing traders
🧩 Inputs
Parameter Description
lenImpulse Impulse range length
smaLen SMA length for trend bias
levelRatio SL/TP ratio multiplier
volLen Volume SMA length
baseTF Base timeframe for zones/VWAP
atrMult1 / atrMult2 ATR multipliers for target levels
fwdBars Extension range for future projection
💡 How to Use
Add the script to your chart and choose your preferred timeframe.
Observe signal direction (📈 LONG / 📉 SHORT) and TP/SL levels.
Confirm entries when:
Trend aligns with VWAP direction, and
Volume category shows Strong or Average.
Use Auto Day Plan levels (pivot, balance, VWAP) as intraday reaction zones.

PLANBXPRESS ENTRYThe Combined Signal + Auto Day Plan + Volume indicator merges multiple professional trading concepts into one visual tool — helping traders identify momentum shifts, entry zones, and daily trading plans with volume confirmation.
It automatically detects trend direction, generates dynamic take-profit & stop-loss levels, and overlays key daily reference points such as VWAP, pivot, support, and resistance zones based on ATR and trend context.
⚙️ Main Components
1️⃣ Signal System
Detects trend bias using SMA-based logic.
Generates entry price, TP1–TP3, and SL dynamically from recent impulse ranges.
Updates signals automatically when trend bias changes or previous targets are hit.
Visual levels are drawn directly on the chart.
2️⃣ Volume Analysis
Compares current volume against a moving average (SMA).
Classifies volume as:
🟢 Strong (above 1.5× average)
🟡 Average
🔴 Weak (below 0.8× average)
Displays the current volume strength and trend bias in an on-chart table.
3️⃣ Auto Day Plan
Uses multi-timeframe ATR calculations to define:
Support / Resistance zones
Pivot & Balance areas
Daily VWAP
Auto Targets (ATR-based expansion levels)
Adapts automatically to selected base timeframe (1H, 4H, or Daily).
4️⃣ Trend Context
Dual EMA system (50 & 200) to confirm bullish/bearish structure.
Aligns expected direction with VWAP & pivot location for context-aware bias.
🎯 What You Get on Chart
📈 Automatic LONG/SHORT signals
🎯 TP1, TP2, TP3, and SL levels
📊 Volume strength meter
🧭 VWAP, pivot, support/resistance & balance zones
🎨 Clean visual layout for intraday and swing traders
🧩 Inputs
Parameter Description
lenImpulse Impulse range length
smaLen SMA length for trend bias
levelRatio SL/TP ratio multiplier
volLen Volume SMA length
baseTF Base timeframe for zones/VWAP
atrMult1 / atrMult2 ATR multipliers for target levels
fwdBars Extension range for future projection
💡 How to Use
Add the script to your chart and choose your preferred timeframe.
Observe signal direction (📈 LONG / 📉 SHORT) and TP/SL levels.
Confirm entries when:
Trend aligns with VWAP direction, and
Volume category shows Strong or Average.
Use Auto Day Plan levels (pivot, balance, VWAP) as intraday reaction zones.

Reversals & Pullbacks PRO🚀 Reversals & Pullbacks Pro — Predict Market Turning Points with Precision
Stop chasing trends — start anticipating them.
The Reversals & Pullbacks Pro indicator identifies high-probability reversal and pullback zones before they happen, using advanced mean reversion logic and momentum change signals.
What it does:
✅ Detects major reversals and minor pullbacks in real time
✅ Uses dynamic mean reversion algorithms to spot over-extended price moves
✅ Highlights premium entry zones for counter-trend and trend-reversal setups
✅ Works across many markets — Designed for Forex and Indices but can be used on Crypto
✅ Clean visuals with smart alerts (no repainting after candle close)
💡 Perfect for:
Swing traders, scalpers, and day traders who want to catch price turning points before everyone else.
⏱️ Don’t react — predict.
Upgrade your trading with Reversals & Pullback Pro and trade market reversals like a PRO!

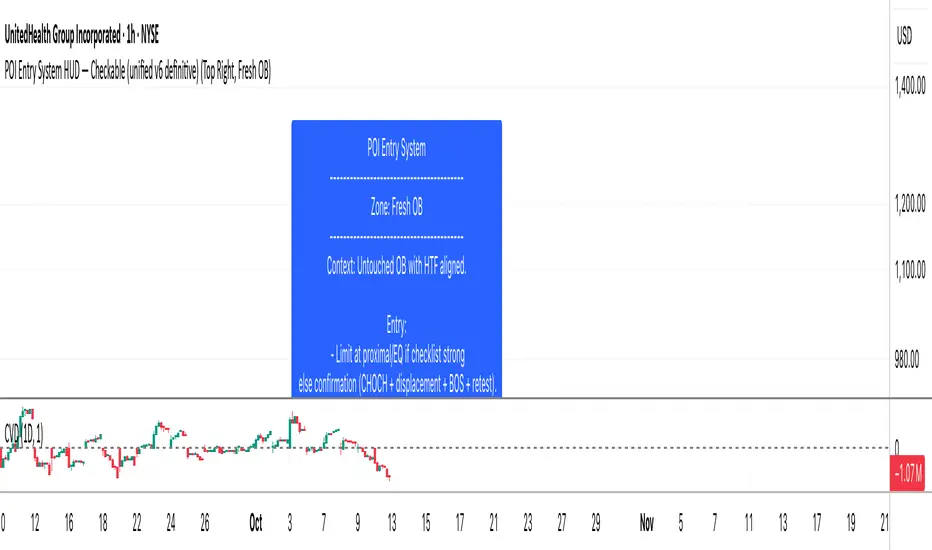
Order Block Smart Entry (v6)very useful indicator, analyze multiframes to identify the trend, then find out the valid order block and after analyzing lower time frame entry gives the singal.

V2 RSI Exhaustion + EMA Trend Filter (Improved Entry Signals)V2 RSI Exhaustion + EMA Trend Filter (Improved Entry Signals)

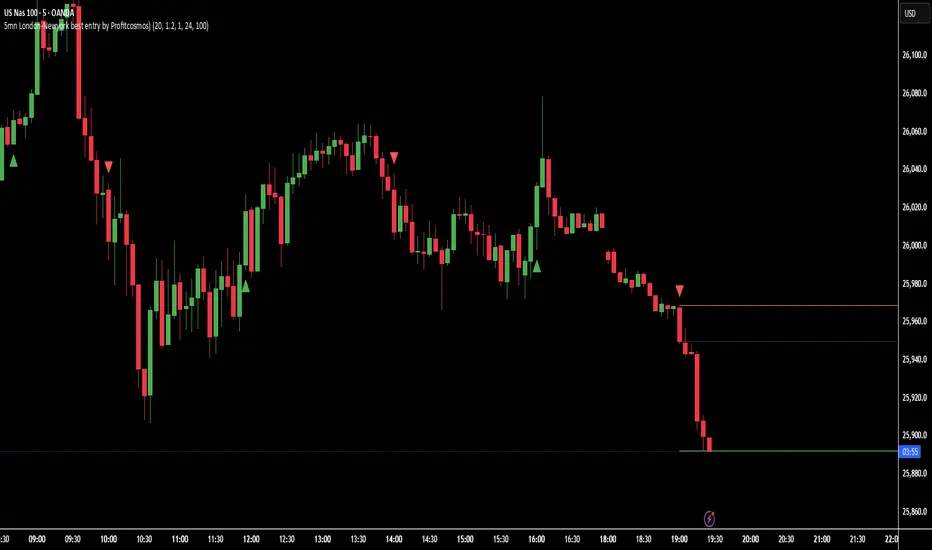
5mn London-Newyork best entry by Profitcosmos)This indicator is engineered for scalpers and day traders who trade during the London and New York sessions — the most volatile and liquid market hours.
It automatically detects high-probability breakout structures, filters false moves using ATR-based volatility logic, and dynamically projects Entry, Stop Loss (SL), and Take Profit (TP) levels directly on the chart.
⚙️ Core Features
🧠 Smart Market Structure Detection:
Automatically identifies bullish and bearish structure shifts using swing highs/lows.
📊 ATR Volatility Filter:
Uses an adaptive ATR multiplier to confirm genuine breakouts and filter noise.
🕒 Session Filter (Optional):
Restrict signals to your chosen trading hours — ideal for London and New York overlap.
🎯 Auto Entry / SL / TP Projection:
SL: Placed below (for BUY) or above (for SELL) the two previous candle extremes.
TP: Automatically calculated at 3× the distance from Entry to SL.
Projection: Visual lines and labels extend 100 bars into the future, clearly marking your trade levels.
🔁 Alternating Signal Logic:
Prevents consecutive duplicate signals to keep the chart clean and trades logical.
📈 Visual Clarity:
Each trade setup is plotted with colored lines (Entry, SL, TP) and labels pointing left for easy visibility.
🔔 Alerts Ready:
Built-in alerts for both BUY and SELL signals to automate or notify your entries.
🪙 Why you will Love It
This tool helps identify the cleanest momentum-based entries in the 5-minute chart during high-volume hours.
It’s especially effective for XAUUSD, NAS100, and major Forex pairs, where breakout structure shifts happen fast and decisively.
🧭 Recommended Settings
Timeframe: 5 minutes
Sessions: London (3–10 AM EST) & New York (8 AM–4 PM EST)
ATR Multiplier: 1.2–1.5 (adjust for volatility)
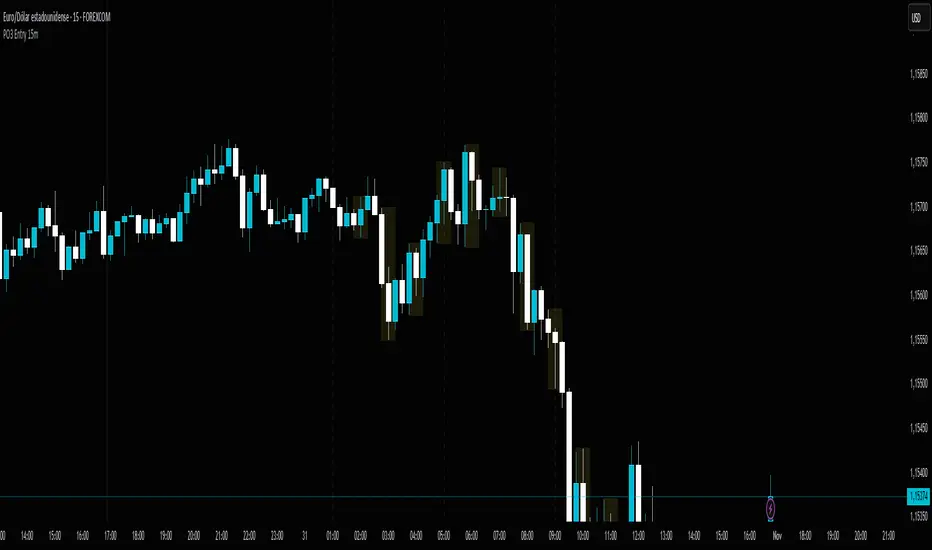
PO3 Entry 15m + Time Lines - Range Logic TradingPO3 Entry 15m + Time Lines - Professional Indicator for NY Sessions
🎯 DESCRIPTION:
Advanced indicator designed for traders operating in New York sessions. Combines customizable trading zones with key time lines for perfect visual management of your strategy.
🌟 KEY FEATURES:
🕒 STRATEGIC TIME LINES
Vertical lines at key times: 1:00 AM, 5:00 AM, and 9:00 AM (NY Time)
Perfect for identifying 4H candle openings and session changes
Configurable colors and styles (solid, dashed, dotted)
Visible only for the last 5 days to keep charts clean
📊 10 CUSTOMIZABLE TRADING ZONES
10 fully configurable zones with specific time ranges
Each zone displays an expanding box during its active period
Automatic High/Low tracking during zone duration
Informative labels with customizable names
Individual colors and styles for each zone
⚙️ COMPLETE CONFIGURATION:
Time Zone: America/New_York, UTC, Europe/London, Asia/Tokyo
Days to Show: 1-30 days (5 by default)
Individual activation for each zone and time lines
Customizable colors for every element
Line Styles: Solid, Dashed, Dotted
🎨 PROFESSIONAL VISUALIZATION:
Semi-transparent boxes that don't obstruct price action
Extendable lines from top to bottom of chart
Automatic daily reset to prevent accumulation
500 box limit for optimal performance
📈 IDEAL FOR:
NY Session traders (1:00 AM - 12:00 PM EST)
Time-based trading strategies
Visual identification of interest zones
Session management and planning
🛠️ RECOMMENDED USE:
Configure the 10 zones with your trading hours
Activate time lines for visual reference
Adjust colors according to your preference
Set days to display based on your strategy
Optimize your trading with this all-in-one indicator that combines time precision with flexible custom trading zones!
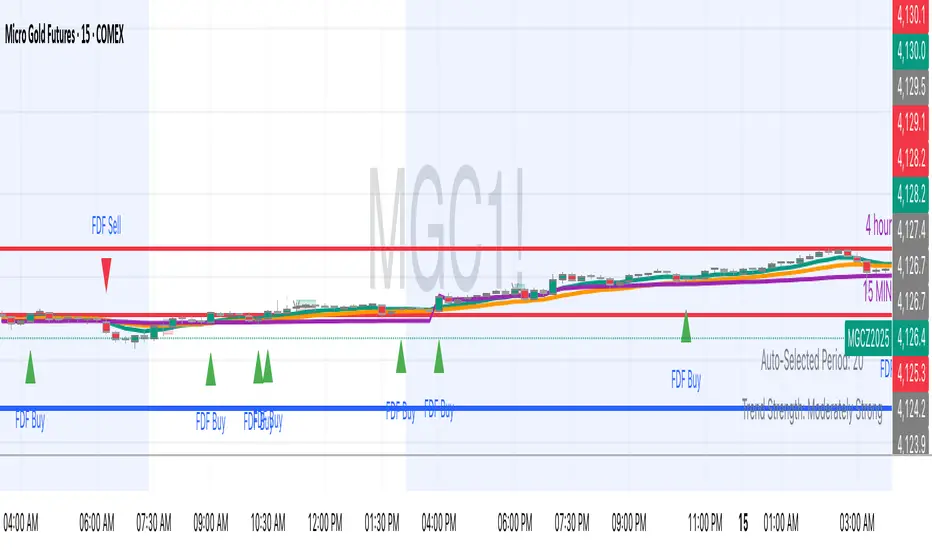
FDF — EMAs+VWAP with setup & entry (stable scale) - Final 9
21
vwap
entry system
90% candle
tend
This will help you find the perfect entry off the 9 and 21 using the vwap for confluence. We have a strick 90% candle or wick off the 21
We have wick on the entry side more than 30% of the candle

FDF — EMAs+VWAP with setup & entry (stable scale)the 9 and 21, vwap - and support an restianst, marking each entry when it pulling in our out to the 21. used 90% of the candle over the 21
EMA50 Pullback + Re-entry Candle ColorModification of candle color, break or pullback so we can know about the confirmation candle and make decision whether we can entry or not

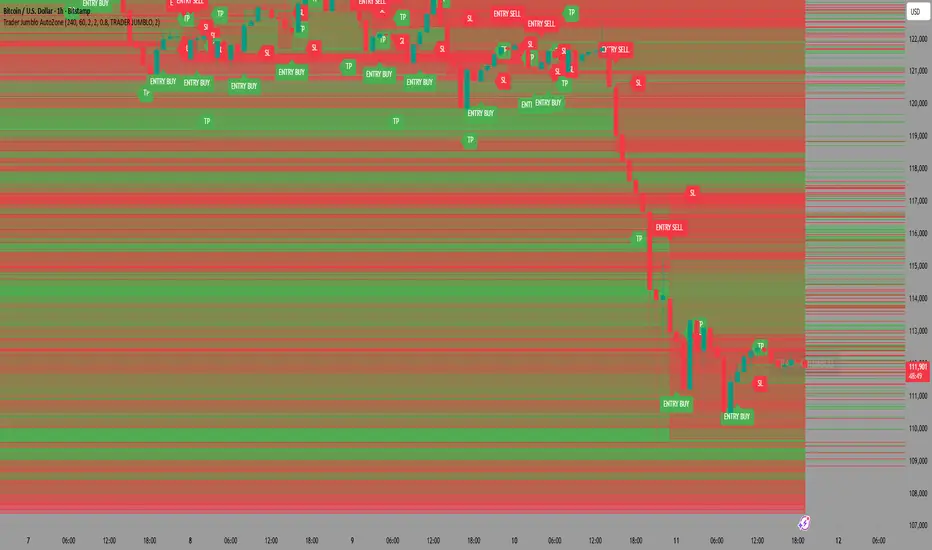
Trader Jumblo AutoZone – Precision Entry SystemTrader Jumblo Auto Zone is a precision entry system developed by Trader Jumblo, designed for traders who demand accurate, fast, and structure-based market entries.
🚀 Core Features:
✅ Automatically detects Supply & Demand Zones from H1 & H4 structures
✅ Automatically plots Entry, Take-Profit (TP), and Stop-Loss (SL) based on active zones
✅ Provides LIVE Alerts when a candle touches a valid zone
✅ Zones automatically fade out after being used
✅ No repaint — all signals remain valid after bar confirmation
📊 Best Used For:
• Scalping & Intraday Trading
• Zone Confirmation & Retest Entries
• Works perfectly when combined with liquidity-based analysis
Magracia Entry-Exit 5 Min Time frame//------------------------------------------------------------------------------------------------------
// 🧭 Indicator Description
//------------------------------------------------------------------------------------------------------
// 📘 Overview:
// This indicator is a modified version of the LuxAlgo pattern logic designed to detect
// high-probability **RBD (Rally–Base–Drop)** and **DBR (Drop–Base–Rally)** reversal structures
// directly on the current candle. It automatically identifies potential BUY and SELL zones,
// plots corresponding trade signals, and dynamically calculates **Take Profit (TP)** and **Stop Loss (SL)** levels.
//
// The goal of this tool is to give clear, visually guided trade entries and exits that
// follow price structure and momentum changes without repainting historical data.
//
//------------------------------------------------------------------------------------------------------
// 🧩 How It Works:
// • **RBD (Rally–Base–Drop)** → Indicates a bearish reversal (SELL signal)
// • **DBR (Drop–Base–Rally)** → Indicates a bullish reversal (BUY signal)
// • Optional **RBR / DBD** continuation patterns can be toggled on for trend continuation setups.
// • When a signal is detected, the script automatically places:
// ▫ A BUY or SELL marker at the candle
// ▫ Dynamic TP (green dotted line) and SL (red dotted line) levels
// ▫ An EXIT marker when either TP or SL is reached
//
//------------------------------------------------------------------------------------------------------
// ⚙️ Inputs:
// • Enable or disable individual pattern types (RBD, RBR, DBD, DBR)
// • Toggle continuation patterns (RBR/DBD)
// • Customize Take Profit and Stop Loss percentages
// • Adjust rally/drop bar colors for easier pattern visualization
//
//------------------------------------------------------------------------------------------------------
// 🧠 Usage Tips:
// • Works best on volatile pairs and short–term timeframes (1m to 15m)
// • Can be combined with volume or trend filters for stronger confirmation
// • When used on higher timeframes (e.g., 4H+), increase TP/SL percentage range
//
//------------------------------------------------------------------------------------------------------
// ⚠️ Notes:
// • Signals are plotted **in real-time on the current candle** (not delayed).
// • This indicator is for visual and educational use only and does not guarantee profitability.
// • For optimal results, combine it with proper risk management and confirmation indicators.
//
//------------------------------------------------------------------------------------------------------
// © Gideon (CC BY-NC-SA 4.0 Licensed)
//------------------------------------------------------------------------------------------------------

Palat Trading System Entry Prices (Bear)This script gives you the entry points for 4,5,6,7 consecutive candles which got up closing vs last trading day.

Palat Trading System Entry Prices (Bull)This script gives you the entry points for 4,5,6,7 consequetive candles which got down closing vs last trading day.

FEI: Futures Entry Identifier📘 FEI: Futures Entry Identifier
FEI is a modular, futures-grade entry engine designed for precision trading across GC1!, MNQ1!, ES1!, and related contracts. It combines manual SVP structure, CHoCH detection, and Colby-style candle strength filters to identify high-probability long and short entries.
🔧 Features
• Manual SVP inputs (VAH, VAL, POC)
• Symbol-aware filters for micro vs standard contracts
• Multi-timeframe signal logic (3m, 5m, 10m, 15m, 30m)
• CHoCH detection with optional engulfing filter (default off)
• FRVP entry zone plotting after CHoCH confirmation
• Candle coloring on CHoCH trigger
• Session-aware logic (ETH default, optional RTH-only)
• Narratable visuals and audit-safe alerts
🧭 How to Use
1. Input VAH, VAL, and POC manually
2. Select signal timeframe (e.g. 3m or 5m)
3. Watch for CHoCH (white candle = structural shift)
4. Entry line plots at top/bottom of recent range
5. Long/short markers appear when SVP + candle strength align
6. Toggle RTH-only mode if needed
🌟 Why It’s Unique
FEI is built for traders who demand clarity, structure, and precision. Every signal is narratable, audit-safe, and resolution-aware—ideal for futures overlays and sniper-grade entries.
Sri_Heikinashi T3 Candle line for long entry📌 Script Name:
Sri_Heikinashi T3 line for long entry (SRi-T3)
🔎 What this script does:
This indicator is a custom Heikin Ashi + T3 smoothed candle plotting tool.
Instead of showing raw candles or raw Heikin Ashi, it applies a double stage of T3 smoothing to Heikin Ashi values, giving a cleaner trend-following visual without market noise.
It doesn’t replace the original chart candles — it overlays smoothed, wick-less “trend candles” on top of your chart to highlight trend direction clearly.
🧩 Key Components:
1. Custom Timeframe Input
customTF = input.timeframe("120", "Custom Timeframe")
👉 You can choose any timeframe (5m, 15m, 1h, Daily, etc.), regardless of your chart timeframe.
This allows multi-timeframe analysis (e.g., plotting 2-hour smoothed candles on a 5-minute chart).
2. T3 Smoother Function
A custom function t3(src, length, v) is used.
T3 is a triple exponential moving average (EMA) smoother with a “volume factor” v.
Advantage: less lag than normal EMA/SMA, but smoother and cleaner trend lines.
3. Heikin Ashi Logic (inside calcHaT3)
Stage 1: Apply T3 smoothing to Heikin Ashi open, high, low, close.
Stage 2: Recalculate Heikin Ashi formula (open/close averaging, high/low logic).
Stage 3: Apply another round of T3 smoothing.
Final Output: Super-smooth OHLC values.
4. Plotting
Candles are plotted with:
No wicks (only body high/low).
Colors:
Green (lime) if close > open.
Red/Orange if close < open.
Slight transparency (95) so they don’t overpower chart candles.
👉 This way you get a visual overlay of the smoothed Heikin Ashi trend.
5. Alerts
Alerts are triggered when trend color changes:
From red → green (potential long entry).
From green → red (potential exit/short).
✅ Pros (Advantages)
Noise Reduction
Double T3 + Heikin Ashi makes signals smoother than raw price or single MA.
Clear Trend Identification
Candles change color only when trend is strong enough, filtering false moves.
Multi-Timeframe Support
You can plot higher timeframe trends (e.g., daily smoothed trend) on lower charts.
No Wick Confusion
Removes wicks to simplify visuals, focusing purely on direction.
Alerts for Trend Shifts
Automatic alert conditions for quick reaction.
Perfect for Long Entries
Since it’s designed for “long entry” confirmation, it’s especially helpful to avoid early entries.
⚡ How to Use This Script
Add to Chart
Copy → Paste into TradingView Pine Editor → Save & Add to Chart.
Select Custom Timeframe
Default is 120m (2 hours) but you can change to 15m, 60m, Daily, etc.
Example: On a 5m chart, load a 1h or 4h SRi-T3 to align with bigger trend.
Look for Color Changes
Green = bullish trend (favorable for long entries).
Orange/Red = bearish trend (avoid longs or look for short setup).
Use Alerts
Set alerts for "Heikin-Ashi Smoothed from red to green" = Long Signal.
"Heikin-Ashi Smoothed from green to red" = Exit/Short Signal.
Combine with Other Tools
Works best if combined with pivots, support/resistance, or momentum oscillators (RSI, CCI, etc.).
Use SRi-T3 as trend filter, enter trades only in its direction.
📊 Example Trading Setup
On a 15m chart:
Plot SRi-T3 with 60m timeframe → this gives you higher timeframe trend.
Enter long trades only if SRi-T3 is green.
Add RSI/MACD for entry confirmation.

ARGT Possible entry and exit points:This is just an observation, and not any type of financial advice.
]To identify key entry and exit points. In addition, this is based on YTD and yearly charts. This is a work in progress.

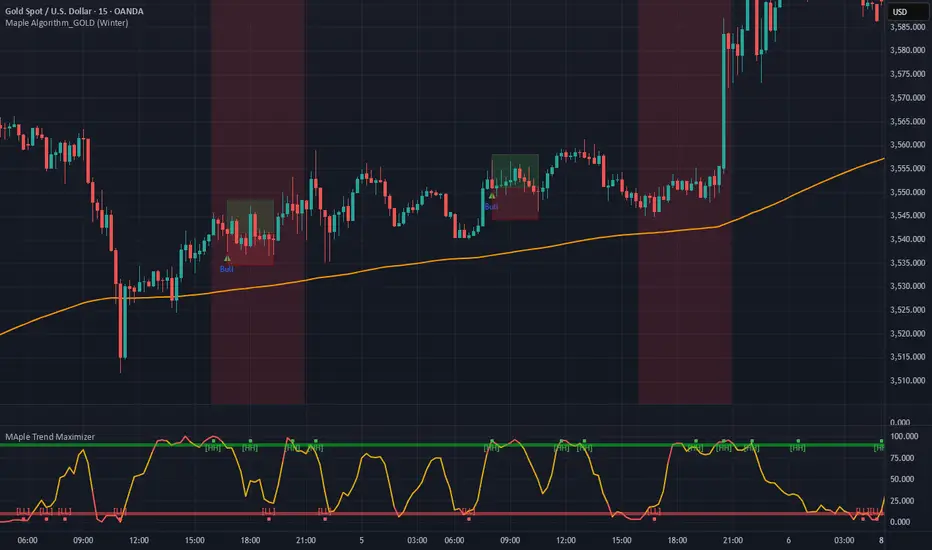
Maple Trend Maximizer – AI-Powered Trend & Entry IndicatorOverview:
Maple Trend Maximizer is an AI-inspired market analysis tool that identifies trend direction, highlights high-probability entry zones, and visually guides you through market momentum. Designed for traders seeking smart, data-driven signals, it combines trend alignment with proprietary AI-style calculations for precise timing.
Key Features:
AI Trend Detection:
Automatically identifies bullish and bearish trends using advanced smoothing and trend alignment techniques.
Momentum & Signal Lines:
Dynamic lines indicate market strength and potential turning points.
Colors change to highlight high-probability entry zones.
Entry Signals:
Optional visual markers suggest precise entries when trend direction and momentum align.
Configurable to reduce noise and focus on strong setups.
Multi-Timeframe Flexibility:
Works on intraday charts or higher timeframes for swing and position trading.
Customizable Settings:
Adjustable smoothing, trend sensitivity, and signal display options.
Lets you fine-tune the indicator to your trading style.
Benefits:
Quickly identifies market direction and optimal entries.
Provides clear, visually intuitive signals.
Can be used standalone or integrated into a larger strategy system.
EMA + MACD Entry Signals (Jason Wang)EMA9、20、200 + MACD(12、26、9) Entry Signals ,严格的设置出入场条件
1.做多的k棒:
• EMA9 > EMA200
• EMA20 > EMA200
• EMA9 > EMA20
• MACD DIF > 0 且 DIF > DEM
• 入场信号:
• DIF 上穿 DEM
• 或 EMA9 上穿 EMA20
2.做空的k棒:
• EMA9 < EMA200
• EMA20 < EMA200
• EMA9 < EMA20
• MACD DIF < 0 且 DIF < DEM
• 入场信号:
• DIF 下穿 DEM
• 或 EMA9 下穿 EMA20

Daniel.Yer BB EntryMy BB entry strategy.
need to improve a little the code, but for start, its look very good.
also need to check the statistic in 3 and 5 min range.
Great Job :)
