SMC Entry Signals MTF v2📘 User Guide for the SMC Entry Signals MTF v2 Indicator
🎯 Purpose of the Indicator
This indicator is designed to identify reversal entry points based on Smart Money Concepts (SMC) and candlestick confirmation. It’s especially useful for traders who use:
Imbalance zones, order blocks, breaker blocks
Liquidity grabs
Multi-timeframe confirmation (MTF)
📈 How to Use the Signals on the Chart
✅ LONG Signal (green triangle below the candle):
Conditions:
Price is in a discount zone (below the FIB 50% level)
A bullish engulfing candle appears
A bullish Order Block (OB) or Breaker Block is detected
There’s an upward imbalance
A bullish OB is confirmed on the higher timeframe
➡️ How to act:
Consider entering long on the current or next candle.
Place your stop-loss below the OB or the nearest swing low.
Take profit at the nearest liquidity zone or premium area (above FIB 50%).
🔻 SHORT Signal (red triangle above the candle):
Conditions:
Price is in a premium zone (above FIB 50%)
A bearish engulfing candle appears
A bearish OB or Breaker Block is detected
There’s a downward imbalance
A bearish OB is confirmed on the higher timeframe
➡️ How to act:
Consider short entry after the signal.
Place your stop-loss above the OB or swing high.
Target the discount zone or the next liquidity pocket.
⚙️ Recommended Settings by Trading Style
Trading Style Suggested Settings Notes
Intraday (1–15m) fibLookback = 20–50, obLookback = 5–10, htf_tf = 1H/4H Fast signals. Use Discount/Premium + Engulfing.
Swing/Position (1H–1D) fibLookback = 50–100, obLookback = 10–20, htf_tf = 1D/1W Higher trust in MTF confirmation. Ideal with fundamentals.
Scalping (1m) fibLookback = 10–20, obLookback = 3–5, htf_tf = 15m/1H Remove Breaker and MTF for quick reaction trades.
🧠 Best Practices for Traders
Trend Filtering:
Use EMAs or volume to confirm the current trend.
Take longs only in uptrends, shorts in downtrends.
Liquidity Zones:
Use this indicator after liquidity grabs.
OBs and Breakers often appear right after stop hunts.
Combine with Manual Zones:
This works best when paired with manually drawn OBs and key levels.
Backtest the Signals:
Use Bar Replay mode on TradingView to test past signals.
🧪 Example Trade Setup
Example on BTCUSDT 15m:
Price drops into the discount zone.
A green triangle appears (bullish engulfing + OB + imbalance + HTF OB).
You enter long, stop below the OB, target the premium zone.
🎯 This type of setup often gives a risk/reward ratio of 1:2 or better — profitable even with a 40% win rate.
⏰ Alerts & Automation
Enable alerts:
"SMC Long Entry" — fires when a long signal appears.
"SMC Short Entry" — fires when a short signal appears.
You can integrate this with bots via webhook, like:
TradingConnector, 3Commas, Alertatron, etc.
✅ What This Indicator Gives You
High-probability entries using SMC logic
Customizable filters for entry logic
Multi-timeframe confirmation for stronger setups
Suitable for both intraday and swing trading
Search in scripts for "entry"

Average Entry Price Calculator# Average Entry Price Calculator
This powerful indicator helps you track your average entry price across multiple positions, displaying it clearly on your chart with customizable lines and labels.
## Features:
• Calculate average entry price for up to 5 different positions
• Display current price and profit/loss calculations
• Show percentage and absolute change from your average entry
• Customizable line styles, colors, and label positions
• Track your entry prices with clear visual references
## How It Works:
Enter your position details (entry price and amount in USDT), and the indicator will calculate your average entry price, displaying it as a horizontal line on your chart. The indicator also shows your individual entry prices as separate lines, making it easy to visualize your overall position.
## Perfect For:
• DCA (Dollar-Cost Averaging) strategies
• Position tracking across multiple entries
• Risk management and profit taking
• Visualizing entry zones on your chart
## Instructions:
1. Add the indicator to your chart
2. Enter your position details (price and amount)
3. Customize the visual appearance as needed
4. Use the displayed average entry line for decision making
All calculations are done locally in your browser - no sensitive data is transmitted or stored.
Enjoy more informed trading decisions with this essential position tracking tool!

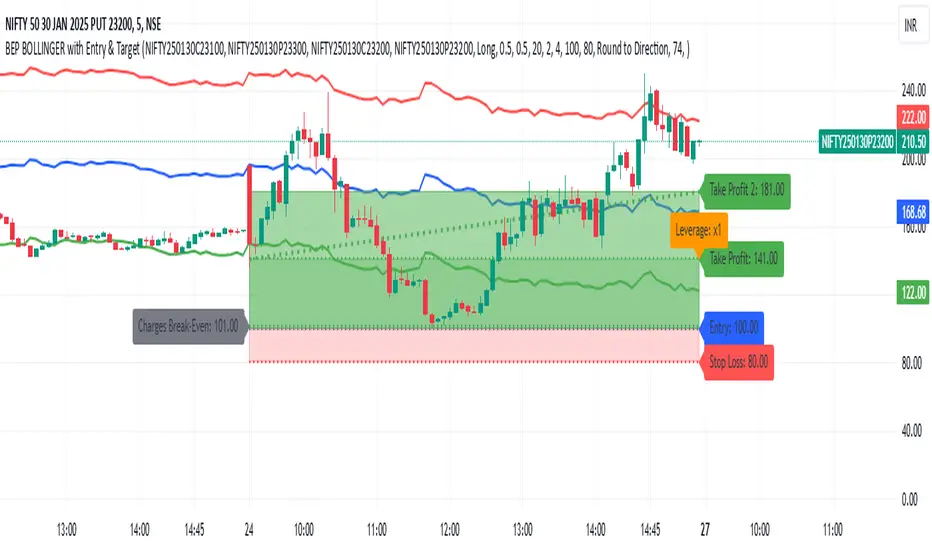
BEP BOLLINGER with Entry & TargetBEP BOLLINGER with Entry & Target Indicator
INPUT
ITM CE
ITM PE
ATM CE
ATM PE
This custom Pine Script indicator provides traders with a powerful tool to analyze options trading setups, specifically for Call and Put options (CE & PE). By integrating Bollinger Bands with a set of configurable parameters, it calculates key entry, stop loss, and take profit levels, while factoring in risk and reward for each trade. Ideal for options traders, this indicator supports precise risk management and enhances your ability to plan and execute trades based on calculated entry points and profit targets.
Key Features:
CE & PE Symbol Selection: Allows users to input two pairs of Call and Put option symbols for premium calculation.
Premium Calculation: Automatically calculates and plots the average premium for each pair of options.
Risk & Reward Zones: Visualizes risk zones and reward zones based on user-defined entry price, stop loss, and risk/reward ratio.
Leverage and Stop Loss Calculation: Computes the optimal leverage and adjusts stop loss based on acceptable loss percentage.
Break-Even Point: Identifies the break-even point considering trading fees and leverage.
Take Profit Levels: Calculates and visualizes multiple take profit levels with different risk/reward ratios.
Multi-Timeframe Analysis: Incorporates higher timeframe analysis to determine entry and stop loss levels for better decision-making.
Dynamic Alerts: Provides alerts when the price hits the stop loss, take profit levels, or reaches the break-even point.
Visual Tools: Draws lines and shaded areas for entry, stop loss, take profit, and risk/reward zones to aid in visual decision-making.
Customizable Settings:
Risk Management: Adjust stop loss, leverage, and risk/reward ratios to suit your trading strategy.
Trading Direction: Choose between Long or Short positions based on market outlook.
Fee Calculations: Input your buy and sell fees to accurately calculate break-even and profit zones.
Color Customization: Personalize the color of premium lines, offset levels, and risk/reward zones.
Alerts:
Alerts can be set for Stop Loss, Take Profit, and Break-Even, ensuring you're notified in real-time when important price levels are reached.
This tool is perfect for traders looking to integrate risk management and precise trade setup analysis into their options trading strategy.
Austin MTF EMA Entry PointsAustin MTF EMA Entry Points
Overview
The Austin MTF EMA Entry Points is a custom TradingView indicator designed to assist traders in identifying high-probability entry points by combining multiple time frame (MTF) analysis. It leverages exponential moving averages (EMAs) from the daily, 1-hour, and 15-minute charts to generate buy and sell signals that align with the overall trend.
This indicator is ideal for traders who:
Want to trade in the direction of the broader daily trend.
Seek precise entry points on lower time frames (1H and 15M).
Prefer using EMAs as their main trend-following tool.
How It Works
Daily Trend Filter:
The indicator calculates the 50 EMA on the daily chart.
The daily EMA acts as the primary trend filter:
If the current price is above the daily 50 EMA, the trend is bullish.
If the current price is below the daily 50 EMA, the trend is bearish.
Lower Time Frame Entry Points:
The indicator calculates the 20 EMA on both the 1-hour (1H) and 15-minute (15M) time frames.
Buy and sell signals are generated when the price aligns with the trend on all three time frames:
Buy Signal: Price is above the daily 50 EMA and also above the 20 EMA on both the 1H and 15M charts.
Sell Signal: Price is below the daily 50 EMA and also below the 20 EMA on both the 1H and 15M charts.
Visual and Alert Features:
Plot Lines:
The daily 50 EMA is plotted in yellow for easy identification of the main trend.
The 20 EMA from the 1H chart is plotted in blue, and the 15M chart's EMA is in purple for comparison.
Buy/Sell Markers:
Green "Up" arrows appear for buy signals.
Red "Down" arrows appear for sell signals.
Alerts:
Alerts notify users when a buy or sell signal is triggered, making it easier to act on trading opportunities in real-time.
How to Use the Indicator
Identify the Main Trend:
Check the relationship between the price and the daily 50 EMA (yellow line):
Only look for buy signals if the price is above the daily 50 EMA.
Only look for sell signals if the price is below the daily 50 EMA.
Wait for Lower Time Frame Alignment:
For a valid signal, ensure that the price is also above or below the 20 EMA (blue and purple lines) on both the 1H and 15M time frames:
This alignment confirms short-term momentum in the same direction as the daily trend.
Act on Signals:
Use the arrows as visual cues for entry points:
Enter long trades on green "Up" arrows.
Enter short trades on red "Down" arrows.
The alerts will notify you of these signals, so you don’t have to monitor the chart constantly.
Exit Strategy:
Use your preferred stop-loss, take-profit, or trailing stop strategy.
You can also exit trades if the price crosses back below/above the daily 50 EMA, signaling a potential reversal.
Use Cases
Swing Traders: Use the daily trend filter to trade in the direction of the dominant trend, while using 1H and 15M signals to fine-tune entries.
Day Traders: Leverage the 1H and 15M time frames to capitalize on short-term momentum while respecting the broader daily trend.
Position Traders: Monitor the indicator to determine potential reversals or significant alignment across time frames.
Customizable Inputs
The indicator includes the following inputs:
Daily EMA Length: Default is 50. Adjust this to change the length of the trend filter EMA.
Lower Time Frame EMA Length: Default is 20. Adjust this to change the short-term EMA for the 1H and 15M charts.
Time Frames: Hardcoded to "D", "60", and "15", but you can modify the script for different time frames if needed.
Example Scenarios
Buy Signal:
Price is above the daily 50 EMA.
Price crosses above the 20 EMA on both the 1H and 15M time frames.
A green "Up" arrow is displayed, and an alert is triggered.
Sell Signal:
Price is below the daily 50 EMA.
Price crosses below the 20 EMA on both the 1H and 15M time frames.
A red "Down" arrow is displayed, and an alert is triggered.
Strengths and Limitations
Strengths:
Aligns trades with the higher time frame trend for increased probability.
Uses multiple time frame analysis to identify precise entry points.
Visual signals and alerts make it easy to use in real-time.
Limitations:
May produce fewer signals in choppy or ranging markets.
Requires discipline to avoid overtrading when conditions are unclear.
Lag in EMAs could result in late entries in fast-moving markets.
Final Notes
The Austin MTF EMA Entry Points indicator is a powerful tool for traders who value multiple time frame alignment and trend-following strategies. While it simplifies decision-making, it is always recommended to backtest and practice proper risk management before using it in live markets.
Try it out and make smarter, trend-aligned trades today! 🚀

Custom RSI & MACD Momentum Entry SignalsIndicator Explanation: Custom RSI & MACD Momentum Entry Signals
Introduction
The "Custom RSI & MACD Momentum Entry Signals" indicator combines the Relative Strength Index (RSI) and the Moving Average Convergence Divergence (MACD) to generate precise long and short entry signals. This indicator offers a powerful combination of overbought/oversold zones, momentum analysis, and RSI-EMA crossovers to assist traders in making better decisions.
How the Indicator Works
1. RSI Calculation and EMA
The RSI is calculated based on the closing price with an adjustable period (default: 14).
An Exponential Moving Average (EMA) of the RSI (default: 9) is plotted to identify RSI trend changes.
When the RSI crosses its EMA upwards, it signals a bullish impulse. Conversely, a downward cross indicates a bearish impulse.
2. MACD Calculation and Momentum Shifts
The MACD line is derived from the difference between a fast EMA (default: 12) and a slow EMA (default: 26).
The Signal line is the EMA of the MACD line (default: 9).
The MACD histogram represents the difference between the MACD line and the Signal line.
Momentum shifts are detected as follows:
Weakening Bearish: Histogram is negative but increasing (less bearish pressure).
Strengthening Bullish: Histogram is positive and rising.
Weakening Bullish: Histogram is positive but decreasing.
Strengthening Bearish: Histogram is negative and falling.
Signal Generation
Long Signals
A Long signal is triggered when all of the following conditions are met:
The RSI was previously below 30 (oversold condition).
MACD momentum shifts from "strengthening bearish" to "weakening bearish" or turns bullish.
The RSI crosses its EMA upwards.
A green upward arrow is displayed below the bar, and the background is lightly shaded green for additional visualization.
Short Signals
A Short signal is triggered when all of the following conditions are met:
The RSI was previously above 70 (overbought condition).
MACD momentum shifts from "strengthening bullish" to "weakening bullish" or turns bearish.
The RSI crosses its EMA downwards.
A red downward arrow is displayed above the bar, and the background is lightly shaded red for additional visualization.
Visual Elements
RSI and EMA:
The RSI is shown in purple.
The RSI EMA is shown in blue.
Horizontal lines at 30 (oversold) and 70 (overbought) provide additional context.
MACD:
The MACD line is displayed in blue.
The Signal line is displayed in orange.
The zero line is added for easier interpretation.
Signals:
Green arrows: Long signals.
Red arrows: Short signals.
Background color: Light green for long conditions, light red for short conditions.
Use Cases
This indicator is ideal for:
Trend Followers: Combining RSI and MACD allows traders to identify entry points during impulsive trend shifts.
Swing Traders: Long and short signals can be used at reversal points to capture short-term price movements.
Momentum Traders: By considering MACD momentum, the indicator provides additional confidence in signal generation.
Customizable Settings
The indicator provides flexible input options:
RSI Period (default: 14)
RSI EMA Period (default: 9)
MACD Parameters: Fast, slow, and signal EMAs can be adjusted.
Conclusion
The Custom RSI & MACD Momentum Entry Signals indicator is a powerful tool for traders looking to combine RSI and MACD to identify high-probability entry signals. With clear visualization and precise signal generation, traders can make decisions more efficiently and capitalize on market movements.

Adjustable Entry Price Levels by Sobhi v6Adjustable Entry Price Levels", is designed to display customizable price levels on a chart, allowing traders to visualize key price zones relative to a chosen entry price. Here's a detailed breakdown of its functionality:
Purpose
The indicator helps traders create and manage equidistant price levels (both above and below a selected entry price). These levels can assist in planning trades, setting stop-loss and take-profit levels, or identifying key market zones for decision-making.
Features
Entry Price Input:
Users can specify a starting price (Entry Price) to base the levels on.
Adjustable Distance Between Levels:
Levels are spaced at a user-defined interval (Distance), creating equidistant horizontal lines.
Number of Levels:
Users can select how many levels to display above and below the entry price (Number of Levels).
Line Customization:
Style: Choose between Solid, Dotted, or Dashed lines.
Color: Customize the color for upward and downward levels (Line Color Up and Line Color Down).
Thickness: Adjust line thickness (Line Width).
Label Customization:
Visibility: Option to show or hide labels on each level (Show Labels).
Font Size: Set the size of the text for level labels (Label Font Size).
Colors: Separate customization for labels above (Label Color Up) and below (Label Color Down) the entry price.
Extended Line Display:
The lines extend backward (Extend Bars Back) and forward (Extend Bars Forward) to ensure visibility over a larger section of the chart.
Visualization
Upward Levels:
Represented by blue (default) horizontal lines above the entry price.
Labels display the price value of each level in the same color.
Downward Levels:
Represented by red (default) horizontal lines below the entry price.
Labels display the price value of each level in the same color.
Example Use Case
Scenario 1: Support and Resistance Planning
A trader can define a key level (Entry Price) and observe nearby support and resistance zones using the calculated price levels.
Scenario 2: Risk Management
The indicator helps in visualizing stop-loss and take-profit areas equidistant from the entry price.
Scenario 3: Breakout Targets
Traders can use the levels to anticipate potential breakout or breakdown targets.
Customization Options
This indicator is highly customizable, making it versatile for different trading strategies. Traders can tweak:
The visual appearance of the levels (style, color, width).
The number of levels and their spacing.
Whether labels are displayed and their style.

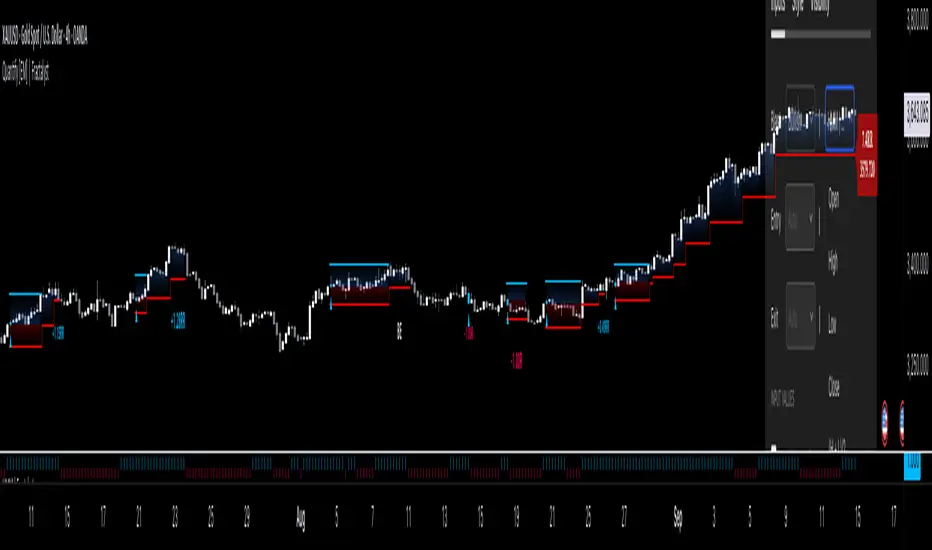
Quantify [Entry Model] | FractalystWhat’s the indicator’s purpose and functionality?
Quantify is a machine learning entry model designed to help traders identify high-probability setups to refine their strategies.
➙ Simply pick your bias, select your entry timeframes, and let Quantify handle the rest for you.
Can the indicator be applied to any market approach/trading strategy?
Absolutely, all trading strategies share one fundamental element: Directional Bias
Once you’ve determined the market bias using your own personal approach, whether it’s through technical analysis or fundamental analysis, select the trend direction in the Quantify user inputs.
The algorithm will then adjust its calculations to provide optimal entry levels aligned with your chosen bias. This involves analyzing historical patterns to identify setups with the highest potential expected values, ensuring your setups are aligned with the selected direction.
Can the indicator be used for different timeframes or trading styles?
Yes, regardless of the timeframe you’d like to take your entries, the indicator adapts to your trading style.
Whether you’re a swing trader, scalper, or even a position trader, the algorithm dynamically evaluates market conditions across your chosen timeframe.
How can this indicator help me to refine my trading strategy?
1. Focus on Positive Expected Value
• The indicator evaluates every setup to ensure it has a positive expected value, helping you focus only on trades that statistically favor long-term profitability.
2. Adapt to Market Conditions
• By analyzing real-time market behavior and historical patterns, the algorithm adjusts its calculations to match current conditions, keeping your strategy relevant and adaptable.
3. Eliminate Emotional Bias
• With clear probabilities, expected values, and data-driven insights, the indicator removes guesswork and helps you avoid emotional decisions that can damage your edge.
4. Optimize Entry Levels
• The indicator identifies optimal entry levels based on your selected bias and timeframes, improving robustness in your trades.
5. Enhance Risk Management
• Using tools like the Kelly Criterion, the indicator suggests optimal position sizes and risk levels, ensuring that your strategy maintains consistency and discipline.
6. Avoid Overtrading
• By highlighting only high-potential setups, the indicator keeps you focused on quality over quantity, helping you refine your strategy and avoid unnecessary losses.
How can I get started to use the indicator for my entries?
1. Set Your Market Bias
• Determine whether the market trend is Bullish or Bearish using your own approach.
• Select the corresponding bias in the indicator’s user inputs to align it with your analysis.
2. Choose Your Entry Timeframes
• Specify the timeframes you want to focus on for trade entries.
• The indicator will dynamically analyze these timeframes to provide optimal setups.
3. Let the Algorithm Analyze
• Quantify evaluates historical data and real-time price action to calculate probabilities and expected values.
• It highlights setups with the highest potential based on your selected bias and timeframes.
4. Refine Your Entries
• Use the insights provided—entry levels, probabilities, and risk calculations—to align your trades with a math-driven edge.
• Avoid overtrading by focusing only on setups with positive expected value.
5. Adapt to Market Conditions
• The indicator continuously adapts to real-time market behavior, ensuring its recommendations stay relevant and precise as conditions change.
How does the indicator calculate the current range?
The indicator calculates the current range by analyzing swing points from the very first bar on your charts to the latest available bar it identifies external liquidity levels, also known as BSLQ (buy-side liquidity levels) and SSLQ (sell-side liquidity levels).
What's the purpose of these levels? What are the underlying calculations?
1. Understanding Swing highs and Swing Lows
Swing High: A Swing High is formed when there is a high with 2 lower highs to the left and right.
Swing Low: A Swing Low is formed when there is a low with 2 higher lows to the left and right.
2. Understanding the purpose and the underlying calculations behind Buyside, Sellside and Pivot levels.
3. Identifying Discount and Premium Zones.
4. Importance of Risk-Reward in Premium and Discount Ranges
How does the script calculate probabilities?
The script calculates the probability of each liquidity level individually. Here's the breakdown:
1. Upon the formation of a new range, the script waits for the price to reach and tap into pivot level level. Status: "■" - Inactive
2. Once pivot level is tapped into, the pivot status becomes activated and it waits for either liquidity side to be hit. Status: "▶" - Active
3. If the buyside liquidity is hit, the script adds to the count of successful buyside liquidity occurrences. Similarly, if the sellside is tapped, it records successful sellside liquidity occurrences.
4. Finally, the number of successful occurrences for each side is divided by the overall count individually to calculate the range probabilities.
Note: The calculations are performed independently for each directional range. A range is considered bearish if the previous breakout was through a sellside liquidity. Conversely, a range is considered bullish if the most recent breakout was through a buyside liquidity.
What does the multi-timeframe functionality offer?
You can incorporate up to 4 higher timeframe probabilities directly into the table.
This feature allows you to analyze the probabilities of buyside and sellside liquidity across multiple timeframes, without the need to manually switch between them.
By viewing these higher timeframe probabilities in one place, traders can spot larger market trends and refine their entries and exits with a better understanding of the overall market context.
What are the multi-timeframe underlying calculations?
The script uses the same calculations (mentioned above) and uses security function to request the data such as price levels, bar time, probabilities and booleans from the user-input timeframe.
How does the Indicator Identifies Positive Expected Values?
Quantify instantly calculates whether a trade setup has the potential to generate positive expected value (EV).
To determine a positive EV setup, the indicator uses the formula:
EV = ( P(Win) × R(Win) ) − ( P(Loss) × R(Loss))
where:
- P(Win) is the probability of a winning trade.
- R(Win) is the reward or return for a winning trade, determined by the current risk-to-reward ratio (RR).
- P(Loss) is the probability of a losing trade.
- R(Loss) is the loss incurred per losing trade, typically assumed to be -1.
By calculating these values based on historical data and the current trading setup, the indicator helps you understand whether your trade has a positive expected value.
How can I know that the setup I'm going to trade with has a positive EV?
If the indicator detects that the adjusted pivot and buy/sell side probabilities have generated positive expected value (EV) in historical data, the risk-to-reward (RR) label within the range box will be colored blue and red .
If the setup does not produce positive EV, the RR label will appear gray.
This indicates that even the risk-to-reward ratio is greater than 1:1, the setup is not likely to yield a positive EV because, according to historical data, the number of losses outweighs the number of wins relative to the RR gain per winning trade.
What is the confidence level in the indicator, and how is it determined?
The confidence level in the indicator reflects the reliability of the probabilities calculated based on historical data. It is determined by the sample size of the probabilities used in the calculations. A larger sample size generally increases the confidence level, indicating that the probabilities are more reliable and consistent with past performance.
How does the confidence level affect the risk-to-reward (RR) label?
The confidence level (★) is visually represented alongside the probability label. A higher confidence level indicates that the probabilities used to determine the RR label are based on a larger and more reliable sample size.
How can traders use the confidence level to make better trading decisions?
Traders can use the confidence level to gauge the reliability of the probabilities and expected value (EV) calculations provided by the indicator. A confidence level above 95% is considered statistically significant and indicates that the historical data supporting the probabilities is robust. This high confidence level suggests that the probabilities are reliable and that the indicator’s recommendations are more likely to be accurate.
In data science and statistics, a confidence level above 95% generally means that there is less than a 5% chance that the observed results are due to random variation. This threshold is widely accepted in research and industry as a marker of statistical significance. Studies such as those published in the Journal of Statistical Software and the American Statistical Association support this threshold, emphasizing that a confidence level above 95% provides a strong assurance of data reliability and validity.
Conversely, a confidence level below 95% indicates that the sample size may be insufficient and that the data might be less reliable. In such cases, traders should approach the indicator’s recommendations with caution and consider additional factors or further analysis before making trading decisions.
How does the sample size affect the confidence level, and how does it relate to my TradingView plan?
The sample size for calculating the confidence level is directly influenced by the amount of historical data available on your charts. A larger sample size typically leads to more reliable probabilities and higher confidence levels.
Here’s how the TradingView plans affect your data access:
Essential Plan
The Essential Plan provides basic data access with a limited amount of historical data. This can lead to smaller sample sizes and lower confidence levels, which may weaken the robustness of your probability calculations. Suitable for casual traders who do not require extensive historical analysis.
Plus Plan
The Plus Plan offers more historical data than the Essential Plan, allowing for larger sample sizes and more accurate confidence levels. This enhancement improves the reliability of indicator calculations. This plan is ideal for more active traders looking to refine their strategies with better data.
Premium Plan
The Premium Plan grants access to extensive historical data, enabling the largest sample sizes and the highest confidence levels. This plan provides the most reliable data for accurate calculations, with up to 20,000 historical bars available for analysis. It is designed for serious traders who need comprehensive data for in-depth market analysis.
PRO+ Plans
The PRO+ Plans offer the most extensive historical data, allowing for the largest sample sizes and the highest confidence levels. These plans are tailored for professional traders who require advanced features and significant historical data to support their trading strategies effectively.
For many traders, the Premium Plan offers a good balance of affordability and sufficient sample size for accurate confidence levels.
What is the HTF probability table and how does it work?
The HTF (Higher Time Frame) probability table is a feature that allows you to view buy and sellside probabilities and their status from timeframes higher than your current chart timeframe.
Here’s how it works:
Data Request: The table requests and retrieves data from user-defined higher timeframes (HTFs) that you select.
Probability Display: It displays the buy and sellside probabilities for each of these HTFs, providing insights into the likelihood of price movements based on higher timeframe data.
Detailed Tooltips: The table includes detailed tooltips for each timeframe, offering additional context and explanations to help you understand the data better.
What do the different colors in the HTF probability table indicate?
The colors in the HTF probability table provide visual cues about the expected value (EV) of trading setups based on higher timeframe probabilities:
Blue: Suggests that entering a long position from the HTF user-defined pivot point, targeting buyside liquidity, is likely to result in a positive expected value (EV) based on historical data and sample size.
Red: Indicates that entering a short position from the HTF user-defined pivot point, targeting sellside liquidity, is likely to result in a positive expected value (EV) based on historical data and sample size.
Gray: Shows that neither long nor short trades from the HTF user-defined pivot point are expected to generate positive EV, suggesting that trading these setups may not be favorable.
What machine learning techniques are used in Quantify?
Quantify offers two main machine learning approaches:
1. Adaptive Learning (Fixed Sample Size): The algorithm learns from the entire dataset without resampling, maintaining a stable model that adapts to the latest market conditions.
2. Bootstrap Resampling: This method creates multiple subsets of the historical data, allowing the model to train on varying sample sizes. This technique enhances the robustness of predictions by ensuring that the model is not overfitting to a single dataset.
How does machine learning affect the expected value calculations in Quantify?
Machine learning plays a key role in improving the accuracy of expected value (EV) calculations. By analyzing historical price action, liquidity hits, and market bias patterns, the model continuously adjusts its understanding of risk and reward, allowing the expected value to reflect the most likely market movements. This results in more precise EV predictions, helping traders focus on setups that maximize profitability.
What is the Kelly Criterion, and how does it work in Quantify?
The Kelly Criterion is a mathematical formula used to determine the optimal position size for each trade, maximizing long-term growth while minimizing the risk of large drawdowns. It calculates the percentage of your portfolio to risk on a trade based on the probability of winning and the expected payoff.
Quantify integrates this with user-defined inputs to dynamically calculate the most effective position size in percentage, aligning with the trader’s risk tolerance and desired exposure.
How does Quantify use the Kelly Criterion in practice?
Quantify uses the Kelly Criterion to optimize position sizing based on the following factors:
1. Confidence Level: The model assesses the confidence level in the trade setup based on historical data and sample size. A higher confidence level increases the suggested position size because the trade has a higher probability of success.
2. Max Allowed Drawdown (User-Defined): Traders can set their preferred maximum allowed drawdown, which dictates how much loss is acceptable before reducing position size or stopping trading. Quantify uses this input to ensure that risk exposure aligns with the trader’s risk tolerance.
3. Probabilities: Quantify calculates the probabilities of success for each trade setup. The higher the probability of a successful trade (based on historical price action and liquidity levels), the larger the position size suggested by the Kelly Criterion.
What is a trailing stoploss, and how does it work in Quantify?
A trailing stoploss is a dynamic risk management tool that moves with the price as the market trend continues in the trader’s favor. Unlike a fixed take profit, which stays at a set level, the trailing stoploss automatically adjusts itself as the market moves, locking in profits as the price advances.
In Quantify, the trailing stoploss is enhanced by incorporating market structure liquidity levels (explain above). This ensures that the stoploss adjusts intelligently based on key price levels, allowing the trader to stay in the trade as long as the trend remains intact, while also protecting profits if the market reverses.
Why would a trader prefer a trailing stoploss based on liquidity levels instead of a fixed take-profit level?
Traders who use trailing stoplosses based on liquidity levels prefer this method because:
1. Market-Driven Flexibility: The stoploss follows the market structure rather than being static at a pre-defined level. This means the stoploss is less likely to be hit by small market fluctuations or false reversals. The stoploss remains adaptive, moving as the market moves.
2. Riding the Trend: Traders can capture more profit during a sustained trend because the trailing stop will adjust only when the trend starts to reverse significantly, based on key liquidity levels. This allows them to hold positions longer without prematurely locking in profits.
3. Avoiding Premature Exits: Fixed stoploss levels may exit a trade too early in volatile markets, while liquidity-based trailing stoploss levels respect the natural flow of price action, preventing the trader from exiting too soon during pullbacks or minor retracements.
🎲 Becoming the House: Gaining an Edge Over the Market
In American roulette, the casino has a 5.26% edge due to the presence of the 0 and 00 pockets. On even-money bets, players face a 47.37% chance of winning, while true 50/50 odds would require a 50% chance. This edge—the gap between the payout odds and the true probabilities—ensures that, statistically, the casino will always win over time, even if individual players win occasionally.
From a Trader’s Perspective
In trading, your edge comes from identifying and executing setups with a positive expected value (EV). For example:
• If you identify a setup with a 55.48% chance of winning and a 1:1 risk-to-reward (RR) ratio, your trade has a statistical advantage over a neutral (50/50) probability.
This edge works in your favor when applied consistently across a series of trades, just as the casino’s edge ensures profitability across thousands of spins.
🎰 Applying the Concept to Trading
Like casinos leverage their mathematical edge in games of chance, you can achieve long-term success in trading by focusing on setups with positive EV and managing your trades systematically. Here’s how:
1. Probability Advantage: Prioritize trades where the probability of success (win rate) exceeds the breakeven rate for your chosen risk-to-reward ratio.
• Example: With a 1:1 RR, you need a win rate above 50% to achieve positive EV.
2. Risk-to-Reward Ratio (RR): Even with a win rate below 50%, you can gain an edge by increasing your RR (e.g., a 40% win rate with a 2:1 RR still has positive EV).
3. Consistency and Discipline: Just as casinos profit by sticking to their mathematical advantage over thousands of spins, traders must rely on their edge across many trades, avoiding emotional decisions or overleveraging.
By targeting favorable probabilities and managing trades effectively, you “become the house” in your trading. This approach allows you to leverage statistical advantages to enhance your overall performance and achieve sustainable profitability.
What Makes the Quantify Indicator Original?
1. Data-Driven Edge
Unlike traditional indicators that rely on static formulas, Quantify leverages probability-based analysis and machine learning. It calculates expected value (EV) and confidence levels to help traders identify setups with a true statistical edge.
2. Integration of Market Structure
Quantify uses market structure liquidity levels to dynamically adapt. It identifies key zones like swing highs/lows and liquidity traps, enabling users to align entries and exits with where the market is most likely to react. This bridges the gap between price action analysis and quantitative trading.
3. Sophisticated Risk Management
The Kelly Criterion implementation is unique. Quantify allows traders to input their maximum allowed drawdown, dynamically adjusting risk exposure to maintain optimal position sizing. This ensures risk is scientifically controlled while maximizing potential growth.
4. Multi-Timeframe and Liquidity-Based Trailing Stops
The indicator doesn’t just suggest fixed profit-taking levels. It offers market structure-based trailing stop-loss functionality, letting traders ride trends as long as liquidity and probabilities favor the position, which is rare in most tools.
5. Customizable Bias and Adaptive Learning
• Directional Bias: Traders can set a bullish or bearish bias, and the indicator recalculates probabilities to align with the trader’s market outlook.
• Adaptive Learning: The machine learning model adapts to changes in data (via resampling or bootstrap methods), ensuring that predictions stay relevant in evolving markets.
6. Positive EV Focus
The focus on positive EV setups differentiates it from reactive indicators. It shifts trading from chasing signals to acting on setups that statistically favor profitability, akin to how professional quant funds operate.
7. User Empowerment
Through features like customizable timeframes, real-time probability updates, and visualization tools, Quantify empowers users to make data-informed decisions.
Terms and Conditions | Disclaimer
Our charting tools are provided for informational and educational purposes only and should not be construed as financial, investment, or trading advice. They are not intended to forecast market movements or offer specific recommendations. Users should understand that past performance does not guarantee future results and should not base financial decisions solely on historical data.
Built-in components, features, and functionalities of our charting tools are the intellectual property of @Fractalyst use, reproduction, or distribution of these proprietary elements is prohibited.
By continuing to use our charting tools, the user acknowledges and accepts the Terms and Conditions outlined in this legal disclaimer and agrees to respect our intellectual property rights and comply with all applicable laws and regulations.
Granville Entry GuideThis indicator is designed to identify trade entry points using patterns 2 and 3 of the Granville's Law. It is compatible with version 6.
Determining Entry Points
・ Long Entry : When the medium-term moving average is rising, if the stock price falls close to or below the moving average and then begins to rise, with that bar being a bullish candle, it is determined as an entry point. At this time, a red circle will be displayed above the bar.
・ Short Entry : When the medium-term moving average is falling, if the stock price rises close to or above the moving average and then begins to fall, with that bar being a bearish candle, it is determined as an entry point. At this time, a blue circle will be displayed below the bar.
Trend Filter
Entry points will only be displayed if the following trend conditions are met:
・In an uptrend, the order of moving averages should be: short-term moving average, medium-term moving average, and long-term moving average from top to bottom. In a downtrend, the order should be: long-term moving average, medium-term moving average, and short-term moving average from top to bottom. The order of the short-term moving average is flexible.
・The medium-term and long-term moving averages should be inclined in the direction of the trend. The inclination of the short-term moving average is flexible.
Adjusting Parameters
・ Stock Selection : You can choose whether to use the stock price from candlesticks or the short-term moving average for determining entry points. Selecting candlesticks allows for quicker determination but increases noise, while selecting the short-term moving average slows down determination but reduces noise. The default value is the short-term moving average.
・ Determining Pullbacks or Retracements : This is determined by the number of bars on either side of the lowest point of the pullback. Increasing the number of bars reduces noise but may result in missed opportunities. The default values are 3 bars on the left and 1 bar on the right.
・ Use of Trend Filter : You can choose whether to use the trend filter. The default setting is to use it.
・ Conditions for Moving Average Inclination : You can choose whether to include the trend direction inclination in the trend filter conditions. The default setting is to include it.
・ Bar Background Color : The trend filter is displayed with the bar's background color, but it can also be set to not display.
このインジケーターは、グランビルの法則のパターン2とパターン3を利用して、トレードのエントリーポイントを見つけるためのものです。version6に対応しています。
エントリーポイントの判定方法
ロングエントリー :中期移動平均線が上昇しているとき、株価が移動平均線の近くまで落ちるか、割り込んだ後に上昇を始め、そのバーが陽線である場合にエントリーポイントと判定します。このとき、赤い丸がバーの上に表示されます。
ショートエントリー :中期移動平均線が下落しているとき、株価が移動平均線の近くまで上昇するか、上抜けた後に下落を始め、そのバーが陰線である場合にエントリーポイントと判定します。このとき、青い丸がバーの下に表示されます。
トレンドフィルター
エントリーポイントは、次のトレンド条件を満たす場合のみ表示されます。
・上昇トレンドの場合、移動平均線が上から中期移動平均線、長期移動平均線の順になっている。下降トレンドの場合、移動平均線が上から長期移動平均線、中期移動平均線の順になっている。なお短期移動平均線の順番は任意です。
・中期移動平均線と長期移動平均線がトレンド方向に傾いている。なお短期移動平均線の傾きは任意です。
パラメーターの調整方法
・ 株価の選択 : エントリーポイントの判定に使用する株価を、ローソク足か短期移動平均線から選べます。ローソク足を選ぶと判定が早くなりますがノイズが増え、短期移動平均線を選ぶと判定が遅くなりますがノイズが減ります。初期値は短期移動平均線です。
・ 押しや戻りの判定 : 押しの最下点の左右のバーの数で判定します。バーの数を増やすとノイズが減りますが、機会を逃すこともあります。初期値は左が3、右が1です。
・ トレンドフィルターの使用 : トレンドフィルターを使うかどうかを選べます。初期値は使用する設定です。
・ 移動平均線の傾きの条件 : トレンドフィルターのうち、トレンド方向の傾きを条件に入れるかどうかを選べます。初期値は条件に入れる設定です。
バーの背景色: トレンドフィルターはバーの背景色で表示されますが、非表示に設定することもできます。

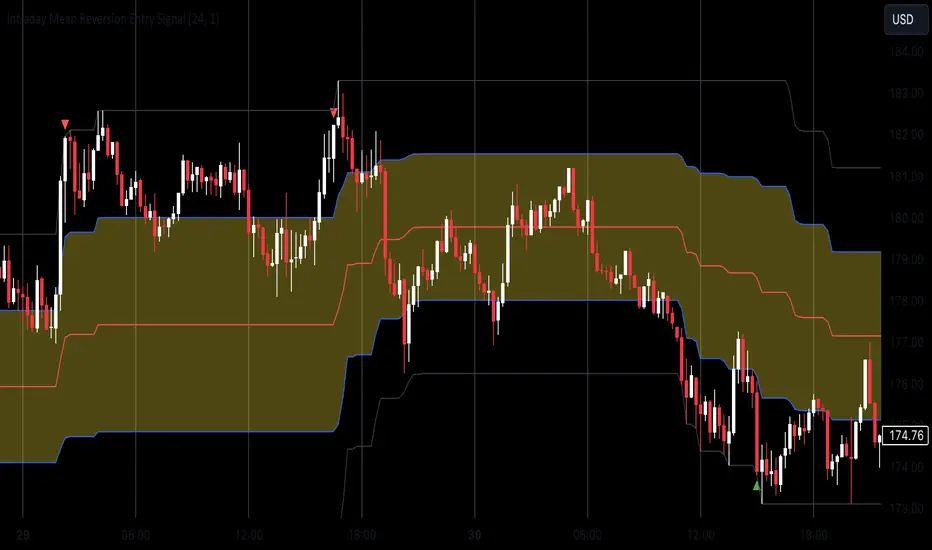
Mean Reversion Entry Signal
Mean Reversion Entry Signal Indicator
The Mean Reversion Entry Signal indicator is a trading tool designed for traders looking to capitalize on market corrections. This script leverages mean reversion principles, utilizing price levels and the Relative Strength Index (RSI) to generate potential entry signals for both long and short positions.
Key Features:
1. **Dynamic Price Levels**:
- The indicator calculates critical price levels over a user-defined lookback period, including:
- High (H)**: The highest price point over the lookback period.
- Low (L)**: The lowest price point over the lookback period.
- Midpoint (M)**: The average of the high and low.
- Midpoint High (Mh)** and **Midpoint Low (Ml)**: Additional reference levels derived from M for more nuanced trading signals.
2. User-Configurable Inputs:
- Lookback Period: Traders can specify the number of hours to look back for the calculations, allowing for tailored analysis that fits various trading strategies. By default the lookback is set for 24 hours, as i consider it the most adequate for day trading.
- Aggression Level: This input lets users choose their trading strategy's intensity, affecting the sensitivity of entry signals based on the percentage difference from the midpoint.
3. Entry Signal Generation:
The script evaluates market conditions to signal potential trades:
- Long Entries: Indicated when the price is below the Ml level and the price demonstrates a significant distance from the midpoint (M), coupled with RSI being near the oversold territory.
- Short Entries: Triggered when the price exceeds the Mh level, also indicating a significant distance from M, while the RSI indicates near overbought conditions.
4. Visual Indicators:
Clear visual signals are plotted directly on the chart:
- Long Signals are represented as upward triangles in green.
- Short Signals appear as downward triangles in red.
- Important price levels (M, H, L, Mh, and Ml) are displayed to provide traders with immediate context for potential trades.
5. No Entry Zone:
The area between Mh and Ml is shaded to indicate a "No Entry Zone," helping traders identify regions where conditions may not be favorable for taking new positions.
This can also be used as potencial profit taking area.
Conclusion
1. This indicator was built mainly for day trading, using timeframes between 1 minute and 1 hour. If you want to use it in 1D time frame, for instance, you should adjust the lookback period to 120 hours or so.
2. To use this as a strategy, you should not be afraid to "add to your losers" as the trade goes against you and the signals continue to appear.
Enjoy
Relative Measured Volatility (RMV) – Spot Tight Entry ZonesTitle: Relative Measured Volatility (RMV) – Spot Tight Entry Zones
Introduction
The Relative Measured Volatility (RMV) indicator is designed to highlight tight price consolidation zones , making it an ideal tool for traders seeking optimal entry points before potential breakouts. By focusing on tightness rather than general volatility, RMV offers traders a practical way to detect consolidation phases that often precede significant market moves.
How RMV Works
The RMV calculates short-term tightness by averaging three ATR (Average True Range) values over different lookback periods and then normalizing them within a specified lookback window. The result is a percentage-based scale from 0 to 100, indicating how tight the current price range is compared to recent history.
Here’s the breakdown:
Three ATR values are computed using user-defined short lookback periods to represent short-term price movements. An average of the ATRs provides a smoothed measure of current tightness. The RMV normalizes this average against the highest and lowest values over the defined lookback period, scaling it from 0 to 100.
This approach helps traders identify consolidation zones that are more likely to lead to breakouts.
Key Features of RMV
Multi-Period ATR Calculation : Uses three ATR values to effectively capture market tightness over the short term. Normalization : Converts the tightness measure to a 0-100 scale for easy interpretation. Dynamic Histogram and Background Colors : The RMV indicator uses a color-coded system for clarity.
How to Use the RMV Indicator
Identify Tight Consolidation Zones:
a - RMV values between 0-10 indicate very tight price ranges, making this the most optimal zone for potential entries before breakouts.
b - RMV values between 11-20 suggest moderate tightness, still favorable for entries.
Monitor Potential Breakout Areas:
As RMV moves from 21-30 , tightness reduces, signaling expanding volatility that may require wider stops or more flexible entry strategies.
Adjust Trading Strategies:
Use RMV values to identify tight zones for entering trades, especially in trending markets or at key support/resistance levels.
Customize the Indicator:
a - Adjust the short-term ATR lookback periods to control sensitivity.
b - Modify the lookback period to match your trading horizon, whether short-term or long-term.
Color-Coding Guide for RMV
ibb.co
How to Add RMV to Your Chart
Open your chart on TradingView.
Go to the “Indicators” section.
Search for "Relative Measured Volatility (RMV)" in the Community Scripts section.
Click on the indicator to add it to your chart.
Customize the input parameters to fit your trading strategy.
Input Parameters
Lookback Period : Defines the period over which tightness is measured and normalized.
Short-term ATR Lookbacks (1, 2, 3) : Control sensitivity to short-term tightness.
Histogram Threshold : Sets the threshold for differentiating between bright (tight) and dim (less tight) histogram colors.
Conclusion
The Relative Measured Volatility (RMV) is a versatile tool designed to help traders identify tight entry zones by focusing on market consolidation. By highlighting narrow price ranges, the RMV guides traders toward potential breakout setups while providing clear visual cues for better decision-making. Add RMV to your trading toolkit today and enhance your ability to identify optimal entry points!

RSI & ADX Controlled Entry Signals[deepakks444]Overview:
The "RSI & ADX Immediate Entry Signals" is a TradingView Pine Script designed to provide traders with timely entry signals based on two widely-used technical indicators: the Relative Strength Index (RSI) and the Average Directional Index (ADX). This script aims to maximize responsiveness to market conditions by generating buy and sell signals that reflect the current momentum and trend strength.
Key Components:
Relative Strength Index (RSI): The RSI is a momentum oscillator that measures the speed and change of price movements. It ranges from 0 to 100, typically identifying overbought conditions above 70 and oversold conditions below 30. This script utilizes an RSI threshold of 50 to determine bullish and bearish trends.
Average Directional Index (ADX): The ADX quantifies the strength of a trend without considering its direction. By setting a configurable threshold (default of 25), the script identifies strong trends in the market, facilitating entry signals based on trend direction.
Signal Generation:
Long Entry Signal: A buy signal is generated when the following conditions are met:
The +DI line (Positive Directional Indicator) is above the -DI line (Negative Directional Indicator).
The ADX exceeds the specified threshold (indicating trend strength).
The RSI is above 50 (indicating bullish momentum).
Short Entry Signal: A sell signal is triggered under these conditions:
The -DI line is above the +DI line.
The ADX exceeds the threshold.
The RSI is below 50 (indicating bearish momentum).
User Customization:
The script allows users to adjust the lengths for both the RSI and ADX calculations directly in the input settings to better suit their trading strategy and preferred timeframe.
Users can also customize the ADX threshold to modify sensitivity.
Benefits:
Responsiveness: This script eliminates lag and minimizes the potential for missed trading opportunities by providing immediate entry signals based on current market conditions.
Simplicity: Designed to assist traders in quickly identifying trend changes, this script makes it easy to visualize potential entry points without complex calculations.
Conclusion:
The "RSI & ADX Immediate Entry Signals" script is an effective tool for traders looking to add systematic, rules-based entry signals to their analysis. By combining momentum and trend strength indicators, this script enhances decision-making and can be easily integrated into larger trading strategies.
For immediate Buy/Sell signals keep ADX length at 3.

Auto Fib GOLDEN ENTRY WITH PROFIT ZONE TARGETAuto Fib "GOLDEN ENTRY ZONE WITH TARGET PROFIT TAKING" Indicator Review
Overview
The Auto Fib "GOLDEN ENTRY ZONE WITH TARGET PROFIT TAKING" is a sophisticated TradingView indicator designed to enhance Fibonacci analysis by combining entry signals with predefined profit-taking targets. This tool automates the identification of Fibonacci retracement levels and integrates target profit zones, aiming to streamline the trading process and improve overall trading efficiency.
Features
Automatic Fibonacci Levels: This feature automatically plots Fibonacci retracement levels based on recent price swings, removing the need for manual level setting. This ensures consistency and accuracy in identifying key support and resistance levels.
Golden Entry Zone: The indicator highlights the "Golden Entry Zone," a critical area around significant Fibonacci levels such as the 38.2% and 61.8% retracement levels. This zone helps traders identify potential entry points where the price is likely to reverse or find support.
Target Profit Taking Zones: In addition to identifying entry points, the indicator sets predefined profit-taking targets. These targets are derived from Fibonacci extension levels and are visually marked on the chart, guiding traders on where to consider exiting their positions for optimal gains.
Customizable Settings: Users can tailor the indicator’s settings to fit their trading style, including adjusting Fibonacci levels, entry zone parameters, and profit-taking targets. This flexibility ensures that the indicator aligns with various trading strategies and preferences.
Visual Enhancements: The indicator features clear and customizable visual elements, including color-coded entry zones and profit targets. This visual clarity helps traders quickly interpret and act on the signals provided.
Alerts and Notifications: Traders can set up alerts to be notified when the price approaches the "Golden Entry Zone" or reaches the profit-taking targets. This functionality ensures that traders can act swiftly and capitalize on trading opportunities.
Pros
Streamlined Fibonacci Analysis: By automating Fibonacci level plotting, the indicator eliminates manual errors and saves time, allowing traders to focus on strategy execution.
Enhanced Entry and Exit Points: The combination of the "Golden Entry Zone" and predefined profit-taking targets provides a comprehensive approach to trading, helping traders identify both optimal entry points and strategic exit levels.
Customizable and Flexible: The ability to adjust settings allows traders to adapt the indicator to various market conditions and personal trading styles, making it a versatile tool.
Visual Clarity: The clear graphical representation of entry zones and profit targets improves decision-making and reduces the likelihood of missing key trading opportunities.
Cons
Market Conditions Dependence: The effectiveness of the indicator may vary depending on market volatility and trends. In highly dynamic markets, the predefined profit targets may need adjustments or additional analysis.
Lagging Nature: As with any tool based on historical data, there can be a lag in signal accuracy. Traders should use the indicator in conjunction with other analysis methods to validate signals.
Potential Over-Reliance: Relying solely on the indicator without considering broader market conditions or additional technical factors may lead to suboptimal trading decisions.
Conclusion
The Auto Fib "GOLDEN ENTRY ZONE WITH TARGET PROFIT TAKING" indicator is a powerful tool for traders who utilize Fibonacci retracement and extension levels. By automating the identification of entry points and integrating profit-taking targets, it simplifies the trading process and helps traders make more informed decisions. While the indicator offers significant advantages in terms of ease of use and visual clarity, it is important to use it as part of a broader trading strategy and to consider additional market factors.
For traders looking to enhance their Fibonacci analysis and streamline their trading approach, the Auto Fib "GOLDEN ENTRY ZONE WITH TARGET PROFIT TAKING" provides a valuable and effective solution.
Feel free to modify or expand upon this review based on your specific experiences or additional features of the indicator!

Auto Fib GOLDEN ENTRYAuto Fib "GOLDEN ENTRY ZONE" Indicator Review
Overview
The Auto Fib "GOLDEN ENTRY ZONE" is a TradingView indicator designed to streamline the Fibonacci retracement process for traders. By automatically identifying key Fibonacci levels and highlighting a "golden entry zone," this tool aims to simplify the trading process and enhance decision-making.
Features
Automatic Fibonacci Levels: The indicator automatically plots Fibonacci re-tracement levels on the chart based on recent price swings. This removes the need for manual Fibonacci drawing, which can be subjective and prone to errors.
Golden Entry Zone: The core feature is the "Golden Entry Zone," a highlighted area on the chart where the indicator suggests that the price is likely to reverse or find support/resistance. This zone is typically centered around key Fibonacci levels such as the 38.2% and 61.8% retracement levels, which are considered significant by many traders.
Customizable Settings: Users can adjust the indicator’s settings to fit their trading style. Options include modifying the Fibonacci levels used, the appearance of the zones, and the sensitivity of the automatic level detection.
Visual Enhancements: The indicator features clear and visually appealing graphics, with customizable colors and line styles to match user preferences and enhance readability.
Alerts and Notifications: The indicator can be set up to send alerts when price action enters the "Golden Entry Zone" or when specific Fibonacci levels are approached, allowing traders to act quickly.
Pros
Ease of Use: The automatic plotting of Fibonacci levels is a significant advantage, especially for traders who are new to Fibonacci analysis or those who prefer not to spend time drawing levels manually.
Strategic Entry Points: By highlighting the "Golden Entry Zone," the indicator helps traders identify potentially lucrative entry points with less guesswork involved.
Customization: The ability to customize settings ensures that the indicator can be tailored to fit different trading strategies and preferences.
Visual Clarity: The graphical representation of the Fibonacci levels and the entry zone is well-designed, making it easy to interpret and act on the signals provided.
Cons
Dependence on Recent Price Action: The accuracy of the Fibonacci levels and the "Golden Entry Zone" relies heavily on recent price swings. In highly volatile or trending markets, the indicator may need to be adjusted or supplemented with other tools.
Lagging Indicator: Like most indicators based on historical data, there can be a lag in the signal provided. Traders should use it in conjunction with other analysis methods to confirm signals.
Over-reliance Risk: Relying solely on the indicator without considering broader market context, fundamental analysis, or additional technical indicators can be risky.
Conclusion
The Auto Fib "GOLDEN ENTRY ZONE" indicator is a robust tool for traders who use Fibonacci retracement levels to inform their trading decisions. Its automatic plotting feature and focus on key entry zones simplify the process of identifying potential trading opportunities. However, as with any trading tool, it’s essential to use it as part of a broader strategy and consider additional market factors to enhance trading success.
For traders seeking a reliable and visually intuitive way to apply Fibonacci analysis, the Auto Fib "GOLDEN ENTRY ZONE" is a valuable addition to their TradingView toolkit.
Feel free to adjust or expand on any sections based on your specific experience with the indicator or additional details you’d like to include!

EMA Cross Fibonacci Entry with RetracementThe EMA Cross Fibonacci Entry with Retracement is a trading strategy that combines two popular technical analysis tools: Exponential Moving Averages (EMAs) and Fibonacci retracement levels. Here's a brief overview of how this strategy typically works:
### Exponential Moving Averages (EMAs)
1. **EMAs Calculation**: EMAs give more weight to recent price data, making them more responsive to price changes. Commonly used periods for EMAs in this strategy are the 50-period and 200-period EMAs.
2. **EMA Cross**: The strategy looks for a "golden cross" (short-term EMA crosses above the long-term EMA) as a potential buy signal, and a "death cross" (short-term EMA crosses below the long-term EMA) as a potential sell signal.
### Fibonacci Retracement Levels
1. **Fibonacci Retracement**: This tool is used to identify potential support and resistance levels based on the Fibonacci sequence. The key retracement levels are 23.6%, 38.2%, 50%, 61.8%, and 78.6%.
2. **Drawing Retracement Levels**: Traders draw Fibonacci retracement levels from a significant peak to a significant trough (or vice versa) to identify potential retracement levels where the price might reverse.
### Combining EMA Cross with Fibonacci Retracement
1. **Identify EMA Cross**: First, traders look for an EMA cross. For example, a golden cross where a shorter EMA (e.g., 50 EMA) crosses above a longer EMA (e.g., 200 EMA) suggests a bullish trend.
2. **Wait for Retracement**: After identifying a cross, traders wait for the price to retrace to a Fibonacci level. The key levels to watch are 38.2%, 50%, and 61.8%.
3. **Entry Point**: The entry point is when the price retraces to a Fibonacci level and shows signs of reversal (e.g., bullish candlestick patterns, support at Fibonacci levels). This is typically when traders enter a long position.
4. **Confirmation with EMA**: Ensure that the EMAs support the trend. For a buy entry, the short-term EMA should remain above the long-term EMA.
### Example of a Bullish Entry
1. **Golden Cross**: 50 EMA crosses above 200 EMA.
2. **Retracement**: Price retraces to the 38.2% Fibonacci level.
3. **Entry Signal**: At the 38.2% level, a bullish candlestick pattern (e.g., hammer) forms, indicating potential support.
4. **Entry Point**: Enter a long position at the close of the bullish candlestick.
### Risk Management
1. **Stop Loss**: Place a stop loss below the next Fibonacci retracement level or below the recent swing low to limit potential losses.
2. **Take Profit**: Set a take profit target based on a risk-reward ratio, previous resistance levels, or further Fibonacci extensions.
### Conclusion
The EMA Cross Fibonacci Entry with Retracement strategy is a systematic approach to identifying entry points in a trending market. By combining the responsiveness of EMAs with the predictive power of Fibonacci retracement levels, traders aim to enter trades at optimal points, increasing their chances of success while managing risk effectively.

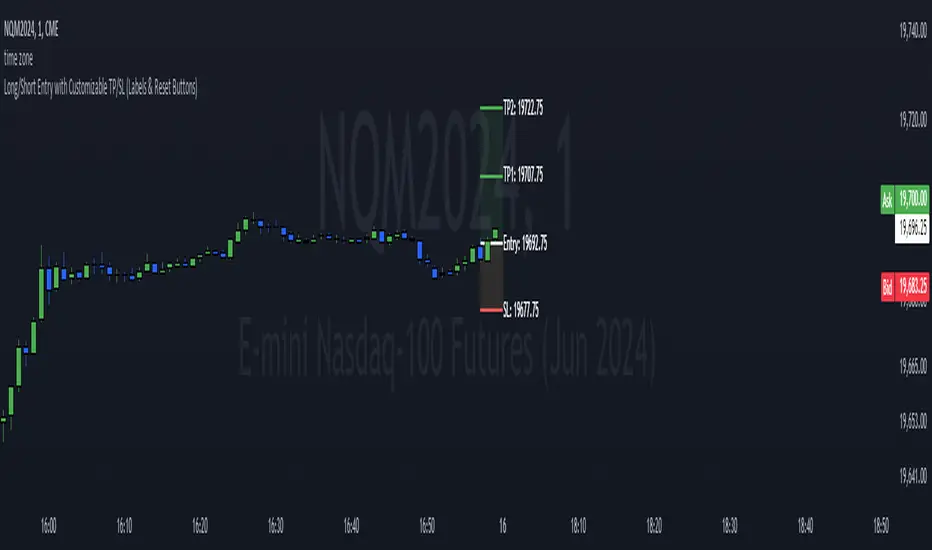
Long/Short Entry with Customizable TP/SLThis TradingView indicator is designed to help traders visualize potential trade entries along with their corresponding stop-loss (SL) and take-profit (TP) levels. It offers a high degree of customization, allowing users to:
Choose Entry Type: Select whether the anticipated trade is a Long or Short position.
Set Entry Price: Specify the exact price level at which you intend to enter the trade.
Customize TP/SL:
Enable/Disable: Choose whether to include a stop-loss (SL) and up to five take-profit (TP) levels.
Distance: Set the distance (in price points) for each SL and TP level from the entry price.
Add/Update Trade: Clicking the "Add/Update Trade" button will plot the entry line, SL line (if enabled), and TP lines (if enabled) on the chart, along with their corresponding labels. The lines and boxes will start two candles before the current bar and extend into the future.
Reset Trade: Clicking the "Reset Trade" button will clear all the lines, boxes, and labels from the chart, allowing you to start fresh with a new trade idea.
Visual Cues:
The indicator uses color-coded lines and boxes to distinguish between entry, SL, and TP levels.
Labels are provided next to each line, displaying the type of level (e.g., "Entry," "SL," "TP1") and its corresponding price.
Key Features:
Highly Customizable: Tailor the indicator to your specific trading style and risk management preferences.
Visual Clarity: Clearly visualize potential trade setups and their outcomes.
Easy to Use: The intuitive interface makes it simple to add, update, and reset trades.
Flexibility: Supports both long and short positions.
Limitations:
The indicator is designed for visualization and planning purposes only. It does not automatically execute trades.
The simulated "Add Trade" and "Reset Trade" buttons require manual unchecking after each click.
Precision Strike Entry [PSE]This tool, known as Precision Strike Entry (PSE) , automatically generates Fibonacci Retracement Levels on any chart. More specifically, it scans for continuation and reversal trades based on two inputs and provides exact entry, exit ( Stop Loss ), and Take Profit levels.
Precision Strike Entry can be used for both Crypto and Forex markets.
A crucial aspect is adjusting the " Trading Mode " length to identify the correct extreme points or Custom Pivot Period Lookback. Unlike manually drawn Fibonacci levels, which remain static, the tool adjusts its levels dynamically when the chart's time frame changes.
Trading Mode Options:
Custom – To set manually Pivot Period Lookback
Scalper - Recommended for 5-15 min timeframes
Normal - Recommended for 15 min-2h timeframes
Swing - Recommended for 2h-4h timeframes
Unique to this tool is that the user can filter specific conditions before the Fibonacci is drawn on the chart. Additionally, it provides exact entry, stop loss, and Take Profit levels.
The identification of possible Fibonacci Retracement happens using two trigger techniques:
1-2 Setup and Trendline Break identification.
--> Using the 1-2 Setup identification, the indicator attempts to identify the next wave for point 3 using Fibonacci retracement rules.
--> Using the TrendLine breakout filter, the indicator will try to identify a possible pullback entry, utilizing Fibonacci retracement.
The indicator has been designed for bot processes, meaning it will not identify a short trade until you are in a long position and vice versa. Every trade ends with a custom breakeven at TP5 or hitting Stop Loss. When a trade ends/closes, the indicator will automatically search for a new long/short opportunity.
Since every symbol (Pair/Coin) has different conformations and pivots, not all pivot period parameters are perfect for every pair and timeframe. This is why the indicator gives you the opportunity to find the best pivot period for every combination of pair/timeframe, thanks to the Tuning Dashboard .
For example, for APE/USDT.P, by adjusting the 1-2 Setup & TrendLine Pivot Period Lookback settings, you can find a good setting with 1-2 Setup pivots set to 14, and TrendLine Breakout set to 15. The indicator checks the past 1000 bars and historical trades to provide an overview of what happened during the past 1000 bars.
In this case, the total number of trades was 145, and only 35 trades (24% of total trades) hit the Stop Loss without hitting at least TP1. TP1 was hit 110 times (75.75% of trades), TP2 65 times, etc.
This summary table also provides an indication of which pivot period setting is best for a specific pair/time frame combination. It offers statistical insights on how Take Profits were hit, giving you more confidence in how much of your position you will sell for each Take Profit level.
Pivot period settings for 1-2 Setup & Trend Line Breakout identification can be modified in the indicator parameters when the Trading Mode is set to Custom. There is also an extra parameter for filtering Long/Short ( Buy and Sell ) signals based on trend, identified using two EMAs (Moving Averages) with periods of 74 and 144.
Within the settings, you can also set Stop Loss and Breakeven settings as you prefer.
Default settings are:
TP1 Breakeven Level to Entry (possible values: Entry - DCA Entry - StopLoss)
TP2 Breakeven Level to TP1 (possible values: Entry - TP1 - StopLoss)
Breakeven Trigger: Use Close/Open of candles
Stoploss Trigger: Use Close/Open of candles
The indicator settings also include some visual settings to adapt the indicator based on the template you are using for your trading view charts for the best experience.
Alert Settings:
Precision Strike Entry (PSE) is designed to integrate with third-party bot systems
You can set three different alert modes:
TradingView Alert : You will receive classic TradingView alerts with messages indicating the desired alert, like Open Long (BUY), StopLoss Hit, Breakeven, and TakeProfits trigger alerts. (You will receive only the selected alerts from the list.)
Bot Alert : You will receive alerts only for Create Trade or Close Trade with the string of your UUID (you have to fill them in related to your Bot indication) and remember to set the Webhook setting to ensure the alert triggers on your Bot. When you use Bot Alert, you have to set the indicator Signal Type related to your Bot settings. NB: If you have created a TradingView Bot for Long Position, you will have to choose Signal Type = Long in the indicator settings.
Free Text Trade Alert : Using this setting, you will receive alerts only for Open Trade Long or Short. All information about Stop Loss and Take Profits is integrated into the Free Text Template.
Explanation for possible Fibonacci Retracement identification:
1-2 Setup identification:
Trend Line Breakout Pullback Identification:

VAMSI ADVANCE Entry HelperThe "VAMSI Entry Helper" indicator is designed to assist traders in identifying potential entry points in the market by analyzing price equilibrium and liquidity equilibrium using a combination of Relative Strength Index (RSI) and moving averages. Here’s a detailed description of its components and functionality:
Components of the Indicator:
RSI (Relative Strength Index):
RSI Length: This parameter (rsiLengthInput) controls the period over which the RSI is calculated. It is set to 50 by default, but you can adjust it as needed.
RSI Source: The source of the price data for calculating the RSI, which is the closing price by default.
Moving Average (MA):
MA Type: You can choose between Simple Moving Average (SMA) and Exponential Moving Average (EMA) for smoothing the RSI values.
MA Length: This parameter (maLengthInput) controls the period over which the moving average of the RSI is calculated. It is set to 60 by default.
Functionality:
RSI Calculation:
The script calculates the RSI based on the selected source and length. RSI is a momentum oscillator that measures the speed and change of price movements and oscillates between 0 and 100.
The RSI calculation involves computing the average gains and losses over the specified period (rsiLengthInput), and then applying the RSI formula.
Moving Average of RSI:
After calculating the RSI, the indicator computes a moving average of the RSI values using the specified type (SMA or EMA) and length (maLengthInput). This smoothed RSI helps in identifying the equilibrium of liquidity.
Plots:
RSI Plot: The RSI values are plotted on the chart with a purple line (#4B0082), providing a visual representation of price equilibrium.
MA Plot: The moving average of the RSI is plotted with a black line, showing the smoothed trend of the RSI.
Middle Band: A horizontal line at the 50 level is plotted as a reference point, indicating the midpoint of the RSI scale. This can help in identifying overbought and oversold conditions.
Use Case:
Price Equilibrium: The RSI plot helps traders identify when the price is relatively strong or weak. RSI values above 70 may indicate an overbought condition, while values below 30 may indicate an oversold condition.
Liquidity Equilibrium: The moving average of the RSI provides a smoothed view of the RSI, helping traders see the overall trend of liquidity equilibrium.
Example Usage:
Entry Points: Traders might look for entry points when the RSI crosses above or below its moving average, indicating potential changes in momentum.
Overbought/Oversold Conditions: Traders can use the RSI values along with the middle band (50) to identify overbought (RSI > 70) and oversold (RSI < 30) conditions.
Customization:
RSI Length: Adjustable to fit different trading strategies and timeframes.
Source: You can change the source data for the RSI calculation (e.g., close, open, high, low).
MA Type and Length: You can choose between SMA and EMA and adjust the period to better fit your trading style.
This indicator provides a comprehensive tool for traders to analyze price and liquidity equilibrium, helping them make informed decisions about entry points in the market.

Dynamic Date and Price Tracker with Entry PriceThe Dynamic Date and Price Tracker indicator is a simple tool designed for traders to visualize and monitor their trade's progress in real-time from a specified starting point.
This tool provides an intuitive graphical representation of your trade's profitability based on a custom entry date and price.
Features:
-Starting Date Selection: Choose a specific starting date, after which the indicator begins tracking your trade's performance.
-Custom Entry Price: Input a starting price to accurately reflect your actual entry price for performance tracking across different timeframes.
-Real-Time Tracking: As new bars form, the indicator automatically adjusts a dynamic line to the current closing price.
-Profit/Loss Color Coding: The dynamic line color changes based on whether the current price is above (green for profit) or below (red for loss) your specified entry price.
-Performance Label: A real-time label displays the absolute and percentage change in price since your initial entry, color-coded for positive (green) or negative (red) performance.
-Entry Price Line: The horizontal line marks your starting price for easy visual comparison.

Fibonacci Entry SignalsЭтот индикатор "Fibonacci Entry Signals" помогает определить точки входа в покупку и продажу на основе уровней Фибоначчи и скользящей средней.
Ключевые особенности:
Уровни Фибоначчи: Индикатор рисует на графике несколько уровней Фибоначчи, таких как 38.2%, 50% и 61.8%. Эти уровни определяются на основе крайних точек цены за последние 100 баров. Уровень 0% соответствует самой низкой точке, а уровень 100% - самой высокой.
Точки входа: При наступлении условий входа в покупку или продажу, индикатор отмечает на графике точки входа в виде треугольников вверх или вниз соответственно. Условия входа в покупку определяются, когда цена пересекает уровень Фибоначчи 38.2% вверх и находится выше скользящей средней за последние 50 баров. Условия входа в продажу аналогичны, но цена пересекает уровень Фибоначчи 61.8% вниз.
Этот индикатор может быть полезен для трейдеров, которые используют уровни Фибоначчи в своей торговой стратегии и ищут точки входа в рынок. Однако, перед использованием на реальном счете, рекомендуется провести тщательное тестирование и адаптацию к своим индивидуальным потребностям и стратегии торговли.
Давайте рассмотрим, как пользоваться индикатором "Fibonacci Entry Signals":
Установка на график: Для начала необходимо добавить индикатор на график вашего торгового актива. Вы можете сделать это, выбрав его из списка индикаторов в торговой платформе.
Интерпретация уровней Фибоначчи: Индикатор отображает на графике несколько уровней Фибоначчи, таких как 38.2%, 50% и 61.8%. Понимание этих уровней поможет вам определить возможные точки входа в рынок. Обычно, уровень 38.2% используется как уровень поддержки, а уровень 61.8% - как уровень сопротивления.
Точки входа в покупку и продажу: Индикатор помогает определить моменты, когда можно войти в покупку или продажу. При наступлении условий входа в покупку, индикатор отмечает на графике точку входа в виде зеленого треугольника вверх. При наступлении условий входа в продажу, индикатор отмечает точку входа на графике в виде красного треугольника вниз.
Управление позициями: После получения сигнала от индикатора, решение о входе в позицию остается за вами. Важно помнить, что индикатор является только инструментом, который помогает в принятии решений, и его сигналы всегда следует подтверждать другими аспектами вашей торговой стратегии, такими как подтверждение другими индикаторами или анализ фундаментальных данных.
Тестирование и адаптация: Прежде чем использовать индикатор на реальном счете, рекомендуется провести тщательное тестирование на исторических данных и адаптировать его к своим индивидуальным торговым потребностям и стратегии.
Индикатор "Fibonacci Entry Signals" может быть полезным инструментом для трейдеров, которые используют уровни Фибоначчи в своей торговой стратегии и ищут точки входа в рынок.
his "Fibonacci Entry Signals" indicator helps identify entry points for buying and selling based on Fibonacci levels and moving averages.
Key features:
Fibonacci Levels: The indicator draws several Fibonacci levels on the chart, such as 38.2%, 50%, and 61.8%. These levels are determined based on the extreme price points over the last 100 bars. The 0% level corresponds to the lowest point, and the 100% level corresponds to the highest point.
Entry Points: When conditions for buying or selling occur, the indicator marks entry points on the chart as upward or downward triangles, respectively. Entry conditions for buying are determined when the price crosses above the 38.2% Fibonacci level and remains above the 50-bar moving average. Entry conditions for selling are similar, but the price crosses below the 61.8% Fibonacci level.
This indicator can be useful for traders who use Fibonacci levels in their trading strategy and look for entry points in the market. However, before using it on a real account, it is recommended to conduct thorough testing and adaptation to your individual trading needs and strategy.
Let's look at how to use the "Fibonacci Entry Signals" indicator:
Installation on the Chart: First, you need to add the indicator to the chart of your trading asset. You can do this by selecting it from the list of indicators in the trading platform.
Interpreting Fibonacci Levels: The indicator displays several Fibonacci levels on the chart, such as 38.2%, 50%, and 61.8%. Understanding these levels will help you identify potential entry points in the market. Usually, the 38.2% level is used as support, and the 61.8% level is used as resistance.
Entry Points for Buying and Selling: The indicator helps identify moments when you can enter buying or selling positions. When conditions for buying occur, the indicator marks the entry point on the chart as a green upward triangle. When conditions for selling occur, the indicator marks the entry point on the chart as a red downward triangle.
Position Management: After receiving a signal from the indicator, the decision to enter a position is up to you. It's important to remember that the indicator is just a tool to help you make decisions, and its signals should always be confirmed by other aspects of your trading strategy, such as confirmation from other indicators or fundamental analysis.
Testing and Adaptation: Before using the indicator on a real account, it's recommended to conduct thorough testing on historical data and adapt it to your individual trading needs and strategy.
The "Fibonacci Entry Signals" indicator can be a useful tool for traders who use Fibonacci levels in their trading strategy and look for entry points in the market.

[blackcat] L1 Ichimoku Cloud with Entry SignalsThe Ichimoku Cloud is a technical analysis indicator used to identify potential trend reversals, support and resistance levels, and generate entry and exit signals in financial markets. It was developed by a Japanese journalist named Goichi Hosoda, who went by the pen name Ichimoku Sanjin.
The Ichimoku Cloud consists of several components, including the Tenkan-sen (Conversion Line), Kijun-sen (Base Line), Senkou Span A (Leading Span A), Senkou Span B (Leading Span B), and the Cloud. The Tenkan-sen and Kijun-sen lines are calculated based on the average of the highest high and lowest low over a specific period of time. The Senkou Span A is the average of the Tenkan-sen and Kijun-sen, plotted ahead of the current price. The Senkou Span B is calculated based on the average of the highest high and lowest low over a longer period of time, also plotted ahead of the current price. The Cloud is the area between Senkou Span A and Senkou Span B and is often used to identify potential support and resistance levels.
The Ichimoku Cloud with Entry Signals script provided above is a TradingView Pine script that plots the Ichimoku Cloud on a chart, along with entry signals. The entry signals are generated based on the crossover and crossunder of the Tenkan-sen and Kijun-sen lines, as well as the relationship of the closing price with Senkou Span A and Senkou Span B. When the conditions for a long entry signal are met, a green triangle-up shape is plotted below the price bars. Conversely, when the conditions for a short entry signal are met, a red triangle-down shape is plotted above the price bars.
It's important to note that the Ichimoku Cloud is a versatile indicator that can be used in various ways, including identifying trends, determining support and resistance levels, and generating entry and exit signals. Traders and investors often use it in conjunction with other technical analysis tools and indicators to make informed trading decisions.
This piece of code is a TradingView indicator script used to plot Ichimoku Cloud and display entry signals. It is written in Pine Script language.
First, the `indicator` function is used to set the title and short title of the indicator and overlay it on the main chart.
Next, two parameters `tenkanPeriod` and `kijunPeriod` are defined to represent the calculation period of Tenkan-sen (Conversion Line) and Kijun-sen (Base Line) respectively. Then, the `ta.sma` function is used to calculate the values of Tenkan-sen and Kijun-sen, and they are plotted on the chart using the `plot` function.
After that, the value of Senkou Span A (Leading Span A) is calculated using the `math.avg` function, and it is plotted on the chart using the `plot` function. Similarly, the value of Senkou Span B (Leading Span B) is calculated and plotted.
Then, the `fill` function is used to fill the area between Senkou Span A and Senkou Span B with color, forming the cloud.
Finally, entry signals are determined based on certain conditions. If the conditions are met, the `plotshape` function is called to plot arrow shapes at the corresponding positions to represent entry points.

Extreme Entry with Mean Reversion and Trend FilterThis non-repainting indicator is an improved version of my previous work, a more versatile tool designed to provide traders with dynamic and adaptive entry signals while incorporating a mean reversion and trend filtering mechanism. By combining RSI overbought/oversold, regular divergence and confirmatory momentum oscillator such as CCI or MOM, this indicator generates more precise and timely signals for entering trades.
The indicator offers a comprehensive set of entry conditions for both Buy and Sell entries:
• For Buy entries, it checks for oversold conditions based on RSI levels, and detects bullish divergence patterns while oversold and it identifies upward crossovers in the selected entry signal source (CCI or Momentum).
• Similarly, for Sell entries, it identifies downward crossovers of the CCI or Mom, after the recent overbought conditions, and bearish divergence patterns inside the overbought RSI.
To refine the entry signals even further, the indicator utilizes a mean reversion filter. Traders can choose to display signals that occur inside or outside the upper and lower mean reversion bands:
• Range Entries are indicating potential buying opportunities near the lower band and selling opportunities near the upper band. This is based on the concept of mean reversion, which suggests that prices tend to return to the average when they reach the upper or lower bands. By focusing on these signals, traders can take advantage of price movements that have a higher probability of reversing towards the mean.
• Extreme Entries, on the other hand, represent signals that occur outside of the bands, signaling potential pullbacks during strong trends. By entering positions only at extreme highs or lows, traders can avoid getting caught in the middle of the trend. This approach helps traders capitalize more favorable trading opportunities which have a high reward-risk ratio.
Trend Filter acts as a directional bias for the entry signals. When enabled, long and short entry conditions are filtered based on the relationship between the closing price and the EMA.
Traders have the flexibility to customize, tweak the indicator filter and values in the settings according to their preferences strategies and traded assets, tailoring the signals to their specific needs. The script sets alert conditions to trigger alerts for buy, sell, or both entry signals. This indicator can be used in conjunction with price action or other technical analysis tools for confirmation and better trading decisions.
I created this indicator for my own use, and I share this for informational purposes only. It does not constitute financial advice so use at your own risk and consider your financial situation before making any trading decisions. The indicator's accuracy is not guaranteed, and past performance is not indicative of future results.
I appreciate your feedback on this indicator. As I am new to script development, I am open to comments and suggestions to improve it. If you encounter any issues while using this indicator, please let me know in the comments section. If you find it helpful, I kindly ask for your support in boosting it. Thank you for your cooperation.

CryptoGraph Entry BuilderA complete system to generate buy & sell signals, based on multiple indicators, timeframes and assets
═════════════════════════════════════════════════════════════════════════
🟣 How it works
This indicator allows you to create buy & sell signals, based on multiple trigger conditions, placed in one easy to use TradingView indicator to produce alerts, backtest, reduce risk and increase profitability. This script is especially designed to be used with the CryptoGraph Strategizer indicator. Signals produced by this indicator, can be used as external input with the CryptoGraph Strategizer, by adding both indicators to your chart and selecting "External Input" as entry source in the inputs of the Strategizer indicator. From that point on, buy & sell signals generated by the Entry Builder, will be used for backtesting.
Each trigger or filtering condition is selectable and able to be combined using the selection boxes.
Trigger or filter conditions can be used on a different timeframes, and with different assets or coin pairs. Make sure to set higher timeframe filters, to a higher timeframe than your chart timeframe.
🟣 How to use
• Add the indicator to your chart
• Select an indicator you woud like to use for entry analysis. Combine more indicators for more entry filtering
• Configure entry conditions per indicator. It is recommended to add and configure one indicator at a time
• Analyse your buy/sell entries
• Connect to CryptoGraph Strategizer as external input source for backtesting purposes
🟣 Indicator Filters
• ATR :
Average True Range (ATR) is a tool used in technical analysis to measure volatility .
Possible options for ATR entry filtering are an ATR value greater/smaller than your input variable for trade entries, or the ATR crossing your input variable for trade entries.
This enables the possibility to only enter positions when the market has a certain degree of volatility .
• ADX :
The Average Directional Index ( ADX ) helps traders determine the strength of a trend, not its actual direction. It can be used to find out whether the
market is ranging or starting a new trend.
Possible options for ADX entry filtering are an ADX value greater/smaller than your input variable for trade entries, or the ADX crossing your input variable for trade entries.
• OBV :
The On Balance Volume indicator (OBV) is used in technical analysis to measure buying and selling pressure. It is a cumulative indicator meaning that on days where price went up, that day's volume is added to the cumulative OBV total.
Possible options for OBV entry filtering are Regular, Hidden or Regular&Hidden divergences. Divergence is when the price of an asset is moving in the opposite direction of a technical indicator, such as an oscillator, or is moving contrary to other data. Divergence warns that the current price trend may be weakening, and in some cases may lead to the price changing direction.
• Moving Average :
Moving Average (MA) is a price based, lagging (or reactive) indicator that displays the average price of a security over a set period of time. A Moving Average is a good way to gauge momentum as well as to confirm trends, and define areas of support and resistance .
Possible options for MA entry filtering are price being above/below Moving Average 1, price crossing up/down Moving Average 1, Moving Average 1 being above/below Moving Average 2 and Moving Average 1 crossing up/down Moving Average 2.
• Supertrend :
Supertrend (ST) is a trend-following indicator based on Average True Range (ATR). The calculation of its single line combines trend detection and volatility . It can be used to detect changes in trend direction and to position stops.
Possible options for ST entry filtering are Supertrend being in upward/downward direction, or Supertrend changing direction.
• RSI :
The Relative Strength Index ( RSI ) is a well versed momentum based oscillator which is used to measure the speed (velocity) as well as the change (magnitude) of directional price movements.
Possible options for RSI entry filtering are RSI being smaller/greater than your input value, or RSI crossing up/down your input value.
• Stochastic RSI :
The Stochastic RSI indicator ( Stoch RSI ) is essentially an indicator of an indicator. It is used in technical analysis to provide a stochastic calculation to the RSI indicator. This means that it is a measure of RSI relative to its own high/low range over a user defined period of time.
Possible options for Stoch RSI entry filtering are Stoch RSI crossing below or above your input value.
• VWAP Bands :
Volume Weighted Average Price ( VWAP ) is a technical analysis tool used to measure the average price weighted by volume . VWAP is typically used with intraday charts as a way to determine the general direction of intraday prices.
We use standard deviations, determined by user input, to create VWAP bands.
Possible options for VWAP long entry filtering are: price being below the lower VWAP band, price crossing back up the lower VWAP band or price crossing down the lower VWAP band.
Possible options for VWAP short entry filtering are: price being above the upper VWAP band, price crossing back down the upper VWAP band, or price crossing up the upper VWAP band.
• Bollinger Bands :
Bollinger Bands (BB) are a widely popular technical analysis instrument created by John Bollinger in the early 1980’s. Bollinger Bands consist of a band of three lines which are plotted in relation to security prices. The line in the middle is usually a Simple Moving Average ( SMA ) set to a period of 20 days (the type of trend line and period can be changed by the trader; however a 20 day moving average is by far the most popular).
Possible options for BB long entry filtering are: price being below the lower Bollinger band , price crossing back up the lower Bollinger band or price crossing down the lower Bollinger band .
Possible options for BB short entry filtering are: price being above the upper Bollinger band , price crossing back down the upper Bollinger band , or price crossing up the upper Bollinger band .
• WaveTrend :
WaveTrend (WT) is a smoothed momentum oscillator which enables it to detect true reversals in an accurate manner.
Possible options for WT entry filtering are: Green/red dots below or above a certain WaveTrend value, Regular Divergence, Hidden Divergence and Regular&Hidden Divergence.

Jerry J8 MACD Optimal Entry Zone---- STRATEGY
This MACD indicator includes an optimal entry zone for entering your trades and works with any symbol in any time frame. The optimal entry zone is defined by user controlled inputs for up to 10 symbols and is pre-loaded with the SPY, IWM, QQQ, NDX, and TESLA for the 3 minute time frame. Additionally, you can add up to 5 more symbols and adjust the optimal entry zones for each signal.
The optimal entry zone is the range above and below the MACD zero line where the highest probability trades can be entered. Too far above or below the zero line and the move is more likely to be exhausted or premature. This is not an exact science and you will want to set the zone for each symbol on the chart time frame you trade.
The reason this indicator is so helpful is because the optimal entry zone changes for every symbol and for every time frame and this indicator automatically shows these zones for up to 10 stock symbols.
---- SETUP & HINTS
There are times when the MACD may be outside of the optimal range but due to other factors (for example, high volume or market moving news) I would choose to enter a trade.
Indicators are not a magic pill and should be used to support trading decisions, not to make them for you. Past performance is not a guarantee of future returns. The results of individual stocks/indexes with any strategy do not constitute proof they will repeat in the future.
DISCLAIMER: The information contained in our scripts/indicators/ideas does not constitute financial advice or a solicitation to buy or sell any securities of any type. Trading and investing in the stock market and cryptocurrencies involves substantial risk of loss and is not suitable for every investor. I’m NOT a financial adviser. All trading strategies are used at your own risk.
Please use the AUTHOR’s INSTRUCTIONS link below for more information.
