High-Res VP + Macro Auto Fib DJVolume profiling plus Fibonacci for the descrationary trader.
Volume profile: The most important tool that I know.
Fib: Gives you an idea of the moves.
Search in scripts for "fib"

[iQ]PRO Fractals in Dealing Range and Fib Levels+⚡️ PRO Combined Fractal & Dealing Range THEORY W QUADRANTS AND FIB LEVELS: Dynamic Price Structure Analysis
The PRO Combined Fractal & Dealing Range indicator is a proprietary, cutting-edge market structure analysis tool designed to give serious traders a tactical edge by merging advanced Fractal-based wave detection with a sophisticated Dynamic Dealing Range system. This professional-grade utility provides a crystal-clear, multi-layered view of key supply and demand zones, trend reversals, and structural boundaries.
Key Features & Proprietary Logic
This indicator is built on two harmoniously integrated engines, providing a comprehensive view that goes far beyond standard technical analysis.
📈 Adaptive Fractal Wave Engine
Our custom-tuned Fractal Engine employs a unique, multi-degree detection process to identify both Base Swings and Higher Degree Swings with unparalleled precision.
Proprietary Period Calculation: The engine utilizes a specialized formula based on the Golden Ratio (ϕ) to determine a refined higher-degree lookback period: Period
F
=floor(Period
Base
ϕ
). This adaptive logic helps filter market noise and highlight only the most significant structural turning points.
Dynamic Labeling: Automatically places visual markers on the chart to define confirmed Highs and Lows, simplifying the interpretation of market structure and potential directional shifts.
🎯 Dynamic Dealing Range System
This core component provides a detailed, automatically calculated framework of critical price levels, serving as a roadmap for potential entries, targets, and risk management.
Strategic Quadrant Mapping: Automatically establishes a significant Dealing Range based on a customizable lookback period, then divides it into four distinct Quadrants (Q1-Q4). These zones highlight areas of Premium, Equilibrium (Q2-Q3), and Discount, guiding trading decisions relative to the overall range.
Advanced Level Detection:
Fibonacci Retracement: Displays key Fibonacci levels (e.g., 50%, 61.8%, 78.6%) within a user-defined range, identifying high-probability reversal and reaction areas.
Liquidity & Pivots: The indicator incorporates a proprietary Liquidity Detection Algorithm using adaptive pivot sensitivity to identify significant historical support and resistance zones.
Inter-Timeframe Structure: Features a non-repainting method to display Important Highs/Lows (such as Monthly, Weekly, and Daily extremes) right on your current chart, bridging the gap between timeframes.
Professional Trader Utility
Clarity on Price Action: Instantly see the structure of the market and which direction the momentum is flowing based on the confirmed fractal swings.
Actionable Alerts: Receive timely and precise alerts when price approaches critical psychological and structural levels, including the Quadrant boundaries and the highly reactive Fibonacci 0.618 level.
Information at a Glance: A clean, professional table is displayed on the chart, summarizing the calculated range boundaries (Quadrant and Fibonacci Highs/Lows) for immediate reference.
The PRO Combined Fractal & Dealing Range is an indispensable tool for traders focused on market structure, institutional price action, and trading within clearly defined ranges. It is designed to minimize subjectivity and maximize clarity on your TradingView chart.
NO REPAINT ;)

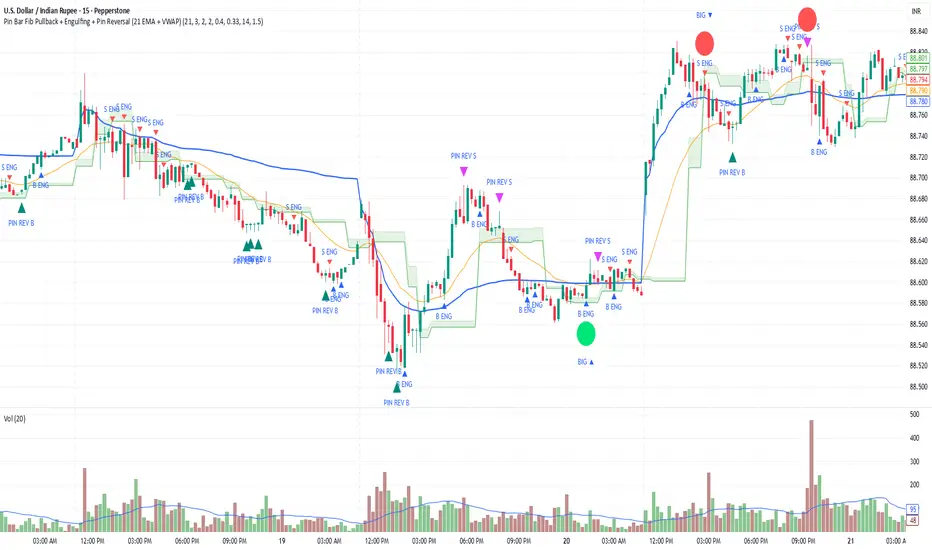
Pin Bar Fib Pullback + Engulfing + Pin Reversal (21 EMA + VWAP)Dear Traders
Pin bar fib pullback continuation (in 0.50–0.618 zone)
Bullish/Bearish engulfing
Pin bar reversals (bottom/top)
Then we ask: did the next candle move at least atrMult × ATR away from the signal close in the right direction?
For a long signal: next high ≥ signal close + ATR * atrMult
For a short signal: next low ≤ signal close − ATR * atrMult
If yes, that signal gets a big circle with text:
BIG ▲ for long
BIG ▼ for short
drawn on the original signal bar (using offset = -1 trick).
You can tune how “big” you want:
Increase ATR length for smoother ATR
Increase ATR * (e.g., from 1.5 → 2.0) to only mark really strong moves.
RTH Gap Fib + StdDevDraws quadrants on the RTH gap, and draws fib projections off both sides of the range.
Weekly Institutional Fib Pivots v1These Fibonacci levels act as institutional order zones, meaning price reacts more powerfully when it originates from them. Use them as a weekly roadmap to anticipate where price is likely to travel each day, including during overnight or automated trading sessions.
How to trade them:
• Take the previous weeks levels and use those levels to trade the current week.
• Enter and exit around the major fib levels
• Use the 50% midpoint between levels as your first take-profit or stop-loss zone
These levels provide structure, targets, and precision for both intraday and multi-session trading.
Strategy:
Place your order at one level, and exit before it reaches the next level or at the 50% area of the zone

Weekly Institutional Fib PivotsThese Fibonacci levels act as institutional order zones, meaning price reacts more powerfully when it originates from them. Use them as a weekly roadmap to anticipate where price is likely to travel each day, including during overnight or automated trading sessions.
How to trade them:
• Take the previous weeks levels and use those levels to trade the current week.
• Enter and exit around the major fib levels
• Use the 50% midpoint between levels as your first take-profit or stop-loss zone
These levels provide structure, targets, and precision for both intraday and multi-session trading.
Strategy:
Place your order at one level, and exit before it reaches the next level or at the 50% area of the zone

Auto Fib Retracement-custom lines📈 Auto Fib Retracement (with Custom Line Thickness)
This indicator provides an automatic application of Fibonacci Retracement and Extension levels based on key Pivot points on the chart. It uses advanced logic to identify relevant momentum based on user-defined parameters, ensuring dynamic and accurate level drawing without the need for manual measurement.
Key Features of the Indicator ✨
Automatic Drawing: Fibonacci levels are automatically drawn based on the last significant Pivot swing detected by the indicator.
Fibonacci Retracement and Extension: Displays classic retracement levels (such as 0.382, 0.5, 0.618) and extensions (such as 1.272, 1.618, 2.618, etc.), with the option to individually toggle the visibility of each level.
Custom Line Width (New Feature): This is the key added functionality! For every Fibonacci level, an option has been included to individually adjust the line thickness (width). This allows traders to visually highlight (bold) critical support/resistance levels (like 0, 0.618, 1, etc.) to make them more noticeable on the chart.
Pivot Customization: Control the sensitivity of Pivot detection using the "Deviation" and "Depth" parameters.
Line Extension: Options to extend the Fibonacci lines to the left, right, or both sides.
Detail Display: Ability to show/hide Fibonacci values (levels) and prices on the labels.
⚙️ Input Parameters
This indicator offers complete control over how the Fibonacci levels are displayed:
Deviation: A multiplier that affects how much the price must deviate from the previous pivot for a new pivot to be formed. Increasing the value makes the indicator less sensitive; decreasing it makes it more sensitive.
Depth: The minimum number of bars considered when calculating the pivots.
Reverse: Option to reverse the drawing direction (from top to bottom or vice-versa).
Extend Left/Right: Controls the extension of the Fibonacci lines.
Level Settings (0, 0.236, 0.382, 0.5, 0.618, etc.):
Checkbox: Turn the display of each individual Fibonacci level on or off.
Value: Customize the Fibonacci value (e.g., you can change 0.618 to 0.65).
Color: Adjust the line color.
Line Width: Crucial option! Allows you to set the line thickness from 1 to 5. Use this to emphasize the most important levels.
Background Transparency: Adjust the transparency of the background fill between the Fibonacci levels.
How to Use It 💡
This tool is ideal for traders who use Fibonacci Retracement to determine potential areas of support and resistance, profit targets (extensions), and entry zones. Use the Custom Line Width option to visually set apart the key levels you believe have the most significant impact on the market (e.g., 0, 0.5, 0.618, and 1).

Dynamic Auto FibonacciDynamic Auto Fibonacci - Logarithmic Fib Retracements & Extensions
Overview
Dynamic Auto Fibonacci is an advanced Fibonacci analysis tool that automatically identifies swing highs and lows to plot precise retracement and extension levels on your chart. Unlike traditional manual Fibonacci tools, this indicator dynamically updates as price action evolves, with full support for logarithmic scaling - essential for accurate analysis on long-term charts and high-growth assets.
The indicator features a clean, modern aesthetic with customizable vibrant colors and text-only labels that won't clutter your chart, making it perfect for both intraday scalping and long-term position trading.
Key Features
✅ Automatic Fibonacci Detection - Automatically finds the highest high and lowest low within your selected timeframe
✅ Manual Anchor Point - Click directly on the chart to set a custom low point for your Fibonacci analysis
✅ Logarithmic Scale Support - True logarithmic Fibonacci calculations for accurate levels on log-scale charts
✅ Flexible Display Modes - Show retracements only, extensions only, or both simultaneously
✅ Fully Customizable Levels - Adjust any Fibonacci level value, color, or toggle individual levels on/off
✅ Unified Color Mode - One-click option to change all levels to a single color (perfect for minimalist chart styles)
✅ Clean Modern Design - Text-only labels with vibrant colors and adjustable positioning
✅ 13 Default Levels - Includes 0.0, 0.236, 0.382, 0.5, 0.618, 0.786, 0.886, 1.0, 1.236, 1.414, 1.618, 2.0, and 2.618
How to Use
Quick Start (Automatic Mode)
Add the indicator to your chart
By default, it will automatically find the lowest and highest points over the past 12 months
Fibonacci levels will appear with clean colored text labels positioned to the right of current price
Setting a Custom Anchor Point (Manual Mode)
This is the most powerful feature - drawing from a specific swing low:
Click the Settings icon (gear) on the indicator
Navigate to Fibonacci Settings group
Click inside the "Anchor Start Time" field - this will activate anchor selection mode
Click directly on the candle where you want to set your swing low point on the chart
The indicator will automatically:
Lock that candle as your anchor (swing low)
Find the highest high that occurred after your selected anchor point
Draw Fibonacci retracement and extension levels between those two points
Important: The anchor represents the starting point (0.0 level) of your Fibonacci, and the indicator finds the peak after that point as the 1.0 level.
Display Modes
Navigate to Display Settings → Display Mode to choose:
Retracements & Extensions (default) - Shows all levels from 0.0 to 2.618
Retracements Only - Shows only 0.0 to 1.0 levels (great for identifying pullback entry zones)
Extensions Only - Shows 1.0+ levels (useful for profit targets and breakout projections)
Customizing Individual Levels
Under Retracement Levels and Extension Levels groups, each level has three controls:
Toggle checkbox - Show/hide the level
Value field - Adjust the exact Fibonacci ratio (e.g., change 0.618 to 0.65 if desired)
Color picker - Set unique colors for each level
Unified Color Override
Perfect for chart screenshots or minimalist aesthetics:
Go to Unified Color Override settings group
Enable "Use Unified Color for All Levels"
Choose your color (defaults to gray)
All lines and text immediately change to that color - individual settings are preserved when you toggle back off
Line & Label Customization
Display Settings group offers:
Line Style: Solid, Dashed, or Dotted
Line Length: Short (10 bars), Medium (50 bars), or Long (extends right infinitely)
Line Width: 1-5 pixels
Label Size: Tiny to Huge
Label Offset: Adjust how many bars to the right labels appear (default: 12)
Show Anchor Line: Display vertical lines at your swing low and swing high points
Settings Overview
Fibonacci Settings:
Retracement Timeframe (default: 12M)
Anchor Start Time (click to select candle)
Use Log Scale Calculation (highly recommended for crypto and growth stocks)
Display Settings:
Display Mode (Retracements & Extensions / Retracements Only / Extensions Only)
Line Style, Length, Width
On-Chart Labels (clean text) or Price Scale Labels (traditional right-side axis)
Label Size and Offset
Unified Color Override:
One-click monochrome mode for all levels
Individual Level Controls:
8 customizable retracement levels (0.0 to 1.0)
5 customizable extension levels (1.236 to 2.618)
Use Cases
📊 Swing Trading - Identify key support/resistance zones for entries and exits
📊 Scalping - Use short-term anchors to find precise intraday reversal levels
📊 Position Trading - Logarithmic calculations essential for multi-year crypto/stock analysis
📊 Options Trading - Extension levels provide excellent profit target zones
📊 Multi-Timeframe Analysis - Set different anchors to compare short-term vs. long-term Fibonacci structures
Tips for Best Results
For cryptocurrency and growth stocks: Always enable "Use Log Scale Calculation" and view your chart in log scale
For precision: Use the manual anchor feature to draw from confirmed swing lows/highs rather than relying on automatic detection
For clean charts: Toggle off levels you don't actively use (e.g., disable 0.786 and 0.886 if you only trade 0.382/0.618)
For screenshots: Enable Unified Color Override and set to grayscale for professional-looking chart exports
Note on Logarithmic Scale
This indicator includes true logarithmic Fibonacci calculations, which are critical when analyzing assets with significant price appreciation. Standard arithmetic Fibonacci tools become increasingly inaccurate on log-scale charts - this indicator solves that problem by calculating levels using logarithmic mathematics when "Use Log Scale Calculation" is enabled.
Disclaimer: This indicator is a tool for technical analysis and does not constitute financial advice. Always perform your own analysis and risk management before making trading decisions.

Triple SuperTrend + RSI + Fib BBTriple SuperTrend + RSI + Fibonacci Bollinger Bands Strategy
📊 Overview
This advanced trading strategy combines the power of three SuperTrend indicators with RSI confirmation and Fibonacci Bollinger Bands to generate high-probability trade signals. The strategy is designed to capture strong trending moves while filtering out false signals through multi-indicator confluence.
🔧 Core Components
Three SuperTrend Indicators
The strategy uses three SuperTrend indicators with progressively longer periods and multipliers:
SuperTrend 1: 10-period ATR, 1.0 multiplier (fastest, most sensitive)
SuperTrend 2: 11-period ATR, 2.0 multiplier (medium sensitivity)
SuperTrend 3: 12-period ATR, 3.0 multiplier (slowest, most stable)
This layered approach ensures that all three timeframe perspectives align before generating a signal, significantly reducing false entries.
RSI Confirmation (7-period)
The Relative Strength Index acts as a momentum filter:
Long signals require RSI > 50 (bullish momentum)
Short signals require RSI < 50 (bearish momentum)
This prevents entries during weak or divergent price action.
Fibonacci Bollinger Bands (200, 2.618)
Uses a 200-period Simple Moving Average with 2.618 standard deviation bands (Fibonacci ratio). These bands serve dual purposes:
Visual representation of price extremes
Automatic exit trigger when price reaches overextended levels
📈 Entry Logic
LONG Entry (BUY Signal)
A LONG position is opened when ALL of the following conditions are met simultaneously:
All three SuperTrend indicators turn green (bullish)
RSI(7) is above 50
This is the first bar where all conditions align (no repainting)
SHORT Entry (SELL Signal)
A SHORT position is opened when ALL of the following conditions are met simultaneously:
All three SuperTrend indicators turn red (bearish)
RSI(7) is below 50
This is the first bar where all conditions align (no repainting)
🚪 Exit Logic
Positions are automatically closed when ANY of these conditions occur:
SuperTrend Color Change: Any one of the three SuperTrend indicators changes direction
Fibonacci BB Touch: Price reaches or exceeds the upper or lower Fibonacci Bollinger Band (2.618 standard deviations)
This dual-exit approach protects profits by:
Exiting quickly when trend momentum shifts (SuperTrend change)
Taking profits at statistical price extremes (Fib BB touch)
🎨 Visual Features
Signal Arrows
Green Up Arrow (BUY): Appears below the bar when long entry conditions are met
Red Down Arrow (SELL): Appears above the bar when short entry conditions are met
Yellow Down Arrow (EXIT): Appears above the bar when exit conditions are met
Background Coloring
Light Green Tint: All three SuperTrends are bullish (uptrend environment)
Light Red Tint: All three SuperTrends are bearish (downtrend environment)
SuperTrend Lines
Three colored lines plotted with varying opacity:
Solid line (ST1): Most responsive to price changes
Semi-transparent (ST2): Medium-term trend
Most transparent (ST3): Long-term trend structure
Dashboard
Real-time information panel showing:
Individual SuperTrend status (UP/DOWN)
Current RSI value and color-coded status
Current position (LONG/SHORT/FLAT)
Net Profit/Loss
⚙️ Customizable Parameters
SuperTrend Settings
ATR periods for each SuperTrend (default: 10, 11, 12)
Multipliers for each SuperTrend (default: 1.0, 2.0, 3.0)
RSI Settings
RSI length (default: 7)
RSI source (default: close)
Fibonacci Bollinger Bands
BB length (default: 200)
BB multiplier (default: 2.618)
Strategy Options
Enable/disable long trades
Enable/disable short trades
Initial capital
Position sizing
Commission settings
💡 Strategy Philosophy
This strategy is built on the principle of confluence trading - waiting for multiple independent indicators to align before taking a position. By requiring three SuperTrend indicators AND RSI confirmation, the strategy filters out the majority of low-probability setups.
The multi-timeframe SuperTrend approach ensures that short-term, medium-term, and longer-term trends are all in agreement, which typically occurs during strong, sustainable price moves.
The exit strategy is equally important, using both trend-following logic (SuperTrend changes) and mean-reversion logic (Fibonacci BB touches) to adapt to different market conditions.
📊 Best Use Cases
Trending Markets: Works best in markets with clear directional bias
Higher Timeframes: Designed for 15-minute to daily charts
Volatile Assets: SuperTrend indicators excel in assets with clear trends
Swing Trading: Hold times typically range from hours to days
⚠️ Important Notes
No Repainting: All signals are confirmed and will not change on historical bars
One Signal Per Setup: The strategy prevents duplicate signals on consecutive bars
Exit Protection: Always exits before potentially taking an opposite position
Visual Clarity: All three SuperTrend lines are visible simultaneously for transparency
🎯 Recommended Settings
While default parameters are optimized for general use, consider:
Crypto/Volatile Markets: May benefit from slightly higher multipliers
Forex: Default settings work well for major pairs
Stocks: Consider longer BB periods (250-300) for daily charts
Lower Timeframes: Reduce all periods proportionally for scalping
📝 Alerts
Built-in alert conditions for:
BUY signal triggered
SELL signal triggered
EXIT signal triggered
Set up notifications to never miss a trade opportunity!
Disclaimer: This strategy is for educational and informational purposes only. Past performance does not guarantee future results. Always backtest thoroughly and practice proper risk management before live trading.

Key-Levels - D/W/M High-Low + Fib + MA🧭 Key-Levels – D/W/M High-Low + Fibonacci + Moving Averages
A complete multi-timeframe analysis toolkit that combines Daily, Weekly, and Monthly high/low levels, Fibonacci retracements, and customizable moving averages — all in one clean, efficient display.
Ideal for traders who want to identify key reaction zones, retracement levels, and trend alignment across multiple timeframes.
🔹 Features
1. Prior High/Low Levels
Plots Daily (PDH/PDL), Weekly (PWH/PWL), and Monthly (PMH/PML) key levels
Adjustable colors, styles (Solid / Dashed / Dotted), and line widths
Optional midline display for each timeframe
Displays live labels with price values and % difference from current close
Extend lines rightward to project future price interactions
2. Fibonacci Retracement
Auto-detects swing highs/lows using configurable pivot lengths
Smart pivot logic prioritizes major swings based on % span
Auto-orients retracements depending on trend direction
Customizable visibility and color for each Fibonacci level
Supports 0.236 → 1.618 levels, with optional auto-extension in uptrend scenarios
Displays ratio + price for each level label
3. Pivot Labels
Optionally show pivot high/low labels with customizable text and background colors
Independent control of left/right length and label style
4. Moving Averages
Up to three customizable MAs (default: 8 EMA, 21 EMA, 50 SMA)
Choose between EMA or SMA for each
Toggle individual or all moving averages
Adjustable lengths, colors, and line widths
5. Alerts
Built-in alert condition for price crossing a user-defined level
Clean alert message format with ticker symbol and live price
⚙️ Customization
Flexible style controls for lines, labels, and colors
Adjustable right-extension length for projecting levels
Font size and visibility toggles for all elements
Smart grouping for intuitive settings management
📈 Ideal For
Identifying key reversal or breakout zones
Spotting Fibonacci confluence between retracements and prior highs/lows
Tracking trend structure via multi-timeframe MAs
Swing traders, intraday traders, and technical analysts
💡 Summary
Key-Levels – D/W/M High-Low + Fib + MA is a professional-grade indicator designed to simplify complex multi-timeframe analysis.
It helps you see the bigger picture, find actionable zones, and trade with confidence.
🧩 Compatible with any market and timeframe.

Auto Fib Extension Targets A-B-C MartenBGAuto Fib Extension Targets A-B-C is a Pine v6 indicator that projects Fibonacci extension targets from the most recent validated A-B-C swing. It works in both directions and is designed for trend continuation planning and take-profit placement.
How it works:
Detects pivots with user-defined left and right bars.
Builds bullish swings from L-H-L and bearish swings from H-L-H.
Validates C by a retracement filter (min to max, relative to AB) and an optional HL or LH condition.
Projects targets from point C using C + r*(B − A) for uptrends and C − r*(A − B) for downtrends.
Draws levels 1.000, 1.272, 1.382, 1.618, optional 2.000, plus an optional 1.272-1.382 target zone.
Optionally shows dotted A-B and B-C segments for quick visual context.
Key settings:
Pivot sensitivity: leftBars and rightBars.
Correction validation: minRetr and maxRetr, HL or LH requirement toggle.
Level visibility: enable or disable each ratio and the target zone.
Extension length: horizontal extension in bars.
Visuals: toggle A-B-C segment display.
Why use it:
Fast projection of realistic continuation targets.
Clear confluence when extensions align with prior highs, liquidity pools, or S/R.
Works on any symbol and timeframe once pivots are confirmed.
Notes:
Pivots confirm after rightBars bars, so targets appear only once a swing is confirmed. This reduces repaint-like behavior typical for unfinished pivots.
No alerts are included by design. If you want alerts or manual A-B-C locking and click-to-select anchors, ask and I will add them.

Validated Order Blocks with Fib LevelsThis indicator automatically identifies and displays Smart Money Concepts (SMC) order blocks based on market structure breaks:
How it works:
Bearish Order Blocks (Red): Marks the last bullish candle before a swing high. The OB becomes valid when price breaks below the previous swing low, indicating institutional selling zones. Drawn from the candle's close (body top) to its low (bottom wick).
Bullish Order Blocks (Green): Marks the last bearish candle before a swing low. The OB becomes valid when price breaks above the previous swing high, indicating institutional buying zones. Drawn from the candle's high (top wick) to its close (body bottom).
Features:
Three Fibonacci retracement levels (50%, 75%, 100%) for each order block
Fib 100% faces downward on bearish OBs and upward on bullish OBs
Auto-validation: OBs are removed when price closes through them
Customizable: Adjustable swing detection, timeframe selection, and OB display limits
Optional Break of Structure (BOS) markers to show when OBs activate
Works on any timeframe with HTF analysis support
Perfect for identifying key institutional support/resistance zones and potential reversal areas.

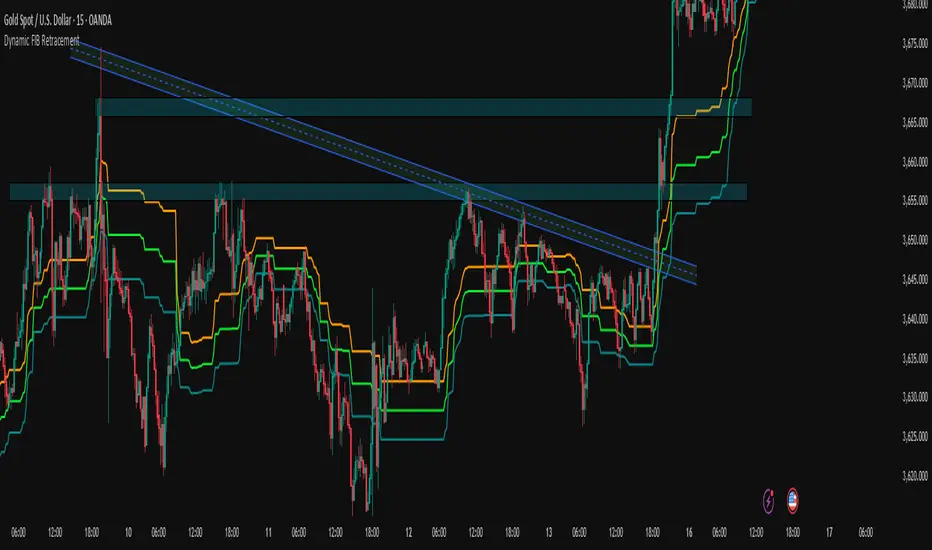
Dynamic FIB Retracement Dynamic FIB Retracement.
Description:
This indicator automatically plots dynamic Fibonacci retracement levels (0.382, 0.5, 0.618) based on the highest high and lowest low of the selected lookback period on the current timeframe. It also provides Buy Above / Sell Below signals at the 0.5 Fibonacci level with trend confirmation, making it easier to spot high-probability trade setups.
Key Features:
Dynamic Fibonacci Levels – Automatically calculates 0.382, 0.5, and 0.618 retracements based on recent price action.
Trend Filter Confirmation – Signals only trigger in the direction of the trend using an EMA-based trend filter (user-adjustable).
Customizable Lookback – Choose how many bars the script should use to detect the high and low for Fibonacci levels.
Visual Alerts – Signals are displayed directly on the chart with triangles, and alerts can be configured for both Buy and Sell events.
Easy to Use – Works on any timeframe and updates automatically as price moves.
Inputs:
Lookback Bars: Determines the number of bars to calculate high and low for Fibonacci levels.
EMA Length: Sets the period for EMA used in trend filtering signals.
Use Cases:
Identify potential retracement zones for entries and exits.
Filter trades in the direction of the trend for higher accuracy.
Quick visualization of key Fibonacci levels for swing or intraday trading.
How to Use:
Apply the indicator to your chart.
Adjust the lookback period and EMA length to match your trading style.
Watch for Buy Above / Sell Below signals near the 0.5 Fibonacci level aligned with the trend.
Optionally, set alerts for automatic notifications when signals occur.
Previous Week High/Low Fib Levelsautomatic fib with previous week high and low with custom retracement input

BE-Fib Channel 2 Sided Trading█ Overview:
"BE-Fib Channel 2 Sided Trading" indicator is built with the thought of 2 profound setups named "Cup & Handle (C&H)" and "Fibonacci Channel Trading (FCT)" with the context of "day trading" or with a minimum holding period.
█ Similarities, Day Trading Context & Error Patterns:
While the known fact is that both C&H and FCT provide setups with lesser risk with bigger returns, they both share the similar "Base Pattern".
Note: Inverse of the above Image shall switch the setups between long vs short.
Since the indicator is designed for smaller time-frame candles, there may be instances where the "base pattern" does not visually resemble a Cup & Handle (C&H) pattern. However, patterns are validated using pivot points. The points labeled "A" and "C" can be equal or slightly slanted. Settings of the Indicator allows traders a flexibility to control the angle of these points to spot the strategies according to set conditions. Therefore, understanding the nuances of these patterns is crucial for effective decision-making.
█ 2 Sided Edge: FCT suggests to take trade closer to the yellow line to get better RR ratio. this leaves a small chance of doubt as to; what if price is intended to break the Yellow line thereby activating the C&H.
Wait for the confirmation is a Big FOMO with a compromised RR.
Hence, This indicator is designed to handle both the patterns based on the strength, FIFO and pattern occurring delay.
█ How to Use this Indicator:
Step 1: Enable the Show Sample Sensitivity option to understand the angle of yellow line shown in the sample image. By enabling this option, On the last bar you shall see 4 lines being plotted depicting the max angle which is acceptable for both long and short trades.
Note: Angle can be controlled via setting "Sensitivity".
Higher Sensitivity --> Higher Setup identification --> can lead to failed setups due to 2 sided trading.
Lower Sensitivity --> Lower Setup identification --> can increase the changes of being right.
Step 2: Adjust the look back & look forward periods which shall be used for identifying patterns.
Note: Smaller values can lead to more setups being identified but can hamper the performance of the indicator while increasing the chances of failures. larger values identifies more significant setup but leads to more waiting period thereby compromising on the RR.
Step 3: Adjust the Base Range.
Note: Smaller values can lead to more setups being identified but can hamper the performance of the indicator while increasing the chances of failures. larger values identifies more significant setup but leads to more Risk on play.
Step 4: set the Entry level for FCT & Set the SL for Both FCT & C&H and Target Reward ratio for C&H.
█ Features of Indicator & How it works:
1. Patterns are being identified using Pivot Points method.
2. Tracks & validates both the setups simultaneously on every candle and traded one at a time based on FIFO, New setups found in-between, Defined Entry Levels while on wait for the other pattern to get activated.
3. Alerts added for trade events.
4. FCT setups are generally traded with trailed SL level and increasing Target level on every completed bar. while C&H has the standard SL & TP level with no Trail SL option.
DISCLAIMER: No sharing, copying, reselling, modifying, or any other forms of use are authorized for our documents, script / strategy, and the information published with them. This informational planning script / strategy is strictly for individual use and educational purposes only. This is not financial or investment advice. Investments are always made at your own risk and are based on your personal judgement. I am not responsible for any losses you may incur. Please invest wisely.
Happy to receive suggestions and feedback in order to improve the performance of the indicator better.

BIST/TL_RSI+MA+FibThis indicator combines RSI, Moving Averages, ATR-based volatility bands, and Fibonacci levels into a powerful multi-strategy scanner.
Features:
Selectable combinations: RSI, MA, ATR, or mixed conditions (RSI+ATR, MA+RSI, RSI under 50, RSI < Fib 0.5, etc.)
Customizable Moving Averages (EMA, SMA, WMA, VWMA, TEMA, etc.)
ATR bands for dynamic volatility-based support/resistance zones
RSI with Fibonacci retracements for confluence signals
Multiple timeframe & screening group selection
Use this tool to spot momentum shifts, volatility breakouts, and Fibonacci-based RSI reversals across BIST stocks or your own custom list.

Prev RTH FibsThis study captures the previous day’s Regular Trading Hours (RTH) range (default 09:30–16:00 America/New_York), then projects it onto the current session. It draws HIGH, LOW, and an optional 50% midpoint, plus a configurable set of inside fib-style percentages measured from the HIGH downward. Every level extends a short distance to the right of the current price and shows a clean numeric label (no box) on the right edge.
Key features
Prev-day RTH range tracked automatically; plotted each new session.
Inside levels (from HIGH ↓): 11%, 25%, 29.5%, 38.2%, 45%, 55%, 62% (OTE), 70.5%, 75%, 78.6%, 85% (toggle any on/off).
Clean right-side labels: numbers only, resizable (Tiny → Huge) with transparent background.
Line styling: HIGH/LOW and 50% are solid; inside levels can be Solid/Dashed/Dotted with independent color/width.
Smart right padding: lines/labels extend a few bars past the latest candle, so annotations stay beside price without violating TradingView’s “>500 bars in future” rule.
Works on any symbol/timeframe; RTH window and timezone are adjustable.
Inputs you control
Session: RTH session string and timezone.
Right-side padding (bars) and number size.
Visibility & style for HIGH, LOW, and 50%.
Which inside levels to show, plus their style/color/width.

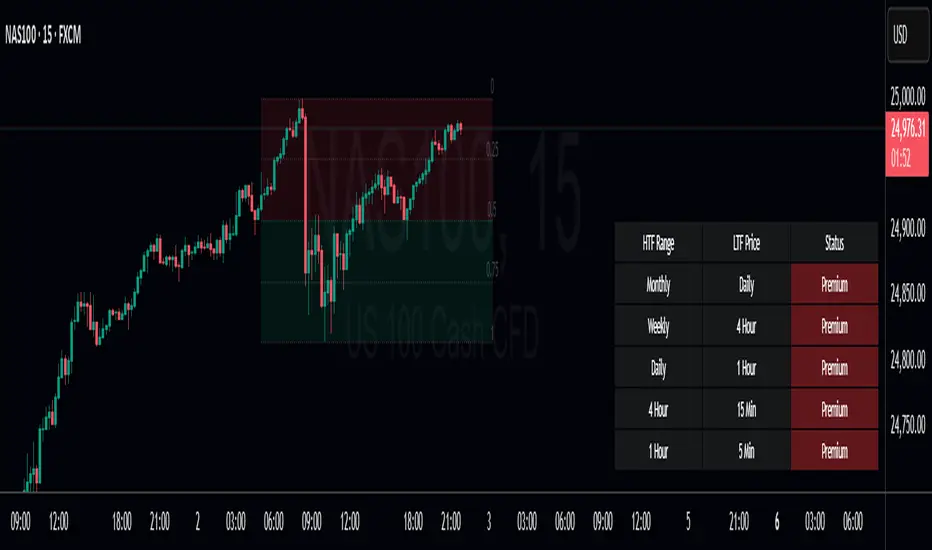
HTF Dealing Range & FibsKey Features:
Premium & Discount Zone Visualization: Clear, color-coded boxes are drawn to represent the Premium (sell zone), Discount (buy zone), and the crucial Equilibrium (50%) level. These boxes extend into the future so you can anticipate future price action.
Customizable Fibonacci Levels: Plot key Fibonacci retracement levels within the defined range. You can customize which levels you want to see (e.g., 0.62, 0.79, etc.) to pinpoint specific points of interest.
Multi-Timeframe Confluence Table: A powerful, on-screen dashboard that shows you the status of the current price relative to the P&D zones on up to 5 different timeframes simultaneously. Instantly see if the price is in a Premium or Discount zone on the 15m, 1H, 4H, and Daily charts at a single glance.
Built-in Alerts: Never miss an opportunity. Set up alerts to be notified the moment the price enters the Premium or Discount zone on your chosen HTF, allowing you to prepare for potential trade setups.
Fully Customizable: Take full control over the indicator's appearance. Adjust pivot lookback periods, colors of the zones and Fibs, and select which timeframes appear in your dashboard to match your personal trading plan.
Disclaimer:
This indicator is provided for educational and informational purposes only and should not be considered as financial or investment advice. Trading and investing in financial markets, including but not limited to stocks, forex, and cryptocurrencies, involves a substantial risk of loss and is not suitable for every investor.

Premium Discount Range ProPremium Discount Range Pro
Short Description / Summary:
An advanced, all-in-one toolkit for traders who utilize Smart Money Concepts (SMC) and institutional price action analysis. The "Premium Discount Range Pro" automatically identifies the current higher timeframe (HTF) dealing range, visualizes the Premium, Discount, and Equilibrium zones, and provides a multi-timeframe dashboard to see where the current price stands across the market.
This indicator is built to streamline your analysis, helping you to quickly identify high-probability areas for entries by adhering to the core institutional principle: look for buys in a discount and sells in a premium.
Key Features:
Automatic HTF Range Detection: The indicator automatically detects the most recent significant swing high and swing low on your chosen Higher Timeframe (e.g., 4H, Daily) to define the current dealing range.
Premium & Discount Zone Visualization: Clear, color-coded boxes are drawn to represent the Premium (sell zone), Discount (buy zone), and the crucial Equilibrium (50%) level. These boxes extend into the future so you can anticipate future price action.
Customizable Fibonacci Levels: Plot key Fibonacci retracement levels within the defined range. You can customize which levels you want to see (e.g., 0.62, 0.79, etc.) to pinpoint specific points of interest.
Multi-Timeframe Confluence Table: A powerful, on-screen dashboard that shows you the status of the current price relative to the P&D zones on up to 5 different timeframes simultaneously. Instantly see if the price is in a Premium or Discount zone on the 15m, 1H, 4H, and Daily charts at a single glance.
Built-in Alerts: Never miss an opportunity. Set up alerts to be notified the moment the price enters the Premium or Discount zone on your chosen HTF, allowing you to prepare for potential trade setups.
Fully Customizable: Take full control over the indicator's appearance. Adjust pivot lookback periods, colors of the zones and Fibs, and select which timeframes appear in your dashboard to match your personal trading plan.
Disclaimer
This indicator is provided for educational and informational purposes only and should not be considered as financial or investment advice. Trading and investing in financial markets, including but not limited to stocks, forex, and cryptocurrencies, involves a substantial risk of loss and is not suitable for every investor.
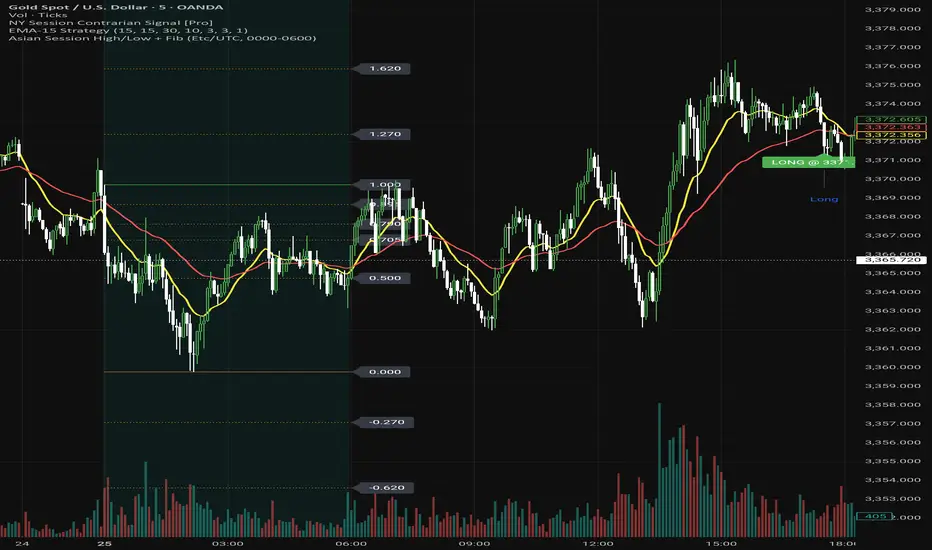
Asian Session High/Low + FibThis is a indicator for only Asian season plus FIB it works only Asian season so you apply and enjoy indicator
TP/SL Dynamic (FIB,ATR,MULTIPLE,PERCENT)TP/SL Dynamic (FIB, ATR, MULTIPLE, PERCENT)
This indicator provides a flexible framework for managing Take Profit (TP) and Stop Loss (SL) levels using multiple calculation schemes. It is designed for traders who want dynamic or rule-based levels that adapt to volatility, market type, and custom input.
The script supports four TP/SL methodologies:
Pro Standards (Auto-Select): Adapts method based on asset type and volatility.
R Multiples: Risk-based reward multiples from ATR-derived stop distance.
Fibonacci R: Fibonacci extension levels projected from recent pivots.
Percent: Fixed percentage distance from entry, adjusted by volatility.
ATR Multiples: ATR-based calculations with configurable multipliers.
Features:
Up to 3 manual entries, each with configurable time, price, and position size.
Weighted entry price calculation across multiple positions.
Single or multiple TP targets (up to 4) with automatic scaling.
Dynamic ATR option: updates SL/TP levels with live volatility or fixes them at entry.
Pivot-based logic for Fibonacci extensions.
Symbol Locking to prevent mismatches between intended pair and chart symbol.
Table display with optional R-multiples, TP/SL values, and entry details.
Visual chart elements: lines, labels, price-scale markers for SL/TP, and zebra-style info tables.
Entry markers (E1, E2, E3) for clarity.
Alerts for TP and SL triggers (both long and short).
How to Use:
Define entry prices, times, and position sizes (up to 3 entries).
Select a TP method (Pro Standards, R Multiples, Fibonacci R, Percent, or ATR Multiples).
Choose single or multiple TP mode.
Optionally enable Dynamic ATR to update levels in real time.
Check the on-chart table for all calculated levels and alerts.
Author & Credit:
Developed from the ground up by me (no external code used outside The Pine public library).
AI Fib Strategy (Full Trade Plan)This indicator automatically plots Fibonacci retracements and a Golden Zone box (61.8%–65% retracement) based on the 4H candle body high/low.
Features:
Auto-detects session breaks or daily breaks (configurable).
Draws standard Fib retracement levels (0%, 23.6%, 38.2%, 50%, 61.8%, 78.6%, 100%).
Highlights the Golden Zone for high-probability trade entries.
Optional Take Profit extensions (TP1, TP2, TP3).
Fully compatible with Pine Script v6.
Usage:
Best applied on intraday charts (15m, 30m, 1H).
Use the Golden Zone for entry confirmations.
Combine with candlestick patterns, order blocks, or volume for stronger signals.

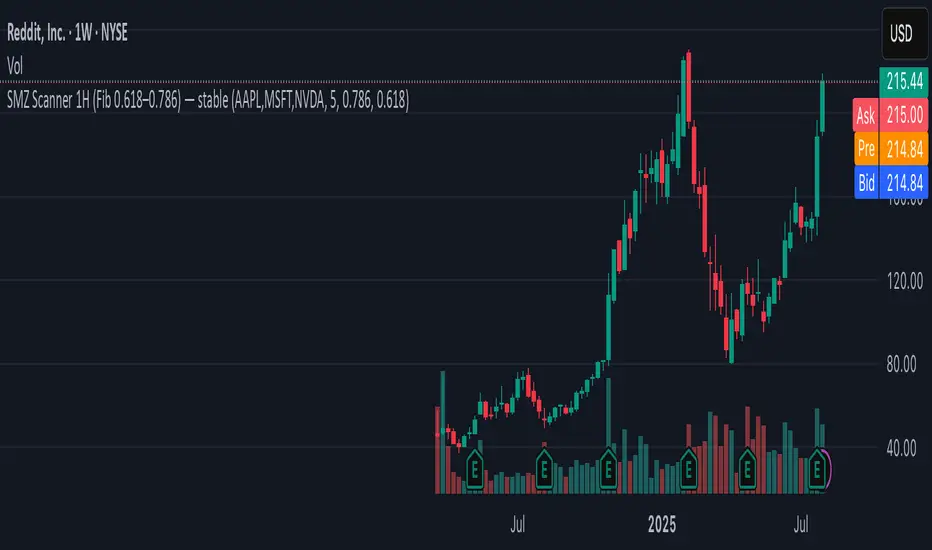
SMZ Scanner 1H (Fib 0.618–0.786) — stableQuickly spot when your watchlist tickers enter high-probability Smart Money Zones. This scanner checks up to 40 symbols on 1-hour candles, using the 0.618–0.786 Fibonacci retracement of the latest impulse leg (based on swing highs/lows).
What it does:
• Scans your custom list of tickers (up to 40 at once).
• Identifies fresh bullish or bearish impulses.
• Marks when price enters the key Fib retracement zone.
• Sends one clean alert per bar with all tickers that just hit.
Perfect for:
Swing traders and intraday traders tracking Smart Money Zone re-entries without flipping through dozens of charts.