ICT Base Candle with Volume Filter📘 ICT BASE CANDLE WITH VOLUME FILTER
Institutional Base Candle Detection System
Smart Money Concepts (SMC/ICT)
🔍 What This Indicator Does
ICT Base Candle with Volume Filter automatically detects institutional Base Candles—also known as pause candles, decision candles, compression candles, or repricing pauses.
These candles often appear at key algorithmic points:
After a displacement
After a liquidity sweep
Before a fair value gap reaction
Inside an Order Block (OB)
At premium/discount zones
Before large expansions
This tool highlights these candles using:
✔ Body-percentage filtering
✔ Optional volume-based filtering
✔ Bullish/Bearish color coding
✔ Optional labels (+ / –)
✔ Accurate fixed historical plotting
✔ Customizable settings
This makes it extremely useful for SMC, ICT, and algorithmic orderflow traders.
🎯 Why Base Candles Matter (SMC/ICT Context)
The market moves in an algorithmic sequence:
Liquidity Sweep (grab stops above/below)
Displacement (strong impulse candle)
Base Candle (pause candle before continuation)
Expansion / Reversal
Base candles indicate:
Loss of momentum
Repricing
Order absorption (buy/sell programs)
Potential mitigation zones
Possible entry (continuation)
Possible reversal (if sweep + base + displacement)
They act as footprints of algorithmic activity, confirming where smart money is momentarily active.
🎨 Indicator Features
✔ Customizable Base Candle Colors
Choose unique colors for bullish and bearish base candles.
Option to use the same color for both.
✔ Volume Filter
Enable/disable volume filtering
Adjust lookback and threshold values.
✔ Label Toggles
Display “+” above bullish base candles
Display “–” below bearish base candles
✔ Fixed Historical Markers
All detected base candles remain consistent as bars update.
✔ Tooltip-Enhanced Inputs
Includes advanced trading notes inside input tooltips.
📈 How to Use (Practical Guide)
1️⃣ Identify the Impulse
Look for strong displacement or impulsive candles.
2️⃣ Locate the Base Candle
A small-body candle directly following a displacement.
3️⃣ Validate With Volume (Optional)
Low volume confirms a pause in the algorithm's movement.
4️⃣ Use It With SMC Tools
Base candles work best when aligned with:
FVGs
Order Blocks
BOS / CHoCH
Liquidity sweeps
Premium/discount equilibrium
5️⃣ Entry Model (Example)
Continuation Model:
Displacement
Base Candle forms (small body)
Enter on break of base candle
SL beyond candle wick
TP at liquidity / FVG end
📌 Example Explanation
A bullish impulse appears → price pauses → forms a bullish base candle → FVG below → price mitigates → resumes trend.
This indicator marks the base candle and helps you visualize where the algorithm slowed down before continuing the move.
🚫 Limitations & Notes
This is not a buy/sell signal indicator
It highlights context, not trades
Must be combined with structure & liquidity analysis
Volume filter is optional and should be tested per asset
🔒 Invite-Only Access (If Applicable)
If published as Invite-Only, include this:
Access is manually approved
Redistribution is not allowed
Do not share access publicly
Contact the author to request access
Unauthorized reselling is strictly prohibited
🏁 Final Notes
This indicator is designed for traders who understand:
Smart Money Concepts
Institutional orderflow
Liquidity models
Algorithmic ranges
Candle behavior within displacement
Use it as part of a full trading framework—not as a standalone signal.
📜 Credits
Created by: Manish Kumar Gupta / ask2maniish
Inspired by ICT / SMC price delivery concepts
Search in scripts for "fvg"

Fabio-Style Order Flow SystemFabio-Style Order Flow System — LVN • Delta • Big Trades • FVG • Order Blocks • Liquidity • Volume Profile
This indicator brings together all major components of Fabio Valentino’s order-flow strategy in one unified tool. It visualizes where smart money is active, where inefficiencies form, and where price is likely to react next.
🔍 FEATURES
1. Order Flow & Delta
Smoothed delta to show true market imbalance
Background color shifts to bullish/bearish delta dominance
Alerts for delta spikes & order-flow flips
2. Big Trade Detection
Highlights Big Buy and Big Sell prints (relative to average volume)
Helps identify institutional aggression on both sides
3. Low Volume Nodes (LVNs)
Automatically detects low-volume zones
Flags retests of LVNs for high-probability reactions
Uses dynamic volume thresholds for accuracy
4. Volume Profile (Lightweight)
Bucket-based intrabar profile across user-defined lookback
Highlights volume distribution without heavy TradingView CPU load
Auto-scales bucket density & transparency
5. Fair Value Gaps (FVGs)
Detects both bullish & bearish three-bar imbalances
Marks gaps visually using colored boxes
Updates dynamically with a user-set lookback
6. Order Blocks (OBs)
Identifies valid displacement bars and their origin OB
Plots clean, minimalist rectangles around key OB zones
Uses ATR-based impulse filtering
7. Liquidity Grabs
Detects wick-based liquidity sweeps
Highlights both equal high/low and stop-run type wicks
Useful for spotting reversals & trap setups
8. Strategy Dashboard
Shows real-time order flow state
Displays delta strength, big trades, LVNs, and last directional impulse
Auto-positions in all corners
🎯 PERFECT FOR
Traders who use:
Order Flow
Smart Money Concepts (SMC)
ICT / FVG / Liquidity models
Market Structure + Volume
Fabio Valentino-style analysis
⚙️ PERFORMANCE
All elements optimized
Uses automatic box-clearing to avoid array overload
Works on all timeframes & markets (crypto, FX, indices, stocks)

Vietnamese Stock: Discount Linear Regression Liquidity GrabThe Discount Linear Regression Liquidity Grab is a sophisticated technical analysis tool that combines statistical trend analysis with Premium/Discount Zone and Price Action logic. Unlike standard Linear Regression Channels that repaint or stretch indefinitely, this indicator is dynamic: it automatically detects volatility breakouts to "reset" the channel, creating distinct market "Sections."
This tool is designed to help traders identify trend exhaustion, fair value gaps (FVGs), and high-probability reversal or continuation zones using two distinct built-in strategies.
Key Features
1. Dynamic Channel Resets
The core engine calculates a Linear Regression Channel based on a Pearson R coefficient and Deviation multipliers.
- How it works: When price breaks out of the Upper or Lower Deviation bands, the script recognizes a shift in momentum. It "locks" the previous channel and begins calculating a new one from the breakout point.
- Benefit: This creates a historical map of market structure, showing you exactly where previous trends began and ended.
2. Smart Money Concepts (SMC) Integration
For every completed section (channel), the indicator automatically highlights:
Highest High & Lowest Low Boxes: Identifies the structural range of the previous move.
- Gaps & FVGs: Automatically draws boxes for Fair Value Gaps and Price Gaps within the channel, acting as potential magnets for price.
3. The Discount Zone (New Feature)
The indicator projects a Discount Area (Red Box) from the previous section's midline down to its lowest low.
- Logic: This box represents the "Discount" pricing relative to the previous move.
- Behavior: The box extends to the right until price successfully "grabs liquidity" (closes below the midline/red line). Once the grab occurs, the box stops extending, marking that the liquidity event is complete.
Built-In Strategies
This indicator includes two automated strategy signals based on the interaction between current price and historical sections.
Strategy 1: Breakout & Retest (Trend Continuation)
This strategy looks for a classic resistance-turned-support setup.
- Breakout: Price closes above the Highest High of a previous section (Triangle Up).
- Retest: Price pulls back and closes at or below that breakout level (Triangle Down).
- Confirmation: Price breaks above the high of the initial breakout candle (Green Background).
Strategy 2: Midline Reclaim (Mean Reversion / Discount Buy)
This strategy focuses on buying from the "Discount" zone.
- Liquidity Grab: Price drops below the Midline (Red Line) of a previous section, entering the Discount Zone.
- Reclaim: Price closes back above the Midline, signaling that the dip was bought up.
Signal: A Diamond shape and Teal Background appear.
How to Use
- Trend Trading: Use the Dynamic Channels to visualize the current slope. If the channel is angling up, look for long setups.
- Confluence: Use the Discount Zones and FVG boxes as areas of interest. If price enters a Red Discount Box and forms a reversal pattern, it is a high-probability entry.
- Stop Loss Placement: The Lowest Low boxes of previous sections serve as excellent invalidation points for long positions.
Alerts
The indicator comes with pre-configured alerts for:
- Strategy 1 Confirmation.
- Strategy 2 Midline Reclaim.
- New Channel Formation (Trend Reset).
- Liquidity Grab Events.

Casper 5min candle v0.6--------------------------------------------
Description
--------------------------------------------
This is an indicator showing trade ideas and alerts based on
5minute Candle breakout strategy according to www.youtube.com
BASIC FUNCTIONS
- it draws 5 min Range (default 9:30 NY time at Stock market open)
- detects breakout of range with fvg_tap_wait
- wait for tapping FVG
- waits for entry confirmation
- it has sets of alerts (FVG creation, FVG tapping and Entry confirmation)

SMC & ICTSMC & ICT Concepts
Key Features:
• Real-time Market Structure: MSS (Market Structure Shift), BOS, CHOCH with labels
• Order Blocks (Bullish & Bearish) – auto-mitigation & breaker detection
• Fair Value Gaps (FVG), Implied FVG, Balance Price Range (BPR)
• Liquidity Grabs (Buyside/Sellside pools from equal highs/lows)
• Volume Imbalance (VI) detection
• Displacement candles
• Killzones: New York, London Open/Close, Asian session background highlight
• NWOG (New Week Opening Gap) & NDOG (New Day Opening Gap)
• Automatic Fibonacci Retracement & Extension between latest FVG, OB, Liquidity, or VI
• Two display modes:
→ Present Mode: Shows only recent & relevant structures (clean chart – recommended for live trading)
→ Historical Mode: Shows full structure history
Perfect confluence tool for scalping, day trading, and swing trading.

Smart Money Decoded [GOLD]Title: Smart Money Decoded
Description:
Introduction
Smart Money Decoded is a comprehensive, institutional-grade visualization suite designed to simplify the complex world of Smart Money Concepts (SMC). While many indicators flood the chart with noise, this tool focuses on clarity, precision, and high-probability structure.
This script is built for traders who follow the "Inner Circle Trader" (ICT) methodologies but struggle to identify valid Zones, Displacement, and Liquidity Sweeps in real-time.
💎 Key Features & Logic
1. Refined Market Structure (BOS & CHoCH)
Instead of marking every minor pivot, this script uses a filtered Swing High/Low detection system.
HH/LL/LH/HL Labels: Only significant structure points are mapped.
BOS (Break of Structure): Marks trend continuations in the direction of the bias.
CHoCH (Change of Character): Marks potential trend reversals.
2. Advanced Order Blocks (with "Strict Mode")
Not all down-candles before an up-move are Order Blocks. This script separates the weak from the strong.
Standard OBs: Visualized with standard transparency.
⚡ SWEEP OBs (High Probability): Order Blocks that explicitly swept liquidity (Stop Hunt) before the reversal are highlighted with a thicker border, brighter color, and a ⚡ symbol. These are your high-probability "Turtle Soup" entries.
Strict Mode Toggle: In the settings, you can choose to hide all weak OBs and only see the ones that swept liquidity.
3. Dynamic Breaker Blocks
A true ICT Breaker is a failed Order Block that trapped liquidity.
This script automatically detects when a valid OB is mitigated (broken through) and projects it forward as a Breaker Block.
This ensures you are trading off valid flipped zones (Support becomes Resistance, Resistance becomes Support).
4. Fair Value Gaps (FVG)
Automatically detects Imbalances (Imbalance/Inefficiency).
Includes an ATR Filter to ignore tiny, insignificant gaps, keeping your chart clean.
Option to show the Consequent Encroachment (50% CE) level for precision entries.
5. Liquidity Zones (BSL / SSL)
Automatically plots Buy Side Liquidity (BSL) and Sell Side Liquidity (SSL) at key swing points.
Once price sweeps these levels, the zone is removed or marked as "Swept," helping you identify when the draw on liquidity has been met.
6. Institutional Data Panel
A dashboard in the top right corner displays:
Market Bias: Bullish/Bearish/Neutral based on structure.
Premium/Discount: Tells you if price is in the expensive (Premium) or cheap (Discount) part of the current dealing range.
Active Zones: Counts of current open arrays.
⚙️ How To Use This Indicator
Identify Bias: Look at the Structure Labels (HH/LL) and the Panel. Are we making Higher Highs?
Wait for the Trap: Look for a Liquidity Sweep (BSL/SSL taken) or a ⚡ Sweep OB.
Entry Confirmation: Watch for a return to a Fair Value Gap (FVG) or a retest of a Breaker Block (BRK).
Manage Risk: Use the visuals to place stops above/below invalidation points.
Customization:
Go to the settings to toggle "Strict Mode" for Order Blocks, change colors to match your theme, or adjust the lookback periods to fit your specific asset (Forex, Crypto, or Indices).
📚 Credits & Acknowledgments
This script is an educational tool based on the public teachings of Michael J. Huddleston (The Inner Circle Trader - ICT).
Concepts used: Order Blocks, Breakers, FVGs, Market Structure, Liquidity Pools.
Credit is fully given to ICT for originating these concepts and sharing them with the world.
⚠️ Disclaimer
This script is NOT affiliated with, endorsed by, or connected to Michael J. Huddleston (ICT) in any way. It is an independent coding project intended for educational purposes and visual assistance.
Trading involves substantial risk. This indicator does not guarantee profits. Always use proper risk management. Trust your analysis first, and use indicators as confluence.
#Smart Money Concepts, #SMC, #ICT,#Liquidity, #Market Structure, #Trend, #Price Action.

Gold Magic 1. Watch for the Icon
When you see the 💰 icon appear above or below the Bollinger Bands, it’s your first signal.
• An icon above the upper band means price has broken out to the upside.
• An icon below the lower band means price has broken out to the downside.
2. Wait for the Fair Value Gap
After the icon appears, the indicator will highlight the first Fair Value Gap (FVG) that forms.
• The FVG will show you exactly where a potential entry point is.
• It will also mark the suggested stop-loss level on the chart.
3. Prepare to Enter the Market
With the FVG and stop-loss levels in place, you have a clear idea of where to buy or sell and where to place your stop.
• This makes it easier to enter the market with confidence.

Smart Money Concepts [Riz]Smart Money Concepts is a comprehensive technical analysis tool for identifying institutional trading patterns and market structure. This indicator combines Smart Money Concepts (SMC), ICT methodology, and Wyckoff principles into one professional tool.
✨ KEY FEATURES
📊 VOLUMETRIC ORDER BLOCKS
• Visual representation of supply/demand zones with volume distribution
• Horizontal volume bars showing buy/sell composition inside each Order Block
• Automatic mitigation tracking
• Breaker Block detection (invalidated OBs acting as reversal zones)
• Strength rating system: ★ Weak, ★★ Medium, ★★★ Strong
• ATR-based size filtering to show only significant zones
📈 MARKET STRUCTURE DETECTION
• Break of Structure (BOS) and Change of Character (CHoCH) identification
• Higher Highs (HH), Higher Lows (HL), Lower Highs (LH), Lower Lows (LL) labels
• Internal structure pivots (iH/iL) for intraday analysis
• Auto-adjusting swing length based on timeframe
• Configurable confirmation methods (Close vs Wick-based)
💎 FAIR VALUE GAPS (FVG)
• Automatic detection of bullish and bearish imbalances
• Configurable mitigation percentage (default 50%)
• Visual tracking until gaps are filled
• Separate color schemes for clarity
💧 LIQUIDITY ANALYSIS
• Buy Side Liquidity (BSL) identification at swing highs
• Sell Side Liquidity (SSL) identification at swing lows
• Automatic sweep detection with visual confirmation
• Real-time alerts when liquidity is taken
⚖️ PREMIUM & DISCOUNT ZONES
• Dynamic range calculation based on configurable lookback period
• Equilibrium (EQ) level identification
• Previous Day High (PDH) and Previous Day Low (PDL) levels
• Helps identify favorable entry zones
📊 REAL-TIME DASHBOARD
• Live statistics on all detected patterns
• Active Order Blocks and FVGs count
• BOS/CHoCH occurrence tracking
• Liquidity sweep counters
• Recent market activity indicators
• Current trend bias display
• Fully customizable position and size
⚙️ CUSTOMIZATION OPTIONS
All aspects are fully customizable:
• Swing Length (1-50 bars) with auto-adjust for timeframe
• Max Active Order Blocks (10-100)
• Volume bar position (Left/Right) with mirror option
• Volume bar width percentage (10-50%)
• ATR size filter for Order Blocks
• Strength rating method (Touches/Age/Distance/Volume/Combined)
• All colors and transparency levels
• Dashboard position (9 locations available)
• Comprehensive alert system for all events
🎓 HOW IT WORKS
ORDER BLOCKS: Identified at the last candle before a Break of Structure. These represent institutional supply and demand zones. Volume is estimated based on candle characteristics and displayed as horizontal bars.
MARKET STRUCTURE: Tracks pivot highs and lows to determine if price is making Higher Highs/Higher Lows (bullish structure) or Lower Highs/Lower Lows (bearish structure). BOS indicates trend continuation, while CHoCH signals potential trend reversal.
LIQUIDITY: Swing highs represent Buy Side Liquidity where short positions have their stop losses. Swing lows represent Sell Side Liquidity where long positions have stop losses. The indicator tracks when these levels are "swept" by price.
FAIR VALUE GAPS: Three-candle patterns where the current candle's range doesn't overlap with the candle two bars ago, creating price imbalances that often get filled later.
📚 BEST PRACTICES
• Use on all timeframes - Auto-adjust feature optimizes settings automatically
• Look for confluence - Best setups occur when multiple concepts align (e.g., Order Block + liquidity sweep + discount zone)
• Consider risk/reward - Use Premium/Discount zones to identify favorable entry areas
• Respect market context - Order Blocks in the direction of overall trend tend to be more reliable
• Volume matters - Higher volume percentages in the expected direction may indicate stronger zones
⚠️ IMPORTANT NOTES
EDUCATIONAL TOOL: This indicator is designed for analysis and education, not as trading signals or investment advice.
VOLUME ESTIMATION: Buy/sell volume distribution is estimated based on candle characteristics since true buy/sell volume data is not available in Pine Script.
NO GUARANTEES: Past performance is not indicative of future results. All trading involves substantial risk.
RISK MANAGEMENT: Always use proper risk management and seek additional confirmation before making trading decisions.
OBJECT LIMITS: On very fast timeframes (1m, 5m) in highly volatile markets, the indicator may approach Pine Script's 500-object limit. Reduce max OBs/FVGs in settings if needed.
🔧 TECHNICAL SPECIFICATIONS
• Pine Script Version: v6
• Indicator Type: Overlay (displays on price chart)
• Maximum Objects: Optimized to stay within Pine Script limits
• Performance: Efficient rendering with configurable history management
• Updates: Real-time on every bar close
📖 METHODOLOGY
This indicator combines concepts from:
• Inner Circle Trader (ICT) methodology
• Smart Money Concepts (SMC) framework
• Wyckoff market analysis principles
• Order flow and volume spread analysis
⚖️ DISCLAIMER
This indicator is for educational and informational purposes only. It is not financial advice. Trading financial instruments carries substantial risk and may not be suitable for all investors. Past performance is not indicative of future results. Always conduct your own research and consult with a licensed financial advisor before making any investment decisions. The author assumes no responsibility for any losses incurred from using this indicator.

Scalper Pro Pattern Recognition & Price Action📘 Scalper Pro Pattern Recognition & Price Action
Overview
Scalper Pro is a dynamic multi-layer trend recognition and price action strategy that integrates Supertrend, Smart Money Concepts (SMC), and volatility-based risk control.
It adapts to market volatility in real time to enhance entry precision and optimize risk.
⚠️ This script is for educational and research purposes only.
Past performance does not guarantee future results.
🎯 Strategy Objectives
Detect structural market shifts (BOS / CHoCH) automatically.
Identify Order Blocks (OB), Fair Value Gaps (FVG), and key liquidity zones.
Plot dynamic Take-Profit (TP) and Stop-Loss (SL) levels based on ATR.
Avoid low-volatility (sideways) conditions using ADX filtering.
Combine trend-following signals with structural confirmation.
✨ Key Features
Supertrend Entry Signals — Generates precise buy/sell markers based on price crossovers with the Supertrend line.
Order Block Detection — Automatically plots both Internal and Swing Order Blocks for smart money insights.
Fair Value Gap Visualization — Highlights inefficiency zones in bullish or bearish structures.
Market Structure Labels — Marks Break of Structure (BOS) and Change of Character (CHoCH) points for clear trend shifts.
Dynamic Risk Levels — Automatically generates TP/SL lines and price labels using ATR-based distance.
📊 Trading Rules
Long Entry:
• Price crosses above the Supertrend (ta.crossover(close, supertrend))
• ADX above sideways threshold (trend condition confirmed)
• Optional confirmation from a bullish BOS or CHoCH
Short Entry:
• Price crosses below the Supertrend (ta.crossunder(close, supertrend))
• ADX above threshold
• Optional confirmation from a bearish BOS or CHoCH
Exit (or Reverse):
• Opposite Supertrend crossover
• Price hits TP/SL lines
• Trend shift confirmed by internal BOS/CHoCH
💰 Risk Management Parameters
Stop Loss & Take Profit based on ATR × risk multiplier
ATR Length: 14 (default)
Risk %: 3% per trade
Sideways Filter: ADX < 15 → no trade zone
TP1–TP3 = Entry ± (ATR × 1~3)
⚙️ Indicator Settings
Supertrend Module:
ATR Length: 10
Factor: nsensitivity × 7
ADX Module:
ADX Length: 15
Sideways Threshold: 15
EMA Set:
EMA (5, 9, 13, 34, 50) × Volatility Factor (3)
SMA Filter:
SMA(8) & SMA(9) for short-term trend confirmation
Smart Money Concepts Module:
Displays BOS/CHoCH, Order Blocks, FVGs, Equal Highs/Lows, and Premium/Discount zones
🔧 Improvements & Uniqueness
Integrates Supertrend momentum with Smart Money Concepts (SMC) structural analysis.
Dual detection layers: Internal (micro) and Swing (macro) structures.
ATR-driven auto labeling for entry, stop, and profit targets.
Premium/Discount and Equilibrium zones visualized on the chart.
Built-in ADX filter to skip low-trend market conditions.
✅ Summary
Scalper Pro Pattern Recognition & Price Action merges classical trend-following with modern market structure analytics.
It combines momentum detection, volatility control, and smart money mapping into one cohesive framework.
Unified trend, structure, and risk visualization.
Auto-marked BOS/CHoCH, OB, FVG, and liquidity zones.
Usable for scalping, intraday, or swing trading setups.
⚠️ This strategy is based on historical data and designed for educational use only.
Always apply sound risk management and forward testing before live trading.

Sphinx Trade ChecklistSphinx Trade Checklist — Your Rule-Based Trading Companion
Sphinx Trade Checklist is not a price-based indicator — it’s a structured decision-making tool designed to help traders follow a consistent, rule-based approach before entering any trade.
This checklist window guides you through a complete top-down analysis process:
1. Bias (Higher Timeframe) — Daily
Start by identifying the overall market bias. Determine whether price is in premium/discount, note any FVGs/imbalances, and confirm the larger directional context. This prevents impulsive trades and keeps you aligned with the dominant flow.
2. Mid-Term Structure — 4H / 1H
Next, analyze the mid-term structure:
• Key swing points
• Liquidity levels
• OB zones / FVGs
• SMT divergence
This section ensures you understand the structural roadmap that price is currently respecting.
3. Micro Entry — 15m / 5m
Finally, refine your entry on the lower timeframes. Look for your specific confirmations such as:
• Liquidity sweeps
• FVGs
• CHoCH / BOS
• Discount / Premium entries
This is the final step before execution, helping you stay disciplined and avoid weak, emotional trades.
⸻
Why This Tool Matters
Most traders lose not because of strategy but because they skip steps, enter too early, or misread the higher timeframe bias.
Sphinx Trade Checklist keeps your process organized, objective, and consistent — forcing you to confirm each layer of analysis before pressing the button.
Whether you’re a beginner building good habits or an advanced trader wanting more structure, this tool helps you stay crystal-clear on your bias, structure, and entry criteria.

Golden BOS Strategy - ChecklistA clean, mechanical on-chart checklist designed for multi-timeframe traders using the Golden BOS / Institutional Retracement Framework.
This tool helps you stay disciplined by tracking each requirement of the strategy in real time:
Included Criteria
4H Bias: Bullish or bearish macro structure
1H Structure: Push/pull phase + golden zone retracement
5M Entry Model:
Break of Structure (BOS)
5M golden zone retracement
POI validation (OB/FVG/Breaker)
Final micro BOS or rejection confirmation
Risk Filters:
Session validity (London / NY)
Red news avoidance
Stop-loss placement check
Liquidity-based target confirmation
Purpose
This overlay ensures every trade meets strict criteria before execution, removing emotion and improvisation. Ideal for backtesting, forward testing, and staying consistent during live market conditions.
Golden BOS Strategy — Description
The Golden BOS Strategy is a structured, multi-timeframe trading system designed to capture high-probability continuation moves during London and New York sessions. The strategy combines institutional concepts with Fibonacci-based retracements to identify discounted entry zones aligned with higher-timeframe direction.
Using the 4H timeframe, traders establish the daily macro bias and identify the dominant trend. The 1H chart is then used to confirm the current phase of market structure, distinguishing between impulsive “push” moves and corrective “pullback” phases. A Fibonacci retracement is applied to the most recent 1H impulse leg to define a high-value discount or premium zone where entries become valid.
Execution takes place on the 5-minute chart. Once price reaches the 1H golden zone (61.8–78.6%), a Break of Structure (BOS) is required to confirm a shift in short-term momentum. A second Fibonacci retracement is then drawn on the 5M impulse leg that caused the BOS, and price must retrace back into the 5M golden zone. Traders refine their entry using a confluence point of interest (POI) such as a Fair Value Gap (FVG), Order Block, Breaker Block, or Inverse FVG, ideally accompanied by a final micro BOS or rejection candle.
Risk management is strict and rule-driven. Stop loss is placed beyond the extreme wick of the POI, while take-profit targets are set at logical liquidity pools in the direction of the higher-timeframe trend. The strategy avoids red-folder news and only allows trades during active sessions to ensure optimal volatility and reliability.
The Golden BOS Strategy is designed to impose discipline, reduce discretionary errors, and give traders a repeatable, mechanical framework for navigating trending markets with precision.

Trend-S&R-WiP11-15-2025: This new indicator is my 5/15-Min-ORB-Trend-Finder-WiP indicator simplified to only have:
> Market Open
> 5-Min & 15-Min High/Low
> Support/Resistance lines
> Fair Value Gaps (FVGs)
> a Trend Line
> a Trend table
Recommended to be used with my other indicator: Buy-or-Sell-WiP
Strategy:
> I only trade one ticker, SPX, with ODTE CALL/PUT Credit Spreads
> use Break & Retest with 5-Min High/Low or 15-Min High/Low or FVGs
> 📈 Bullish Trend
Trade: PUT Credit Spread
Trend Confirmations:
Trend Line is green
MACD Histogram is green
Price Condition: Nearest resistance 8-10 points above market price
> 📉 Bearish Trend
Trade: CALL Credit Spread
Trend Confirmations:
Trend Line is purple
MACD Histogram is red
Price Condition: Nearest support 8-10 points below market price
> Fair Value Gaps (FVGs)
- Trade anytime during the day using Break & Retest and all indicator confirmations shown above

🎯 Wyckoff Scalping Pro V2🎯 Wyckoff Scalping Pro V2
Short Description:
Advanced Wyckoff methodology combined with order flow, liquidity analysis, and multi-factor scoring system. Professional-grade scalping and day trading tool with 10-point signal strength rating.
Full Description:
Wyckoff Scalping Pro V2 is a comprehensive trading system that combines classical Wyckoff methodology with modern Smart Money Concepts for precision entries in any timeframe.
🎯 What Makes This System Unique?
Unlike basic indicators that just show patterns, this system uses a 10-Point Scoring System to rate every potential trade:
Signal Strength Components:
✅ Wyckoff Patterns (3 points) - Spring, Upthrust, SOS, SOW
✅ Liquidity Grabs (2 points) - Smart Money stop hunts
✅ Trend Alignment (2 points) - Current timeframe trend
✅ HTF Alignment (2 points) - Higher timeframe confirmation
✅ Volume Confirmation (1 point) - Extreme volume spikes
Only signals with 5+ points are displayed, ensuring you only see high-probability setups!
🔥 Core Features
📊 1. Wyckoff Methodology
Four classic accumulation/distribution patterns:
SPRING (Bullish Reversal)
Price breaks below swing low
Quick recovery with volume
Stop losses swept → reversal up
3-point signal component
UPTHRUST (Bearish Reversal)
Price breaks above swing high
Quick rejection with volume
Bull trap → reversal down
3-point signal component
SOS (Sign of Strength)
Strong bullish candle after accumulation
Breakout with volume
Trend initiation signal
SOW (Sign of Weakness)
Strong bearish candle after distribution
Breakdown with volume
Downtrend initiation signal
💹 2. Order Flow Analysis
Order Blocks
Institutional buying/selling zones
Automatic detection based on strong moves
Limited to 10 zones for clean charts
Transparent boxes for minimal clutter
Fair Value Gaps (FVG)
Price imbalances likely to be filled
Minimum size filter (customizable)
Blue (bullish) and purple (bearish)
Maximum 8 gaps shown
Supply & Demand Zones (Optional)
Classic S/D methodology
Fresh zones only
Toggle on/off for preferences
Professional zone labeling
💧 3. Liquidity Analysis
Liquidity Grabs Detection
Identifies sweep of swing highs/lows
Confirms with volume and candle structure
Yellow labels for visibility
Only major liquidity events shown
Why This Matters:
Smart money often "hunts stops" by sweeping liquidity before reversing. These grabs are powerful reversal signals.
📈 4. Multi-Timeframe Trend Analysis
Current Timeframe:
Fast EMA (default: 9)
Slow EMA (default: 21)
Major trend EMA (default: 200)
Higher Timeframe:
Customizable HTF (default: 15min)
Automatic alignment check
Background tint shows HTF trend
Can require HTF confirmation for signals
🎯 5. Two Trading Modes
STRICT MODE (Default - Recommended)
Requires trend alignment
HTF must confirm
Minimum 5/10 strength
Higher win rate, fewer signals
Best for beginners
FAST MODE
No trend requirements
HTF optional
Minimum 5/10 strength
More signals, lower win rate
For experienced scalpers
📊 6. Live Dashboard
Real-time information panel showing:
Current TF trend (Bull/Bear)
HTF trend status
Volume analysis (Normal/High/Extreme)
Major trend (Above/Below 200 EMA)
Active signal (LONG/SHORT/WAIT)
Signal strength (X/10 points)
Operating mode (Strict/Fast)
⚙️ Customization
Signal Filter Settings:
Min Signal Strength: 3-9 (default: 5)
→ Higher = fewer but better signals
Signal Cooldown: 1-20 bars (default: 5)
→ Prevents signal spam
Strict Mode: ON/OFF
→ Requires trend + HTF alignment
Wyckoff Settings:
Wyckoff Period: 10+ (default: 20)
→ Lookback for pattern detection
Volume Threshold: 1.5+ (default: 2.0)
→ How much above average for confirmation
Order Flow:
Order Blocks: Toggle ON/OFF
Liquidity Grabs: Toggle ON/OFF
Fair Value Gaps: Toggle ON/OFF
FVG Min Size: 0.2-5% (default: 0.5%)
Supply/Demand Zones: Toggle ON/OFF (default: OFF)
Trend Filter:
Fast EMA: Default 9
Slow EMA: Default 21
Major EMA: Default 200
Use 200 EMA Filter: Toggle
Multi-Timeframe:
HTF Timeframe: Any (default: 15min)
Require HTF Alignment: Toggle
💡 How To Use
For Scalping (M1-M5):
Set HTF to M15
Use Strict Mode
Min Signal Strength: 6
Focus on liquidity grabs
Quick in and out
For Day Trading (M15-H1):
Set HTF to H1 or H4
Use Strict Mode
Min Signal Strength: 5
Watch all components
Swing for larger moves
For Swing Trading (H4-D1):
Set HTF to Daily or Weekly
Use Strict Mode
Min Signal Strength: 7
Disable S/D zones (less clutter)
Hold for days
🎯 Entry Rules
LONG Entry:
Required:
Green triangle appears below bar
Label shows "LONG"
Strength ≥ 5/10 in dashboard
Optional (for higher probability):
Strength 7+/10
Spring or SOS pattern present
Liquidity grab occurred
HTF shows green trend
Above 200 EMA
Stop Loss:
Below order block or swing low
10-20 pips buffer
Take Profit:
Next supply zone or opposite order block
Minimum 1:2 RRR
SHORT Entry:
Required:
Red triangle appears above bar
Label shows "SHORT"
Strength ≥ 5/10 in dashboard
Optional (for higher probability):
Strength 7+/10
Upthrust or SOW pattern present
Liquidity grab occurred
HTF shows red trend
Below 200 EMA
Stop Loss:
Above order block or swing high
10-20 pips buffer
Take Profit:
Next demand zone or opposite order block
Minimum 1:2 RRR
📊 Best Markets & Timeframes
✅ Forex
All major pairs (EUR/USD, GBP/USD, etc.)
Best on M5-H1
High liquidity = cleaner signals
✅ Gold (XAUUSD)
Excellent for scalping
M5-M15 optimal
Strong liquidity events
✅ Crypto
Bitcoin, Ethereum
M15-H1 recommended
Volatile = more opportunities
✅ Indices
S&P 500, NASDAQ, etc.
M15-H4 optimal
Clear trends
✅ Stocks
Large cap only
Day trading timeframes
Sufficient volume required
🔔 Alert System
Available Alerts:
🟢 LONG Entry Signal
🔴 SHORT Entry Signal
🟡 Bullish Liquidity Grab
🟡 Bearish Liquidity Grab
🔵 Spring Pattern
🔴 Upthrust Pattern
Alert Messages Include:
Ticker symbol
Current price
Signal strength (X/10)
Pattern type
Recommended Setup:
Enable LONG and SHORT entry alerts
Set to "Once Per Bar Close"
Notification to mobile app
📈 Performance Expectations
Realistic Win Rates:
Strict Mode (5/10 min, with trend):
Win Rate: 65-75%
Signals: 3-8 per day (M15)
Best for: Most traders
Strict Mode (7/10 min, HTF aligned):
Win Rate: 75-85%
Signals: 1-3 per day (M15)
Best for: Conservative traders
Fast Mode (5/10 min, no filters):
Win Rate: 55-65%
Signals: 10-20 per day (M15)
Best for: Experienced scalpers
With Liquidity Grabs:
Win Rate: +10-15% increase
Reversal probability very high
Combine with Wyckoff for best results
💎 Pro Tips
Tip #1: Combine Patterns
Best Setup = Liquidity Grab + Spring/Upthrust
→ 80%+ win rate
→ Smart money confirmed on both sides
Tip #2: Use Signal Strength
5-6 points = OK to trade
7-8 points = Excellent trade
9-10 points = Rare, perfect setup
Tip #3: HTF Alignment
When HTF agrees with signal:
→ Larger position size allowed
→ Wider profit targets
→ Higher probability
Tip #4: Volume Matters
"EXTREME" volume in dashboard:
→ Institutional activity confirmed
→ Higher confidence in setup
→ Stronger moves expected
Tip #5: Clean Charts
Turn OFF S/D zones for day trading
Keep only Order Blocks + FVG
Less clutter = better focus
Tip #6: Signal Cooldown
Increase cooldown during:
→ Low volatility periods
→ Range-bound markets
→ To avoid overtrading
Decrease cooldown during:
→ High volatility
→ Trending markets
→ Major news events
🎨 Visual Design
Clean & Professional:
Minimal chart clutter
Only essential information
Transparent zones (92-95%)
Clear signal markers
Professional color scheme
Information Hierarchy:
Entry signals = LARGEST (impossible to miss)
Liquidity grabs = Medium (yellow labels)
Wyckoff patterns = Small (diamonds)
Zones = Transparent backgrounds
🆚 Comparison to Other Indicators
vs. Basic Order Block Indicators:
✅ Multi-factor scoring system
✅ Wyckoff patterns included
✅ Liquidity analysis built-in
✅ HTF confirmation
✅ Volume analysis vs. Simple Wyckoff Indicators:
✅ Order flow integration
✅ Fair value gaps
✅ Signal strength rating
✅ Multi-timeframe analysis
✅ Professional dashboard vs. Complex "All-in-One" Tools:
✅ Not overwhelming
✅ Focused on what matters
✅ Clean visual design
✅ Fast calculations
✅ Beginner-friendly with pro features
🎯 Who Is This For?
✅ Perfect For:
Scalpers (M1-M5)
Day traders (M15-H1)
Swing traders (H4-D1)
Traders learning Wyckoff
Anyone wanting quality over quantity
Traders seeking multi-confirmation
⚠️ Not Ideal For:
Complete beginners (learn basics first)
"Signal chasers" wanting 50+ signals/day
Traders who don't use stop losses
Very long-term investors
📚 Educational Value
This indicator teaches you:
Classical Wyckoff methodology
How institutions hunt liquidity
Order flow analysis
Multi-timeframe confluence
Volume analysis importance
Risk management through scoring
Learn while you trade!
⚡ Technical Specifications
Pine Script v5
Optimized for speed
No repainting
Real-time calculations
Maximum 200 boxes (clean limits)
Maximum 200 lines
Efficient array management
Works on all liquid markets
🚀 Getting Started (Quick Guide)
Add to Chart
Apply to your favorite pair
Default settings work well
Choose Your Mode
Strict Mode: ON (recommended)
HTF: Set to 15min (or higher for H1+ charts)
Set Alerts
LONG Entry Signal
SHORT Entry Signal
Start Small
Demo trade first
Watch signal strength
Learn the patterns
Scale Up
Once comfortable
Increase position size
Focus on 7+ strength signals
🎯 Final Thoughts
Wyckoff Scalping Pro V2 is not just an indicator - it's a complete trading system that respects your screen space while giving you professional-grade analysis.
The 10-point scoring system ensures you're never guessing about signal quality. You always know exactly how strong a setup is before entering.
Quality over quantity - This system prioritizes high-probability setups over signal spam. You might see 3-8 signals per day on M15, and that's exactly the point. Each one is carefully filtered.
📞 Support & Feedback
Questions? Drop a comment below!
Found this useful? Hit that ⭐ button!
Have suggestions? I'm listening!
Happy Trading! 🚀📈

Filled Fair Value GapsThese are filled fvgs it only shows filled fvgs so you can see where price is retracing to and don't have 50 fvgs on your screen

ICT Complete Multi-Setup StrategyThe ICT (Inner Circle Trader) trading strategies include multiple setups such as Silver Bullet, Cameron's Model, Inversion Fair Value Gap, Turtle Soup, Candle Range Theory (CRT), Optimal Trade Entry (OTE), Change in the State of Delivery (CISD), and Power of Three (PO3). These strategies revolve around concepts like liquidity sweeps, fair value gaps (FVG), order blocks, market structure shifts, and smart money footprints.
For a comprehensive Pine Script indicator that incorporates all ICT trading strategies with buy/sell toggles and detailed setups, it involves detecting and marking key ICT concepts like liquidity zones, fair value gaps, order blocks, market structure breaks, and then combining these signals into actionable buy/sell alerts.
Based on the available resources, a Pine Script indicator for all ICT setups would feature:
Marking and trading liquidity sweeps and stops (Silver Bullet, Cameron's Model)
Identifying fair value gaps and their inversions (Inversion FVG, Turtle Soup)
Highlighting Candle Range Theory zones with entries and stops
Fibonacci retracement-based Optimal Trade Entry (OTE) zones for entry timing
Detecting momentum shifts and Change in State of Delivery (CISD)
Recognizing accumulation, manipulation, and distribution phases for Power of Three (PO3)
Toggles for each strategy to enable/disable buy and sell signals
An indicator script needs well-commented code for readability and must visually display buy/sell signals, FVG zones, and key price levels on the chart.

Custom Horizontal Lines | Trade Symmetry📊 Custom Horizontal Lines
🔍 Overview
The Custom Horizontal Lines is a precision utility designed for traders who perform manual higher-timeframe analysis and want to preserve their marked price levels directly on the chart.
It doesn’t calculate or detect anything automatically — instead, it acts as your personal level memory, preserving your analyzed zones and reference prices throughout the session.
Ideal for traders who manually mark the High, Low, Open, Close, Mean Thresholds, and Quarter Levels of Order Blocks, Fair Value Gaps, Inversion Fair Value Gaps and Wicks before the trading day begins.
⚙️ Key Features
✅ Manual Level Entry — Input your analyzed price levels (OB, FVG, WICK,etc) directly into the indicator settings.
✅ Preserved Levels — Once entered, your lines stay visible and consistent — even after switching symbols, timeframes, or reloading the chart.
✅ Supports All Level Types — Store any kind of manually defined level: OB highs/lows, FVG boundaries, Wicks, Mean Thresholds, Quarter levels, or custom reference prices.
✅ Clean Visualization — Customize line color, style, and labels for easy visual organization.
✅ Session-Ready Workflow — Built for pre-market preparation — enter your HTF levels once, and trade around them all day.
✅ No Auto Calculations — 100% manual by design — ensuring only your analyzed levels are shown, exactly as you defined them.
💡 How to Use
Open the indicator’s settings and manually enter those price values.
The indicator will plot and preserve those exact levels on your chart.
Switch to your lower timeframe and observe how price reacts around them — without ever needing to redraw.
🎯 Why It’s Useful
Keeps your HTF levels organized and persistent across sessions.
Saves time by avoiding redrawing.
Fits perfectly into ICT / Smart Money trading workflows.
Ensures full manual control and precision over what’s displayed on your chart.
🧩 Ideal For
ICT and Smart Money traders
Institutional-style manual analysts
Traders marking Mean Thresholds, or Quarter Levels of OBs, FVGs, Wicks etc
Anyone who wants a clean, reliable way to preserve their manual analysis

Synapse Dynamics - Market Structure📊 SYNAPSE DYNAMICS - MARKET STRUCTURE INDICATOR
An educational tool for learning and practicing Smart Money Concepts (SMC) methodology through visual representation of institutional price action patterns.
═══════════════════════════════════════════════════
🎯 WHAT THIS INDICATOR DISPLAYS
This indicator visualizes Smart Money Concepts patterns on your chart:
- Order Blocks (OB) - Supply and demand zones based on institutional order flow theory. The indicator identifies these areas using price action criteria including the final opposing candle before a strong directional move.
- Breaker Blocks - Failed order blocks that may act as support/resistance. These occur when an order block is invalidated but price returns to the zone, potentially reversing its role.
- Fair Value Gaps (FVG) - Three-candle imbalance patterns where price gaps create inefficiencies. The indicator marks these zones for reference in analysis.
- Market Structure - Break of Structure (BOS) and Change of Character (CHoCH) patterns based on swing high/low breaks. These help identify potential trend continuation or reversal points.
- Reference Entry Signals - The indicator calculates potential entry zones with accompanying stop loss and take profit reference levels based on order block and FVG locations. These are for educational reference only.
- Higher Timeframe Context - Optional filter that displays the higher timeframe trend direction to provide additional market context.
- Information Panel - On-screen dashboard showing active reference signals, their status, and relevant price levels.
- Swing Point Mapping - Labels recent higher highs (HH), higher lows (HL), lower highs (LH), and lower lows (LL) based on configurable swing detection parameters.
═══════════════════════════════════════════════════
⚙️ HOW IT WORKS
The indicator uses the following methodology:
**Order Block Detection:** Identifies the last opposing candle before a strong directional move that breaks structure. Filters blocks by size to reduce noise.
**Market Structure Analysis:** Tracks swing points and identifies when price breaks previous highs/lows to determine BOS or CHoCH patterns.
**Fair Value Gap Identification:** Detects three-candle patterns where candle 1's high/low doesn't overlap with candle 3's low/high, creating an imbalance zone.
**Reference Signal Generation:** Combines order block proximity, FVG presence, and market structure breaks to suggest potential study areas. Optional HTF trend filter can be enabled.
**Timeframe Adaptation:** Automatically adjusts swing detection sensitivity based on the chart timeframe (using multipliers for intraday vs. higher timeframes).
═══════════════════════════════════════════════════
📚 EDUCATIONAL PURPOSE & IMPORTANT LIMITATIONS
**This indicator is designed as an educational tool for:**
- Learning Smart Money Concepts methodology
- Practicing pattern recognition
- Understanding institutional price action theories
- Analyzing market structure visually
**Critical Understanding:**
- All signals and levels are REFERENCE POINTS for study - not trading recommendations
- The indicator displays patterns based on historical price action - it cannot predict future movements
- Smart Money Concepts is a theoretical framework - market behavior varies
- Backtested or historical results shown do not guarantee future performance
- No indicator can account for all market variables, news events, or changing conditions
**Proper Use:**
This tool is meant to assist in learning technical analysis concepts. Users must develop their own analysis skills, risk management strategies, and trading plans. The displayed patterns require interpretation within broader market context.
═══════════════════════════════════════════════════
⚙️ CUSTOMIZATION OPTIONS
**Adjustable Parameters:**
- Order Block: Minimum size threshold, maximum count displayed
- Fair Value Gaps: Toggle visibility, maximum count
- Market Structure: Swing detection length, BOS/CHoCH display
- Signals: Entry/SL/TP calculation method, HTF filter toggle
- Visual Settings: Colors, line styles, label sizes, panel position
**Timeframe Compatibility:**
Works on all timeframes from 1-minute to monthly charts. The swing detection automatically scales based on timeframe.
═══════════════════════════════════════════════════
⚠️ DISCLAIMER
This indicator is for educational and informational purposes only. It does not constitute financial advice or trading recommendations. Trading involves substantial risk of loss. Past patterns and historical analysis do not indicate future results. Users are responsible for their own trading decisions and risk management. The author assumes no liability for trading losses.
═══════════════════════════════════════════════════
🔧 ALERT FUNCTIONALITY
Built-in alert conditions notify you when:
- New order blocks are detected
- Market structure changes occur (BOS/CHoCH)
- Reference entry signals appear
Configure alerts through TradingView's alert system.

UTS CORE + BOS + CHOCH – RR/TP/SL 📊 Indicator Working Principle
### 🔹 1. BOS (Break of Structure)
* **Definition:** Occurs when the price breaks the previous swing high or swing low level.
* **Interpretation:**
* If the last high is broken upwards → **Bullish BOS** (confirmation of uptrend).
* If the last low is broken downwards → **Bearish BOS** (confirmation of downtrend).
---
### 🔹 2. CHOCH (Change of Character)
* **Definition:** Indicates a trend reversal.
* **Interpretation:**
* In an uptrend, if the last low is broken downwards → **CHOCH↓** (start of downtrend).
* In a downtrend, if the last high is broken upwards → **CHOCH↑** (start of uptrend).
* **Chart:** Blue “CHOCH↑” labels on the chart mark trend reversals.
---
### 🔹 3. FVG (Fair Value Gap)
* **Definition:** A price gap formed between 3 candles.
* **Logic:**
* If the low of one candle stays above the high of the candle two bars back, a gap is created.
* Price tends to return to these gaps to “fill” them.
* **Chart:** The indicator highlights these gaps automatically (green/purple lines).
---
### 🔹 4. Signal Generation (BUY / SELL)
* A valid BOS or CHOCH confirmation + presence of FVG → **signal is triggered.**
* **Rules:**
* Upward break → **BUY signal**
* Downward break → **SELL signal**
* **Chart:** Red “SELL” and green “BUY” labels represent these trade signals.
---
### 🔹 5. RR – TP/SL Management
* When a trade is opened, the indicator automatically calculates **Entry, Stop Loss (SL), and Take Profits (TP1, TP2, TP3).**
* **Risk/Reward ratios:**
* TP1 = 1R
* TP2 = 2R
* TP3 = 3R
* If TP1 is hit and “Breakeven” option is enabled → SL moves to entry (risk-free trade).
---
👉 In short: this indicator tracks **market structure (BOS/CHOCH)**, detects **imbalances (FVG)**, and combines them with **risk/reward management (TP/SL)** to give you a ready-made trade

Dammu AI PROType & Purpose
Multi-functional trend, swing, and smart money concept indicator.
Combines SuperTrend, SMA, ATR-based risk management, swing structures, order blocks, EQH/EQL, and Fair Value Gaps (FVG).
Designed for identifying trends, entries/exits, and support/resistance zones.
2. Trend Detection
SuperTrend with ATR smoothing (nsensitivity*7 factor) for buy/sell signals.
SMA filter (8 & 9 periods) confirms trend strength.
Bar color changes:
Green if close > supertrend.
Red if close < supertrend.
Cirrus Cloud highlights trend zones with semi-transparent colors.
3. Swing & Structure
Detects pivot highs/lows and labels them as HH/LH (Highs), HL/LL (Lows).
Generates BOS (Break of Structure) and CHoCH (Change of Character) signals.
Internal swing structures and order blocks for short-term intraday moves.
4. Order Blocks
Internal Order Blocks (iOBs) and Swing Order Blocks (OBs).
Boxes drawn for bullish/bearish zones.
Auto-delete when broken.
Option to filter blocks by ATR or Cumulative Mean Range.
5. Risk Management
TP/SL levels based on ATR and user-defined % risk.
Shows lines and labels for:
Entry
Stop Loss
TP1, TP2, TP3
Adjustable line style (solid/dashed/dotted).
6. Fair Value Gaps (FVG)
Highlights bullish and bearish gaps.
Option for auto-threshold filtering.
Extendable FVG boxes.
7. EQH/EQL
Detects Equal Highs (EQH) and Equal Lows (EQL) for potential reversals.
Dotted lines with labels.
8. Smart Money Concepts (SMC) Features
Shows:
Swings (internal & swing structure)
Internal order blocks
Premium/Discount zones
Fair Value Gaps
Highs/Lows from previous day/week/month
Configurable for historical vs present display.
9. Alerts
Buy/Sell triggers:
bull = crossover of close above SuperTrend.
bear = crossunder of close below SuperTrend.
Alerts for BOS/CHoCH, EQH/EQL, and OB breaks.
10. Visualization
Trend clouds, colored bars, SMA markers, SuperTrend labels.
Multi-layered info displayed without cluttering the chart.
Customizable colors, line styles, and transparency.
✅ Summary:
This indicator is a comprehensive trading tool for trend detection, swing structure, order block analysis, and risk management. It’s built for smart money and SMC-based trading, offering visual cues and alerts for key trading decisions.

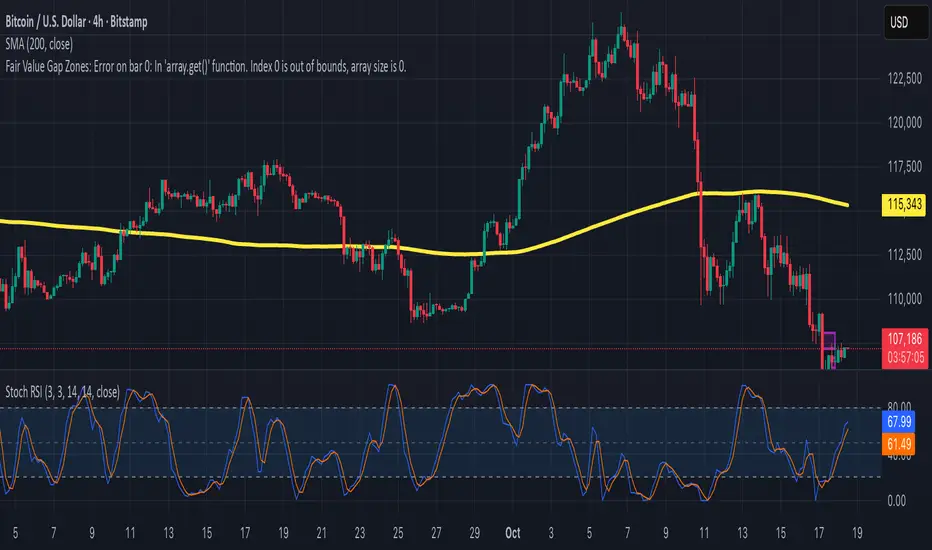
Fair Value Gap ZonesDescription
This script automatically detects and highlights Fair Value Gaps (FVGs) on any chart and timeframe.
It identifies bullish and bearish imbalance zones using candle-to-candle price displacement and shades them visually on the chart for easy reference.
Bullish FVGs are marked with dark green zones, showing areas where price may later return before continuing upward.
Bearish FVGs are shaded in light red, indicating potential retracement zones in downtrends.
All zones extend forward automatically, updating dynamically as new candles form.
Designed for traders who use Smart Money Concepts (SMC) or ICT-style analysis, this tool helps visualize market inefficiencies and potential reaction points with clear, minimal visuals.
Binary Options Fast Scalping [TradingFinder] M1 & M5 Signals🔵 Introduction
In the structure of financial markets, spiky moments and sudden price movements play a key role in Liquidity Grabs and Market Structure Resets. These movements usually occur after the accumulation of orders in Buy Side or Sell Side Liquidity zones and are accompanied by rapid breaks in the form of Break of Structure (BoS) or Change of Character (CHoCH).
At this stage, the market temporarily moves in the direction of liquidity to trigger counter orders and then enters a Retracement or Pullback phase, a point where professional traders using the Smart Money Concept (SMC) look for candle confirmation to enter with precision.
This strategy is built upon the same logic : an initial spiky move as a signal of institutional or liquidity driven algorithms, followed by a controlled pullback toward areas such as the Order Block, Fair Value Gap (FVG), or Imbalance Zone, and finally an entry based on a strong confirmation candle (Engulf, Rejection, Breaker) that defines the true direction of order flow.
This combination of price behavior, especially on lower timeframes such as M1 or M5, provides an ideal setup for fast Scalping, Micro Structure Trading, and even short term directional prediction in Binary Options Trading.
Since the main focus of this method is on identifying liquidity phases, structural confirmations, and momentum confirmation candles, the trader can design entries with high probability and logical stop loss placement using the concepts of Fractal Market Structure and Multi Timeframe Confirmation.
In the scalping version, the main objective is to capture the move toward the next liquidity pool or opposite demand and supply zone, while in the binary version, only the prediction of the next candle’s direction matters. This strategy inherently operates based on Smart Money Behavior, Liquidity Engineering, and Order Flow Dynamics, allowing the extraction of fast and profitable moves from the internal logic of market structure.
🔵 How to Use
The operational logic of this strategy is based on Liquidity Sweep, Pullback, and Confirmation Candle. The trader should first identify the initial Impulse Move, which is often accompanied by liquidity absorption around Buy Side or Sell Side Liquidity areas. After that, the market enters the Retracement phase and returns to structural zones such as the Order Block or the Fair Value Gap (FVG).
At this point, a position is taken only when a confirmation candle (Engulf, Breaker, or Rejection Candle) closes in the direction of continuation and aligns with the new structure (BOS or CHoCH). Applying this model on lower timeframes offers the highest precision for fast Scalping or for predicting the next candle’s direction in Binary Option trading.
🟣 Bullish Setup
In the bullish setup, the market first forms a spiky upward move with a sudden increase in momentum, indicating the activation of liquidity flow in the Buy Side Liquidity zone. This movement is usually accompanied by a Break of Structure (BOS) to the upside and marks the beginning of the Impulse Move phase. After this move, the price enters the Pullback phase and returns to structural areas such as the Bullish Order Block, Fair Value Gap (FVG), or Mitigation zone.
At this stage, the trader waits for a bullish confirmation candle (Bullish Engulf or Breaker Candle) to validate the end of the retracement. Entry is made at the close of the confirmation candle or on a minor pullback, with the stop loss placed below the Swing Low or below the pullback zone. The target is set at the next Buy Side Liquidity or Equal Highs. In the binary version, only the direction of the next candle matters and the entry takes place immediately after the confirmation candle.
🟣 Bearish Setup
In the bearish setup, the market first forms a spiky downward move, signaling increased selling pressure and liquidity absorption at the Sell Side Liquidity zone. This movement is accompanied by a Break of Structure (BOS) to the downside and represents the beginning of a bearish momentum phase. After the spike, the price enters the Retracement phase and returns to the Bearish Order Block or bearish Fair Value Gap zone. Within these areas, the formation of a bearish confirmation candle (Bearish Engulf, Breaker, or Rejection Candle) validates the continuation of the downtrend.
The entry is taken at the close of the confirmation candle, with the stop loss placed above the Swing High or above the pullback zone, and the target set toward the next Sell Side Liquidity or Equal Lows. In binary applications, only the direction of the next candle is considered and the confirmation candle serves as the entry trigger.
🔵 Conclusion
This strategy, by combining the principles of the Smart Money Concept, Liquidity Dynamics, and Candle Confirmation Logic, offers a precise and multi functional approach to market entry. Its core structure, identifying the initial spiky movement, waiting for a structural pullback, and entering based on a confirmation candle allows quick interpretation of institutional liquidity behavior and provides trading opportunities with high accuracy and controlled risk.
On lower timeframes, this logic becomes a powerful tool for Scalping and Micro Structure Trading, while in binary markets it delivers high success rates due to its focus on predicting the next candle’s direction. Built upon the foundations of Order Flow, Market Structure, and Fractal Liquidity Behavior, this strategy demonstrates that even in the fastest and noisiest market conditions, the order of Smart Money remains observable and exploitable.

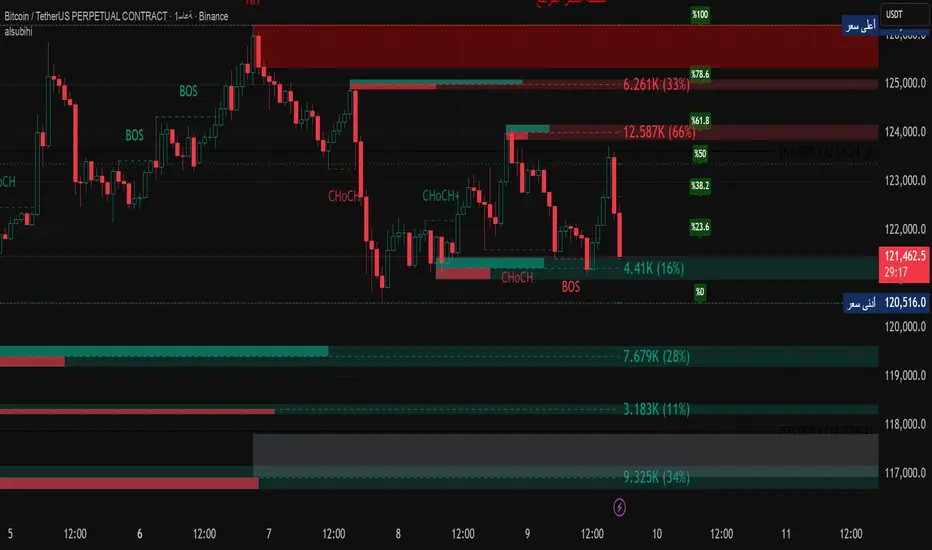
alsubihi.2Advanced Market Structure Indicator
This custom-built indicator provides an in-depth analysis of market structure changes to help traders identify key price levels, trends, and potential reversals. It combines multiple tools to give you a clearer picture of market behavior and improve your decision-making process.
Key Features:
Break of Structure (BOS):
The BOS indicator identifies significant changes in market structure, marking when the price breaks previous highs or lows, signaling a potential trend shift. Green lines represent upward breaks (bullish trend), while red lines show downward breaks (bearish trend).
Change of Character (Choch):
This feature helps to highlight subtle shifts in market dynamics. A change in character (Choch) indicates when the market transitions between bullish or bearish behavior. Green indicates a bullish character change, while red shows a bearish one.
Premium vs Discount Zones:
The indicator identifies price levels that are considered 'Premium' (high price levels) and 'Discount' (low price levels), assisting traders in recognizing overbought or oversold conditions and making better trading decisions based on market conditions.
Support and Resistance Levels:
Automatically drawn support and resistance lines are included to show critical price areas where reversals or breakouts might occur, helping traders anticipate price action.
Equilibrium Zone:
This is the price level where supply and demand balance out, acting as a key reference point for identifying potential market reversals or continuation.
Why Use This Indicator?
This all-in-one tool helps traders make informed decisions by combining multiple technical analysis concepts into a single, easy-to-use indicator. It reduces the complexity of analyzing price action and allows traders to quickly identify potential entry and exit points with greater accuracy.
Whether you are an experienced trader or just starting, this indicator provides you with the essential tools needed to identify trend shifts, key support and resistance zones, and price extremes, leading to more profitable trading decisions.
14 سبتمبر
ملاحظات الأخبار
📌 Summary of the Indicator
Market Structure (MS):
Detects swing & internal BOS, CHoCH, CHoCH+. Can color candles or bars by trend.
Multi-Timeframe Scanner (MTF):
Shows trend direction on multiple TFs (5m → 1W).
Highs/Lows (HTF):
Plots previous Day/Week/Month/Year highs & lows as liquidity levels.
Order Blocks (OB):
Draws volumetric order blocks, with filters (BOS/CHoCH), overlap rules, mitigation, and volume metrics.
Fair Value Gaps (FVG/VI/OG):
Detects price imbalances, extends them, and removes when mitigated.
Accumulation/Distribution Zones:
Highlights Wyckoff-style accumulation (green) or distribution (red).
Equal Highs/Lows (EQH/EQL):
Marks liquidity pools at equal highs or lows.
Premium/Discount Bands:
Splits swing range into premium, equilibrium, and discount zones.
RSI & ADX:
Momentum filters for overbought/oversold and trend strength.
DEMA-ATR Baseline:
Adaptive EMA with ATR constraints; alerts for trend shifts.
Regression Channel:
Auto-fits best regression length using Pearson-R, shows channel with std bands.
Fibonacci Ladder:
Auto plots levels 0.236 → 1.618 based on recent swing.
👉 In short: it’s a full SMC toolkit — structure + liquidity + OB/FVG + momentum filters + extra tools (fib, regression, ATR baseline).
📌 ملخص المؤشر
البنية الهيكلية (Market Structure):
يحدد BOS و CHoCH داخلي وسوينغ، ويقدر يلوّن الشموع حسب الاتجاه.
سكانر متعدد الأطر (MTF):
يعرض الاتجاه على عدة فريمات من 5m إلى 1W.
هاي/لو من أطر عليا (HTF Highs/Lows):
يرسم قمم وقيعان اليوم/الأسبوع/الشهر/السنة السابقة (مناطق سيولة).
بلوكات الطلب/العرض (Order Blocks):
يرسم بلوكات مع فلاتر (BOS/CHoCH)، خيارات تداخل، إزالة عند الكسر، ويعرض حجم التداول بداخلها.
الفجوات السعرية (FVG/VI/OG):
يحدد الفجوات غير المغطاة، يمددها، ويحذفها عند التغطية.
مناطق التجميع/التوزيع:
يوضح مناطق Wyckoff (أخضر للتجميع، أحمر للتوزيع).
قمم وقيعان متساوية (EQH/EQL):
يميز مناطق السيولة فوق القمم أو تحت القيعان المتساوية.
مناطق Premium/Discount/Equilibrium:
يقسم آخر نطاق إلى مناطق غالية (Premium)، توازن (Equilibrium)، ورخيصة (Discount).
RSI و ADX:
مؤشرات إضافية لقياس التشبع وقوة الاتجاه.
خط DEMA-ATR:
EMA متكيف مع قيود ATR، يتغير لونه حسب الاتجاه، مع تنبيهات جاهزة.
قناة الانحدار (Regression):
تختار أفضل طول باستخدام معامل الارتباط Pearson-R، وترسم قناة مع انحراف معياري.
فيبوناتشي (Fibonacci):
يرسم مستويات 0.236 حتى 1.618 حسب آخر حركة سعرية.
👉 باختصار: المؤشر هو أداة SMC متكاملة تجمع الهيكل، السيولة، البلوكات، الفجوات، والمؤشرات المساعدة.
MK_OSFT-Momentum Confluence DetectorMOMENTUM CONFLUENCE DETECTOR - Trading Indicator Overview
What This Indicator Does
The Momentum Confluence Detector is a comprehensive Pine Script indicator designed to identify high-probability trading opportunities by detecting momentum bars that align with multiple confluence factors. It combines traditional technical analysis with advanced Smart Money Concepts to filter out noise and highlight the most significant price movements.
CORE FUNCTIONALITY
📊 Momentum Bar Detection Identifies unusual volume and bar size expansion using customizable multipliers
Detects bullish, bearish, and neutral momentum bars based on OHLC relationships
Uses moving averages to establish baseline volume and bar size thresholds
🔄 Multi-Filter Confluence System
The indicator employs up to 5 different filter types to validate momentum signals:
Level Concept Filter - Choose between:
- Support/Resistance Levels : Traditional pivot-based S/R zones with touch counting and break tracking
- Smart Money Concepts : Institutional order flow analysis including Order Blocks, Fair Value Gaps (FVGs), and market structure breaks
Trend Filter : EMA/SMA-based trend direction confirmation with alignment requirements
Breakout Filter : Detects price breakouts beyond recent highs/lows with percentage thresholds
Volatility Filter : ATR expansion confirmation to ensure signals occur during active market conditions
Market Session Filter : Filters signals to specific trading sessions (Tokyo, London, New York)
ADVANCED FEATURES
🎯 Smart Money Concepts Integration
Order Blocks : Identifies institutional supply/demand zones from major and minor structure breaks
Fair Value Gaps (FVGs) : Detects price imbalances and tracks their evolution through partial fills and inversions
Market Structure : Recognizes Break of Structure (BOS) and Change of Character (CHoCH) patterns
Retracement Patterns : Tracks HLH (Higher-Low-Higher) and LHL (Lower-High-Lower) institutional patterns
📈 Support/Resistance System
Multi-timeframe pivot detection (3, 5, 7-bar spans)
Volume-weighted strength calculation for level importance
Dynamic level merging and break tracking
Automatic level type classification (Support/Resistance/Flip zones)
⚙️ Intelligent Filtering Logic
ALL Mode : Requires all enabled filters to pass (high precision)
ANY Mode : Requires at least one filter to pass (higher frequency)
Real-time filter status tracking and visualization
Visual Features
Signal Markers : Clear triangular markers for qualified momentum bars
Unfiltered Signals : Optional display of raw momentum bars for comparison
Level Visualization : Dynamic S/R level boxes and lines with strength indicators
Structure Lines : BOS/CHoCH break visualization with major/minor classification
Fair Value Gaps : Color-coded boxes showing bullish/bearish FVGs with partial fill tracking and IFVG conversion
Order Blocks : Institutional supply/demand zones displayed as colored boxes with major/minor classification
Information Table : Real-time display of signal details and filter status
Session Boxes : Visual representation of active trading sessions
Practical Applications
✅ Swing Trading : Identify high-probability reversal and continuation setups
✅ Day Trading : Spot intraday momentum shifts with institutional backing
✅ Multi-Timeframe Analysis : Combine major and minor structure analysis
✅ Risk Management : Filter out low-quality setups using confluence requirements
✅ Educational : Understand market structure and institutional order flow
Customization Options
Adjustable momentum thresholds for different market conditions
Comprehensive filter settings with individual enable/disable controls
Visual customization for colors, sizes, and display preferences
Alert system with detailed signal information
Performance optimization settings for different chart timeframes
Who Should Use This Indicator
This indicator is suitable for traders who:
Want to combine multiple technical analysis approaches
Seek to understand institutional market behavior
Prefer confluence-based trading setups
Need customizable filtering for different market conditions
Value comprehensive signal validation over high-frequency alerts
The Momentum Confluence Detector transforms complex market analysis into clear, actionable signals by requiring multiple forms of confirmation before highlighting trading opportunities.
