AymaN Entry Signal – With HTF + Pin Bar + Multi TP + BE + V1Ayman Entry Signal – Indicator Description
Overview
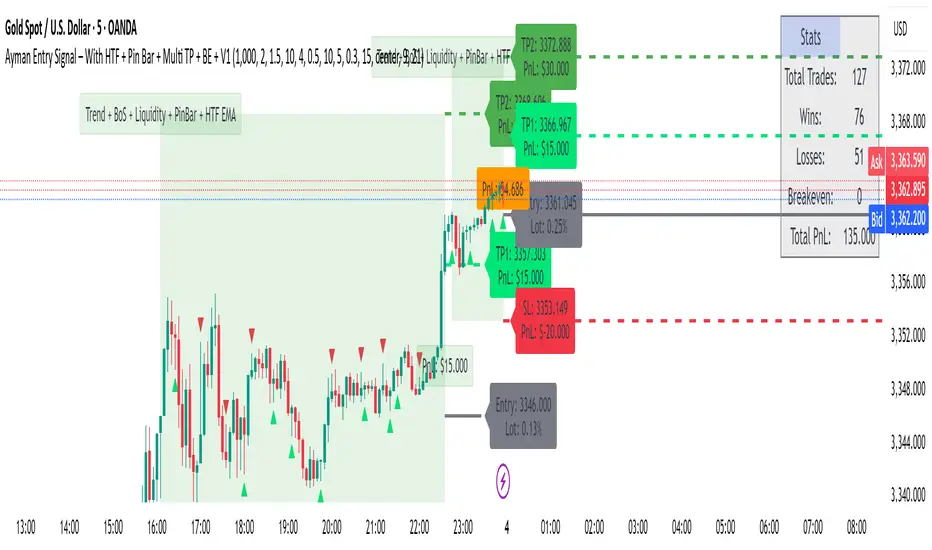
Ayman Entry Signal – With HTF + Pin Bar + Multi TP + BE + Stats Panel (V1)
This is a professional-grade Pine Script indicator designed for scalping and intraday trading, with full trade management, multi-confirmation logic, and advanced visualization. The tool is ideal for traders focused on XAUUSD (Gold), Forex, and other volatile instruments who seek both precision entries and structured exits with dynamic risk control.
Main Features
Advanced Entry Logic:
- EMA fast/slow crossovers (configurable)
- Optional conditions: Break of Structure (BoS), Order Block (OB), Fair Value Gap (FVG), Liquidity sweeps, Pin Bars
- HTF confirmation using EMA or BoS
- Real-time entry condition display
Trade Management:
- Dynamic calculation of Entry, SL (with ATR buffer), TP1, TP2
- Supports Partial Close and Break Even logic after TP1
- Visual PnL label (dynamic and color-coded)
Statistics Panel:
- Shows total trades, win/loss/breakeven count, cumulative PnL
- Filter by custom date or session
- Fully customizable panel appearance
Trade Visualization:
- Trade box includes all trade levels (Entry, SL, TP1, TP2)
- Visual display of trade conditions and PnL result
- Option to keep previous trades on chart
Alert System:
- Alerts for Buy and Sell entries
- Compatible with webhook automation systems like MT5/MT4
Customization & Inputs
- Capital & risk per trade
- Value per pip/point
- SL buffer (ATR-based)
- Manual EMA override
- Enable/disable: EMA, BoS, OB, FVG, Liquidity, Pin Bars
- HTF: timeframe + confirmation logic
- Trade box/labels visibility
- Full color customization
- PnL label position: top, center, or bottom
Recommended Use
- Ideal for Gold scalping (XAUUSD), also effective for Forex
- Best on 1m–15m charts; use HTF confirmation from 15m–4H
- Pairs well with semi-automated systems using alerts and webhooks
Disclaimer
Note: This is a non-executing indicator. It does not place trades but provides visual and statistical guidance for professional manual or semi-automated trading.
Search in scripts for "fvg"

EURUSD Kill Zone [Plazo Sullivan Roche Capital]EUR/USD Kil Zone
Core Logic: Navigating the New‑York Kill‑Zone
The EUR/USD Killzone is designed to exploit repeatable patterns that occur during the overlap of the London and New‑York trading sessions. Research shows that the New‑York “kill zone”—roughly 07:00–09:00 EST—produces the most dramatic moves in EUR‑ and USD‑linked currency pairs
During this window, large institutions often sweep out liquidity resting above or below the Asian and early‑London session extremes , triggering sharp reversals before a new intraday trend emerges. This is in contrast to the single pre-market sweeps occuring for GOLD/
This modeul uses ICT/Smart Money Concepts to read these patterns and waits for three confirmations before signalling a trade:
Liquidity Sweep & Rejection. Price must spike beyond the combined Asian and early‑London range and then reject that area (a sharp wick and opposite‑coloured candle), signalling that stops have been cleared. The module defines the Asian range from 00:00–05:00 EST and the London range from 02:00–05:00 EST, following the guideline that overlapping sessions produce the greatest volatility
Market Structure Break. It then waits for the 5‑minute price to close beyond the most recent swing high/low (pivot), confirming that a genuine shift in order flow has occurred rather than a simple stop‑run.
Fair‑Value‑Gap (FVG) Re‑Test. Upon the break, the script records the high and low of that 5‑minute “displacement” candle and defines a fair‑value gap—the imbalance between buyers and sellers. Rather than entering immediately, it sets a virtual limit order at the 50 % level of this gap. A trade is only triggered once price retraces to this mid‑point, providing a high‑probability, high‑reward entry.
These three filters help avoid common pitfalls when trading kill zones, such as false breakouts and news‑driven whipsaws. The indicator also monitors higher‑timeframe bias (4‑hour and daily charts) using 50‑ and 200‑period moving averages to gauge whether the intraday signal aligns with the broader trend.
Feature Set
The indicator provides a suite of visual and analytical tools to support disciplined trading:
Session Range Mapping: automatically draws the Asian (00:00–05:00 EST) and London (02:00–05:00 EST) session highs and lows, making it easy to see when price sweeps these levels.
Kill‑Zone Monitoring: a built‑in timer isolates the 07:30–09:00 EST window and limits the indicator to one trade per session to avoid over‑trading.
Pivot‑Break Detection: uses 5‑minute swing highs/lows to confirm that order flow has shifted before looking for entries.
Fair‑Value‑Gap Re‑test: defines an FVG from the displacement candle and waits for a 50 % retrace before triggering a signal. This improves risk‑to‑reward by entering at a discount (for longs) or premium (for shorts).
Higher‑Timeframe Dashboard: displays bullish/bearish/neutral biases on the 4‑hour and daily charts, plus a confidence rating (0–2) indicating how many of these timeframes agree with the signal direction.
Alerts: optional alerts can be configured for buy‑only, sell‑only or either‑direction signals.
Best Practices for Use
Align with Major Volatility Windows. The indicator is most effective during the New‑York kill zone. Avoid trading outside this window, and be aware of high‑impact news (e.g., FOMC announcements) that can distort price action
Check Higher‑Timeframe Bias. Use the dashboard to ensure the intraday signal aligns with the 4‑hour and daily trends. For instance, a long signal that aligns with a bullish daily bias carries higher conviction than one going against it.
Manage Risk Responsibly. Even with multiple filters, no strategy is foolproof. Use stop‑loss orders just beyond the liquidity sweep and size positions appropriately.
Combine with Fundamental Awareness. Check your economic calendar for European and U.S. data releases. If an important release occurs during the kill zone, consider standing aside or reducing risk.
Back‑test and Forward‑Test. Always validate the strategy across different market conditions and broker feeds. Pay attention to how spreads, volatility and news events influence the indicator.
Use as Part of a Toolkit. Consider combining the indicator with other confirmation tools such as momentum oscillators, volume analysis or price‑action patterns to refine entries further. Smart‑Money Concepts often use confluence, not a single signal.
What's in It for You?
The EUR/USD Liquidity Sweep Indicator distils institutional concepts—liquidity hunts, market‑structure shifts and fair‑value gaps—into an intuitive, automated tool. By waiting for a retrace into the displacement candle’s imbalance, it helps capture trades where risk‑to‑reward is skewed strongly in your favour. The dashboard encourages you to trade with the higher‑timeframe trend, and built‑in alerts ensure you never miss an opportunity.
In volatile kill‑zone environments, discipline and patience are vital. This indicator enforces both: it tracks session ranges, confirms structure, waits for a retrace, and triggers only when multiple conditions align. Coupled with sound risk management and your own judgement, it can become a cornerstone of a high‑probability trading plan.
Always remember that markets evolve. Continue to refine the indicator and your strategy as you gather more experience and data. The learning journey never ends, but this tool is designed to accelerate it.

Ayman Entry Signal – With HTF + Pin Bar
A professional and versatile trading indicator combining classic technical analysis with Smart Money Concepts to detect high-probability entry points.
Designed especially for scalping gold and forex pairs on lower timeframes. Fully customizable to suit any trading style.
✅ Key Features:
EMA Trend Confirmation
Break of Structure (BoS) Detection
Order Block Zone Recognition
Fair Value Gap (FVG) Confirmation
Liquidity Sweep Detection
Pin Bar Candlestick Confirmation
Higher Timeframe Confirmation (HTF EMA + HTF BoS)
🎯 Smart Risk Management:
Automatically calculates Stop Loss (SL) and Take Profit (TP) based on the selected timeframe.
Dynamically adjusts lot size based on account capital and risk percentage.
📈 How It Works:
The indicator triggers a Buy or Sell signal only when a selected set of conditions are met, including:
Trend direction (EMA crossover)
Break of structure
Presence within strong supply/demand zones
Confirmation from higher timeframe
Reversal Pin Bar pattern
🛎 Alerts:
Built-in alert system notifies you instantly when a valid Buy or Sell signal is triggered.
⚙️ Customizable Settings:
Risk Percentage
Capital Size
HTF timeframe
Enable/Disable individual filters (EMA, BoS, OB, FVG, Liquidity, Pin Bar, HTF)
📌 Best Timeframes:
1-min, 5-min, and 15-min – especially during high-volume sessions like London or New York.
🔸 Note:
This is not financial advice. Always backtest and use manual confirmations before live trading.
Midnight 30min High/LowMidnight 30min High/Low — Overnight Liquidity Range Tracker
Capture the Overnight Session: A Strategic Level Identification Tool from Professional Trading Methodology
This indicator captures the high and low prices during the critical 30-minute midnight session (12:00-12:30 AM EST) and projects these levels forward as key support and resistance zones. These overnight ranges often contain significant liquidity and serve as crucial reference points for intraday price action, representing areas where institutional activity may have established important levels.
🔍 What This Script Does:
Identifies Critical Overnight Session Levels
- Automatically detects the 12:00-12:30 AM EST session window
- Captures the highest and lowest prices during this 30-minute period
- Projects these levels forward for multiple trading days
Creates Dynamic Support/Resistance Zones
- Extends midnight high/low levels as horizontal lines with customizable projection periods
- Fills the area between high and low to create a visual trading range
- Updates automatically each trading day with new overnight levels
Provides Clear Visual Reference Points
- Optional session start markers (●) highlight when the midnight session begins
- Color-coded lines distinguish between high and low levels
- Transparent fill area creates an easy-to-identify trading zone
Real-Time Level Tracking
- Updates levels in real-time during the active midnight session
- Maintains historical levels for reference and backtesting
- Compatible with data window for precise level values
⚙️ Customization Options:
Extend Days (1-30):** Control how many days forward the levels are projected (default: 5 days)
High Line Color:** Customize the midnight high line color (default: blue)
Low Line Color:** Customize the midnight low line color (default: orange)
Fill Color:** Adjust the transparency and color of the range area (default: light aqua, 80% transparency)
Show Session Markers:** Toggle yellow session start indicators on/off (default: enabled)
💡 How to Use:
Deploy on lower timeframes (1m-15m) for precise level identification and reaction monitoring**
Watch for key price interactions:
- Rejection at midnight high levels (potential resistance)
- Bounce from midnight low levels (potential support)
- Range-bound trading between the high and low levels
Combine with liquidity concepts:
- Monitor for stop hunts above/below these levels
- Look for false breakouts that snap back into the range
- Use as confluence with other ICT concepts like FVGs and Order Blocks
Strategic Applications:
- Range trading between midnight levels
- Breakout confirmation when price closes decisively outside the range
- Support/resistance validation for entry and exit planning
🔗 Combine With These Tools for Complete Market Structure Analysis:
✅ First FVG — Opening Range Fair Value Gap Detector.
✅ ICT Turtle Soup (Liquidity Reversal)— Spot stop hunts and false breakout scenarios
✅ ICT Macro Zones (Grey Box Version)- It tracks real-time highs and lows for each Silver Bullet session
✅ ICT SMC Liquidity Grabs and OBs- Liquidity Grabs, Order Block Zones, and Fibonacci OTE Levels, allowing traders to identify institutional entry models with clean, rule-based visual signals.
Together, these tools create a comprehensive Smart Money Concepts (SMC) framework — helping traders identify, anticipate, and capitalize on institutional-level price movements with precision and confidence during critical overnight sessions.

Mohammad - OBs, BOS, S/R, Elliott Waves & Trend LinesProfessional Trading Indicator System - Technical Analysis Suite
Overview
Advanced technical analysis system integrating ICT/SMC methodologies with classical analysis tools. Features seven analytical components for comprehensive market structure analysis.
Components
1. Order Blocks (ICT/SMC)
Identifies institutional accumulation/distribution zones acting as future support/resistance.
Detection: Automatic identification based on price rejection patterns
Management: Dynamic updates and removal of invalidated blocks
Configuration: Sensitivity levels (High/Medium/Low), ATR-based parameters
Visual: Green support, red resistance with transparency
2. Break of Structure (BOS)
Detects significant structural breaks indicating trend changes.
Method: 5-bar swing point formation
Display: White horizontal lines with labels
Range: 50-bar maximum lookback
3. Support & Resistance
Classical horizontal levels from significant price pivots.
Analysis: 300-bar historical scan
Filter: 10-point duplicate tolerance
Display: Maximum 15 levels within 5% of current price
4. Fair Value Gaps (FVG)
Price inefficiencies that often get filled on return.
Types: Bullish gaps (up) and bearish gaps (down)
Size: Minimum 0.1 ATR or 5 points
Management: Auto-removal when filled
5. Elliott Wave Analysis
Advanced pattern recognition for impulse and corrective waves.
Patterns: 5-wave impulse (1-2-3-4-5), 3-wave corrective (A-B-C)
Adaptive: Auto-adjusts to timeframe (3-10 depth range)
Display: Small dots with large numbers, starts from hidden point 0
6. 45-Degree Momentum Lines
Revolutionary projection system based on consecutive candle sequences.
Bearish Lines (Red):
Trigger: 5+ consecutive red candles
Start: HIGH of first red candle
Labels: B1-B5
Bullish Lines (Green):
Trigger: 5+ consecutive green candles
Start: LOW of first green candle
Labels: T1-T5
Specifications:
Angle: 45° using ATR * 0.15
Extension: 30 bars forward
Display: 5 most recent patterns
7. Classical Trend Lines
Multi-touch diagonal support/resistance detection.
Validation: Minimum touch requirements
Tolerance: ATR-based touch detection
Display: Blue lines with optional labels
Configuration Summary
Global Settings:
Show/hide each component individually
Customizable colors and line widths
Label size options
Performance:
50-bar periodic cleanup
Maximum object limits (500 each)
Conditional processing on bar close
Trading Applications
Scalping: Order Blocks + FVGs + 45° Lines
Day Trading: All components with BOS emphasis
Swing Trading: Elliott Waves + Trend Lines
Position Trading: Major levels + Elliott Waves
Key Strategies:
Use 45° line bounces for entries
Combine Order Blocks with 45° lines for confluence
Confirm BOS breaks with 45° line violations
Place stops beyond projection lines
Technical Requirements
Platform: TradingView Pine Script v5
Minimum: 300 historical bars
Optimal: 15m-4H timeframes
Performance: Moderate CPU usage
Color Scheme
Green: Bullish/Support (#26a69a)
Red: Bearish/Resistance (#ef5350)
White: BOS/S&R lines
Blue: Elliott Waves/Trend Lines
Customizable: 45° projection lines
Risk Disclaimer
Educational tool only. Not financial advice. Combine with risk management and personal analysis. Past performance doesn't guarantee future results. Trading involves substantial risk.

PRO SMC DASHBOARDPRO SMC DASHBOARD - PRO LEVEL
Advanced Supply & Demand / SMC dashboard for scalping and intraday:
Multi-Timeframe Trend: Visualizes trend direction for M1, M5, M15, H1, H4.
HTF Supply/Demand: Shows closest high time frame (HTF) supply/demand zone and distance (in pips).
Smart “Flip” & Liquidity Signals: Flip and Liquidity Sweep arrows/signals are shown only when truly significant:
Near HTF Supply/Demand zone
And confirmed by volume spike or high confluence score
Momentum & Bias: Real-time momentum (RSI M1), H1 bias and fakeout detection.
Confluence Score: Objective score (out of 7) for trade confidence.
Volume Spike, Divergence, BOS: Includes volume spikes, RSI divergence (M1), and Break of Structure (BOS) for both M15 & H1.
Ultra-clean chart: Only valid signals/alerts shown; no spam or visual clutter.
Full dashboard with all signals and context, always visible bottom-right.
Best used for:
Forex, Gold/Silver, US indices, and crypto
Scalping/intraday with fast, clear decisions based on multi-factor SMC logic
Usage:
Add to your chart, monitor the dashboard for valid setups, and trade only when multiple factors align for high-probability entries.
How to Use the PRO SMC DASHBOARD
1. Add the Script to Your Chart:
Apply the indicator to your favorite Forex, Gold, crypto, or indices chart (best on M1, M5, or M15 for entries).
2. Read the Dashboard (Bottom Right):
The dashboard shows real-time information from multiple timeframes and key SMC filters, including:
Trend (M1, M5, M15, H1, H4):
Arrows show up (↑) or down (↓) trend for each timeframe, based on EMA.
Momentum (RSI M1):
Shows “Strong Up,” “Strong Down,” or “Neutral” plus the current RSI value.
RSI (H1):
Higher timeframe momentum confirmation.
ATR State:
Indicates current volatility (High, Normal, Low).
Session:
Detects if the market is in London, NY, or Asia session (based on UTC).
HTF S/D Zone:
Shows the nearest high timeframe Supply or Demand zone, its timeframe (M15, H1, H4), and exact pip distance.
Fakeout (last 3):
Detects recent false breakouts—if there are multiple fakeouts, potential for reversal is higher.
FVG (Fair Value Gap):
Indicates direction and distance to the nearest FVG (Above/Below).
Bias:
“Strong Buy,” “Strong Sell,” or “Neutral”—multi-timeframe, momentum, and volatility filtered.
Inducement:
Alerts for possible “stop hunt” or liquidity grab before reversal.
BOS (Break of Structure):
Recent or live breaks of market structure (for both M15 & H1).
Liquidity Sweep:
Shows if price just swept a key high/low and then reversed (often key reversal point).
Confluence Score (0-7):
Higher score means more factors align—look for 5+ for strong setups.
Volume Spike:
“YES” appears if the current volume is significantly above average—big players are active!
RSI Divergence:
Bullish or bearish divergence on M1—signals early reversal risk.
Momentum Flip:
“UP” or “DN” appears if RSI M1 crosses the 50 line, confirmed by location and other filters.
Chart Signals (Arrows & Markers):
Flip arrows (up/down) and Liquidity markers only appear when price is at/near a key Supply/Demand zone and confirmed by either a volume spike or strong confluence.
No signal spam:
If you see an arrow or LIQ tag, it’s a truly significant moment!
Suggested Trading Workflow:
Scan the Dashboard:
Is the multi-timeframe trend aligned?
Are you near a major Supply or Demand zone?
Is the Confluence Score high (5 or more)?
Check for Signals:
Is there a Flip or LIQ marker near a Supply/Demand zone?
Is volume spiking or a fakeout just occurred?
Look for Reversal or Continuation:
If there’s a Flip at Demand (with high confluence), consider a long setup.
If there’s a LIQ sweep + flip + volume at Supply, consider a short.
Manage Risk:
Don’t chase every signal.
Confirm with your entry criteria and preferred session timing.
Pro Tips:
Highest confidence trades:
When dashboard signals and chart arrows/markers agree, especially with high confluence and volume spike.
Adapt pip distance filter:
Dashboard is tuned for FX and gold; for other assets, adjust pip-size filter if needed.
Use alerts (if enabled):
Set up custom TradingView alerts for “Flip” or “Liquidity” signals for auto-notifications.
Designed to help you make professional, objective decisions—without chart clutter or second-guessing!

Automated Scalping Signals with TP/SL Indicator [QuantAlgo]🟢 Overview
The Automated Scalping Signals with Take Profit & Stop Loss Indicator is a multi-timeframe trading system that combines market structure analysis with directional bias filtering to identify potential scalping opportunities. It detects Points of Interest (POI) including Fair Value Gaps (FVG) and Order Blocks (OB) while cross-referencing entries with higher timeframe exponential moving average positioning to create systematic entry conditions.
The indicator features adaptive timeframe calculations that automatically scale analysis periods based on your chart timeframe, maintaining consistent analytical relationships across different trading sessions. It provides integrated trade management with stop loss calculation methods, configurable risk-reward ratios, and real-time performance tracking through dashboard displays showing trade statistics, bias direction, and active position status.
This advanced system is designed for low timeframe trading, typically performing optimally on 1 to 15-minute charts across popular instruments such as OANDA:XAUUSD , CME_MINI:MES1! , CME_MINI:ES1! , CME_MINI:MNQ1! , CBOT_MINI:YM1! , CBOT_MINI:MYM1! , BYBIT:BTCUSDT.P , BYBIT:ETHUSDT.P , or any asset and timeframe of your preference.
🟢 How It Works
The indicator operates using a dual-timeframe mathematical framework where higher timeframe exponential moving averages establish directional bias through cross-over analysis, while simultaneously scanning for specific market structure patterns on the POI timeframe. The timeframe calculation engine uses multiplication factors to determine analysis periods, ensuring the bias timeframe provides trend context while the POI timeframe captures structural formations.
The structural analysis begins with FVG detection, which systematically scans price action to identify imbalances where gaps exist between consecutive candle ranges with no overlapping wicks. When such gaps are detected, the algorithm measures their size against minimum thresholds to filter out insignificant formations. Concurrently, OB recognition analyzes three-candle sequences, examining specific open/close relationships that indicate potential institutional accumulation zones. Once these structural patterns are identified, the algorithm cross-references them against the higher timeframe bias direction, creating a validation filter that only permits entries aligned with the prevailing EMA cross-over state. When price subsequently intersects these validated POI zones, entry signals generate with the system calculating entry levels at zone midpoints, then applying the selected stop loss methodology combined with the configured risk-reward ratio to determine take profit placement.
To mirror realistic trading conditions, the indicator incorporates configurable slippage calculations that account for execution differences between intended and actual fill prices. When trades reach their take profit or stop loss levels, the algorithm applies slippage adjustments that worsen the exit prices in a conservative manner - reducing take profit fills and increasing stop loss impact. This approach ensures backtesting results reflect more realistic performance expectations by accounting for spread costs, market volatility during execution, and liquidity constraints that occur in live trading environments.
It also has a performance dashboard that continuously tracks and displays comprehensive trading metrics:
1/ Bias TF / POI TF: Displays the calculated timeframes used for bias analysis and POI detection, showing the actual periods (e.g., "15m / 5m") that result from the multiplier settings to confirm proper adaptive timeframe selection
2/ Bias Direction: Shows current market trend assessment (Bullish, Bearish, or Sideways) derived from EMA cross-over analysis to indicate which trade directions align with prevailing momentum
3/ Data Processing: Indicates how many price bars have been analyzed by the system, helping users verify if complete historical data has been processed for comprehensive strategy validation
4/ Total Trades: Displays the cumulative number of completed trades plus any active positions, providing volume assessment for statistical significance of other metrics
5/ Wins/Losses: Shows the raw count of profitable versus unprofitable trades, offering immediate insight into strategy effectiveness frequency
6/ Win Rate: Reveals the percentage of successful trades, where values above 50% generally indicate effective entry timing and values below suggest strategy refinement needs
7/ Total R-Multiple: Displays cumulative risk-reward performance across all trades, with positive values demonstrating profitable system operation and negative values indicating net losses requiring analysis
8/ Average R Win/Loss: Shows average risk-reward ratios for winning and losing trades separately, where winning averages approaching the configured take profit ratio indicate minimal slippage impact while losing averages near -1.0 suggest effective stop loss execution
9/ TP Ratio / Slippage: Displays the configured take profit ratio and slippage settings with calculated performance impact, showing how execution costs affect actual versus theoretical returns
10/ Profit Factor: Calculates the ratio of total winning amounts to total losing amounts, where values above 1.5 suggest robust profitability, values between 1.0-1.5 indicate modest success, and values below 1.0 show net losses
11/ Maximum Drawdown: Tracks the largest peak-to-trough decline in R-multiple terms, with smaller negative values indicating better capital preservation and risk control during losing streaks
🟢 How to Use
Start by applying the indicator to your chart and observe its performance across different market conditions to understand how it identifies bias direction and POI formations. Then navigate to the settings panel to configure the Bias Timeframe Multiplier for trend context sensitivity and POI Timeframe Multiplier for structural analysis frequency according to your trading preference and objectives.
Next, fine-tune the EMA periods in Bias Settings to control trend detection sensitivity and select your preferred POI types based on your analytical preference. Proceed to configure your Risk Management approach by selecting from the available stop loss calculation methods and setting the Take Profit ratio that aligns with your risk tolerance and profit objectives. Complete the setup by customizing Display Settings to control table visibility and trade visualization elements, adjusting UI positioning and colors for optimal chart readability, then activate Alert Conditions for automated notifications on trade entries, exits, and bias direction changes to support systematic trade management.
🟢 Examples
OANDA:XAUUSD
CME_MINI:MES1!
CME_MINI:ES1!
CME_MINI:MNQ1!
CBOT_MINI:YM1!
BYBIT:BTCUSDT.P
BINANCE:SOLUSD
*Disclaimer: Past performance is not indicative of future results. None of our statements, claims, or signals from our indicators are intended to be financial advice. All trading involves substantial risk of loss, not just upside potential. Users are highly recommended to carefully consider their financial situation and risk tolerance before trading.

Path of Least ResistancePath of Least Resistance (PLR)
Concept Overview
The Path of Least Resistance indicator identifies key zones on your chart that act like "muddy" or "sticky" areas where price tends to get bogged down, creating choppy and unpredictable price action. Between these zones lie the "empty spaces" - clear paths where price can move freely with momentum and direction.
The Analogy: Muddy Fields vs Open Roads
Think of your chart like a landscape:
🟫 ZONES (Muddy/Sticky Areas)
Fair Value Gaps (FVGs) from higher timeframes
Pivot wick zones from higher timeframe pivots
Areas where price gets "stuck" and churns
Like walking through thick mud - slow, choppy, unpredictable movement
Price action becomes erratic and difficult to trade
🟢 EMPTY SPACES (Open Roads)
The clear areas between zones
Where price can move freely with momentum
Like driving on an open highway - smooth, directional movement
The "Path of Least Resistance" for price movement
Trading Philosophy
AVOID Trading Within Zones:
Price action is typically choppy and unpredictable
Higher probability of false signals and whipsaws
Like trying to drive through mud - you'll get stuck
TRADE Through the Empty Spaces:
Look for moves that travel between zones
Price tends to move with momentum and direction
Higher probability setups with cleaner price action
Like taking the highway instead of back roads
Zone Types Detected
Fair Value Gaps (FVGs)
Imbalances from higher timeframe candles
Areas where price "owes" a return visit
Often act as magnets, creating choppy price action
Pivot Wick Zones
Upper and lower wicks from higher timeframe pivots
Rejection areas where price previously struggled
Often create resistance/support that leads to choppy movement
Color Coding System
The zones dynamically change color based on current price position:
🔴 RED ZONES : Price is below the zone (bearish context)
🟢 GREEN ZONES : Price is above the zone (bullish context)
🔘 GRAY ZONES : Price is within the zone (neutral/choppy area)
The "Mum Trades" Strategy
The best trades - what we call "Mum trades" (trades so obvious even your mum could spot them) - happen in the empty spaces between zones:
✅ High Probability Characteristics:
Clear directional movement between zones
Less noise and false signals
Higher momentum and follow-through
Cleaner technical patterns
❌ Avoid These Areas:
Trading within the muddy zones
Expecting clean moves through sticky areas
Fighting against the natural flow of price
Key Features
Auto Timeframe Detection : Automatically selects appropriate higher timeframe
Dynamic Zone Management : Overlapping zones are automatically cleaned up
Real-time Alerts : Get notified when price enters/exits zones
Visual Clarity : Clean zone display with extending boundaries
How to Use
Identify the Zones : Let the indicator mark the muddy areas
Find the Paths : Look for clear spaces between zones
Plan Your Trades : Target moves that travel through empty space
Avoid the Mud : Stay away from trading within the zones
Follow the Flow : Trade with the path of least resistance
Remember
Price, like water, always seeks the path of least resistance. By identifying where that path is clear (empty spaces) versus where it's obstructed (zones), you can align your trading with the natural flow of the market rather than fighting against it.
The goal is simple: Trade the highways, avoid the mud.

4-EMA Signals + MTF Analysis4-EMA Signals + MTF Analysis Indicator: User Guide
This indicator is designed for active traders; from scalpers / intra-day traders to swing-traders who simply want an easy to understand, simple, but yet comprehensive and easy-to-understand indicator with a quick overview of initial market momentum and overall market direction to assist the trader in their initial trading.
The main feature of this indicator is that It overlays four exponential moving averages (EMAs), and provides a dashboard of real-time trend signals for both buy and sell (long/short) scenarios.
Settings Overview
MA Period Setup
Custom: Set your own EMA periods.
Conservative, Aggressive, Fibonacci: Quickly apply preset EMA period combinations for different trading styles.
EMA Periods (Custom Setup)
Fast EMA: Shortest EMA, reacts quickly to price (default 7).
Medium-Short EMA: Intermediate speed (default 25).
Medium-Long EMA: Slower, filters out more noise (default 70).
Slow EMA: Longest-term trend (default 200).
(These settings can be adjusted to suit your individual needs)
Main Indicator Features
Four EMAs : Plotted in distinct colors (green, yellow, orange, red) for quick trend recognition - this can be altered in colour to your personal preferences.
Buy/Sell Signals : Triangles appear below/above bars when EMA crossovers occur, optionally filtered by volume - the volume filter when applied greatly reduces the influx of signals, only giving high-quality signals!
Trading Sessions + Backgrounds : A trading session feature has been added: (London, New York, Asia, Sydney) with the choice of a background to indicate each global trading session.
Volume Overlay : Volume bars and a blue volume moving average line for context.
Dashboard Table (Top Right):
Market Direction: Shows the overall EMA alignment (bullish, bearish, weak, consolidating).
The initial trend on the 5m, 15m, 1H, and 4H time-frame to give a quick snapshot of overall trend direction.
How to Use
Trend Identification :
-- Use the EMA alignment and dashboard table to quickly see if the market is bullish, bearish, or consolidating.
EMA Set-up
-- Adjust the EMA settings to your specific requirements, the signals will alter depending on the volatility of the instrument your trading.
Signal Confirmation :
-- ''Buy'' signals simply appear when the faster EMAs cross above slower EMAs in and ''Sell'' signals simply appear when they cross below.
Volume Context :
--Use the volume moving average and the optional volume filter to avoid signals during low-activity periods.
No Repainting :
-- All signals and dashboard readings are calculated using only confirmed, closed bars. What you see in real time is exactly what will appear in your back-test — no repainting or look-ahead bias.
Alerts / Notifications
Now for the fun part:
1. Enable Buy/Sell Signal Alerts: Get notifications when buy or sell signals occur.
2. For Alerts to function correctly, set the ''condition'' to the indicator itself.
3. Select ''EMA Bearish Cross'' or ''EMA Bullish Cross'' depending whether you want alerts for either buy/sell signals - Or one can simply set alerts for both scenarios.
4. For ''Interval'' set to ''Same as chart'' - So, the time-frame which you'd like to trade on.
5. For ''Trigger'' set to ''Once Per Bar Close''.
6. Save.
7. Wait for a signal to occur!
NOTE: Before placing a trade, it's often best to also assess the market conditions at that time also - and not rely solely on the signals, the signals are to assist, and it's often occurred a signal has shown, but a pull-back occurs, and a FVG in discount holds -- it's this FVG holding, accompanied by volume, that's the real entry, possibly.
Tip: For the cleanest results, use the indicator during the most active sessions and always check multi-time-frame trend alignment before entering trades. Good Luck! :)

CandelaCharts - Unicorn Model📝 Overview
The Unicorn Model is an advanced indicator that pinpoints high-probability reversal setups based on the ICT Unicorn formation. It uses a zigzag-based structure to detect engineered liquidity grabs followed by sharp displacements in the opposite direction—ideal for fade entries or the start of new trends.
The indicator is enhanced with macro time filters, allowing it to align model detections with key trading sessions and institutional flow windows.
The ICT Unicorn Model is a precision-driven intraday strategy rooted in smart money concepts. It combines time-of-day sensitivity, engineered liquidity runs, and institutional order flow to uncover high-quality trading opportunities.
📦 Features
Liquidity Levels: Projects forward-looking liquidity zones after a Unicorn model is confirmed, highlighting potential price targets. These zones act as magnet areas where price is likely to be drawn, helping traders manage exits, partials, and re-entries with greater precision.
Unicorn: The Unicorn formation utilizes a smart money framework and a dynamic zigzag detection method to identify engineered liquidity grabs—sharp sweeps of previous highs or lows—followed by impulsive reversals.
Macros: These time-based intervals represent key moments when institutional algorithms are most active, seeking liquidity, rebalancing, or delivering price to key levels like fair value gaps and liquidity pools.
Custom TF Pairing: Choose your preferred combination of entry timeframe and context timeframe. For example, trade 5m setups within a 1h HTF bias, allowing precise alignment of microstructure with broader directional intent.
HTF & LTF PD Arrays: Displays high- and low-timeframe PD Arrays (e.g., Fair Value Gaps, Inversion Fair Value Gaps) that act as zones of interest or rejection, enhancing confluence and risk control.
History: Backtest previous Unicorn setups directly on the chart. Toggle historical models to analyze past behavior, improve your confidence, and fine-tune your trade execution across varying market regimes.
Killzone Filter: Restrict signal generation to specific trading sessions or killzones (e.g., London Open, New York AM). This minimizes false positives in low-volume or overlapping ranges.
Standard Deviation: Dynamically calculates and plots four deviation bands from the model confirmation point. These levels offer insight into stretch targets, volatility bands, and potential mean-reversion zones.
Dashboard: A real-time control panel showing the active model, HTF candle timer, current directional bias, asset name, and session date—offering clarity and fast decision-making at a glance.
⚙️ Settings
Core
Status: Filter models based on status
Bias: Controls what model type will be displayed, bullish or bearish
Fractal: Controls the timeframe pairing that will be used
Length: Sets the maximum number of candles allowed for a model to develop
Labels: Display the model label (e.g., C1, C2, Cn)
Unicorn
Zigzag: Adjusts the length of the Zigzag formation
Breaker: Defines the style of Breaker Blocks
Sweeps
Sweep: Shows the sweep that forms a model
I-sweep: Controls the visibility of invalidated sweeps
D-purge: Plots the double purge sweeps
S-area: Highlights the sweep area
Liquidity
Liquidity: Displays the liquidity levels that belong to the model
History
History: Controls the number of past models displayed on the chart
Filters
Asia: Filter models based on Asia Killzone hours
London: Filter models based on London Killzone hours
NY AM: Filter models based on NY AM Killzone hours
NY Launch: Filter models based on NY Launch Killzone hours
NY PM: Filter models based on NY PM Killzone hours
Custom: Filter models based on user Custom hours
HTF
Candles: Controls the number of HTF candles that will be visible on the chart
NY Open: Display True Day Open line
Offset: Controls the distance of HTF from the current chart
Space: Controls the space between HTF candles
Size: Controls the size of HTF candles
PD Array: Displays ICT PD Arrays
CE Line: Style the equilibrium line of PD Array
Border: Style the border of the PD Array
LTF
H/L Line: Displays on the LTF chart the High and Low of each HTF candle
O/C Line: Displays on the LTF chart the Open and Close of each HTF candle
PD Array: Displays ICT PD Arrays
CE Line: Style the equilibrium line of PD Array
Border: Style the border of the PD Array
Standard Deviation
StDev: Controls standard deviation of available levels
Labels: Controls the size of standard deviation levels
Anchor: Controls the anchor point of standard deviation levels (wick, body)
Lines: Controls the line widths and color of standard deviation levels
Dashboard
Panel: Display information about the current model
💡 Framework
The Unicorn Model analyzes price action by combining key elements to identify high-probability trade setups. It detects liquidity sweeps and uses a zigzag method to spot Breaker Blocks. The model maps PD Arrays like Fair Value Gaps and Inversion FVGs for precision zones, integrates macro time filters for context, and projects forward price targets based on liquidity clusters. Together, these components provide a clear framework to anticipate market trends and optimize entries and exits.
The model incorporates the following timeframe pairing:
15s - 5m
1m - 15m
1m - 30m
2m - 20m
3m - 30m
3m - 60m
5m - 1H
15m - 4H
15m - 8H
30m - 9H
30m - 12H
1H - 1D
2H - 2D
3H - 3D
4H - 1W
8H - 2W
12H - 3W
1D - 1M
2D - 2M
1W - 3M
2W - 6M
3W - 9M
1M - 12M
Below are the key components that make up the model:
Sweep
D-purge
Zigzag (Breaker)
PD Arrays (FVG, IFVG)
Macros
Standard Deviation
Liquidity
The Unicorn Model operates through a defined lifecycle that tracks its current stage, helping to assess the validity of potential trade opportunities.
The model's lifecycle includes the following statuses:
Formation (grey)
Invalidation (red)
Success (green)
Through the phases of Formation, Invalidation, and Success, traders can effectively manage positions, minimize risk, and capitalize on the high-probability setups presented by the Unicorn Model.
⚡️ Showcase
The Unicorn Model is an advanced trading framework designed to elevate your market analysis and increase your trading edge. By leveraging smart money concepts and sophisticated pattern detection, it helps you spot key liquidity sweeps, reversal zones, and high-probability setups, enabling more precise entries, exits, and risk management tailored to market structure.
LTF PD Array
LTF PD Arrays are crucial to the Unicorn Model and must align with the Zigzag Breaker for the setup to be considered valid.
HTF PD Array
Higher-Timeframe PD Arrays deliver essential macro context, serving to validate both the direction and momentum of potential reversals.
Timeframe Alignment
Timeframe alignment is a fundamental element of the Unicorn trading model. By integrating multi-timeframe context, the model effectively identifies high-probability models.
Killzone Filters
Filter Unicorn Models according to key market sessions—Asia, London, New York AM, New York Launch, and New York PM—to target periods of high liquidity. This approach improves the accuracy and timing of trade setups by capturing moments when smart money is most active.
Macros
The Unicorn Model uses ICT Macro Times to identify key trading periods when institutional activity is most intense. By syncing setups with these critical windows, the model improves accuracy and provides better context for entries, risk management, and potential reversals.
Gain a trading advantage with the Unicorn Model — your essential tool for clearer insights, smarter decision-making, and more confident trade execution.
🚨 Alerts
This script provides alert options for all model types, which must be configured within TradingView.
Bearish Model
A bearish model alert is triggered when a model forms, signaling a 4 Zigzag points formation and a bearish Breaker.
Bullish Model
A bullish model alert is triggered when a model forms, signaling a 4 Zigzag points formation and a bullish Breaker.
⚠️ Disclaimer
These tools are exclusively available on the TradingView platform.
Our charting tools are intended solely for informational and educational purposes and should not be regarded as financial, investment, or trading advice. They are not designed to predict market movements or offer specific recommendations. Users should be aware that past performance is not indicative of future results and should not rely on these tools for financial decisions. By using these charting tools, the purchaser agrees that the seller and creator hold no responsibility for any decisions made based on information provided by the tools. The purchaser assumes full responsibility and liability for any actions taken and their consequences, including potential financial losses or investment outcomes that may result from the use of these products.
By purchasing, the customer acknowledges and accepts that neither the seller nor the creator is liable for any undesired outcomes stemming from the development, sale, or use of these products. Additionally, the purchaser agrees to indemnify the seller from any liability. If invited through the Friends and Family Program, the purchaser understands that any provided discount code applies only to the initial purchase of Candela's subscription. The purchaser is responsible for canceling or requesting cancellation of their subscription if they choose not to continue at the full retail price. In the event the purchaser no longer wishes to use the products, they must unsubscribe from the membership service, if applicable.
We do not offer reimbursements, refunds, or chargebacks. Once these Terms are accepted at the time of purchase, no reimbursements, refunds, or chargebacks will be issued under any circumstances.
By continuing to use these charting tools, the user confirms their understanding and acceptance of these Terms as outlined in this disclaimer.

Breaker Blocks & Unicorns (with Deviations) by RiseBreaker Block and Unicorns (with Deviations) - The Highest Probability ICT Pattern
This advanced indicator identifies and tracks ICT Breaker Blocks, while incorporating powerful supplementary features including Unicorn patterns and customizable deviation levels.
These patterns develop through a precise market structure sequence culminating in structural breaks. Following Breaker Block confirmation, users can optionally enable highly customizable deviation levels. Additionally, the indicator can scan active Breaker Blocks for overlapping Fair Value Gaps (FVGs) and Inverted Fair Value Gaps (IFVGs)-(also known as "Unicorns") that represent high-probability trading opportunities, highly regarded in the ICT community.
This comprehensive tool provides unmatched functionality for traders and analysts seeking to track, backtest, and execute Breaker Block strategies. With its extensive feature set and granular customization options, it delivers capabilities that surpass existing alternatives in the market.
What is an ICT Breaker Block?
To explain this, we must understand the ABC sequence that form this pattern. It consists of:
Initial range (from A -> B)
First break point, commonly called "Manipulation" (C)
Second break, which is when the pattern is formed.
Each of these "points" consist of pivot levels, with an adjustable strength.
Breaker Blocks are invalidated and made inactive if price breaks the "C point", or manipulation.
Unicorns
Unicorns are Fair Value Gaps or Inverted Fair Value Gaps that overlap a Breaker Block. Breakers have their associated Unicorn, which is updated until price retraces into said gap.
Standard Deviations
This indicator has options to display deviations based on Breaker Blocks:
Breaker Deviations -> using the initial range (A -> B).
Manipulation Deviations -> using the manipulation (B -> C).
Input Settings:
This tool offers a lot of customizable options, which could be overwhelming to some users. Below you will find an in-depth definition of every input's purpose, to complement the tooltips that can be found directly in the indicator's settings.
Mode ⚙️
Default -> Displays every Breaker Block pattern found.
Bullish -> Displays every Bullish Breaker Block found.
Bearish -> Displays every Bearish Breaker Block found.
Reversals -> Displays alternate Breaker Blocks (Bearish -> Bullish -> Bearish and so on).
This is paired with a Historical input, to select the amount of previous Breakers to display.
Extend 📏
Last -> This option will extend the most recent Breaker's drawings.
Specified -> Extend Breakers a preset amount of bars.
All -> Extend all active Breakers to the current bar.
None -> Never extend Breaker Blocks.
Each object has it's specific " offset " parameter, which defines the amount of bars to extend drawings past the current bar.
Parameters
This section defines the main parameters used to define the Breaker Block pattern.
Time Filter -> Optional session to filter Breakers based on time of day.
Pivot Strength -> Determines how many consecutive bars to the left of a pivot must be lower (for highs) or higher (for lows) to confirm it as a point.
Range Lookback -> Amount of ranges that the indicator will keep track for each direction.
Breaker Type -> Defines how a Breaker Block is displayed:
Range -> Entire initial range.
Consecutive -> Last consecutive onside candles (upclose for bullish, downclose for bearish).
Last -> Last onside candle.
Breaker Offset -> Amount of bars to extend Breaker Blocks past the current bar.
Use Candle Bodies? -> Use bar open to close rather than high to low.
Require Candle Close? -> Use bar close to form Breaker Blocks.
Remove After Invalidation? -> Remove drawings for invalidated Breakers.
Style
Breaker Block boxes styling based on directions.
Optional Middle Line and styling.
Optional Signals for Breaker Block formation:
Triangle label with adjustable sizing on the formation bar.
Line with custom styling at breakout point to the formation bar.
Unicorn Fair Value Gaps
Checkbox to display Unicorns with adjustable "FVGs", "IFVGs", or "Both" types.
Overlap Threshold -> Distance away from Breaker to still consider an "overlap".
Unicorn Offset -> Amount of bars to extend unicorn gaps past the current bar.
Lines styling.
Optional Middle Line and styling.
Include Volume Imbalances? -> Include adjacent VIs as part of Fair Value Gaps.
Extend until Reached? -> Extend Unicorn drawings until price reaches them.
Deviations
Checkbox to display Standard Deviations with adjustable types and levels.
Lines styling.
Text size and positioning.
Extend until Reached? -> Extend deviation lines until price reaches them.
Text
Label contents:
Default -> "+/- Breaker".
Abbreviation -> "+/- BB".
None -> No text.
Size .
Font (Default or Monospace) and Format (None, Italic or Bold).
Align -> vertical and horizontal positioning.
This indicator is for educational and informational purposes only. Past performance and historical patterns do not guarantee future results. Trading involves substantial risk of loss and is not suitable for all investors. Always conduct your own analysis and consider your financial situation before making any trading decisions. The identification of patterns does not constitute trading advice.
For any additional questions and/or feedback related to this indicator, users can comment below!

Anchored VWAP by Time (Math by Thomas)📄 Description
This tool lets you plot an Anchored Volume Weighted Average Price (VWAP) starting from any specific date and time you choose. Unlike standard VWAPs that reset daily or weekly, this version gives you full control to track institutional pricing zones from precise anchor points—such as key swing highs/lows, market open, or news-driven candles.
It’s especially useful for price action and Smart Money Concepts (SMC) traders who track liquidity, fair value gaps (FVGs), and institutional zones.
🇮🇳 For NSE India Traders
You can anchor VWAP to Indian market open (e.g., 9:15 AM IST) or major events like RBI policy, earnings, or breakout candles.
The time input uses UTC by default, so for Indian Standard Time (IST), remember:
9:15 AM IST = 3:45 AM UTC
3:30 PM IST = 10:00 AM UTC
⚙️ How to Use
Add the indicator to your chart.
Open the settings panel.
Under “Anchor Start Time”, choose the date & time to begin the VWAP.
Use UTC format (adjust from IST if needed).
Customize the line color and thickness to suit your chart style.
The VWAP will begin plotting from that time forward.
🔎 Best Use Cases
Track VWAP from intraday range breakouts
Anchor from swing highs/lows to identify mean reversion zones
Combine with your FVGs, Order Blocks, or CHoCHs
Monitor VWAP reactions during key macro events or expiry days
🔧 Clean Design
No labels are used, keeping your chart clean.
Works on all timeframes (1min to Daily).
Designed for serious intraday & positional traders.

0x278's Swing-Failure-Pattern (SFP)0x278's Swing-Failure-Pattern (SFP) ‑ Confirmed Short
Table of Contents
Introduction
Core Concept – What Is an SFP?
How the Indicator Works
Visual Elements & Their Meaning
Input Parameters Explained
Step-by-Step Trading Playbook
Example Workflow (Daily BTC-USDT)
Alerts & Automation
Tips, Tricks & Best Practices
FAQ
Advanced Configuration & Asset-Class Playbook
1. Introduction
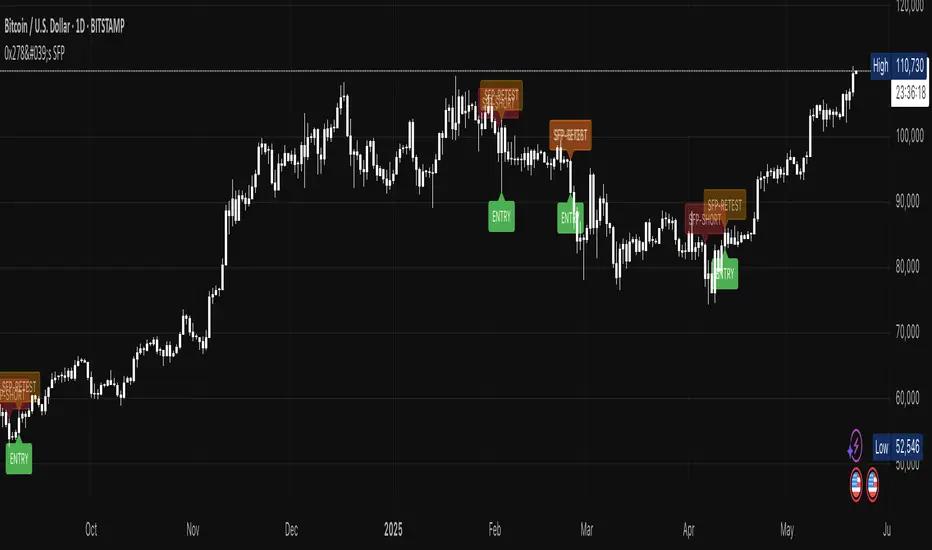
The Swing-Failure-Pattern (SFP) – Confirmed Short indicator spots and tracks bearish SFPs on any market and timeframe, with defaults tuned for Daily charts.
A bearish SFP occurs when price sweeps a prior swing high (liquidity grab) and then decisively rejects lower , signalling a possible trend reversal or sharp pullback.
This script automatically:
Identifies the liquidity sweep & rejection (‐"SFP-SHORT" label)
Confirms directional intent via a structure-breaking close below the setup low
Paints a preferred sell-on-retest zone and tracks its validity
Identifies optimal entry opportunities when price retests the zone
Generates optional retest and entry alerts when trading conditions appear
Self-cleans after a configurable number of bars – keeping your chart tidy
Default Timeframe : Daily
Default Market : Crypto / FX majors
Works On : All symbols + timeframes – simply adjust parameters.
2. Core Concept – What Is an SFP?
Sweep (Liquidity Grab) – Price trades above a meaningful swing high, triggering stops & inducing breakout buyers.
Rejection – The same bar (or the next) closes back below the swept high, invalidating the breakout.
Structure Break – Bears confirm intent by closing below the "setup low" (the most recent pivot low before the sweep).
Retest – Price retraces to the sweep zone. Traders seek entries inside the upper half of that zone with invalidation just above the swing high.
The indicator encodes these four steps so you can spot high-quality bearish reversals without manual bar-by-bar analysis.
3. How the Indicator Works
Phase: Sweep & Rejection
Script Logic: high > lastSwingHigh and close < lastSwingHigh
Visual Cue: Red SFP-SHORT label above candle
Phase: Structure Break
Script Logic: Close < setupLow while pattern locked
Visual Cue: Zone (red line-box) plotted; SFP-SHORT label stays
Phase: Retest Tracking
Script Logic: Zone stays active for retestExpiry bars or until tapped
Visual Cue: Orange SFP-RETEST label when hit
Phase: Entry Signal
Script Logic: Price rejection within retest zone
Visual Cue: Green ENTRY label at optimal entry point
Phase: Expiry / Cleanup
Script Logic: Zone deleted after expiry
Visual Cue: Labels fade but remain visible for reference
All calculations reset after each completed/expired pattern ensuring fresh, uncluttered signals.
4. Visual Elements & Their Meaning
SFP-SHORT (red) – Bar that swept a prior high and closed below it.
Red Box / Line – Preferred sell zone between the swing high (upper bound) and dynamic lower bound (see sizing methods). Extends right until filled/expired.
SFP-RETEST (orange) – Bar that first tags the zone after confirmation.
ENTRY (green) – Appears when a high-probability entry signal occurs within the retest zone.
EXPIRED (gray) – Appears when the retest zone expires without being hit.
Visual Persistence – Labels fade but remain visible after expiry for reference and historical analysis.
5. Input Parameters Explained
Pivot Detection
Pivot left / right : Bars left/right of the pivot that must stay below/above it. Tip : Symmetrical values (3/3) work best for clean structure.
Retest Management
Retest expiry (bars) : Lifespan of a retest zone before it is considered stale. Default: 14 bars on Daily . Tip : Shorten for intraday, lengthen for swing trading.
Retest Zone Sizing
Sizing method : Select Static %, ATR-based or Hybrid logic for the lower boundary. Tip : Hybrid balances tight stops with realistic fills.
Static % : Fixed fraction of sweep range when Static/Hybrid is selected. Tip : Higher % deepens zone & widens stop.
ATR period : Look-back length for ATR when volatility sizing is used. Tip : Increase to smooth choppy markets.
ATR multiplier : Multiplier applied to ATR in ATR-based/Hybrid mode. Tip : Higher value widens zone during volatility.
Visual – Retest Zone
Show retest zone box : Toggles drawing of the semi-transparent sell zone box. Tip : Disable for ultra-clean look.
Retest box color : Fill colour of the box (alpha = transparency). Tip : Match your chart theme.
Max retest boxes : How many historical boxes remain visible (0 = unlimited). Tip : Lower to boost performance.
Only show active boxes : Automatically deletes a box once it's hit. Tip : Reduces clutter during back-testing.
Visual – General
Minimal mode : Hides most visuals apart from critical labels. Tip : Ideal for screenshots.
Show retest zone line : Draws a vertical line linking upper/lower boundaries. Tip : Acts as a quick depth guide.
Show ENTRY labels : Plots 'ENTRY' on optimal candles. Tip : Turn off for manual confirmation.
Labels
Label size : Overall size of all labels. Tip : tiny / small / normal.
Use simple label style : Switches to pixel text style for labels. Tip : Faster rendering on low-spec machines.
Advanced
minPct / maxPct (hard-coded) : Internal floor/cap for Hybrid logic. Tip : Exposed in code for power-users only.
Zone-Sizing Methods
Static – Lower bound = sweepRange × staticPct.
ATR-based – Lower bound = ATR × multiplier, normalised to the sweepRange.
Hybrid – Uses the greater of Static and ATR-based (capped by an internal safety ceiling).
6. Step-by-Step Trading Playbook
Identify Context – Prefer setups against extended moves into obvious highs (e.g., daily swing highs, prior week high, round numbers).
Wait for SFP Confirmation – The indicator will label an SFP-SHORT only after the candle closes. Do not front-run.
Structure-Break Close – A close below setupLow turns the zone live. This is your go signal – prepare sell orders.
Place Orders in the Zone
Entry : Limit order anywhere between retestLower and the swing high.
Stop : 1-2 ticks/pips above the swing high.
Risk Management
Size position so risk per trade ≤ account risk % (common: 0.5-1%).
If no retest before retestExpiry bars → cancel order .
Targets
Conservative: First liquidity pocket / FVG below.
Aggressive: 2-3× risk or next HTF support.
Trail or Partial – Consider trailing stop once 1R is achieved or partial profit at 1R.
7. Example Workflow (Daily BTC-USDT)
BTC trades to a fresh one-month high at $31 050 sweeping prior highs.
Candle closes at $30 420 – below the swept high – SFP-SHORT label appears.
Two days later, candle closes below setupLow at $29 880 – confirmation & zone plotted (upper = $31 050, lower ≈ $30 550).
Five days later price retests the zone hitting $30 750 – SFP-RETEST alert fires, trade filled.
Stop placed @ $31 120 (70$ risk). 1R target = $29 680 reached four days later.
8. Alerts & Automation
SFP Short confirmed
Fires When: Structure-break close below setupLow.
Suggested Action: Prepare/submit sell-limit order in the zone.
SFP Short retest
Fires When: Price enters the retest zone.
Suggested Action: Monitor for entry signals or prepare for manual entry.
SFP Short Entry Signal
Fires When: Optimal entry conditions detected within retest zone.
Suggested Action: Execute short trade with defined risk parameters.
Use TradingView's Webhook URL to forward alerts to a trade-execution bot (e.g., PineConnector) for automated order placement.
9. Tips, Tricks & Best Practices
Combine with HTF Bias – Only take bearish SFPs in bearish weekly trend.
Watch Volume – High volume on the sweep bar adds conviction.
Time Window – SFPs during NY session FX / US session crypto tend to be stronger.
Cluster Zones – Multiple overlapping SFP zones increase probability; treat the cluster as one larger supply.
Avoid News – Skip SFPs forming minutes before high-impact macro news.
10. FAQ
Q: Can I use this on lower timeframes?
A: Yes – reduce retestExpiry (e.g., 15 bars on 15-minute) and test ATR-based sizing.
Q: Does it work for longs?
A: This script focuses on bearish SFPs. Clone & invert conditions for longs.
Q: Why did a zone disappear?
A: Either it expired (retestExpiry) without a retest or the cleanup routine removed old visuals to stay within Pine limits (500 objects per type).
Q: What's the difference between the "SFP-RETEST" and "ENTRY" signals?
A: "SFP-RETEST" indicates price has entered the zone, while "ENTRY" signals an optimal entry opportunity based on price rejection within the zone.
Q: How do I customize the label appearance?
A: Use the "Label size" and "Use simple label style" settings to adjust all labels to your preferred visual style.
Happy trading & trade safe!
11. Advanced Configuration & Asset-Class Playbook
Why does the retest box feel "too high" and how do I actually get filled? Use the quick tweaks below or the power-user code snippet to shape the zone to your personality and instrument.
11.1 Why the default box is shallow
The Static 25 % / ATR-Hybrid logic keeps stops small. Around 50 % of Daily BTC SFPs never look back – that's the cost of tight risk. If you need higher fill-rates, deepen the zone (11.2).
11.2 Three slider moves – no coding required
Retest zone sizing method – switch Static → Hybrid or ATR-based
Static % – raise from 0.25 → 0.45-0.60
ATR multiplier – raise from 1.0 → 1.5-2.0
Each turn pulls the lower edge of the box deeper while keeping the invalidation at the swing high.
11.3 One-liner for coders
To allow >60 % of the sweep range edit the source:
Old code:
minPct = 0.05
maxPct = 0.60
New code:
minPct = 0.05
maxPct = input.float(0.60, "Max retest % of sweep", step = 0.05, minval = 0.10, maxval = 0.95)
Then dial the cap up to ~0.80-0.90 from the settings panel.
11.4 If price never comes back…
No-retest partial – take 25-40 % size on the confirmation candle, stop above the high.
Lower-TF confirmation – drop to 4 h / 1 h and hunt an internal SFP or bearish FVG inside the sweep.
ATR trail – if price dumps immediately, trail the stop above each new lower-high.
11.5 Asset-Class Cheat-Sheet
Crypto – Daily : Static %: 0.20-0.35, ATR mult: 1.0, Retest Expiry: 12-20 . Notes : High volatility; sweeps expand fast.
FX Majors – 4 h/D : Static %: 0.25-0.40, ATR mult: 1.2, Retest Expiry: 15-25 . Notes : ATR handles session compression.
Index Futures – 1 h : Static %: 0.30-0.50, ATR mult: 1.5, Retest Expiry: 10-20 . Notes : Hybrid recommended; gaps tighten sweeps.
US Equities – 30 m : Static %: 0.35-0.55, ATR mult: 1.5-2.0, Retest Expiry: 10-14 . Notes : Consider no-retest entry on earnings spikes.
Always forward-test on your own symbol & timeframe ✔️
Advanced SMC Market Structure AnalyzerAdvanced SMC Market Structure Analyzer
Version 1.0 • by Rendon1
Short Description:
A multi-timeframe Smart Money Concepts (SMC) toolkit for detecting Breaks of Structure (BOS), Changes of Character (CHoCH), liquidity zones, order blocks, fair-value gaps, and raw entry signals—all in one overlay indicator.
🔍 Overview
This script analyzes both a higher timeframe (e.g. 4H) for market structure shifts and a lower “entry” timeframe (e.g. 5–30 m) to flag optimal entries. It visually marks:
BOS (Higher-Highs/Bearish BOS & Lower-Lows/Bullish BOS)
CHoCH (structure flips)
Liquidity Zones (equal highs/lows)
Order Blocks (last candle before a directional move)
Fair-Value Gaps on the entry timeframe
Buy/Sell Labels when multiple conditions align
⚙️ Features
Multi-Timeframe Structure: Define your higher-timeframe for HTF swings and a customizable lower-timeframe for precision entries.
Swing Sensitivity: Adjustable pivot lookback (default 5 bars).
Liquidity Detection: Highlights market stagnation points via equal highs/lows.
Order Blocks & FVG: Identifies key institutional zones on both HTF and LTF.
Automated Entry Signals: Composite logic combining CHoCH with LTF order blocks or fair-value gaps.
Alerts Built-In: “Bullish Entry,” “Bearish Entry,” “CHoCH Detected,” and “BOS Detected.”
⚙️ Inputs
Setting Default Description
Swing Detection Sensitivity 5 Lookback bars for pivot detection (higher = smoother)
Show Structure Labels ☑️ Toggle visual BOS/CHoCH labels
HTF Structure Timeframe 240 Higher-timeframe (minutes) for market structure
Entry Structure Timeframe 15 Lower-timeframe for order block & FVG entries
Liquidity Lookback 3 Bars to check for equal highs/lows
📖 How to Use
Add to Chart: Apply the indicator to any symbol.
Configure Timeframes: Choose your preferred HTF (e.g. 4H) and LTF (e.g. 15 m).
Interpret Signals:
Blue “BOS” labels mark momentum breaks on HTF.
Orange “CHoCH” labels indicate structure flips.
Green “🟢 BUY” and Red “🔴 SELL” labels appear when HTF flips align with LTF zones.
Set Alerts: Right-click any of the built-in alert conditions to add real-time notifications.
⚠️ Disclaimer
This script is for educational purposes only and does not constitute financial advice. Trading involves risk, and you should perform your own analysis before making any trades. The author is not liable for any losses or gains resulting from the use of this indicator.

ICT-Elliott Hybrid Oscillator네이버 프리미엄 콘텐츠 > 재테크 사관학교 검색
This indicator uses Elliott Wave Theory and ICT (Inner Circle Trader) concepts to help easily and accurately predict when asset prices like cryptocurrencies or stocks will rise or fall.
📌 Easy Explanation of Terms
✅ What is Elliott Wave?
A theory stating that price movements follow a specific pattern (5 upward waves + 3 downward waves) repeatedly. Simply put, it's about repetitive cycles of rises and falls creating overall trends.
✅ What is ICT Theory?
A strategy that identifies optimal trading times by observing critical price areas traded by institutional investors (Order Blocks), imbalances in price (Fair Value Gaps - FVG), and major turning points (Break of Structure - BOS).
📈 Signals Provided by the Indicator
🔹 ① Pivot Highs & Lows
Red ▼: Short-term high (increased likelihood of price falling)
Green ▲: Short-term low (increased likelihood of price rising)
🔹 ② Fair Value Gap (FVG)
Green highlighted area: Zone where price is likely to rise again
Red highlighted area: Zone where price is likely to fall again
🔹 ③ Break of Structure (BOS)
Blue "BOS Up": Indicates a shift to an upward trend
Orange "BOS Down": Indicates a shift to a downward trend
⏳ Recommended Timeframe Combinations
| Major Trend (Basic Analysis) | Entry Point (Detailed Analysis) | Short-term Timing (Precision Analysis) |
| ---------------------------- | ------------------------------- | -------------------------------------- |
| 4-hour | 1-hour | 15-minute |
Use the 4-hour timeframe to gauge overall trends,
the 1-hour timeframe to pinpoint exact entry and exit points,
and the 15-minute timeframe for precise timing.
Include Source
🕯 Recommended Candle Patterns
* Pin Bar (Long wick candle) → Trend reversal signal
* Engulfing Candle (fully covering previous candle) → Strong trend reversal signal
* Hammer & Shooting Star (small body with a long wick) → Bullish or bearish reversal signal
* Doji (balance between buyers and sellers) → High potential for trend reversal

US30 Smart Money 5M/4H Strategy🧠 How It Works
✅ 1. 4H Trend Bias Detection
Uses the 4-hour chart (internally) to determine if the market is in an uptrend or downtrend.
Background turns green for bullish trend, red for bearish trend.
This helps filter trades — only take longs during uptrend, shorts during downtrend.
✅ 2. Liquidity Sweeps (Stop Hunts) on 5M
Highlights candles that break previous highs/lows and then reverse (typical of institutional stop raids).
Draws a shaded red box above sweep-high candles and green box under sweep-lows.
These indicate key reversal zones.
✅ 3. Order Block Zones
Detects bullish/bearish engulfing patterns after liquidity sweeps.
Draws a supply or demand zone box extending forward.
These zones show where institutions likely placed large orders.
✅ 4. FVG Midpoint from 30-Min Chart
Detects Fair Value Gaps (imbalances) on the 30-minute chart.
Plots a line at the midpoint of the gap (EQ level), which is often revisited for entries or rejections.
✅ 5. Buy/Sell Signals (Non-Repainting)
Buy = 4H uptrend + 5M liquidity sweep low + bullish engulfing candle.
Sell = 4H downtrend + 5M liquidity sweep high + bearish engulfing.
Prints green “BUY” or red “SELL” label on the chart — these do not repaint.
📈 How to Use It
Wait for trend bias — only take trades in the direction of the 4H trend.
Watch for liquidity sweep boxes — these hint a stop hunt just occurred.
Look for a signal label (BUY/SELL) — confirms entry criteria.
Use FVG EQ lines & Order Block zones as confluence or targets.
Take trades after NY open (9:30 AM EST) for best momentum.

ICT Turtle Soup (Liquidity Reversal)ICT Turtle Soup — Liquidity Reversal Detection
Trap the Trap: A Precision Reversal Strategy from the Inner Circle Trader Playbook
This indicator implements the Turtle Soup liquidity reversal setup — a widely used ICT (Inner Circle Trader) concept that targets false breakouts beyond recent swing highs or lows. These patterns typically occur when price grabs liquidity above or below a known level, then snaps back, trapping retail traders and creating a high-probability reversal scenario.
🔍 What This Script Does:
Detects Liquidity Sweeps Above/Below Key Swing Levels
Uses a customizable swing lookback to identify recent swing highs and lows.
Triggers a Bearish Turtle Soup when price runs above a previous swing high and closes back below.
Triggers a Bullish Turtle Soup when price sweeps below a prior swing low and closes back above.
Plots Clear Visual Signals
Reversal signals appear as 🐢🔻 (Bearish) or 🐢🔺 (Bullish) markers directly on your chart.
Optional labels can be enabled for enhanced journaling and review.
Real-Time Alerts
Receive alert notifications when a Turtle Soup setup is detected — ideal for scalpers or intraday traders watching for reversals around liquidity pools.
⚙️ Customization Options:
Set the swing lookback sensitivity (default: 5)
Enable or disable labels
Choose label font size
Customize colors for bullish and bearish signals
💡 How to Use:
Deploy on intraday timeframes (e.g. 5m–15m) for high-resolution liquidity analysis.
Watch for signals at key highs/lows, session extremes, or zones where liquidity is likely resting.
Combine with tools like FVGs, Order Blocks, and OTE zones for layered confirmation.
🔗 Combine With These Tools for a Complete SMC Edge:
✅ First FVG — Opening Range Fair Value Gap Detector
✅ ICT SMC Liquidity Grabs + OB + Fibonacci OTE Levels
✅ Liquidity Levels — Smart Swing Lows
Together, these tools form a high-precision Smart Money toolkit — helping traders map, anticipate, and act on institutional-level liquidity events with clarity and confidence.

ICT Turtle Soup (Liquidity Reversal)ICT Turtle Soup — Liquidity Reversal Detection
Classic Liquidity Trap Reversal Strategy for Smart Money Traders
This indicator implements the ICT Turtle Soup concept — a classic liquidity-based reversal pattern — which occurs when price runs above or below a recent swing level to grab liquidity, then sharply reverses. This pattern is commonly used in Smart Money Concepts (SMC) and Inner Circle Trader (ICT) strategies to anticipate false breakouts and high-probability reversals.
🔍 What This Script Does:
Identifies Swing Highs & Lows
Detects recent swing highs and lows using a customizable lookback period.
Tracks Liquidity Grabs
A bearish Turtle Soup setup is triggered when price breaks above a recent swing high but closes back below it.
A bullish Turtle Soup setup is triggered when price breaks below a recent swing low but closes back above it.
These conditions often signal liquidity traps, where price sweeps resting orders before reversing.
Plots Signals Directly on the Chart
Turtle Soup setups are marked with 🐢🔻 (bearish) and 🐢🔺 (bullish) labels.
Optional full-text labels can also be displayed for clarity and journaling.
Includes Alert Conditions
Alerts can be enabled to notify you of bullish or bearish Turtle Soup reversals in real-time.
⚙️ Customization Features:
Adjustable swing lookback period
Enable/disable Turtle Soup labels
Set label font size
Choose your preferred bullish/bearish signal colors
💡 How to Use:
Add this script to your chart (ideally on intraday timeframes such as 5m–15m).
Wait for a Turtle Soup signal near a key swing high/low or liquidity zone.
Combine with other confirmation tools (e.g., FVGs, Order Blocks, OTE) for stronger setups.
Use alerts to stay ahead of fast-moving reversals.
🧠 Why It Works:
Turtle Soup setups are rooted in liquidity theory — they exploit the market’s tendency to sweep obvious swing levels before reversing. These moves often trap retail traders and mark the beginning of Smart Money entries.
🔗 Best Used With:
Maximize the edge by combining this with other SMC tools:
✅ First FVG — Opening Range Fair Value Gap Detector
✅ ICT SMC Liquidity Grabs + OB + Fibonacci OTE Levels
✅ Liquidity Levels — Smart Swing Lows
Together, they create a complete ecosystem for identifying, confirming, and executing liquidity-driven trade setups with precision.

ICT Concepts [SB]ICT Market Structure Shift (MSS) Alert Indicator
This indicator identifies Market Structure Shifts (MSS) based on ICT concepts, helping traders spot key reversal or continuation points in price action.
Features:
✅ Detects bullish and bearish MSS using swing highs and swing lows.
✅ Customizable lookback period to fine-tune structure identification.
✅ Alerts for confirmed MSS when price breaks structure with momentum.
✅ Option to filter MSS by higher timeframe bias for confluence.
✅ Highlights liquidity sweeps before a shift to confirm smart money activity.
✅ Works on all timeframes and asset classes, including Forex, Stocks, Crypto, and Futures.
How It Works:
Bullish MSS: Occurs when price breaks above a recent swing high after taking out a previous swing low (liquidity grab).
Bearish MSS: Occurs when price breaks below a recent swing low after taking out a previous swing high.
Can be used standalone or combined with FVGs, Order Blocks, and Premium/Discount zones for high-probability setups.
Best Usage:
Scalping: 1m–5m timeframe for intraday reversals.
Intraday Trading: 15m–1H for session-based structure shifts.
Swing Trading: 4H–Daily for macro trend reversals.
Look for retest of MSS for entries after they fail as appears in chart highlighted by green horizontal lines or FVG to support after shifts.
Perfect for traders who use ICT, Smart Money Concepts (SMC), and Market Structure-based strategies.
CandelaCharts - Fractal Range Model📝 Overview
The Fractal Range Model (FRM) is an all-encompassing and sophisticated trading framework that incorporates multiple market dynamics to provide a deeper understanding of price movements.
This model is built around several key principles, including Market Swing Points, Sweeps, Candle Mean, and Change in State of Delivery (CISD), which together offer a nuanced and effective approach to trading.
At its core, the model focuses on Market Swing Points, which represent crucial turning points in the market where price action shifts direction.
These points provide insight into potential reversals and momentum changes, allowing traders to identify key support and resistance areas.
Recognizing these swings is critical in anticipating future price movements and understanding the market’s underlying structure.
The Fractal Range Model (FRM) is a versatile trading strategy that adapts to various styles, whether you're into scalping, day trading, swing trading, or long-term investment. Its flexibility makes it suitable for traders with different time horizons and risk preferences, allowing it to be effectively applied across multiple market conditions.
📦 Features
Timeframe Alignment: This indicator reveals lower Timeframe movements within higher Timeframe candles, offering insights into micro trends, structure shifts, and key entry points.
Bias Selection: This feature lets analysts control bias and setup detection, viewing bullish, bearish, or neutral formations to align with higher Timeframe trends.
Double Purge Sweeps: A double purge is a type of Sweep where the price exceeds both the high and low of the previous candle (via wicks) and then closes within the range of the prior candle.
Time Filters: Sync Time and price by selecting custom Time windows to focus on relevant formations.
Higher Timeframe Candles: The Fractal Range Model integrates ICT Power of Three, helping traders spot key turning points and market transitions across Timeframes.
Higher Timeframe PD Arrays: The HTF PD Arrays (FVG, IFVG) are key points of interest that indicate significant market levels where valid sweeps are likely to occur.
Lower Timeframe PD Arrays: The LTF PD Arrays (FVG, IFVG), on the other hand, are used for identifying entry points.
Smart Money Technique: In the context of the Fractal Range Model (FRM), the SMT (Smart Money Technique) serves as a crucial confluence indicator that strengthens the reliability of a formed model.
Info Panel: Display a customizable table with key details like timeframe pairing, time to next candle close, bias, and time filter settings, with full control over size, location, and borders.
Suitable for any Market: Ideal for all markets - stocks, forex, crypto, futures, commodities and more - delivering consistent results and insights across diverse trading environments.
⚙️ Settings
Core
Status: Filter models based on status
Bias: Controls what model type will be displayed, bullish or bearish
Fractal: Controls the timeframe pairing will be used
Mean: Plots the equilibrium of the previous HTF candle
Liquidity: Displays the liquidity levels that belongs to the model
Sweep: Shows the sweep that forms a model
I-sweep: Controls the visibility of invalidated sweeps
D-purge: Plots the double purge sweeps
CISD: Displays the Change In State of Delivery for a model
Labels: Adjust the HTF candle label size
C-area: Highlights the region between current candle open and previous candle equilibrium
History
History: Controls the mount of past models displayed on the chart
Filters
Asia: Filter models based on Asia Killzone hours
London: Filter models based on London Killzone hours
NY AM: Filter models based on NY AM Killzone hours
NY Launch: Filter models based on NY Launch Killzone hours
NY PM: Filter models based on NY PM Killzone hours
Custom: Filter models based on user Custom hours
HTF
Candles: Controls the number of HTF candles that will be visible on the chart
Open: Highlights with a line the open price of current HTF candle
Show True Day Open: Display True Day Open line
Offset: Controls the distance of HTF from the current chart
Space: Controls the space between HTF candles
Size: Controls the size of HTF candles
PD Array: Displays ICT PD Arrays
CE Line: Style the equilibrium line of PD Array
Border: Style the border of PD Array
LTF
H/L Line: Displays on the LTF chart High and Low of each HTF candle
O/C Line: Displays on the LTF chart Open and Close of each HTF candle
PD Array: Displays ICT PD Arrays
CE Line: Style the equilibrium line of PD Array
Border: Style the border of PD Array
Projections
StDev: Controls standard deviation available levels
Labels: Controls the size of standard deviation levels
Anchor: Controls the anchor point of standard deviation levels (wick, body)
Lines: Controls the line widths and color of standard deviation levels
SMT
Show: Display SMT
Symbol: Symbol 1
Symbol: Symbol 2
Style: Controls the color of Bearish and Bullish SMTs
Dashboard
Panel: Display information about current model
💡 Framework
The model includes the following timeframe parings:
15s - 5m
1m - 15m
1m - 30m
2m - 20m
3m - 30m
3m - 60m
5m - 1H
15m - 4H
15m - 8H
30m - 9H
30m - 12H
1H - 1D
2H - 2D
3H - 3D
4H - 1W
8H - 2W
12H - 3W
1D - 1M
2D - 2M
1W - 3M
2W - 6M
3W - 9M
1M - 12M
The Fractal Range Model follows a specific lifecycle, which highlights the current state of the model and determines whether a trade opportunity is valid.
The model's lifecycle includes the following statuses:
Formation (grey)
Invalidation (red)
Success (green)
1. Formation
The Formation phase marks the initial setup of the Fractal Range Model. During this stage, the model identifies and plots key components, such as:
Sweeps: Market movements that indicate a potential reversal or strong shift in trend.
CISD (Change In State of Delivery): A structural change that provides insight into trend shifts.
Once these components are detected, the model automatically calculates and displays Projections and Liquidity Levels , offering insights into potential price action movements.
At this stage, the model also identifies and displays the following key elements:
HTF PD Arrays (Higher-Timeframe Price Delivery Arrays)
LTF PD Arrays (Lower-Timeframe Price Delivery Arrays)
Smart Money Technique (SMT)
If any of these elements are present, they will be automatically displayed on the chart.
2. Invalidation
A Fractal Range Model is considered invalidated when the price does not reach the 2 Standard Deviation level or the first identified liquidity level, and when the price breaks above the high that formed the Sweep.
Invalidation signals that the original setup is no longer reliable, and traders should avoid taking action based on the model's original parameters.
Key invalidation conditions:
Price fails to reach the 2 Standard Deviation level.
Price fails to reach the first liquidity level.
Price breaks the high/low that initiated the Sweep.
A potentially invalidated model is marked with a purple color above the label, indicating the sweep is invalidated by the next candle, but not the high that formed the sweep.
3. Success
A Fractal Range Model is considered successful when the price reaches the 2 Standard Deviation level or the first identified liquidity level. This indicates that the model's predictions align with actual market movements, confirming the setup's validity and providing a potential trading signal.
At this stage, alongside Projections and Liquidity levels, you'll also notice the C-area — the region between the current candle's open and the previous candle's mean. If respected, price action will follow the model's direction.
Key success conditions:
Price reaches the 2 Standard Deviation level.
Price reaches the first liquidity level.
By leveraging these phases, Formation, Invalidation, and Success, traders can effectively manage their positions, minimize risk, and capitalize on high-probability setups based on the Fractal Range Model.
⚡️ Showcase
Introducing Fractal Range Model is a powerful trading tool designed to elevate your market analysis and boost your trading success. Built with precision and advanced algorithms, this indicator helps you identify key trends, potential entry and exit points, and optimize your strategy for better decision-making.
History
HTF Candles
HTF PD Arrays
LTF PD Arrays
SMT
Unlock your full trading potential and experience the difference with Fractal Range Model — your ultimate tool for smarter, more informed trading decisions.
🚨 Alerts
This script offers alert options for all model types. The alerts need to be setup manually from Tradingview.
Bearish Model
A bearish model alert is triggered when a model forms, signaling a high sweep and CISD.
Bullish Model
A bullish model alert is triggered when a model forms, signaling a low sweep and CISD.
⚠️ Disclaimer
These tools are exclusively available on the TradingView platform.
Our charting tools are intended solely for informational and educational purposes and should not be regarded as financial, investment, or trading advice. They are not designed to predict market movements or offer specific recommendations. Users should be aware that past performance is not indicative of future results and should not rely on these tools for financial decisions. By using these charting tools, the purchaser agrees that the seller and creator hold no responsibility for any decisions made based on information provided by the tools. The purchaser assumes full responsibility and liability for any actions taken and their consequences, including potential financial losses or investment outcomes that may result from the use of these products.
By purchasing, the customer acknowledges and accepts that neither the seller nor the creator is liable for any undesired outcomes stemming from the development, sale, or use of these products. Additionally, the purchaser agrees to indemnify the seller from any liability. If invited through the Friends and Family Program, the purchaser understands that any provided discount code applies only to the initial purchase of Candela's subscription. The purchaser is responsible for canceling or requesting cancellation of their subscription if they choose not to continue at the full retail price. In the event the purchaser no longer wishes to use the products, they must unsubscribe from the membership service, if applicable.
We do not offer reimbursements, refunds, or chargebacks. Once these Terms are accepted at the time of purchase, no reimbursements, refunds, or chargebacks will be issued under any circumstances.
By continuing to use these charting tools, the user confirms their understanding and acceptance of these Terms as outlined in this disclaimer.

Nef33 Forex & Crypto Trading Signals PRO
1. Understanding the Indicator's Context
The indicator generates signals based on confluence (trend, volume, key zones, etc.), but it does not include predefined SL or TP levels. To establish them, we must:
Use dynamic or static support/resistance levels already present in the script.
Incorporate volatility (such as ATR) to adjust the levels based on market conditions.
Define a risk/reward ratio (e.g., 1:2).
2. Options for Determining SL and TP
Below, I provide several ideas based on the tools available in the script:
Stop Loss (SL)
The SL should protect you from adverse movements. You can base it on:
ATR (Volatility): Use the smoothed ATR (atr_smooth) multiplied by a factor (e.g., 1.5 or 2) to set a dynamic SL.
Buy: SL = Entry Price - (atr_smooth * atr_mult).
Sell: SL = Entry Price + (atr_smooth * atr_mult).
Key Zones: Place the SL below a support (for buys) or above a resistance (for sells), using Order Blocks, Fair Value Gaps, or Liquidity Zones.
Buy: SL below the nearest ob_lows or fvg_lows.
Sell: SL above the nearest ob_highs or fvg_highs.
VWAP: Use the daily VWAP (vwap_day) as a critical level.
Buy: SL below vwap_day.
Sell: SL above vwap_day.
Take Profit (TP)
The TP should maximize profits. You can base it on:
Risk/Reward Ratio: Multiply the SL distance by a factor (e.g., 2 or 3).
Buy: TP = Entry Price + (SL Distance * 2).
Sell: TP = Entry Price - (SL Distance * 2).
Key Zones: Target the next resistance (for buys) or support (for sells).
Buy: TP at the next ob_highs, fvg_highs, or liq_zone_high.
Sell: TP at the next ob_lows, fvg_lows, or liq_zone_low.
Ichimoku: Use the cloud levels (Senkou Span A/B) as targets.
Buy: TP at senkou_span_a or senkou_span_b (whichever is higher).
Sell: TP at senkou_span_a or senkou_span_b (whichever is lower).
3. Practical Implementation
Since the script does not automatically draw SL/TP, you can:
Calculate them manually: Observe the chart and use the levels mentioned.
Modify the code: Add SL/TP as labels (label.new) at the moment of the signal.
Here’s an example of how to modify the code to display SL and TP based on ATR with a 1:2 risk/reward ratio:
Modified Code (Signals Section)
Find the lines where the signals (trade_buy and trade_sell) are generated and add the following:
pinescript
// Calculate SL and TP based on ATR
atr_sl_mult = 1.5 // Multiplier for SL
atr_tp_mult = 3.0 // Multiplier for TP (1:2 ratio)
sl_distance = atr_smooth * atr_sl_mult
tp_distance = atr_smooth * atr_tp_mult
if trade_buy
entry_price = close
sl_price = entry_price - sl_distance
tp_price = entry_price + tp_distance
label.new(bar_index, low, "Buy: " + str.tostring(math.round(bull_conditions, 1)), color=color.green, textcolor=color.white, style=label.style_label_up, size=size.tiny)
label.new(bar_index, sl_price, "SL: " + str.tostring(math.round(sl_price, 2)), color=color.red, textcolor=color.white, style=label.style_label_down, size=size.tiny)
label.new(bar_index, tp_price, "TP: " + str.tostring(math.round(tp_price, 2)), color=color.blue, textcolor=color.white, style=label.style_label_up, size=size.tiny)
if trade_sell
entry_price = close
sl_price = entry_price + sl_distance
tp_price = entry_price - tp_distance
label.new(bar_index, high, "Sell: " + str.tostring(math.round(bear_conditions, 1)), color=color.red, textcolor=color.white, style=label.style_label_down, size=size.tiny)
label.new(bar_index, sl_price, "SL: " + str.tostring(math.round(sl_price, 2)), color=color.red, textcolor=color.white, style=label.style_label_up, size=size.tiny)
label.new(bar_index, tp_price, "TP: " + str.tostring(math.round(tp_price, 2)), color=color.blue, textcolor=color.white, style=label.style_label_down, size=size.tiny)
Code Explanation
SL: Calculated by subtracting/adding sl_distance to the entry price (close) depending on whether it’s a buy or sell.
TP: Calculated with a double distance (tp_distance) for a 1:2 risk/reward ratio.
Visualization: Labels are added to the chart to display SL (red) and TP (blue).
4. Practical Strategy Without Modifying the Code
If you don’t want to modify the script, follow these steps manually:
Entry: Take the trade_buy or trade_sell signal.
SL: Check the smoothed ATR (atr_smooth) on the chart or calculate a fixed level (e.g., 1.5 times the ATR). Also, review nearby key zones (OB, FVG, VWAP).
TP: Define a target based on the next key zone or multiply the SL distance by 2 or 3.
Example:
Buy at 100, ATR = 2.
SL = 100 - (2 * 1.5) = 97.
TP = 100 + (2 * 3) = 106.
5. Recommendations
Test in Demo: Apply this logic in a demo account to adjust the multipliers (atr_sl_mult, atr_tp_mult) based on the market (forex or crypto).
Combine with Zones: If the ATR-based SL is too wide, use the nearest OB or FVG as a reference.
Risk/Reward Ratio: Adjust the TP based on your tolerance (1:1, 1:2, 1:3)

[TehThomas] - ICT SMT DivergencesIntroduction
SMT Divergences is a cutting-edge trading tool designed for traders who utilize Smart Money Techniques (SMT), a core concept in the Inner Circle Trader (ICT) methodology. This indicator is specifically built to detect SMT divergences by comparing price action across multiple correlated assets. It helps traders identify institutional activity, liquidity grabs, and inefficiencies in the market, offering valuable insights for high-probability trade setups.
Smart Money Techniques revolve around the idea that institutional traders and large market participants leave behind footprints in the form of price divergences. By analyzing multiple asset pairs simultaneously, this indicator helps traders pinpoint areas where one market structure contradicts another, revealing potential trade opportunities before the majority of retail traders notice them.
What is SMT Divergence?
Smart Money Divergence (SMT) occurs when correlated assets or markets behave differently in key areas of interest. These divergences often indicate market inefficiencies caused by liquidity grabs or institutional order flow. There are two main types of SMT divergences:
1. Bearish SMT Divergence (Smart Money Distribution) 🔴
Occurs when:
One asset makes a higher high, while another correlated asset makes a lower high.
This signals underlying weakness in the price action of the first asset.
Institutions may be offloading positions, preparing for a downward move.
📉 Example: If GBP/USD makes a higher high, but EUR/USD makes a lower high, it indicates potential weakness in GBP/USD and a possible short opportunity.
2. Bullish SMT Divergence (Smart Money Accumulation) 🔵
Occurs when:
One asset makes a lower low, while another correlated asset makes a higher low.
This suggests strength and potential accumulation by institutional traders.
Smart Money may be positioning for a bullish reversal.
📈 Example: If NASDAQ (US100) makes a lower low, but S&P 500 (US500) makes a higher low, it could indicate bullish strength in the stock market, suggesting a possible long trade.
How This Indicator Works
The SMT Divergences automatically identifies and plots SMT divergences on your chart, allowing you to spot hidden market imbalances at a glance.
🔍 Key Features
✅ Compare Up to 4 Assets Simultaneously – Select up to four correlated pairs to compare against the main charted asset.
✅ Automatic Detection of SMT Divergences – The script finds divergences in swing highs and swing lows and visually marks them on the chart.
✅ Customizable Line Styles & Colors – Adjust the appearance of the divergence lines and labels to suit your trading style.
✅ Smart Labeling System – Displays which asset pairs are diverging, making it easy to analyze market conditions.
✅ Works Across Multiple Markets – Use for Forex, Indices, Crypto, and Commodities, giving traders flexibility in different asset classes.
✅ Designed for ICT Traders – Aligns perfectly with other ICT concepts such as Liquidity Zones, Order Blocks, and Fair Value Gaps (FVGs).
🛠 Indicator Settings & Customization
The indicator provides various settings to tailor it to your trading preferences:
Pivot Lookback Length: Adjusts how many bars the indicator looks back to determine swing highs/lows.
Symbol Selection: Choose up to four additional assets to compare against your main trading pair.
Divergence Line Colors: Customize the color of bearish (red) and bullish (blue) divergences for better visibility.
Line Styles: Choose between solid, dotted, or dashed lines to highlight divergences in your preferred way.
Label Customization: Modify text color and display preferences for a clean and informative chart layout.
How to Use This Indicator in Your Trading Strategy
This indicator is best used in combination with other ICT concepts to improve confluence and increase trade accuracy. Here’s how you can integrate it into your trading strategy:
🔹 Step 1: Identify SMT Divergences
Wait for bullish or bearish SMT divergences to appear on your chart.
Check if the divergence aligns with key liquidity zones, fair value gaps (FVGs), or order blocks.
🔹 Step 2: Confirm Institutional Activity
Look for liquidity sweeps (stop hunts) before a potential reversal.
If a bearish SMT divergence forms near a major resistance level, it may signal Smart Money selling.
If a bullish SMT divergence forms near a support zone, it could indicate accumulation.
🔹 Step 3: Enter a Trade with Confluence
Combine SMT divergences with market structure shifts to time entries.
Use additional ICT tools like Premium & Discount Arrays, Volume Profile, and Market Maker Models for confirmation.
Set stop-losses above liquidity zones and aim for high-risk reward ratios.
🔹 Step 4: Manage Risk & Take Profits
Always use proper risk management, keeping an eye on liquidity grabs and market sentiment.
Consider taking partial profits at key structural points and letting the rest of the trade run.
Why This Indicator is a Game-Changer for ICT Traders
Traditional retail traders often fail to spot Smart Money footprints, which is why many struggle with false breakouts and liquidity traps. The - ICT SMT Divergences indicator eliminates this problem by providing a clear, visual representation of SMT divergences, allowing traders to track institutional movements in real-time.
🔹 Save Time – No need to manually compare charts; the script does the work for you.
🔹 Improve Accuracy – Get high-probability trade setups by following institutional footprints.
🔹 Enhance Your Trading Edge – Use SMT divergences in combination with liquidity grabs, order blocks, and fair value gaps to refine your strategy.
🔹 Universal Market Compatibility – Works for Forex, Indices, Crypto, Commodities, and even Stocks, giving you flexibility in different markets.
Final Thoughts
The SMT Divergences is a must-have tool for traders who rely on Smart Money Techniques (SMT) and ICT methodologies. By identifying SMT divergences across multiple correlated markets, this indicator provides unparalleled insights into institutional trading behavior and enhances your ability to trade with Smart Money.
Whether you are a day trader, swing trader, or position trader, this indicator will help you make more informed decisions, avoid liquidity traps, and improve your overall profitability.
__________________________________________
Thanks for your support!
If you found this idea helpful or learned something new, drop a like 👍 and leave a comment, I’d love to hear your thoughts! 🚀
Make sure to follow me for more price action insights, free indicators, and trading strategies. Let’s grow and trade smarter together! 📈
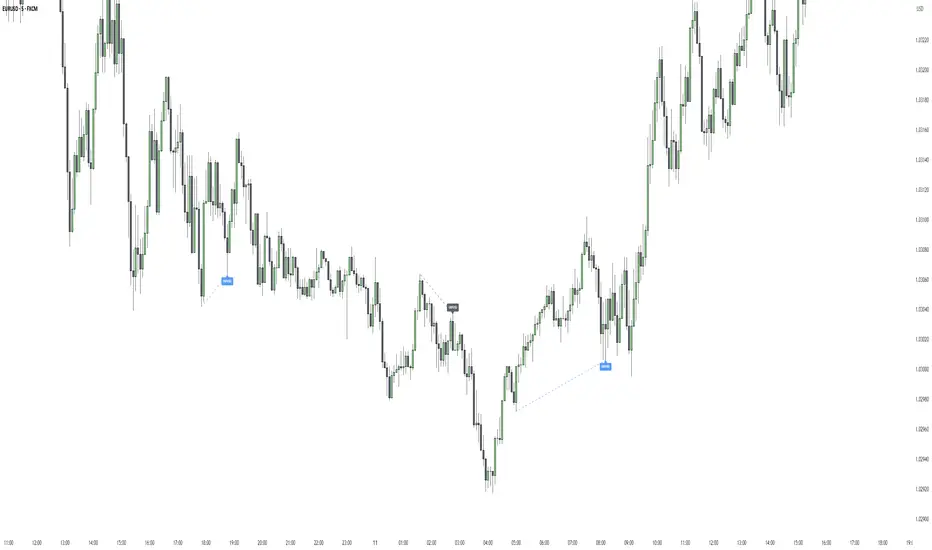
Market DNA: Structure, Volume, Range, and SessionsMarket DNA: Structure, Volume, Range, and Sessions**
The Market DNA indicator combines market structure, volume analysis, trading ranges, and global trading sessions into a single, comprehensive tool for traders. It helps identify key price levels, volume patterns, consolidation phases, and active market periods, enabling informed trading decisions.
Market Structure Detects swing highs and lows using `ta.pivothigh` and `ta.pivotlow`, plotting them as red/green triangles to highlight support/resistance and trend reversals.
- Fractal Volume Zones (FVG): Highlights areas of significant buying/selling pressure by comparing current volume to an average over a lookback period; high-volume zones are marked with a semi-transparent blue background.
- Trading Range: Defines a price channel using the Average True Range (ATR) and a multiplier, creating upper/lower bands to identify consolidation, breakouts, and potential trade levels.
- Market Sessions: Highlights major global trading sessions (Asia, Europe, US) with colored backgrounds (purple, teal, yellow) to indicate liquidity and volatility shifts.
How It Works
- Swing points help analyze trends and reversals.
- FVG confirms price movements with high volume for stronger signals.
- Trading range bands assist in identifying breakout opportunities and setting stops/take-profits.
- Session highlights allow traders to adapt strategies based on regional activity.
Customization
- Adjust `swing_length` for sensitivity in detecting turning points.
- Modify `volume_lookback` to control volume averaging.
- Tune `range_multiplier` for wider/narrower trading bands.
- Enable/disable session highlighting via `session_highlight`.
Use Cases
- Identify trends and key levels using swing points and FVG.
- Spot breakout opportunities with trading range bands.
- Adapt strategies to regional trading sessions for optimal timing.
This all-in-one indicator provides a clear, customizable view of the market, empowering traders to make data-driven decisions across asset classes and timeframes.
