5m FVGs Lorem Ipsum is simply dummy text of the printing and typesetting industry. Lorem Ipsum has been the industry's standard dummy text ever since the 1500s, when an unknown printer took a galley of type and scrambled it to make a type specimen book. It has survived not only five centuries, but also the leap into electronic typesetting, remaining essentially unchanged. It was popularised in the 1960s with the release of Letraset sheets containing Lorem Ipsum passages, and more recently with desktop publishing software like Aldus PageMaker including versions of Lorem Ipsum.
Search in scripts for "fvg"

Order Block Pro (Manoj Kumar Mathey)This is an indicator which gives you the Order Block with BOS + FVG + Liquidity Sweep.

Order Block Pro (Manoj Kumar Mathey)This indicator gives you the Order Block professionally which includes BOS + FVG + Sweep analysis too.

Liquidity + Order-Flow Exhaustion (Smart-Money Logic)Liquidity + Order-Flow Exhaustion (Smart-Money Logic) is a visual tool that helps traders recognize where big market participants (“smart money”) are likely accumulating or distributing positions.
It identifies liquidity sweeps (stop-hunts above or below previous swing levels) and market structure shifts (reversals confirmed by price closing back in the opposite direction).
In simple terms, it shows where price “tricks” retail traders into chasing breakouts — right before reversing.
How it works:
The script scans recent highs and lows to find when price breaks them and quickly rejects — a sign of stop-hunts or liquidity grabs.
It then checks for a close back inside the previous range to confirm a possible Market Structure Shift (MSS).
When this happens, the chart highlights the zone and optionally adds directional labels (🔹 or 🔸) to mark where the liquidity event occurred.
How to read the signals:
🟢 Bullish shift — Price takes out a previous low, then closes higher. This often marks the end of a short-term down-move.
🔴 Bearish shift — Price sweeps a previous high, then closes lower. This often marks the end of a short-term rally.
Colored backgrounds and labels help visualize these key reversals directly on the chart.
How to use it:
Apply to any timeframe; 15-minute to 4-hour charts work best.
Use it to confirm reversals near major swing points or liquidity zones.
Combine with volume spikes, displacement candles, or Fair-Value Gaps (FVGs) for stronger confirmation.
What makes it original:
Simple, self-contained logic inspired by Smart Money Concepts (SMC).
Automatically detects both liquidity sweeps and the subsequent structural shift.
Visual and alert-ready design — perfect for discretionary or algorithmic strategies.
Tip: For even better accuracy, align detected shifts with higher-timeframe bias or VWAP deviations.

Choch Pattern Levels WITH ALERTS [credit to: @BigBeluga]🔵 OVERVIEW
The Choch Pattern Levels WITH ALERTS indicator automatically detects Change of Character (CHoCH) shifts in market structure — crucial moments that often signal early trend reversals or major directional transitions. It plots the structural break level, visualizes the pattern zone with triangle overlays, and tracks delta volume to help traders assess the strength behind each move. Now, an additional feature of alerts have been included!
🔵 CONCEPTS
CHoCH Pattern: A bullish CHoCH forms when price breaks a previous swing high after a swing low, while a bearish CHoCH appears when price breaks a swing low after a prior swing high.
snapshot
Break Level Mapping: The indicator identifies the highest or lowest point between the pivot and the breakout, marking it with a clean horizontal level where price often reacts.
snapshot
Delta Volume Tracking: Net bullish or bearish volume is accumulated between the pivot and the breakout, revealing the momentum and conviction behind each CHoCH.
snapshot
Chart Clean-Up: If price later closes through the CHoCH level, the zone is automatically removed to maintain clarity and focus on active setups only.
🔵 FEATURES
Automatic CHoCH pattern detection using pivot-based logic.
Triangle shapes show structure break: pivot → breakout → internal high/low.
snapshot
snapshot
Horizontal level marks the structural zone with a ◯ symbol.
snapshot
Optional delta volume label with directional sign (+/−).
Green visuals for bullish CHoCHs, red for bearish.
Fully auto-cleaning invalidated levels to reduce clutter.
Clean organization of all lines, labels, and overlays.
User-defined Length input to adjust pivot sensitivity.
snapshot
NEW! - alert system inserted to Pinescript for either: any triangle forms or whether a bullish "green" triangle or bearish "red" triangle forms - providing real-time alerts for whenever timeframe chart you've selected while creating the alert.
🔵 HOW TO USE
Use CHoCH levels as early trend reversal zones or confirmation signals.
Treat bullish CHoCHs as support zones, bearish CHoCHs as resistance.
Look for high delta volume to validate the strength behind each CHoCH.
Combine with other BigBeluga tools like supply/demand, FVGs, or liquidity maps for confluence.
Adjust pivot Length based on your strategy — shorter for intraday, longer for swing trading.
🔵 CONCLUSION
Choch Pattern Levels WITH ALERTS highlights key structural breaks that can mark the start of new trends. By combining precise break detection with volume analytics and automatic cleanup, it provides actionable insights into the true intent behind price moves — giving traders a clean edge in spotting early reversals and key reaction zones with real-time alerts for precision to evaluate and enter markets.

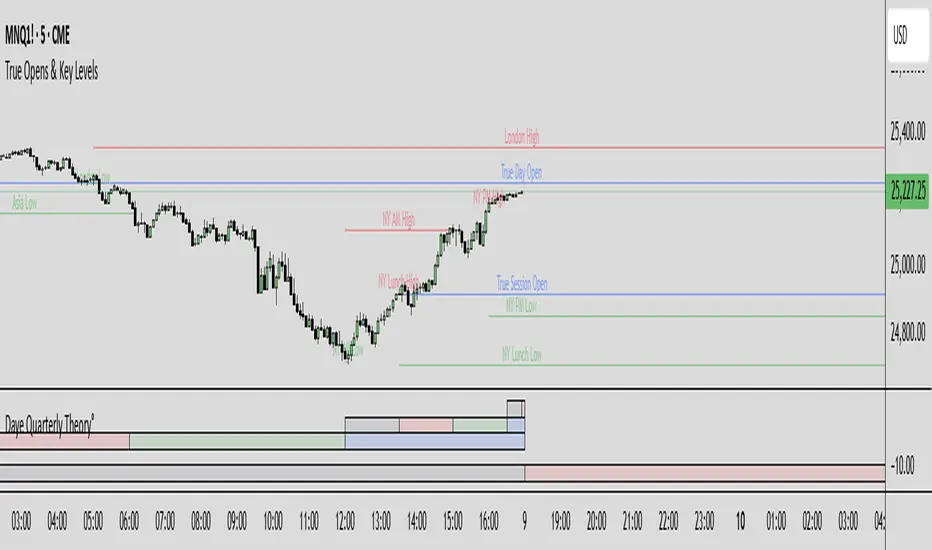
True Opens & Key Levels# True Opens & Key Levels - Standalone Indicator Guide
## Overview
This is a clean, focused indicator that displays only key level rays and true open levels. All impulsive series detection, FVG detection, and Fibonacci projections have been removed for a minimal, uncluttered chart experience.
---
## Features Included
### 📊 Previous Period Levels
- **Previous Day High/Low** - Daily reference points
- **Previous Week High/Low** - Weekly reference points
- **Previous Month High/Low** - Monthly reference points
### 🕐 Session High/Low Levels
- **NY AM Session** (9:30-12:00 ET) - Morning session range
- **NY Lunch Session** (12:00-13:30 ET) - Lunch hour range
- **NY PM Session** (13:30-16:00 ET) - Afternoon session range
- **London Session** (2:00-5:00 ET) - London trading hours
- **Asia Session** (20:00-00:00 ET) - Asian market hours
### 🎯 True Open Levels (NEW)
- **True Day Open** - Updates daily at 00:00 ET
- **True Session Open** - Updates every 6 hours (1:30, 7:30, 13:30, 19:30 ET)
- **True Week Open** - Updates every Monday at 18:00 ET
---
## Settings
### Key Level Rays Group
**Master Toggle:**
- Enable Key Level Rays (master on/off switch)
**Previous Period Levels:**
- Show Previous Day H/L
- Show Previous Week H/L
- Show Previous Month H/L
**Session Levels:**
- Show NY AM H/L (9:30-12:00 ET)
- Show NY Lunch H/L (12:00-13:30 ET)
- Show NY PM H/L (13:30-16:00 ET)
- Show London H/L (2:00-5:00 ET)
- Show Asia H/L (20:00-00:00 ET)
**True Open Levels:**
- Show True Day Open (00:00)
- Show True Session Open (6h intervals)
- Show True Week Open (Mon 18:00)
**Visual Settings:**
- High Level Color (default: red with 50% transparency)
- Low Level Color (default: green with 50% transparency)
- Open Level Color (default: blue with 50% transparency)
- Ray Line Width (1-5 pixels)
- Ray Label Size (tiny/small/normal/large)
---
## How It Works
### Level Behavior
**Session High/Low Levels:**
1. During session: Tracks the highest high and lowest low
2. After session ends: Draws horizontal rays extending right
3. When price hits level: Ray stops extending (hit marker)
4. Label updates position to stay at chart's right edge
**Previous Period Levels:**
1. At period change: Draws rays from previous period's H/L
2. Extends right until price hits the level
3. When hit: Ray stops extending
4. Label positions at midpoint of ray
**True Open Levels:**
1. At trigger time: Draws ray from opening price
2. Extends right until next trigger
3. Previous level is deleted when new one appears
4. Label stays at right edge of chart
---
## Color Scheme
### Three Color Categories:
1. **Red** - All HIGH levels (session highs, previous highs)
2. **Green** - All LOW levels (session lows, previous lows)
3. **Blue** - All OPEN levels (True Day/Session/Week Opens)
This makes it instantly clear what type of level you're looking at.
---
## Best Practices
### For Intraday Trading (1m-1H):
```
Enable:
✓ True Day Open
✓ True Session Open
✓ NY AM/PM H/L
✓ Previous Day H/L
Disable:
✗ Previous Week/Month H/L
✗ London/Asia sessions (unless trading them)
✗ True Week Open
```
### For Swing Trading (1H-4H):
```
Enable:
✓ True Week Open
✓ True Day Open
✓ Previous Week H/L
✓ Previous Day H/L
Disable:
✗ All session H/L
✗ True Session Open
✗ Previous Month H/L
```
### For Clean Charts:
```
Enable:
✓ True Day Open
✓ True Week Open
✓ Previous Day H/L only
Disable:
✗ Everything else
Result: Just 4 levels on chart - super clean!
```
---
## Level Update Schedule
| Level | Update Frequency | Time(s) |
|---------------------|------------------|-----------------------------|
| True Day Open | Daily | 00:00 ET |
| True Session Open | Every 6 hours | 1:30, 7:30, 13:30, 19:30 ET |
| True Week Open | Weekly | Monday 18:00 ET |
| Previous Day H/L | Daily | At day change |
| Previous Week H/L | Weekly | At week change |
| Previous Month H/L | Monthly | At month change |
| NY AM H/L | Daily | After 12:00 ET |
| NY Lunch H/L | Daily | After 13:30 ET |
| NY PM H/L | Daily | After 16:00 ET |
| London H/L | Daily | After 5:00 ET |
| Asia H/L | Daily | After 00:00 ET |
---
## File Size & Performance
- **File Size:** ~22 KB (less than half the size of full indicator)
- **Total Lines:** ~700 lines
- **Max Lines/Labels:** 500 (configurable in declaration)
- **Performance:** Lightweight, minimal CPU usage
- **Memory:** Efficient variable management
---
## Installation
1. Open TradingView
2. Open Pine Editor (Alt+E or bottom toolbar)
3. Click "Create new indicator"
4. Delete default code
5. Copy and paste contents of `TRUE_OPENS_KEY_LEVELS.pine`
6. Click "Save" and name it "True Opens & Key Levels"
7. Click "Add to Chart"
---
## Usage Tips
### 1. Start Minimal
Begin with just 2-3 levels enabled:
- True Day Open
- Previous Day High
- Previous Day Low
Add more as needed.
### 2. Color Customization
Adjust transparency for cleaner look:
- High Level: Red 60-70% transparency
- Low Level: Green 60-70% transparency
- Open Level: Blue 60-70% transparency
### 3. Multi-Timeframe Approach
Lower timeframes (1m-15m): Use True Session Open + NY session H/L
Mid timeframes (15m-1H): Use True Day Open + Previous Day H/L
Higher timeframes (1H-4H): Use True Week Open + Previous Week H/L
### 4. Line Width
For cleaner charts, use Line Width = 1
For emphasis, use Line Width = 2-3
### 5. Label Size
Smaller screens: Use "small" or "tiny"
Larger screens: Use "normal"
Presentations: Use "large"
---
## Advantages of Standalone Version
✅ **Cleaner Charts** - No detection lines or arrows
✅ **Faster Loading** - Less code to process
✅ **Easier Setup** - Fewer settings to configure
✅ **Pure Levels** - Focus only on key price levels
✅ **Less Distraction** - No moving parts during trading
✅ **Perfect for Combining** - Use with other indicators without clutter
---
## Combining with Other Indicators
This lightweight indicator works great alongside:
- RSI / Stochastic (oscillators)
- Moving Averages (trend)
- Volume Profile (structure)
- VWAP (intraday reference)
- Your own custom indicators
The minimal chart footprint leaves room for additional tools.
---
## Time Zones
All times are in **Eastern Time (ET)**. TradingView automatically converts to your local timezone, so you don't need to manually adjust anything.
**Example Conversions:**
- 00:00 ET = 05:00 UTC
- 18:00 ET = 23:00 UTC
- 13:30 ET = 18:30 UTC
---
## Support & Updates
This is a standalone version of the True Opens & Key Levels from the full GOTE Indicator. It contains only the level detection code with all series detection removed.
**Version:** 1.0
**Pine Script Version:** 6
**Last Updated:** November 8, 2025
---
## Quick Reference Card
```
╔══════════════════════════════════════════════════════════╗
║ TRUE OPENS & KEY LEVELS - QUICK REFERENCE ║
╠══════════════════════════════════════════════════════════╣
║ ║
║ 📊 PREVIOUS PERIODS ║
║ • Previous Day/Week/Month High/Low ║
║ • Updates at period change ║
║ ║
║ 🕐 SESSION LEVELS ║
║ • NY AM/Lunch/PM, London, Asia H/L ║
║ • Updates after each session ║
║ ║
║ 🎯 TRUE OPENS ║
║ • True Day: Daily 00:00 ET ║
║ • True Session: 1:30/7:30/13:30/19:30 ET ║
║ • True Week: Monday 18:00 ET ║
║ ║
║ 🎨 COLORS ║
║ • Red = Highs • Green = Lows • Blue = Opens ║
║ ║
╚══════════════════════════════════════════════════════════╝
```
---
**Ready to trade with clean, focused key levels!** 🎯
Quantura - Liquidity Sweep & Run LevelsIntroduction
“Quantura – Liquidity Sweep & Run Levels” is a structural price-action indicator designed to automatically detect swing-based liquidity zones and visualize potential sweep and run events. It helps traders identify areas where liquidity has likely been taken (sweep) or released (run), improving precision in market structure analysis and timing of entries or exits.
Originality & Value
This tool translates institutional liquidity concepts into an automated visual framework. Instead of simply marking highs and lows, it dynamically monitors swing points, tracks their breaches, and identifies subsequent reactions. The indicator is built to highlight the liquidity dynamics that often precede reversals or continuations.
Its originality lies in:
Automatic identification and tracking of swing highs and lows.
Real-time detection of broken levels and liquidity sweeps.
Distinction between “Run” and “Sweep” modes for different market behaviors.
Persistent historical visualization of liquidity levels using clean line structures.
Configurable signal markers for bullish and bearish sweep confirmations.
Functionality & Core Logic
Detects swing highs and lows using a user-defined Swing Length parameter.
Stores and updates all swing levels dynamically with arrays for efficient memory handling.
Draws horizontal lines from each detected swing point to visualize potential liquidity zones.
Monitors when price breaks a swing level and marks that event as “broken.”
Generates signals when the market either sweeps above/below or runs away from those levels, depending on the chosen mode.
Provides optional visual signal markers (“▲” for bullish sweeps, “▼” for bearish sweeps).
Parameters & Customization
Mode: Choose between “Sweep” (detects liquidity grabs) or “Run” (detects breakout continuations).
Swing Length: Sets the sensitivity for detecting swing highs/lows. A higher value focuses on larger structures, while smaller values detect micro liquidity points.
Bullish Color / Bearish Color: Customize color themes for sweep/run lines and signal markers.
Signals: Enables or disables visual up/down markers for confirmed events.
Visualization & Display
Horizontal lines represent potential liquidity levels (unbroken swing highs/lows).
Once broken, lines automatically stop extending, marking the moment liquidity is taken.
Depending on the selected mode:
“Sweep” mode identifies false breaks or stop-hunt behavior.
“Run” mode highlights breakouts that continue the trend.
Colored arrows indicate the direction and type of liquidity reaction.
Clean, non-intrusive visualization suitable for overlaying on price charts.
Use Cases
Detect liquidity sweeps before major reversals.
Identify breakout continuations after liquidity runs.
Combine with Supply/Demand or FVG indicators for multi-layered confirmation.
Validate liquidity bias in algorithmic or discretionary strategies.
Analyze market manipulation patterns and institutional stop-hunting behavior.
Limitations & Recommendations
This indicator identifies structural behavior but does not guarantee trade direction or profitability.
Works best on liquid markets with clear swing structures (e.g., crypto, forex, indices).
Signal interpretation should be combined with confluence tools such as volume, order flow, or structure-based filters.
Excessively small swing settings may cause over-signaling in volatile markets.
Markets & Timeframes
Optimized for all major asset classes — including crypto, Forex, indices, and equities — and for intraday to higher-timeframe structural analysis (5-minute up to daily charts).
Author & Access
Developed 100% by Quantura. Published as a Open-source script indicator. Access is free.
Compliance Note
This description fully complies with TradingView’s Script Publishing Rules and House Rules . It avoids performance claims, provides transparency on methodology, and clearly describes indicator behavior and limitations.

Deyler IndicatorMerge indicators:
Nwog
ICT Killzones and Pivots
BTC Keylevels
9h30 First FVG
Round Number

Directional Strength and Momentum Index█ OVERVIEW
“Directional Strength and Momentum Index” (DSMI) is a technical analysis indicator inspired by DMI, but due to different source data, it produces distinct results. DSMI combines direction measurement, trend strength, and overheat levels into a single index, enhanced with gradient fills, extreme zones, entry signals, candle coloring, and a summary table.
█ CONCEPT
The classic DMI, despite its relatively simple logic, can seem somewhat chaotic due to separate +DI and -DI lines and the need for manual interpretation of their relationships. The DSMI indicator was created to increase clarity and speed up results, consolidating key information into a single index from 0 to 100 that simultaneously:
- Indicates trend direction (bullish/bearish)
- Measures movement strength
- Identifies overheat levels
- Generates ready entry signals
DMI (ADX + +DI / -DI) measures trend direction and strength, but does so based solely on comparing price movements between candles. ADX shows whether the trend is orderly and growing (e.g., above 20–30), but does not assess how dynamic the movement is.
DSMI, on the other hand, takes into account candle size and actual market aggression, thus showing directional momentum — whether the trend has real “fuel” to sustain or accelerate, not just whether it is orderly.
The main calculation difference involves replacing True Range with candle size (high-low) and using directional EMA instead of Wilder smoothing. This allows DSMI to react faster to momentum changes, eliminating delays typical of classic DMI based on TR.
This gives the trader an immediate picture of the market situation without analyzing multiple lines.
█ FEATURES
DSMI Main Line:
- EMA(Directional Index) based on +DS and -DS
- Scale 0–100, smooth color gradient depending on strength
+DS / -DS:
- Positive and Negative Directional Strength
- Gradient fill between lines — more intense with stronger trend
Extreme Zones:
- Default 20 and 80
- Gradient fill outside zones
Trend Strength Levels:
- Weak (<10) → neutral
- Moderate (up to 35)
- Strong (up to 45)
- Overheated (up to 55)
- Extreme (>55)
All levels editable
Entry Signals:
- Activated on crossing entry level (default 20)
Or on direction change when DSMI already ≥ entry level
- Highlighted background (green/red)
Candle Coloring:
- According to current trend
Trend Strength Table:
- Top-right corner
- Shows current strength (WEAK/STRONG etc.) + DSMI value
Alerts:
- DSMI Bullish Entry
- DSMI Bearish Entry
█ HOW TO USE
Add to Chart: Paste code in Pine Editor or find in indicator library.
Settings:
DSMI Parameters:
- DSMI Period → default 20
- Show DSMI Line → on/off
Extreme Zones:
- Lower Level → default 20
- Upper Level → default 80
Trend Strength Levels:
- Weak, Moderate, Strong, Overheated → adjust to strategy
Trend Colors:
- BULLISH → default green
- BEARISH → default red
- NEUTRAL → gray
Entry Signals:
- Show Highlight → on/off
- DSMI Entry Level → default 20
Signal Interpretation:
- DSMI Line: Main strength indicator.
- Gradient between +DS and -DS: Visualizes side dominance.
- Crossing 18 with direction confirmation → entry signal.
- Extreme Zones: Potential reversal or continuation points after correction.
- Table: Quick overview of current trend condition.
█ APPLICATIONS
The indicator works well in:
- Trend-following: Enter on signal, exit on direction change or overheat. When a new trend appears, consider entering a position, preferably with a rising trend strength indicator.
- Scalping/daytrading: Shorter period (7–10), lower entry level.
- Swing/position: Longer period (20–30), higher entry level, extreme zones as filters.
- Noise filtering: Ignores consolidation below “Weak” – increasing value e.g. to 15 highlights consolidation zones, but no signals appear there.
Style Adjustment:
- Aggressive strategies → shorten period and entry level
- Conservative → extend period, raise entry level (25–30), watch “Overheated”
“Weak” level (<10 default) → neutral; increasing it e.g. to 15 gives fewer but higher-quality signals. The Weak zone value controls the level below which no signals appear, and the gradient turns gray (often aligned with consolidation zones).
Combine with:
- Support/resistance levels
- Fair Value Gaps (FVG)
- Volume (Volume Profile, VWAP)
- Other oscillators (RSI, Stochastic)
█ NOTES
- Works on all markets and timeframes.
- Adjust period and levels to instrument volatility.
- Higher entry level → fewer signals, higher quality.
- Neutral color below “Weak” – avoids trading in consolidation.
- Gradient and table enable quick assessment without line analysis.

IRONBULL FX AMD📌 Power Of 3 ICT 01 – AMD ICT & SMC Accumulations
Overview:
The Power Of 3 ICT 01 indicator by TradingFinder is designed to visually map out the classic Accumulation–Manipulation–Distribution (AMD) phases of price behavior, based on ICT (Inner Circle Trader) and Smart Money Concepts (SMC) principles. It helps traders recognize the underlying structure of the trading day using session-based detection aligned to the New York timezone.
🔍 Core Logic:
This script divides each trading day into three logical phases:
Accumulation (19:00–01:00 EST)
The period when institutions quietly build positions within a tight range.
Manipulation (01:00–07:00 EST)
False moves designed to induce retail participation in the wrong direction.
Distribution (07:00–13:00 EST)
The actual directional move after trapping liquidity.
These zones are visually marked on the chart using colored transparent boxes, with labels for clear identification.
🛠️ Key Features:
Session-Based Detection:
Uses Pine Script’s time() function to identify when the chart time falls within each of the defined AMD sessions.
Automatic High/Low Range Detection:
For each phase, the indicator tracks the highest high and lowest low within the session window to draw a price range box.
Visual Markers:
Distinct labels and shaded boxes are plotted for each zone:
🔹 Accumulation → Blue
🔸 Manipulation → Orange
🟢 Distribution → Cyan
Fully Customizable Settings:
Each phase’s visibility, session time, and color can be adjusted from the input panel.
📈 Ideal Use Case:
For traders following ICT/SMC methodology
For intraday structure mapping
To combine with other tools like Order Blocks, FVGs, or session breakouts
⚙️ Customization Options:
✅ Toggle visibility for each phase independently
🕒 Modify session start/end times
🎨 Choose custom colors for phase boxes and labels
⚠️ Note: Best used on intraday timeframes (60 min or lower). The indicator is optimized for charts set to the America/New_York timezone.

Candle Range Theory for SeSe04Small Candle Theory — Automatic Detection of Micro-Retracements
📘 Description
The Small Candle Theory indicator automatically identifies market structures where a small candle forms within the range of a larger previous candle, highlighting potential momentum slowdown or local reversal areas.
This is a price action visualization tool, not a trading signal provider.
⚙️ Detection Conditions
📈 Bullish Signal
Candle 1: Large bearish candle
Candle 2: Small bullish candle
Candle 2 closes within the range of Candle 1
→ A blue triangle appears below the confirmation candle.
📉 Bearish Signal
Candle 1: Large bullish candle
Candle 2: Small bearish candle
Candle 2 closes within the range of Candle 1
→ A red triangle appears above the confirmation candle.
🧠 How to Use
This indicator does not generate buy/sell signals.
It highlights moments of reduced volatility that may precede a potential reversal or continuation, depending on market structure.
Best used:
In confluence with structure tools (support/resistance, order blocks, FVGs, etc.)
With strict risk management
On multiple timeframes
⚙️ Settings
No manual input is required.
Detection logic is automatic and works on any asset or timeframe.
🛎️ Alerts (optional)
You can create an alert in TradingView:
"Create Alert" → Condition: Small Candle Theory (Bullish or Bearish)
to receive notifications when a setup appears.
⚠️ Disclaimer
This script is for educational and analytical purposes only.
It does not constitute financial advice.
Trading involves the risk of losing part or all of your invested capital.

Overnight Time Box Overnight Time Box (22:59 → 09:59, minutes & TZ)
Automatically draws a time-based box for a customizable window that can cross midnight. Perfect for marking the overnight range up to London open (e.g., 22:59–09:59 in Europe/Bucharest), but works with any minute-level window.
What it does
Builds a daily box covering all price action between two user-defined times (e.g., 22:59 → 09:59).
Tracks session High/Low in real time and can plot extended HL lines for reference.
Keeps historical boxes on the chart for backtesting and review (no flicker, no errors).
How to use
Add the script to an intraday chart.
Configure:
Time zone (default: Europe/Bucharest).
Interval (HHMM-HHMM) — e.g., 2259-0959 (minutes supported).
Optional: High/Low lines, fill color, border color, line width.
Use on intraday timeframes (M1–H4).
Note: On Daily/Weekly/Monthly, a heads-up label reminds you it’s designed for intraday use.
Inputs
Time zone: correct DST handling.
Interval (HHMM-HHMM): supports windows that span midnight.
Draw High/Low lines: extended HL guides for the session.
Colors & widths: full visual customization.
Use cases
Mark the overnight range into London open (10:00 RO).
Delimit Killzones / ICT Silver Bullet windows.
Study range, liquidity raids, FVGs before major sessions.
Tech notes
Built on Pine Script v5 using input.session → stable, DST-safe.
Increased max_boxes_count / max_lines_count to preserve history.
Boxes are “frozen” at session end and remain on chart.
Limitations
Intended for intraday only.
One interval per script instance; attach multiple instances for multiple windows.

DTC Killzones ICT🕐 DTC Killzones ICT — Visualize Market Sessions Like a Pro
The DTC Killzones ICT indicator is a clean and intuitive tool designed for traders who want to analyze and visualize institutional trading sessions directly on their charts.
Inspired by ICT’s Killzone concept , this script makes it easy to identify overlapping market sessions — such as London, New York, and Asian — and track how price behaves within each zone.
💡 What It Does
This indicator automatically highlights key market sessions (Killzones) on your chart with fully customizable colors, labels, and transparency.
Each zone dynamically updates to reflect real-time highs and lows, helping you identify:
Session ranges and liquidity zones
Volatility windows and breakout areas
Institutional footprints across sessions
Whether you trade Forex, Indices, or Crypto , this script gives you visual clarity on when and where smart money is likely to move.
⚙️ Main Features
✅ Up to four customizable sessions (New York, London, Asian, and London Close)
✅ Adjustable timeframes and timezone options — sync with your exchange or custom UTC offset
✅ Dynamic high/low range tracking for each session
✅ Toggle range outlines, session labels , and transparency levels
✅ Optional daily dividers and session transition markers
✅ Works on any timeframe and any symbol
🧠 How Traders Use It
ICT-based traders can easily mark Killzones to align with setups like FVGs, liquidity grabs, or Silver Bullet entries.
Intraday traders can visualize session volatility and overlap periods for potential entries.
Swing traders can identify daily structure shifts by tracking range-to-range behavior.
🛠️ Customization
You can fully rename, recolor, or disable each session block.
Adjust the range transparency for visual comfort, and toggle session or daily dividers to fit your workflow.
Everything is designed to be clean, light, and modular — no clutter, no confusion.
⚡ Recommended Settings
For ICT-style analysis:
London Session: 02:00–05:00
New York Session: 07:00–10:00
Asian Session: 19:30–24:00
London Close Session: 10:00–12:00
These time windows are fully editable to suit your timezone or strategy.
🧩 Compatibility
Works seamlessly with TradingView’s built-in timezone tools
Compatible with all instruments and timeframes
Designed to overlay directly on your price chart
🏁 Final Notes
The DTC Killzones ICT indicator focuses purely on market session visualization — no alerts, entries, or trading signals.
It’s designed to complement your existing strategies and enhance clarity when analyzing market behavior across global sessions.
📈 Built for traders who value precision, structure, and timing.

Aibuyzone Vector Strategy - Floating DashboardVector Strategy – Floating Dashboard
The Vector Strategy is a visual trading-analysis tool designed to highlight strong directional candles that may represent impulsive moves in the market. It combines candle-structure analysis, volatility expansion, volume conditions, and trend filters into a single clear visual display.
Core Logic
Identifies candles where the body makes up a significant portion of the full bar range, suggesting strong directional intent.
Uses an ATR (Average True Range) expansion filter to confirm that the current candle’s range is larger than normal volatility.
Optionally applies a wick-imbalance requirement to favor bars showing a clear directional bias.
Can include a volume spike filter, marking candles where volume exceeds a moving average multiple.
Trend and Momentum Filters
Local trend: Defined by a fast and slow EMA pair to show short-term bias.
Higher-timeframe trend: Optionally aligns with an EMA from a higher timeframe to confirm broader momentum.
Momentum: RSI filter avoids generating signals in heavily overbought or oversold conditions.
Fair Value Gap (FVG) Option
When enabled, the script checks for a simple three-bar fair-value-gap structure in the direction of the potential signal, acting as an additional confirmation filter.
Signals and Visuals
Plots fast and slow EMAs to visualize the underlying trend.
Displays up/down shapes when qualifying vector-candle conditions occur.
Optional labels show “Vector Long” or “Vector Short” at the candle where conditions align.
Includes alert conditions for both long and short setups.
Floating Dashboard
A compact floating panel summarizes the most recent signal and market context:
Current signal state (Long / Short / Neutral)
Trend bias (Bullish / Bearish / Flat)
RSI reading
Body-to-range percentage
Volume-spike confirmation
Practical Use
This tool can assist traders in identifying strong impulsive candles aligned with a trend filter.
It is meant to complement a complete trading strategy, not to be used in isolation.
Traders may adjust thresholds such as ATR multiple, body-percentage, or RSI range based on the instrument’s volatility and personal risk tolerance.
Important Notice
This script is provided for educational and analytical purposes only.
It does not provide financial advice, recommendations, or guaranteed results.
Market conditions vary, and past performance does not ensure future outcomes.
Always test and validate any configuration in a simulated environment before live trading.

FVGC — MTF ScreenerFVGC — MTF Screener (by Capital Complex)
Part of the FVGC Suite.
A compact, real-time dashboard that scans the 30s, 1m, 2m, and 3m timeframes for FVGC-compliant conditions—showing a green/red dot when a bullish/bearish setup is arming, and a green/red square when the setup confirms. Built to sit beside FVGC — Signals and FVGC — Visual Overlay so you can monitor multiple timeframes at once without clutter.
---
## What it does
Multi-TF heads-up display : Tracks 30s, 1m, 2m, 3m for valid FVGC criteria.
Clear state encoding:
* Dot = conditions are aligning (setup arming).
* Square = entry model confirmed (go/no-go).
Rule-true logic: Mirrors your FVGC rule set (tap/engulf/inversion and guardrails) so the screener matches what your Signals indicator would accept on each timeframe.
Noise control: Honors your Trading Windows to keep the screen focused on the session you actually trade.
---
## Why traders use it
Time compression: See four lower timeframes progress from “almost” to “confirmed” at a glance.
Discipline aid: Use the dot phase as a heads-up, and the square as the only moment you consider action—no more chart hopping.
Suite cohesion: Screener tells you when, Visual Overlay shows where, Signals defines how.
---
## Key features & options
Timeframes: 30s, 1m, 2m, 3m (fixed for clarity and speed).
FVGC-aligned filters: Honors your suite’s guardrails (e.g., IFVG/BOS logic, midpoint FTC checks, opposing-FVG 50% behavior, opening-range distance caps by TF).
Trading Windows aware: Optional pre-window arming visibility for early heads-up.
Readable UI: On-chart table/HUD with per-state colors (dot/square), custom text color control, and minimal footprint.
Timezone aware: Defaults to America/New_York to align with RTH and your other FVGC tools.
---
## Notes
Designed for index futures, indices, and liquid FX.
This is a visual scanner; it does not place orders. Pair with FVGC — Signals for your actual entry/management logic.
---
## Credits & suite
Capital Complex — FVGC Suite
© TheHiddenMarkets (code components)
---
## Disclaimer
This tool is for educational purposes only and does not constitute financial advice. Trading involves risk; do your own research and manage risk appropriately.

RAFEN-G - Kill Zones & Institutional Gaps🔍 What It Does
Kill Zones (KZ1, KZ2, KZ3)
Automatically highlights the main intraday liquidity windows such as the London open, NY AM, and NY PM sessions — customizable by time, color, and transparency.
Perfect for timing setups, identifying liquidity sweeps, or backtesting session behavior.
Institutional GAP Detection (NY 11:00 → 03:00)
Anchored on the New York H1 clock, the script automatically draws the “institutional gap” between the 11:00 close and the 03:00 open of the next trading day.
Each gap is drawn as a transparent box with a label showing its size in price units.
Dynamic Cleanup & Color Updates
Automatically removes old boxes beyond your chosen history limit and keeps all visuals perfectly synchronized in real-time.
⚙️ Key Features
3 fully independent and editable Kill Zones
Adjustable timezone (default: America/New_York)
Works on all intraday timeframes
Auto-management of historical data
Clean and lightweight visuals (up to 2000 boxes)
Real-time color and transparency updates
Alerts when each Kill Zone starts
🧠 Ideal For
Traders using ICT, SMC, or institutional frameworks who want clear visual separation of market sessions and automatic tracking of session-to-session gaps for confluence or imbalance analysis.
🕐 Recommended Use
Apply on 5 min / 15 min / 1 h charts, align timezone to NYC, and combine with liquidity or FVG tools for maximum insight.
