FVG Sessions [LuxAlgo]The FVG Sessions indicator highlights the first fair value gap of the trading session as well as the session range. Detected fair value gaps extend to the end of the trading session.
Alerts are included on the formation of a session fair value gap, price being within a session fair value gap, mitigations, and price crossing session fair value gaps average.
🔶 USAGE
Trader ICT states that the first fair value gap of the trading session can attract the most significant reaction. Having only one FVG per session allows users to further focus on that precise imbalance as well as external elements.
The mitigation of a fair value gap is clearly indicated on the chart with a more transparent color allowing users to see inverse FVGs.
Extending the fair value gaps allows the imbalance area to provide potential support and resistance.
Do note that this script should be used on intraday charts.
🔶 ALERTS
The script includes the following alerts:
🔹 Bullish/Bearish FVG
Alerts on the formation of the first bullish or bearish FVG of the session.
🔹 Bullish/Bearish FVG Mitigation
Alerts when the first bullish or bearish FVG of the session is mitigated.
🔹 Price Within FVG
Alerts when price is within the first bullish or bearish FVG area of the session.
🔹 Price Cross FVG Average
Alerts when price cross the average level of the first bullish or bearish FVG of the session.
Search in scripts for "gaps"

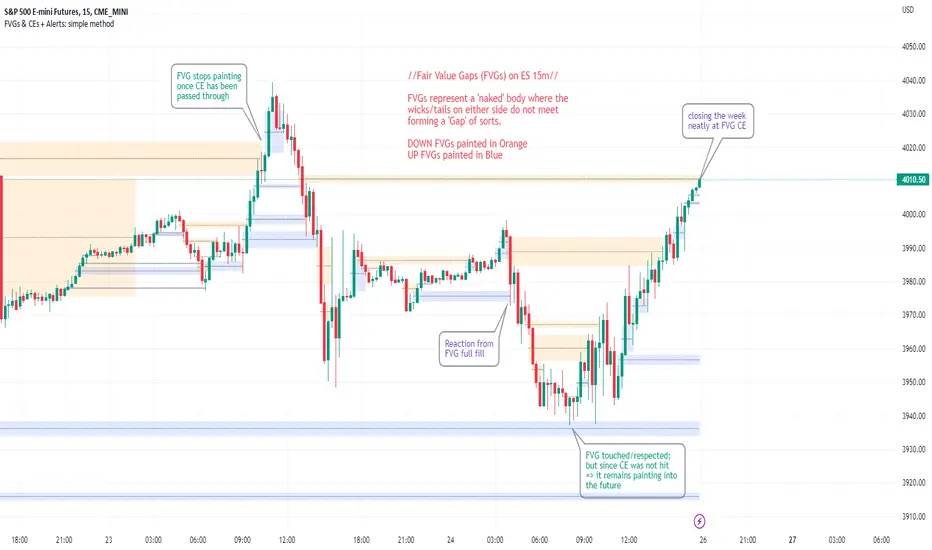
FVGs & CEs + Alerts: simple & efficient methodFair Value Gap indicator: Paints FVGs and their midlines (CEs). Stops painting when CE is hit, or when fully filled; user choice of threshold. This threshold is also used in the Alert conditions.
~~Plotted here on ES1! (CME), on the 15m timeframe~~
-A FVG represents a 'naked' body where the wicks/tails on either side do not meet. This can be seen as a type of 'gap', which price will have a tendency to want to re-fill (in part or in full).
-The midline (CE, or 'Consequent encroachment') of FVGs also tend to show price sensitivity.
-This indicator paints all FVGs until priced into, and should give an idea of which are more meaningful and which are best ignored (based on context: location, Time of day, market structure, etc).
-This is a simpler and more efficient method of painting Fair value gaps which auto-stop painting when price reaches them.
//Aims of Publishing:
-Education of ICT concepts of Fair Value Gaps and their midlines (CEs): To easily see via forward testing or backtesting, the sensitivity that price shows to these areas & levels.
-Demonstration of a much more efficient way of plotting FVGs which terminate at price, thanks to a modification of @Bjorgums's clever looping method referenced below.
//Settings:
-Toggle on/off upward and downward FVGs independently(blue and orange by default).
-Toggle on/off midline (CE).
-Standard color/line formatting options.
-Choose Threshold: CE of FVG or Full Fill of FVG: This will determine both the 'stop-painting' trigger and the 'Alert' trigger.
-Choose number of days lookback to control how many historical FVGs paint on chart.
//On alerts:
-Simple choice of 2 alerts:
~~One for price crossing into/above the nearest untouched 'premium' FVG above ( orange ). Trigger is user choice of CE or full fill.
~~Another for price crossing into/below the nearest untouched 'discount' FVG below (blue). Trigger is user choice of CE or full fill.
-Alerts set via the three dots in indicator status line.
//Cautionary notes:
-Do not use the alerts blindly to find trades. Wait until you have identified a good FVG above/below which you think price may show sensitivity to
-Usage on very low timeframes can cause unexpected results with alerts: due to new FVGs forming in realtime the Alert will always trigger at the most recent FVG above/ below having its threshold hit.
-Big thank you to @Bjorgum for his fantastic extendAndRemove method. Modified here for use with boxes and to integrate Alerts.
-Also Credit to ICT (inner circle trader) for the concepts used here: Fair value gaps and their Consequent Encroachment (CE).
ICT Implied Fair Value Gap (IFVG) [LuxAlgo]An Implied Fair Value Gap (IFVG) is a three candles imbalance formation conceptualized by ICT that is based on detecting a larger candle body & then measuring the average between the two adjacent candle shadows.
This indicator automatically detects this imbalance formation on your charts and can be extended by a user set number of bars.
The IFVG average can also be extended until a new respective IFVG is detected, serving as a support/resistance line.
Alerts for the detection of bullish/bearish IFVG's are also included in this script.
🔶 SETTINGS
Shadow Threshold %: Threshold percentage used to filter out IFVG's with low adjacent candles shadows.
IFVG Extension: Number of bars used to extend highlighted IFVG's areas.
Extend Averages: Extend IFVG's averages up to a new detected respective IFVG.
🔶 USAGE
Users of this indicator can primarily find it useful for trading imbalances just as they would for trading regular Fair Value Gaps or other imbalances, which aims to highlight a disparity between supply & demand.
For trading a bullish IFVG, users can find this imbalance as an area where price is likely to fill or act as an area of support.
In the same way, a user could trade bearish IFVGs by seeing it as a potential area to be filled or act as resistance within a downtrend.
Users can also extend the IFVG averages and use them as longer-term support/resistances levels. This can highlight the ability of detected IFVG to provide longer term significant support and resistance levels.
🔶 DETAILS
Various methods have been proposed for the detection of regular FVG's, and as such it would not be uncommon to see various methods for the implied version.
We propose the following identification rules for the algorithmic detection of IFVG's:
🔹 Bullish
Central candle body is larger than the body of the adjacent candles.
Current price low is higher than high price two bars ago.
Current candle lower shadow makes up more than p percent of its total candle range.
Candle upper shadow two bars ago makes up more than p percent of its total candle range.
The average of the current candle lower shadow is greater than the average of the candle upper shadow two bars ago.
where p is the user set threshold.
🔹 Bearish
Central candle body is larger than the body of the adjacent candles.
Current price high is higher than low price two bars ago.
Current candle upper shadow makes up more than p percent of its total candle range.
Candle lower shadow two bars ago makes up more than p percent of its total candle range.
The average of the candle lower shadow 2 bars ago is greater than the average of the current candle higher shadow.
where p is the user set threshold.
🔶 SUPPLEMENTARY MATERIAL
You can see our previously posted script that detects various imbalances as well as regular Fair Value Gaps which have very similar usability to Implied Fair Value Gaps here:

muh gap! [FAIR VALUE GAP FINDER]Change the colors of the indicator to contrast your chart! Make sure to also change the transparency for the colors.
---
This indicator finds fair value gaps which are inefficiencies in price delivery. Gaps can be used for entry or even bias.
I've included midpoints, lines, and boxes. Boxes have the greatest range with respect to historic PA so keep that in mind.
I will be updating this script in the future, potentially adding an MTF function, mitigation of gaps and alarms.
Let me know if you guys have any additional ideas.
Best,
P

VolatilityLibrary "Volatility"
Functions for determining if volatility (true range) is within or exceeds normal.
The "True Range" (ta.tr) is used for measuring volatility.
Values are normalized by the volume adjusted weighted moving average (VAWMA) to be more like percent moves than price.
current(len) Returns the current price adjusted volatitlity ratio.
Parameters:
len : Number of bars to get a volume adjusted weighted average price.
normal(len, maxDeviation, level, gapDays, spec, res) Returns the normal upper range of volatility. Compensates for overnight gaps within a regular session.
Parameters:
len : Number of bars to measure volatility.
maxDeviation : The limit of volatility before considered an outlier.
level : The amount of standard deviation after cleaning outliers to be considered within normal.
gapDays : The number of days in the past to measure overnight gap volaility.
spec : session.regular (default), session.extended or other time spec.
res : The resolution (default = '1440').
isNormal(len, maxDeviation, level, gapDays, spec, res) Returns true if the volatility (true range) is within normal levels. Compensates for overnight gaps within a regular session.
Parameters:
len : Number of bars to measure volatility.
maxDeviation : The limit of volatility before considered an outlier.
level : The amount of standard deviation after cleaning outliers to be considered within normal.
gapDays : The number of days in the past to measure overnight gap volaility.
spec : session.regular (default), session.extended or other time spec.
res : The resolution (default = '1440').
severity(len, maxDeviation, level, gapDays, spec, res) Returns ratio of the current value to the normal value. Compensates for overnight gaps within a regular session.
Parameters:
len : Number of bars to measure volatility.
maxDeviation : The limit of volatility before considered an outlier.
level : The amount of standard deviation after cleaning outliers to be considered within normal.
gapDays : The number of days in the past to measure overnight gap volaility.
spec : session.regular (default), session.extended or other time spec.
res : The resolution (default = '1440').
Higher TF - Repainting + Limiting backtest resultsThis strategy is for illustration purpose only. Do not use this as there is massive repainting.
As usual, I was experimenting with adding different entry/exit filters to my main strategy. Thought of adding higher frame filter, picked the code for getting higher time frame supertrend from someone else's script and copied it without thinking much about it.
security(syminfo.tickerid, f_multiple_resolution(HTFMultiplier), supertrend(SupertrendMult, SupertrendPd), lookahead = true, gaps=true)
Started getting better results with this result. I was very much impressed and while trying to enhance further, I started disabling my other entry and exit filters which I generally use.
That worked pretty well without any of my other filters. Hence, thought I will forward test this on a smaller timeframe.
To my surprise, even in forward testing, i was not able to notice repainting very much. It also appeared that smaller timeframes yielded better results. (This wasn't the case with any of my strategies)
Which then prompted me to study the security function and lookahead and gap parameters. Learned that lookahead and gap when set to true will lead to massive repainting - specially if you are using higher timeframes. Hence, these parameters are not advisable to use in strategies.
Further information here: www.tradingview.com
I added three repaint options to further illustrate how security function will work:
Yes : Use security with lookahead and merge set to true
No - set lookahead false : Use security with lookahead and merge set to false
No - do not use security : Falls back to original command on current timeframe. Switch timeframe to HTF resolution to compare the difference.
Conclusion : Always set lookahead and gaps to false when using security function in strategies.
PS: Script also contains code to limit backtesting to certain days/months/years. This can be used as is in other scripts.

Auto-Anchored Fibonacci Volume Profile [Custom Array Engine]Description:
1. The Theoretical Foundation: Structure vs. Participation In professional technical analysis, traders often struggle to reconcile two distinct datasets: Price Geometry (where price should go) and Market Participation (where money actually went).
Why Fibonacci? (The Structure) Fibonacci Retracements map the mathematical structure of a trend. They identify psychological and algorithmic "interest zones" (0.382, 0.5, 0.618) where a correction is statistically likely to terminate. However, Fibonacci levels are theoretical—they are "lines in the sand" that do not guarantee liquidity or reaction.
Why Volume Profile? (The Verification) Volume Profile maps the historical exchange of shares at specific price levels. It reveals "fair value" (High Volume Nodes) and "market imbalance" (Low Volume Nodes). It is the only tool that verifies if a specific price level was actually accepted by institutional participants.
2. Underlying Calculations (The Custom Engine) This script operates on a custom-built calculation engine that bypasses standard built-in functions entirely. It uses Pine Script Arrays to build a Volume Profile from scratch. Here is the breakdown of the proprietary code logic:
A. The "Smart-Fill" Distribution Algorithm (Solves Gapping)
The Problem: Standard volume scripts often assign a candle's entire volume to a single price row. In volatile markets or steep trends, this creates visual "gaps" or a "barcode" effect because price moved too fast to register on every row.
My Solution: I wrote a custom loop that calculates the vertical overlap of every candle against the profile grid.
The Math: Volume Per Bin = Total Candle Volume / Bins Touched.
The Result: If a single volatile candle spans 10 price rows (bins), the script mathematically divides that volume and distributes it equally into all 10 array indices. This generates a solid, continuous distribution curve that accurately reflects price action through the entire candle range, not just the close.
B. Dynamic Arrays & Split-Volume Logic The script initializes two separate floating-point arrays (buyVolArray and sellVolArray) sized to the user's resolution (up to 300 rows). It iterates through the specific time-window of the swing:
If Close >= Open, the calculated volume slice is injected into the Buy Array.
If Close < Open, it is injected into the Sell Array.
These arrays are then visually stacked to render the dual-color profile, allowing traders to see the "Delta" (Buyer vs. Seller aggression) at key structural levels.
C. Custom Garbage Collection (Performance) To enable the "Auto-Anchoring" feature without causing chart lag or visual artifacts ("ghosting"), the script includes a Garbage Collection System. Before drawing a new profile, the script iterates through a tracking array of all existing objects (box.delete, line.delete) and clears them from memory. This ensures the indicator remains lightweight and responsive even when dragging chart margins or switching timeframes.
3. The Synthesis: Why Combine Them? The core philosophy of this script is Confluence . A Fibonacci level without volume is merely a suggestion; a Fibonacci level backed by volume is a defensive wall. By algorithmically anchoring a Volume Profile to the exact coordinates of a Fibonacci swing, this tool allows traders to instantly answer critical questions:
"Is the Golden Pocket (0.618) supported by a High Volume Node (HVN), or is it a Low Volume Node (LVN) that price might slice through?"
"Is the Shallow Retracement (0.382) holding because of structural support, or just a lack of selling pressure?"
4. How to Read the Indicator
The Geometry: The script automatically detects the trend and draws standard Fib levels (0, 0.236, 0.382, 0.5, 0.618, 0.786, 1.0).
The Confluence Check: Look for the Point of Control (Red Line). If this High Volume Node aligns with a key Fib level (e.g., the 0.618), the probability of a reversal increases significantly.
The Imbalance Check: Look for "Valleys" in the profile (Low Volume Nodes). These gaps often act as "slippage zones" where price travels quickly between structural levels.
Buy/Sell Splits: The dual-color bars (Teal/Red) reveal the composition of the volume. A 0.618 level held up by dominant Buy Volume is a stronger bullish signal than one with mixed volume.
5. Settings & Customization
Lookback Length: Sensitivity of the swing detection (Default: 200 bars).
Resolution: Granularity of the profile rows (Default: 100). Higher values provide smoother definition.
Width (%): Responsive sizing that scales the profile relative to the trend's duration.
Extend Lines: Option to project structural levels infinitely to the right.
Disclaimer This script is an analytical tool for visualizing historical market data. It does not provide trade signals or financial advice.

GME Warrant Tracker [theUltimator5]The GME Warrant Tracker was designed to be used for GME warrants tracking. The theory behind this indicator is that warrants are priced similarly to options and generally follow the same Greeks. With that assumption, we can break down the price of the warrants by using known Greeks to estimate either the theoretical price, or even estimate Implied Volatility (IV).
The base settings for this indicator plot the calculated IV, the theoretical price (there are multiple methods of calculation which I will discuss later) and the current warrant price.
You can toggle on or off all of these plots to display only what you want to track.
For example, you can simply track the difference between the theoretical price and the current price to see if warrants are trading at a premium or a discount vs what the indicator calculates it to be.
Calculating implied volatility is extremely difficult and must be approximated.
The theoretical warrant price produced by this indicator depends primarily on the volatility input (σ) used in the Black–Scholes pricing model.
This script supports five distinct methods for approximating σ, each extracting different information from the market.
1) Close-to-Close Historical Volatility
Close-to-Close computes the standard deviation of daily close-to-close returns and uses a lookback window scaled to time-to-expiry. As the expiration approaches, the lookback window tightens, giving a more responsive volatility approximation relative to time-to-expiry.
This option produces conservative approximations for volatility, and may lag actual volatility intraday.
2) Parkinson High-Low Volatility
Parkinson High-Low volatility uses daily high and low prices to calculate intraday trading range for a more responsive estimation to volatility. It ignores opening and close gaps, so overnight volatility is not accounted for.
This option produces higher theoretical volatility during choppy price action and can over estimate actual volatility.
3) Garman–Klass Volatility
Garman–Klass volatility is a way to estimate how much price is fluctuating by using the open, high, low, and close for each period. Because it draws on multiple intraperiod price points (not just the range or close-to-close moves), it typically produces a tighter, more informative volatility estimate than simpler approaches. It’s often most helpful when gaps occur and when the open and close carry meaningful information about the session’s trading.
4)Yang–Zhang Volatility
The Yang–Zhang volatility estimator is designed to account for both opening jumps and price drift. It estimates volatility by combining overnight (close-to-open) variance, intraday (open-to-close) variance, and a weighted Rogers–Satchell component using OHLC data, often yielding a more robust measure than simpler close-to-close style estimators.
5) Option price
By default, the indicator uses the call option strike dated closest to the warrant expiration date. Since the Greeks for both the warrants and the
options are assumed to be equivalent with a minor difference in theta (time-to-expiry), the theoretical price of the warrants closely matches the trade price of the call strike chosen.
There is a table that can be enabled (off by default because it is large and fills entire screen on mobile) which shows all the configuration settings and Greeks.
You can also manually adjust the "dilution" factor for the warrants, which shifts the number of active warrants and moves the count into the shares outstanding for the underlying (GME). The reason for this is that as warrants get exercised, the total quantity of warrants in circulation decreases and the the total quantity of shares outstanding increases.
Since this indicator was built around the single warrant, ticker NYSE: GME/W, it is only meant to be used with NYSE:GME. Any other ticker will not work properly with this indicator.

AI Market Open - Live Session Tracker (PDH/PDL/ONH/ONL)🤖 AI MARKET OPEN - LIVE SESSION TRACKER
A comprehensive real-time tracking system designed for intraday traders who trade the market open using previous day levels (PDH/PDL) and overnight session ranges (ONH/ONL). This indicator provides intelligent context and mitigation tracking to help you make informed trading decisions during the critical morning session.
═══════════════════════════════════════════════════════════════
📊 WHAT THIS INDICATOR DOES
This indicator automatically tracks and displays six critical price levels:
• PDH (Previous Day High) - Yesterday's regular session high (9:30 AM - 4:00 PM ET)
• PDL (Previous Day Low) - Yesterday's regular session low
• PDC (Previous Day Close) - Yesterday's 3:59 PM ET close price
• ONH (Overnight High) - Overnight session high (6:00 PM - 9:29 AM ET)
• ONL (Overnight Low) - Overnight session low
• 9:30 Open - The exact opening price at market open
It monitors whether each level has been "mitigated" (touched/tested) in real-time and provides AI-generated context about current market structure.
═══════════════════════════════════════════════════════════════
🎯 KEY FEATURES
✅ REAL-TIME MITIGATION TRACKING
• Live status updates showing ✅ (mitigated) or ⏳ (unmitigated) for each level
• Persistent tracking - once a level is touched, it stays marked
• Gap fill detection with 🌕 (filled) or 🌒 (open) status
✅ DYNAMIC CALCULATIONS
• Δ Open: Distance from 9:30 AM opening price to each level
• RT Δ: Real-time distance from current price to each level
• Automatic color coding (green for resistance, red for support)
✅ AI MARKET CONTEXT SUMMARY
The indicator generates intelligent commentary based on:
• Gap size classification (large/moderate/small)
• PDH/PDL mitigation status
• Current position within overnight range
• Directional bias and key levels to watch
✅ CUSTOMIZABLE DISPLAY
• Choose table position (9 locations available)
• Adjustable text size (tiny/small/normal/large)
• Custom colors for headers, summary text, and background
• Show/hide table with single toggle
✅ PROFESSIONAL LEVEL LINES
• Ray-style horizontal lines extending right
• Customizable line width (1-4)
• Three line styles: Solid, Dashed, Dotted
• Color-coded labels with exact price values
• Lines auto-update and reset each session
═══════════════════════════════════════════════════════════════
🔧 HOW IT WORKS
SESSION TRACKING
• Regular Session: 9:30 AM - 4:00 PM ET (for PDH/PDL calculation)
• Close Capture: 3:59 PM ET close becomes PDC
• Overnight Session: 6:00 PM - 9:29 AM ET (for ONH/ONL)
• Session Reset: 6:00 PM ET daily
MITIGATION LOGIC
A level is considered "mitigated" when price touches or crosses it:
• PDH mitigated: High >= PDH at any point after 6:00 PM previous day
• PDL mitigated: Low <= PDL at any point after 6:00 PM previous day
• ONH mitigated: High >= ONH after 9:30 AM open
• ONL mitigated: Low <= ONL after 9:30 AM open
• Gap filled: Price crosses PDC after gapping up or down
AI SUMMARY ALGORITHM
The indicator analyzes three key dimensions:
1. GAP CLASSIFICATION
• Large gap (>50 pts): Suggests gap-fill or extension scenarios
• Moderate gap (20-50 pts): Monitor overnight levels for direction
• Small gap (<20 pts): Range-bound expectation
2. PDH/PDL STATUS
• Both untested: Clean liquidity zones
• One mitigated: Remaining level becomes primary target
• Both mitigated: Expect range/balance trade
3. OVERNIGHT RANGE POSITION
• Top 25%: Bullish bias, watch PDH
• Mid-upper: Slight bull bias
• Mid-lower: Neutral
• Bottom 25%: Vulnerable to PDL sweep
═══════════════════════════════════════════════════════════════
📖 HOW TO USE
STEP 1: ADD TO CHART
• Apply to any intraday timeframe (1m, 5m, 15m recommended)
• Works on ES, NQ, YM, RTY, and other CME futures
• Can be used on stocks and forex (adjust session times accordingly)
STEP 2: SET YOUR TIMEZONE
• Default: America/New_York (Eastern Time)
• Also supports: Chicago, Los Angeles, Phoenix
• Ensure your chart timezone matches your selection
STEP 3: CUSTOMIZE APPEARANCE
• Position table where it doesn't block your chart action
• Adjust text size based on screen resolution
• Customize colors to match your chart theme
• Toggle line styles for visual preference
STEP 4: INTERPRET THE DATA
• Before market open (pre-9:30 AM): Review gap size and overnight levels
• At market open: Check which levels are closest to price
• During session: Monitor mitigation status and RT Δ values
• Read AI summary for contextual bias and key scenarios
STEP 5: APPLY TO YOUR STRATEGY
• Use unmitigated levels as potential targets
• Watch for reactions when price approaches key levels
• Gap-fill setups: Trade reversions when gap is open
• Breakout setups: Trade continuations when levels get mitigated
═══════════════════════════════════════════════════════════════
⚙️ INDICATOR SETTINGS
DISPLAY SETTINGS
• Timezone: Select your local market timezone
• Table Position: 9 locations (corners, edges, center)
• Text Size: tiny | small | normal | large
• Show Summary Table: Toggle on/off
COLOR CUSTOMIZATION
• Header Text Color: Default white
• AI Summary Color: Default aqua
• Background Color: Default semi-transparent black
• Border Color: Default blue
LINE CUSTOMIZATION (PDH)
• Line Width: 1-4 pixels
• Line Style: Solid | Dashed | Dotted
• Color: Default red with 40% transparency
LINE CUSTOMIZATION (PDL)
• Line Width: 1-4 pixels
• Line Style: Solid | Dashed | Dotted
• Color: Default green with 40% transparency
LINE CUSTOMIZATION (PDC)
• Line Width: 1-4 pixels
• Line Style: Solid | Dashed | Dotted
• Color: Default yellow with 60% transparency
LINE CUSTOMIZATION (ONH)
• Line Width: 1-4 pixels
• Line Style: Solid | Dashed | Dotted
• Color: Default orange with 50% transparency
LINE CUSTOMIZATION (ONL)
• Line Width: 1-4 pixels
• Line Style: Solid | Dashed | Dotted
• Color: Default blue with 50% transparency
LINE CUSTOMIZATION (9:30 Open)
• Line Width: 1-4 pixels
• Line Style: Solid | Dashed | Dotted
• Color: Default white with 50% transparency
═══════════════════════════════════════════════════════════════
💡 BEST PRACTICES
✓ Use on 1-minute or 5-minute charts for precise level tracking
✓ Combine with volume profile for confluence
✓ Wait for confirmation candles near key levels
✓ Pay attention to gap-fill probability (larger gaps more likely to fill)
✓ Use RT Δ values to gauge distance and set realistic targets
✓ Review AI summary each morning for bias and scenario planning
✓ Don't trade blindly - use levels as reference points, not mechanical signals
═══════════════════════════════════════════════════════════════
⚠️ IMPORTANT NOTES
• This indicator is designed for CME session times (futures markets)
• For stocks, session times may differ - adjust expectations accordingly
• Levels reset daily at 6:00 PM ET - no weekend carryover
• Mitigation tracking persists throughout the session
• The AI summary provides context, not trade signals
• Always use proper risk management
═══════════════════════════════════════════════════════════════
📌 IDEAL FOR
• Day traders focusing on market open
• Scalpers using previous day levels
• Session-based traders (Asia/London/NY)
• Traders who need automated level tracking
• Anyone trading overnight gaps and ranges
═══════════════════════════════════════════════════════════════
🔄 VERSION HISTORY
v1.0 - Initial Release
• Core tracking system for PDH/PDL/PDC/ONH/ONL/Open
• Real-time mitigation status
• AI context summary
• Fully customizable display and lines
• Multi-timezone support
═══════════════════════════════════════════════════════════════
📧 FEEDBACK & SUPPORT
If you find this indicator helpful, please:
• Leave a like 👍
• Add to favorites ⭐
• Share with fellow traders
• Comment with suggestions or questions
Happy trading! 📈
═══════════════════════════════════════════════════════════════

Candle Pattern Library [1CG]Candle Pattern Library
A comprehensive and easy-to-use Pine Script™ library for detecting single, two, and three-candle patterns. This library provides detailed pattern analysis including size classification, direction validation, and specific pattern identification.
Quick Start
1. Import the Library
import OneCleverGuy/CandlePatternLibrary/1 as CPL
2. Analyze Candles
Use the main analysis functions to detect patterns. You can analyze the current forming candle or confirmed historical candles.
// 1. Analyze candles (Current , Previous , and the one before )
// Note: We use full variable names for clarity.
CandleData candleNewest = CPL.analyzeCandle(open, high, low, close, 250, 50, 10, 50, 85)
CandleData candleMiddle = CPL.analyzeCandle(open , high , low , close , 250, 50, 10, 50, 85)
CandleData candleOldest = CPL.analyzeCandle(open , high , low , close , 250, 50, 10, 50, 85)
// 2. Analyze multi-candle patterns
// Pass candles in chronological order: Oldest -> Newest
var twoCandleData = CPL.analyzeTwoCandlePattern(candleMiddle, candleNewest, 10, 85)
var threeCandleData = CPL.analyzeThreeCandlePattern(candleOldest, candleMiddle, candleNewest)
Enums Reference
These are the Enum Types exported by the library. When checking results, use the pattern Alias.EnumType.Value (e.g., CPL.CandlePattern.Hammer).
CandlePattern
Enum Type for single-candle formations.
Usage: CPL.CandlePattern.
Values:
Unknown : No specific pattern detected.
RegularBullish : A standard bullish candle.
RegularBearish : A standard bearish candle.
BullishMarubozu : Bullish candle with little to no wicks.
BearishMarubozu : Bearish candle with little to no wicks.
Hammer : Small body at the top of the range (bullish reversal).
ShootingStar : Small body at the bottom of the range (bearish reversal).
SpinningTop : Small body centered in the range.
Doji : Open and close are effectively equal.
LongLeggedDoji : Doji with long upper and lower wicks.
CrossDoji : Doji with the body in the upper section.
DragonflyDoji : Doji where open/close are at the high.
InvertedCrossDoji : Doji with the body in the lower section.
GravestoneDoji : Doji where open/close are at the low.
FourPriceDoji : Open, High, Low, and Close are all equal.
TwoCandlePattern
Enum Type for two-candle formations.
Usage: CPL.TwoCandlePattern.
Values:
None : No two-candle pattern detected.
BullishEngulfingWeak : Bullish candle engulfs the previous body (close does not engulf range).
BullishEngulfingStrong : Bullish candle completely engulfs the previous body close outside range.
BearishEngulfingWeak : Bearish candle engulfs the previous body.
BearishEngulfingStrong : Bearish candle completely engulfs the previous body.
InsideBar : The second candle is completely contained within the first.
TweezerTop : Two candles with matching highs (bearish reversal).
TweezerBottom : Two candles with matching lows (bullish reversal).
BullishRailRoad : Two opposite Marubozus (Down -> Up).
BearishRailRoad : Two opposite Marubozus (Up -> Down).
ThreeCandlePattern
Enum Type for three-candle formations.
Usage: CPL.ThreeCandlePattern.
Values:
None : No three-candle pattern detected.
ThreeWhiteSoldiers : Three consecutive bullish candles.
ThreeBlackCrows : Three consecutive bearish candles.
ThreeWhiteSoldiersWithBullishFVG : Three White Soldiers containing a Bullish FVG.
ThreeWhiteSoldiersWithBearishFVG : Three White Soldiers containing a Bearish FVG.
ThreeBlackCrowsWithBullishFVG : Three Black Crows containing a Bullish FVG.
ThreeBlackCrowsWithBearishFVG : Three Black Crows containing a Bearish FVG.
MorningStar : Bearish -> Small/Doji -> Bullish (Bullish Reversal).
EveningStar : Bullish -> Small/Doji -> Bearish (Bearish Reversal).
BullishAbandonedBaby : Morning Star with gaps between all candles.
BearishAbandonedBaby : Evening Star with gaps between all candles.
EngulfingSandwich : Bearish -> Bullish (Engulfing) -> Bearish (Inside).
BullishFairValueGap : A gap between Candle 1 High and Candle 3 Low.
BearishFairValueGap : A gap between Candle 1 Low and Candle 3 High.
CandleSize
Enum Type for candle size classification.
Usage: CPL.CandleSize.
Values:
Short
Normal
Long
CandleDirection
Enum Type for candle direction classification.
Usage: CPL.CandleDirection.
Values:
Bearish
Neutral
Bullish
Function Reference
Analysis Functions
analyzeCandle(_open, _high, _low, _close, _avgSize, _sizeThresholdPct, _equivTolerance, _bodyTolerance, _positionThreshold)
analyzeCandle - Analyzes a single candle's OHLC data to determine its size, direction, and single-candle pattern.
Parameters:
_open (float) : (float) - Candle open price.
_high (float) : (float) - Candle high price.
_low (float) : (float) - Candle low price.
_close (float) : (float) - Candle close price.
_avgSize (float) : (float) - Baseline size (wick range) to compare against.
_sizeThresholdPct (float) : (float) - % difference from average to be considered Long/Short (e.g., 50.0).
_equivTolerance (float) : (float) - Absolute price diff for Close to equal Open (Doji checks).
_bodyTolerance (float) : (float) - Absolute price diff for "Small Body" checks.
_positionThreshold (int) : (int) - Int (0-100) determining valid wick ratios for Hammers/Shooting Stars (e.g., 85).
Returns: (CandleData) - CandleData object containing CandlePattern, CandleSize, CandleDirection.
analyzeTwoCandlePattern(_candle1, _candle2, _equivTolerance, _positionThreshold)
analyzeTwoCandlePattern - Analyzes two consecutive candles to find pairs like Engulfing, Tweezers, or Inside Bars.
Parameters:
_candle1 (CandleData) : (CandleData) - The first (older) candle data (previous).
_candle2 (CandleData) : (CandleData) - The second (newer) candle data (current).
_equivTolerance (float) : (float) - Price tolerance for matching highs/lows (Tweezers).
_positionThreshold (int) : (int) - Threshold for wick validations.
Returns: (TwoCandleData) - TwoCandleData object containing TwoCandlePattern.
analyzeThreeCandlePattern(_candle1, _candle2, _candle3)
analyzeThreeCandlePattern - Analyzes three consecutive candles to find complex patterns like Morning Stars, Abandoned Babies, or Three White Soldiers.
Parameters:
_candle1 (CandleData) : (CandleData) - The first (oldest) candle data.
_candle2 (CandleData) : (CandleData) - The second (middle) candle data.
_candle3 (CandleData) : (CandleData) - The third (newest) candle data.
Returns: (ThreeCandleData) - ThreeCandleData object containing ThreeCandlePattern.
Naming Utilities
getPatternName(_pattern)
getPatternName - Returns the string name of a candle pattern.
Parameters:
_pattern (CandlePattern) : (CandlePattern) - The candle pattern enum value.
Returns: (string) - Human-readable pattern name (e.g., "Hammer").
getTwoCandlePatternName(_pattern)
getTwoCandlePatternName - Returns the string name of a two-candle pattern.
Parameters:
_pattern (TwoCandlePattern) : (TwoCandlePattern) - The two-candle pattern enum value.
Returns: (string) - Human-readable pattern name (e.g., "Bullish Engulfing").
getThreeCandlePatternName(_pattern)
getThreeCandlePatternName - Returns the string name of a three-candle pattern.
Parameters:
_pattern (ThreeCandlePattern) : (ThreeCandlePattern) - The three-candle pattern enum value.
Returns: (string) - Human-readable pattern name (e.g., "Morning Star").
getSizeName(_size)
getSizeName - Returns the string name of a candle size.
Parameters:
_size (CandleSize) : (CandleSize) - The candle size enum value.
Returns: (string) - Human-readable size name ("Short", "Normal", or "Long").
getDirectionName(_direction)
getDirectionName - Returns the string name of a candle direction.
Parameters:
_direction (CandleDirection) : (CandleDirection) - The candle direction enum value.
Returns: (string) - Human-readable direction name ("Bullish", "Bearish", or "Neutral").

Displacement## Displacement Indicator (Institutional Momentum Filter)
This indicator highlights **true price displacement** — candles where price moves with **abnormal force relative to recent volatility**.
It is designed to help traders distinguish **real momentum** from normal market noise.
Displacement often precedes:
- Breaks of structure
- Fair Value Gaps (FVGs)
- Strong continuation or meaningful pullbacks
This tool focuses on **confirmation**, not prediction.
---
### 🔍 How Displacement Is Defined
A candle is marked as *displacement* only when **all conditions are met**:
• Candle body is larger than a multiple of ATR (volatility-adjusted)
• Candle body makes up a high percentage of the full candle (strong close)
• Directional conviction (bullish or bearish close)
This filters out:
- Small or average candles
- Wick-heavy indecision
- Low-quality breakouts
---
### 🎯 What This Indicator Is Best Used For
✔ Confirming impulsive moves
✔ Validating structure breaks
✔ Anchoring Fair Value Gaps
✔ Filtering low-probability setups
✔ Identifying institutional participation
Works best on **M5, M15, and H1**, especially during **London and NY sessions**.
---
### ⚠️ Important Notes
• This is **not** a buy/sell signal by itself
• Best used with trend, structure, or liquidity context
• Not designed for ranging or low-volatility markets
Think of this indicator as a **momentum truth filter** —
if displacement is missing, conviction is likely missing too.
---
### ⚙️ Inputs Explained
• ATR Length – defines normal volatility
• ATR Multiplier – how aggressive displacement must be
• Minimum Body % – ensures strong candle closes
All inputs are adjustable to fit different markets and styles.
---
### 🧠 Philosophy
Displacement reflects **commitment**, not anticipation.
This tool helps you wait for **proof**, not hope.
---
If you want, I can:
- Tighten this for **ICT-style language**
- Rewrite for **beginner clarity**
- Add a **“How I personally use it”** section
- Optimize it for **TradingView algorithm visibility**
**Tell me which you want changed.**

Simple Candle Strategy# Candle Pattern Strategy - Pine Script V6
## Overview
A TradingView trading strategy script (Pine Script V6) that identifies candlestick patterns over a configurable lookback period and generates trading signals based on pattern recognition rules.
## Strategy Logic
The strategy analyzes the most recent N candlesticks (default: 5) and classifies their patterns into three categories, then generates buy/sell signals based on specific pattern combinations.
### Candlestick Pattern Classification
Each candlestick is classified as one of three types:
| Pattern | Definition | Formula |
|---------|-----------|---------|
| **Close at High** | Close price near the highest price of the candle | `(high - close) / (high - low) ≤ (1 - threshold)` |
| **Close at Low** | Close price near the lowest price of the candle | `(close - low) / (high - low) ≤ (1 - threshold)` |
| **Doji** | Opening and closing prices very close; long upper/lower wicks | `abs(close - open) / (high - low) ≤ threshold` |
### Trading Rules
| Condition | Action | Signal |
|-----------|--------|--------|
| Number of Doji candles ≥ 3 | **SKIP** - Market is too chaotic | No trade |
| "Close at High" count ≥ 2 + Last candle closes at high | **LONG** - Bullish confirmation | Buy Signal |
| "Close at Low" count ≥ 2 + Last candle closes at low | **SHORT** - Bearish confirmation | Sell Signal |
## Configuration Parameters
All parameters are adjustable in TradingView's "Settings/Inputs" tab:
| Parameter | Default | Range | Description |
|-----------|---------|-------|-------------|
| **K-line Lookback Period** | 5 | 3-20 | Number of candlesticks to analyze |
| **Doji Threshold** | 0.1 | 0.0-1.0 | Body size / Total range ratio for doji identification |
| **Doji Count Limit** | 3 | 1-10 | Number of dojis that triggers skip signal |
| **Close at High Proximity** | 0.9 | 0.5-1.0 | Required proximity to highest price (0.9 = 90%) |
| **Close at Low Proximity** | 0.9 | 0.5-1.0 | Required proximity to lowest price (0.9 = 90%) |
### Parameter Tuning Guide
#### Proximity Thresholds (Close at High/Low)
- **0.95 or higher**: Stricter - only very strong candles qualify
- **0.90 (default)**: Balanced - good for most market conditions
- **0.80 or lower**: Looser - catches more patterns, higher false signals
#### Doji Threshold
- **0.05-0.10**: Strict doji identification
- **0.10-0.15**: Standard doji detection
- **0.15+**: Includes near-doji patterns
#### Lookback Period
- **3-5 bars**: Fast, sensitive to recent patterns
- **5-10 bars**: Balanced approach
- **10-20 bars**: Slower, filters out noise
## Visual Indicators
### Chart Markers
- **Green Up Arrow** ▲: Long entry signal triggered
- **Red Down Arrow** ▼: Short entry signal triggered
- **Gray X**: Skip signal (too many dojis detected)
### Statistics Table
Located at top-right corner, displays real-time pattern counts:
- **Close at High**: Count of candles closing near the high
- **Close at Low**: Count of candles closing near the low
- **Doji**: Count of doji/near-doji patterns
### Signal Labels
- Green label: "✓ Long condition met" - below entry bar
- Red label: "✓ Short condition met" - above entry bar
- Gray label: "⊠ Too many dojis, skip" - trade skipped
## Risk Management
### Exit Strategy
The strategy includes built-in exit rules based on ATR (Average True Range):
- **Stop Loss**: ATR × 2
- **Take Profit**: ATR × 3
Example: If ATR is $10, stop loss is at -$20 and take profit is at +$30
### Position Sizing
Default: 100% of equity per trade (adjustable in strategy properties)
**Recommendation**: Reduce to 10-25% of equity for safer capital allocation
## How to Use
### 1. Copy the Script
1. Open TradingView
2. Go to Pine Script Editor
3. Create a new indicator
4. Copy the entire `candle_pattern_strategy.pine` content
5. Click "Add to Chart"
### 2. Apply to Chart
- Select your preferred timeframe (1m, 5m, 15m, 1h, 4h, 1d)
- Choose a trading symbol (stocks, forex, crypto, etc.)
- The strategy will generate signals on all historical bars and in real-time
### 3. Configure Parameters
1. Right-click the strategy on chart → "Settings"
2. Adjust parameters in the "Inputs" tab
3. Strategy will recalculate automatically
4. Backtest results appear in the Strategy Tester panel
### 4. Backtesting
1. Click "Strategy Tester" (bottom panel)
2. Set date range for historical testing
3. Review performance metrics:
- Win rate
- Profit factor
- Drawdown
- Total returns
## Key Features
✅ **Execution Model Compliant** - Follows official Pine Script V6 standards
✅ **Global Scope** - All historical references in global scope for consistency
✅ **Adjustable Sensitivity** - Fine-tune all pattern detection thresholds
✅ **Real-time Updates** - Works on both historical and real-time bars
✅ **Visual Feedback** - Clear signals with labels and statistics table
✅ **Risk Management** - Built-in ATR-based stop loss and take profit
✅ **No Repainting** - Signals remain consistent after bar closes
## Important Notes
### Before Trading Live
1. **Backtest thoroughly**: Test on at least 6-12 months of historical data
2. **Paper trading first**: Practice with simulated trades
3. **Optimize parameters**: Find the best settings for your trading instrument
4. **Manage risk**: Never risk more than 1-2% per trade
5. **Monitor performance**: Review trades regularly and adjust as needed
### Market Conditions
The strategy works best in:
- Trending markets with clear directional bias
- Range-bound markets with defined support/resistance
- Markets with moderate volatility
The strategy may underperform in:
- Highly choppy/noisy markets (many false signals)
- Markets with gaps or overnight gaps
- Low liquidity periods
### Limitations
- Works on chart timeframes only (not intrabar analysis)
- Requires at least 5 bars of history (configurable)
- Fixed exit rules may not suit all trading styles
- No trend filtering (will trade both directions)
## Technical Details
### Historical Buffer Management
The strategy declares maximum bars back to ensure enough historical data:
```pine
max_bars_back(close, 20)
max_bars_back(open, 20)
max_bars_back(high, 20)
max_bars_back(low, 20)
```
This prevents runtime errors when accessing historical candlestick data.
### Pattern Detection Algorithm
```
For each bar in lookback period:
1. Calculate (high - close) / (high - low) → close_to_high_ratio
2. If close_to_high_ratio ≤ (1 - threshold) → count as "Close at High"
3. Calculate (close - low) / (high - low) → close_to_low_ratio
4. If close_to_low_ratio ≤ (1 - threshold) → count as "Close at Low"
5. Calculate abs(close - open) / (high - low) → body_ratio
6. If body_ratio ≤ doji_threshold → count as "Doji"
Signal Generation:
7. If doji_count ≥ cross_count_limit → SKIP_SIGNAL
8. If close_at_high_count ≥ 2 AND last_close_at_high → LONG_SIGNAL
9. If close_at_low_count ≥ 2 AND last_close_at_low → SHORT_SIGNAL
```
## Example Scenarios
### Scenario 1: Bullish Signal
```
Last 5 bars pattern:
Bar 1: Closes at high (95%) ✓
Bar 2: Closes at high (92%) ✓
Bar 3: Closes at mid (50%)
Bar 4: Closes at low (10%)
Bar 5: Closes at high (96%) ✓ (last bar)
Result:
- Close at high count: 3 (≥ 2) ✓
- Last closes at high: ✓
- Doji count: 0 (< 3) ✓
→ LONG SIGNAL ✓
```
### Scenario 2: Skip Signal
```
Last 5 bars pattern:
Bar 1: Doji pattern ✓
Bar 2: Doji pattern ✓
Bar 3: Closes at mid
Bar 4: Doji pattern ✓
Bar 5: Closes at high
Result:
- Doji count: 3 (≥ 3)
→ SKIP SIGNAL - Market too chaotic
```
## Performance Optimization
### Tips for Better Results
1. **Use Higher Timeframes**: 15m or higher reduces false signals
2. **Combine with Indicators**: Add volume or trend filters
3. **Seasonal Adjustment**: Different parameters for different seasons
4. **Instrument Selection**: Test on liquid, high-volume instruments
5. **Regular Rebalancing**: Adjust parameters quarterly based on performance
## Troubleshooting
### No Signals Generated
- Check if lookback period is too large
- Verify proximity thresholds aren't too strict (try 0.85 instead of 0.95)
- Ensure doji limit allows for trading (try 4-5 instead of 3)
### Too Many False Signals
- Increase proximity thresholds to 0.95+
- Reduce lookback period to 3-4 bars
- Increase doji limit to 3-4
- Test on higher timeframes
### Strategy Tester Shows Losses
- Review individual trades to identify patterns
- Adjust stop loss and take profit ratios
- Change lookback period and thresholds
- Test on different market conditions
## References
- (www.tradingview.com)
- (www.tradingview.com)
- (www.investopedia.com)
- (www.investopedia.com)
## Disclaimer
**This strategy is provided for educational and research purposes only.**
- Not financial advice
- Past performance does not guarantee future results
- Always conduct thorough backtesting before live trading
- Trading involves significant risk of loss
- Use proper risk management and position sizing
## License
Created: December 15, 2025
Version: 1.0
---
**For updates and modifications, refer to the accompanying documentation files.**

Rainbow MA Width█ OVERVIEW
Rainbow MA Width is a companion indicator for Rainbow MA Cloud. It displays ribbon width as a normalized Z-Score, allowing traders to visualize trend momentum expansion and contraction relative to recent history.
█ CONCEPTS
Z-Score Normalization:
Rather than displaying raw width values (which vary by asset and timeframe),
this indicator normalizes the ribbon width using Z-Score calculation:
Z-Score = (Current Width - Average Width) / Standard Deviation
Z-Score Interpretation:
• 0 = Average width (mean)
• +1 to +2 = Expanding (above average, strong trend)
• -1 to -2 = Contracting (below average, weakening trend)
• Beyond ±2 = Extreme (statistical outlier, potential reversal)
Width Calculation Modes:
• Outer — Distance between fastest and slowest MA: |MA1 - MA8|
• Average Gap — Mean of all adjacent MA gaps
• Total Gap — Sum of all adjacent MA gaps
█ FEATURES
1 — Width Mode Selection
Three methods to calculate ribbon width.
"Outer" recommended for aligned trends.
2 — Z-Score Period
Configurable lookback for mean and standard deviation.
Default 20 bars; increase for smoother, less reactive readings.
3 — Zone Fill Coloring
Cyan fill when expanding (Z > 0).
Orange fill when contracting (Z < 0).
Yellow fill for extreme values (|Z| > 2) as warning.
4 — Alignment Background
Green background during bullish alignment.
Red background during bearish alignment.
Synced with Rainbow MA Cloud for consistency.
5 — Reference Lines
Horizontal lines at 0 (mean), ±1σ, and ±2σ levels.
Provides clear visual boundaries for interpretation.
6 — Raw Width Display
Optional secondary line showing original width percentage.
Useful for comparing normalized vs absolute values.
█ HOW TO USE
Trend Confirmation:
• Z-Score rising above 0 confirms trend acceleration
• Z-Score staying above +1 indicates sustained strong momentum
• Use alongside alignment background for confluence
Reversal Warning:
• Z-Score exceeding +2 suggests overextension (yellow warning zone)
• Z-Score dropping below -2 indicates extreme contraction
• Extreme readings often precede trend reversals or consolidation
Entry Timing:
• Enter trends when Z-Score crosses above 0 (expansion beginning)
• Avoid entries when Z-Score is at extreme highs (potential exhaustion)
• Consider exits when Z-Score peaks and begins declining
█ LIMITATIONS
• Z-Score is relative to lookback period; different periods give different readings
• Extreme zones (±2) are statistical guides, not guarantees
• Best used in conjunction with Rainbow MA Cloud for full context
█ ALERTS
Four built-in alert conditions:
• Z-Score crosses above/below zero
• Z-Score enters extreme high/low zones (±2)

Neosha Concept V4 (NY Time)
Imagine the financial market as a huge ocean. Millions of traders throw orders into it every second. But beneath all the noise, there is a powerful current that quietly controls where the waves move. That current is not a person, not a trader, and not random—it is an algorithm.
This algorithm is called the Interbank Price Delivery Algorithm (IPDA).
Think of it as the “navigation system” that guides price through the market.
IPDA has one job:
to move prices in a way that keeps the market efficient and liquid.
To do this, it constantly looks for two things:
1. Where liquidity is hiding
Liquidity is usually found above highs and below lows—where traders place stop losses. The algorithm moves price there first to collect that liquidity.
2. Where price became unbalanced
Sometimes price moves too fast and creates gaps or imbalances. IPDA returns to those areas later to “fix” the missing orders.
Once you start looking at the charts with this idea in mind, everything makes more sense:
Why price suddenly spikes above a high and crashes down
Why big moves leave gaps that price later fills
Why the market reverses right after taking stops
Why trends begin only after certain levels are hit
These are not accidents.
They are the algorithm doing its job.
Price moves in a repeating cycle:
Gather liquidity
Make a strong move (displacement)
Return to fix inefficiency
Deliver to the next target
Most beginners only see the candles.
But once you understand IPDA, you see the intention behind the candles.
Instead of guessing where price might go, you begin to understand why it moves there.
And once you understand the “why,” your trading becomes clearer, calmer, and far more accurate.

Volume Profile VisionVolume Profile Vision - Complete Description
Overview
Volume Profile Vision (VPV) is an advanced volume profile indicator that visualizes where trading activity has occurred at different price levels over a specified time period. Unlike traditional volume indicators that show volume over time, this indicator displays volume distribution across price levels, helping traders identify key support/resistance zones, fair value areas, and potential reversal points.
What Makes This Indicator Original
Volume Profile Vision introduces several unique features not found in standard volume profile tools:
Dual-Direction Histogram Display:
Unlike conventional volume profiles that only show bars extending in one direction, VPV displays volume bars extending both left (into historical candles) and right (as a traditional histogram). This bi-directional approach allows traders to see exactly where historical price action intersected with high-volume nodes.
Real-Time Candle Highlighting: The indicator dynamically highlights volume bars that intersect with the current candle's price range, making it immediately obvious which volume levels are currently in play.
Four Professional Color Schemes: Each color scheme uses distinct gradient algorithms and visual encoding systems:
Traffic Light: Uses red (POC), green (VA boundaries), yellow (HVN), with grayscale gradients outside the value area
Aurora Glass: Modern cyan-to-magenta gradient with hot magenta POC highlighting
Obsidian Precision: Professional dark theme with white POC and electric cyan accents
Black Ice: Monochromatic cyan family with graduated intensity
Adaptive Transparency System: Automatically adjusts bar transparency based on position relative to value area, with special handling for each color scheme to maintain visual clarity.
Core Concepts & Calculations
Volume Distribution Analysis
The indicator divides the visible price range into user-defined price levels (default: 80 levels) and calculates the total volume traded at each level by:
Scanning back through the specified lookback period (customizable or visible range)
For each historical bar, determining which price levels the bar's high/low range intersects
Accumulating volume for each intersected price level
Optionally filtering by bullish/bearish volume only
Point of Control (POC)
The POC is the price level with the highest traded volume during the analyzed period. This represents the "fairest" price where most traders agreed on value. The indicator marks this with distinct coloring (red in Traffic Light, magenta in Aurora Glass, white in Obsidian Precision, cyan in Black Ice).
Trading Significance: POC acts as a strong magnet for price - markets tend to return to fair value. When price is away from POC, traders watch for:
Mean reversion opportunities when price is far from POC
Rejection signals when price tests POC from above/below
Breakout confirmation when price breaks through and holds beyond POC
Value Area (VA)
The Value Area encompasses the price range where a specified percentage (default: 68%) of all volume traded. This represents the range of "accepted value" by market participants.
Calculation Method:
Start at the POC (highest volume level)
Expand upward and downward, adding adjacent price levels
Always add the level with higher volume next
Continue until accumulated volume reaches the VA percentage threshold
Value Area High (VAH): Upper boundary of accepted value - acts as resistance
Value Area Low (VAL): Lower boundary of accepted value - acts as support
Trading Significance:
Price spending time inside VA indicates market equilibrium
Breakouts above VAH suggest bullish momentum shift
Breakdowns below VAL suggest bearish momentum shift
Returns to VA boundaries often provide high-probability entry zones
High Volume Nodes (HVN)
Price levels with volume exceeding a threshold percentage (default: 80%) of POC volume. These represent areas of strong agreement and consolidation.
Trading Significance:
HVNs act as strong support/resistance zones
Price tends to consolidate at HVNs before making directional moves
Breaking through an HVN often signals strong momentum
Low Volume Nodes (LVN)
Price levels within the Value Area with volume ≤30% of POC volume. These are zones price moved through quickly with minimal consolidation.
Trading Significance:
LVNs represent areas of rejection - price finds little acceptance
Price tends to move rapidly through LVN zones
Useful for setting stop-losses (below LVN for longs, above for shorts)
Can identify potential gaps or "air pockets" in the market structure
Grayscale POC Detection
A secondary POC detection system identifies the highest volume level outside the Value Area (with a 2-level buffer to avoid confusion). This helps identify significant volume accumulation zones that exist beyond the main value area.
How to Use This Indicator
Setup
Choose Lookback Period:
Enable "Use Visible Range" to analyze only what's on your chart
Or set "Fixed Range Lookback Depth" (default: 200 bars) for consistent analysis
Adjust Profile Resolution:
"Number of Price Levels" (default: 80) - higher = more granular analysis, lower = broader zones
Select Color Scheme:
Traffic Light: Best for clear POC/VA/HVN identification
Aurora Glass: Modern aesthetic for dark charts
Obsidian Precision: Professional trader preference
Black Ice: Minimalist single-color family
Visual Customization
Left Extension: How far back the left-side histogram extends into historical candles (default: 490 bars)
Right Extension: Width of the traditional histogram bars on the right (default: 50 bars)
Right Margin: Space between current price bar and histogram (default: 0 for flush alignment)
Left Profile Gap: Space between left-side histogram and candles (default: 0)
Trading Strategies
Strategy 1: Value Area Mean Reversion
Wait for price to move outside the Value Area (above VAH or below VAL)
Look for rejection signals (wicks, bearish/bullish candles)
Enter trades toward the POC
Take profits as price returns to POC or opposite VA boundary
Strategy 2: Breakout Confirmation
Identify when price is consolidating within the Value Area
Wait for a strong close above VAH (bullish) or below VAL (bearish)
Enter on the breakout or on first pullback to the VA boundary
Target previous HVNs or swing highs/lows outside the VA
Strategy 3: POC Support/Resistance
Watch for price approaching the POC level
If approaching from below, look for bullish reversal patterns at POC (support)
If approaching from above, look for bearish reversal patterns at POC (resistance)
Trade in the direction of the bounce with stops beyond the POC
Strategy 4: LVN Fast Movement Zones
Identify LVN zones within the Value Area (marked with "LVN" label)
When price enters an LVN, expect rapid movement through the zone
Avoid entering trades within LVNs
Use LVNs as confirmation of directional momentum
Alert System
The indicator includes 7 customizable alert conditions:
POC Touch: Alerts when price comes within 0.5 ATR of POC
VAH/VAL Touch: Alerts at Value Area boundaries
VA Breakout: Alerts on breakouts above VAH or below VAL
HVN Touch: Alerts when price contacts High Volume Nodes
LVN Entry: Alerts when entering Low Volume zones
POC Shift: Alerts when POC moves to a new price level
Reading the Profile
Price Labels (shown on the right side):
POC: Point of Control - highest volume price level
VAH: Value Area High - upper boundary of accepted value
VAL: Value Area Low - lower boundary of accepted value
LVN: Low Volume Node - expect fast movement through this zone
Color Intensity Interpretation:
Brighter colors = higher volume concentration
Dimmer colors = lower volume
Abrupt color changes = transition between volume zones
Gaps in the histogram = price levels with no trading activity
Technical Details
Volume Accumulation Logic:
For each bar in lookback period:
For each price level:
If bar's high/low range intersects price level:
Add bar's volume to that price level's total
Gradient Algorithm:
Traffic Light: Dual-range piecewise gradient (0-50% and 50-100% volume intensity)
Aurora Glass: Linear cyan-to-magenta interpolation
Obsidian Precision: Dark blue gradient with cyan highlights
Black Ice: Three-stage cyan intensity progression
Real-Time Updates:
The profile recalculates on every bar, including real-time tick data, ensuring the volume distribution always reflects current market structure.
Best Practices
Timeframe Selection: Use higher timeframes (4H, Daily) for swing trading, lower timeframes (5min, 15min) for day trading
Combine with Price Action: Volume profile shows WHERE, price action shows WHEN
Multiple Timeframe Analysis: Check daily VP for major levels, then drill down to intraday for entries
Volume Type Selection: Use "Bullish" volume in uptrends, "Bearish" in downtrends, or "Both" for complete picture
Adjust VA Percentage: 68% (default) captures one standard deviation; try 70% for tighter or 60% for broader value areas
Performance Notes
Maximum bars back: 5000 (handles deep historical analysis)
Maximum boxes: 500 (handles complex profiles)
Optimized calculation: Only recalculates on last bar for efficiency
Real-time capable: Updates as new ticks arrive

FVG Supply and DemandThis indicator combines powerful tools into one:
• Supply & Demand Zones built from swing highs/lows with ATR-based zone width, POI markers, and Break-of-Structure (BOS) detection.
• Volumized Fair Value Gaps (FVGs) showing bullish/bearish gaps, total volume inside the gap, volume distribution, optional zone-combining, and auto-cleanup.
• Swing TSL Line and manage bar color.
It helps visualize key imbalance areas, institutional zones, and price reaction points.
Credits to the Author.
⚠️ Disclaimer
This indicator is provided for educational and analytical purposes only.
It does not provide trading advice.
Past results do not guarantee future outcomes.
Use responsibly and in conjunction with your market analysis.

P_NQ Futures Daily Bias & Structure ProOverview The Master Sniper is a professional-grade execution system designed for high-volatility assets like NQ (Nasdaq 100) and ES (S&P 500). Unlike standard indicators that generate blind signals, this script uses a Multi-Timeframe Logic Engine to first establish a daily bias and then hunt for specific intraday triggers.
It features a Hybrid Strategy that can automatically switch between Trend Following (Smart Money Concepts) and Mean Reversion (Gap Fades), giving you a complete toolkit for any market condition.
Key Features
1. Macro Bias Engine (The Filter) Before generating any signal, the script analyzes the Daily Chart in the background:
Structure: Checks for Higher Highs/Lows vs. Lower Highs/Lows.
Momentum: Uses RSI and the 200 EMA to ensure you aren't buying the top or selling the bottom.
Result: It generates a directional bias (Bullish/Bearish) that filters out low-probability trades.
2. Hybrid Entry Logic
Trend Mode (SMC): Identifies Fair Value Gaps (FVG) within "Discount" or "Premium" zones. It only triggers if the price pulls back into a value area aligned with the Daily Bias.
Reversal Mode (Elasticity): Detects when price is over-extended (2.0 Standard Deviations from VWAP) or when a "Liquidity Sweep" occurs, signaling a snap-back trade.
Gap Rejection (Morning Fade): A dedicated engine that monitors the Opening Gap. If the market gaps significantly but fails to hold, it triggers a "Fade" trade to target the gap fill.
3. Professional Trade Management Visualizes your trade plan instantly on the chart:
Split Targets: Draws targets for Contract 1 (Scalp) and Contract 2 (Runner).
Auto-Break Even: The moment TP1 is hit, the Stop Loss line visually moves to your Entry Price, signaling a "Risk-Free" trade.
Infinite Target Lines: Extends target lines to the right until the trade concludes, keeping your chart clean.
4. Risk Filters
Range Filter: Prevents buying in the Top 1/3 or selling in the Bottom 1/3 of the daily range.
Proximity Filter: Blocks trades that are squeezing too tight against the 100-candle High/Low.
How to Use
Timeframe: Optimized for the 5-Minute (5m) chart on Futures (NQ/ES) or Tech Stocks.
Dashboard: Check the bottom-right panel. Ensure "Status" says "SCANNING" and Filters show "Active."
Execution: Wait for the alert (e.g., "🟢 ENTER LONG"). Place your orders at the Blue Line with SL at the Red Line.

TCT OBIF Detector█ OVERVIEW
The OBIF (Order Block Imbalance Fill) indicator automatically detects and visualizes high-probability trading zones by combining two powerful Smart Money Concepts: Order Blocks and Fair Value Gaps (FVGs).
An OBIF occurs when an Order Block forms immediately before a Fair Value Gap, creating a zone of institutional interest that price often revisits before continuing its move.
█ CONCEPTS
Order Block (OB)
An Order Block is the last opposing candle before a strong directional move. It represents an area where institutional traders likely placed orders.
- Bullish OB: Last bearish candle before an up-move
- Bearish OB: Last bullish candle before a down-move
Fair Value Gap (FVG)
An FVG is a price imbalance created when a candle's body completely gaps past the previous candle's range, leaving an unfilled area.
- Bullish FVG: Gap up where candle .low > candle .high
- Bearish FVG: Gap down where candle .high < candle .low
OBIF Zone
When an Order Block directly precedes an FVG, it creates an OBIF - a confluence zone with higher probability of acting as support/resistance.
█ HOW TO USE
1. Identify the Trend
Use OBIFs in the direction of the higher timeframe trend for best results.
2. Wait for Price to Return
OBIFs act as magnets - price often returns to fill the imbalance and test the order block.
3. Look for Confirmation
When price enters an OBIF zone, look for:
- Rejection wicks
- Engulfing patterns
- Break of structure on lower timeframes
4. Mitigation
Once price fully trades through the OBIF (touches the opposite edge), the zone is considered mitigated and loses its significance.
█ FEATURES
- Automatic Detection — Identifies OBIFs in real-time as they form
- Visual Zones — Clean, non-intrusive boxes that don't obscure price action
- Mitigation Tracking — Zones automatically update when price mitigates them
- Multi-Timeframe Friendly — Works on any timeframe from 1m to Monthly
- Customizable — Adjust colors, opacity, and display preferences
█ SETTINGS
- Lookback Window — How many candles back to search for the Order Block (default: 3)
- Show Bullish/Bearish — Toggle visibility of each type
- Show Mitigated — Display zones that have been mitigated (shown in gray)
- Fill Opacity — Adjust zone transparency (higher = more see-through)
- Border Width — Thickness of zone borders
█ BEST PRACTICES
✓ Use on higher timeframes (1H+) for more reliable zones
✓ Combine with market structure analysis
✓ Look for OBIFs at key support/resistance levels
✓ Use lower timeframe confirmation for entries
✗ Don't trade every OBIF blindly
✗ Avoid OBIFs against the dominant trend
█ CREDITS
The Composite Trader (TCT) methodologies.

Fabio-Style Order Flow SystemFabio-Style Order Flow System — LVN • Delta • Big Trades • FVG • Order Blocks • Liquidity • Volume Profile
This indicator brings together all major components of Fabio Valentino’s order-flow strategy in one unified tool. It visualizes where smart money is active, where inefficiencies form, and where price is likely to react next.
🔍 FEATURES
1. Order Flow & Delta
Smoothed delta to show true market imbalance
Background color shifts to bullish/bearish delta dominance
Alerts for delta spikes & order-flow flips
2. Big Trade Detection
Highlights Big Buy and Big Sell prints (relative to average volume)
Helps identify institutional aggression on both sides
3. Low Volume Nodes (LVNs)
Automatically detects low-volume zones
Flags retests of LVNs for high-probability reactions
Uses dynamic volume thresholds for accuracy
4. Volume Profile (Lightweight)
Bucket-based intrabar profile across user-defined lookback
Highlights volume distribution without heavy TradingView CPU load
Auto-scales bucket density & transparency
5. Fair Value Gaps (FVGs)
Detects both bullish & bearish three-bar imbalances
Marks gaps visually using colored boxes
Updates dynamically with a user-set lookback
6. Order Blocks (OBs)
Identifies valid displacement bars and their origin OB
Plots clean, minimalist rectangles around key OB zones
Uses ATR-based impulse filtering
7. Liquidity Grabs
Detects wick-based liquidity sweeps
Highlights both equal high/low and stop-run type wicks
Useful for spotting reversals & trap setups
8. Strategy Dashboard
Shows real-time order flow state
Displays delta strength, big trades, LVNs, and last directional impulse
Auto-positions in all corners
🎯 PERFECT FOR
Traders who use:
Order Flow
Smart Money Concepts (SMC)
ICT / FVG / Liquidity models
Market Structure + Volume
Fabio Valentino-style analysis
⚙️ PERFORMANCE
All elements optimized
Uses automatic box-clearing to avoid array overload
Works on all timeframes & markets (crypto, FX, indices, stocks)

TTP IFVG Signals With EMA /ICT Gold scalpingThis script uses original logic and alerting rules. in Japan
finding ICT IFVG and EMA conditions.
#IFVG, Forex, ICT, EMA, Scalping, Indicator
This indicator automatically finds IFVG (Imbalance / Fair Value Gap) zones and gives you a buy or sell signal when price comes back and breaks out through that gap.
It also draws a colored box over the gap so you can see the zone visually, and it raises alerts when a new signal appears.
High-level logic:
On every bar, the script looks back up to “IFVG_GapBars” bars.
For each offset i it checks a 3-candle pattern:
– If the low of the newer candle is above the high of the older candle: bullish FVG (price jumped up, leaving a gap).
– If the high of the newer candle is below the low of the older candle: bearish FVG (price jumped down, leaving a gap).
When a valid FVG is found:
– For a bullish FVG it looks for a later close that breaks down through that gap (sell signal).
– For a bearish FVG it looks for a later close that breaks up through that gap (buy signal).
– A moving-average trend filter must agree (downtrend for sells, uptrend for buys).
– It checks that price has not already “filled” the gap before the breakout.
If all conditions are satisfied, it:
– Sets signal_dir = 1 for a buy, or -1 for a sell.
– Draws a box from the original FVG bar to the bar just before the breakout (extended a bit to the right), between the gap high and gap low.
– Plots an ▲ label for buys or ▼ label for sells.
– Triggers the corresponding alert conditions.
Now the parameters:
PipSizeMultilier (PipSizeManual)
Multiplies the symbol’s minimum tick size (syminfo.mintick).
It is used when converting “MinFVG_Pips” into an actual price distance.
If you feel the indicator is too sensitive (too many small gaps), you can increase this multiplier to effectively require a larger price difference.
TickSize
Internal value = syminfo.mintick * PipSizeMultiplier.
This is the actual price step the script uses as a “pip” when checking minimum gap size.
FVG Search Lookback (IFVG_GapBars)
How many bars back from the current bar the script will scan for a 3-candle FVG pattern.
Larger value = it can find older FVGs, but loop cost is higher.
Min FVG Size (Pips/Points) (MinFVG_Pips)
Minimum allowed size of the gap, measured in “pips/points” using TickSize.
If the vertical distance between the gap high and gap low is smaller than this, the gap is ignored.
0.0 means “no size filter” (every FVG is allowed).
FVG Epsilon (Price Units) (FVG_EpsPoints)
Tolerance for the FVG detection.
It is subtracted/added in the condition that checks “low > old high” or “high < old low”.
0.0 means strict gap (no overlap at all). A small positive epsilon allows tiny overlaps to still count as a gap.
Show IFVG Zones (ShowZones)
If true, the script draws a box over the IFVG zone when a signal is confirmed.
If false, no boxes are drawn; you only see the ▲ / ▼ markers and alerts.
Buy Zone Color (ZoneColorBuy)
Fill color and border color for boxes created from bearish FVGs that later produce a buy signal.
Sell Zone Color (ZoneColorSell)
Fill color and border color for boxes created from bullish FVGs that later produce a sell signal.
Box Extension (Bars) (BoxExtension)
How many extra bars to extend the right side of the box beyond the breakout bar.
The internal right coordinate is “bar_index - 1 + BoxExtension”.
Increase this if you want the zone to visually extend further into the future.
MA Period (MA_Period)
Lookback length of the moving average used as a trend filter.
MA Type (MA_Kind)
Type of moving average: “SMA” or “EMA”.
If SMA is chosen, the script uses ta.sma; if EMA, it uses ta.ema.
Moving-average filter behavior:
For sell signals (from bullish FVG): MA must be sloping down (MA < MA ) and price must be below MA.
For buy signals (from bearish FVG): MA must be sloping up (MA > MA ) and price must be above MA.
If these conditions are not satisfied, the FVG is ignored even if the gap and breakout conditions are met.
Signals and alerts:
signal_dir = 1 → buy signal, ▲ label below the bar, “IFVG Buy Alert” / “IFVG Buy/Sell Alert” can fire.
signal_dir = -1 → sell signal, ▼ label above the bar, “IFVG Sell Alert” / “IFVG Buy/Sell Alert” can fire.
signal_dir = 0 → no new signal on this bar.
In short:
This indicator finds 3-candle IFVG gaps, filters them by size and trend, waits for a clean breakout through the gap, draws a box on the original gap zone, and gives you a clear buy or sell signal plus alerts.

HTF FVG + SessionsThis indicator combines multi-timeframe FVG A–C detection with intraday session boxes on a single chart.
It automatically finds bullish and bearish Fair Value Gaps on 15m, 30m, 1H, 4H, 1D and 1W timeframes.
Fresh FVGs are drawn in a transparent gold color, then dynamically shrink as price trades back into the gap.
Once price fully fills the gap, the FVG box and its label are automatically removed from the chart.
After the first touch, each FVG changes to a per-timeframe gray shade, making overlapping HTF gaps easy to see.
You can toggle each timeframe on/off and also globally enable/disable all FVGs from the settings panel.
Session boxes highlight Asia, London, NY AM, NY Lunch and NY PM using soft colored rectangles.
Each session box is plotted from the high to the low of that session and labeled with its name in white text.
A global “Show all session boxes” switch allows you to quickly hide or display the session structure.
This tool is designed for traders who want to combine FVG liquidity maps with clear intraday session context.

Morning ORB FVG Trigger✅ Overview
Morning ORB FVG Trigger is a complete intraday trading framework built around:
A Morning Opening Range Breakout (ORB)
The first Fair Value Gap (FVG) after that breakout
Strict risk management and position sizing
Optional HTF trend filter (Daily / Weekly / Monthly)
Optional Daily ATR filter to avoid extreme days
The script is designed for futures / indices / FX on intraday charts up to 15 minutes and for traders who want a clean, mechanical entry framework with clear risk.
🧠 Core idea
Define a morning opening range (e.g. 09:30–09:45).
Wait for a clean breakout above/below that range.
After the breakout, wait for the first FVG in breakout direction,
confirmed by the next candle (no immediate full reclaim).
Use a chosen stop logic + R:R factor to build risk/reward boxes.
Calculate position size based on your account risk.
(Optional) Only take trades:
In the direction of the HTF EMA trend (D/W/M).
On days where the morning range is within a band of the Daily ATR.
You can also disable all signals/boxes and use the script just as a visual ORB tool.
⏰ 1. ORB / Morning Range
Inputs (Main section)
Morning Range Session
Time window of the opening range in exchange time
Example: 09:30–09:45 for a 15-minute ORB.
You can type custom ranges (e.g. 09:30–09:35 for a 5-minute ORB).
Risk/Reward (TP factor)
Multiplier for the take-profit distance relative to the stop.
2.0 = TP is 2× the stop distance
1.5 = TP is 1.5× the stop distance
Show ORB range
If enabled, draws:
ORB high/low lines
ORB labels (e.g. 15min ORB high / low)
Optional midline
Extend ORB lines to the right (bars)
How many bars to extend the ORB high/low horizontally beyond the ORB itself.
Trade box width (bars)
Horizontal width (in bars) of:
Red risk box (entry–stop)
Green reward box (entry–TP)
Implementation details
The ORB is always calculated on 1-minute data internally, so it stays precise even on 5m/15m charts.
The script only works on intraday timeframes up to 15 minutes.
📦 2. FVG Block
Group: “FVG”
Threshold %
Minimum size of an FVG in % of price.
0 = every FVG
Higher values = only larger gaps
Auto threshold (from volatility)
If enabled, the minimum FVG size is derived from historical volatility
instead of a fixed percentage.
Allow breakout FVG partly inside ORB
Off (default): the FVG must lie fully outside the ORB.
On: the breakout FVG itself may still overlap the ORB a bit,
as long as it is the first one attached to the breakout move.
Enable FVG entry signals, boxes & alerts
On: full system – FVG detection, entry labels, risk/TP boxes, alerts.
Off: no entries, no risk/TP boxes, no alerts.
You only get the ORB and (optionally) the HTF dashboard, so you can trade your own setups.
Entry mode
Entry mode (Mid / Edge / NextOpen)
Mid – Entry at the midpoint of the FVG.
Edge – Long at the upper FVG edge, short at the lower FVG edge.
NextOpen – No limit order in the gap. Entry is placed at the next bar open after FVG confirmation.
Edge offset (ticks)
Additional offset for Edge entries:
Long:
+ticks = a bit above the FVG (more conservative)
-ticks = deeper into the FVG (more aggressive)
Short:
+ticks = a bit below the FVG
-ticks = deeper into the FVG
FVG detection logic
Uses a LuxAlgo-style 3-candle FVG pattern (gap between candle 1 and 3).
Only one FVG is taken: the first valid FVG after the ORB breakout in breakup direction.
The FVG candle is the middle bar; the script:
Detects the FVG on the previous bar.
Waits for the current bar to confirm it:
Bullish: current low must stay above the lower FVG boundary
Bearish: current high must stay below the upper FVG boundary
Only then an entry signal is generated.
🛑 3. Stop Logic
Group: “Stop Logic”
Stop mode (PrevBar / Pivot / FVG Candle)
PrevBar – Stop at the low/high of the candle before the FVG
(tight/aggressive).
FVG Candle – Stop at the low/high of the FVG candle itself
(medium).
Pivot – Stop at the most recent swing high/low
using pivotLeft / pivotRight pivots (more conservative).
Ticks (stop buffer)
Offset (in ticks) from the selected stop level.
> 0 = further away (more room, more risk)
< 0 = closer (tighter stop)
Pivot left / Pivot right
Number of candles left/right to define a swing high/low
when using Pivot stop mode.
Typical intraday values: 2–3.
The script also sanity-checks the stop:
if the calculated stop would be invalid (e.g. above entry in a long), it moves it by a minimal distance (2 ticks) to keep a valid risk.
📈 4. HTF Trend Filter (Daily / Weekly / Monthly)
Group: “HTF Trend Filter”
Enable HTF trend filter
If enabled, trades are only allowed:
Long when at least 2 of D/W/M closes are above their EMA
Short when at least 2 of D/W/M closes are below their EMA
EMA length (D/W/M)
EMA length for all three higher timeframes (Daily, Weekly, Monthly).
This helps focus entries in the direction of the dominant higher-timeframe trend.
📊 5. ATR Filter (Daily)
Group: “ATR Filter (Daily)”
Use daily ATR filter
If enabled, the height of the ORB (ORB high – ORB low) must be within
a band of the Daily ATR to allow any signals.
Daily ATR length
ATR period on the Daily timeframe.
Min ORB size vs ATR
Lower bound:
Example: 0.3 → ORB must be at least 0.3 × Daily ATR
0.0 = no minimum.
Max ORB size vs ATR
Upper bound:
Example: 1.5 → ORB must be ≤ 1.5 × Daily ATR
0.0 = no maximum.
If the ORB is too small (choppy) or too large (exhausted move), no breakout or FVG signal will be generated on that day.
🧭 6. HTF Dashboard & Signal Labels
Group: “HTF Trend Dashboard”
Show HTF dashboard
Draws a small label at the top of the chart showing:
HTF Trend (EMA X)
D: UP/FLAT/DOWN
W: UP/FLAT/DOWN
M: UP/FLAT/DOWN
Dashboard position
Top Right, Top Center, Top Left – places the dashboard at the top.
Over Risk Info – no top dashboard; instead, the HTF trend info is shown as a label near the risk box when a new signal appears.
Lookback (bars) for top anchor
How many bars to use to determine the top price level for dashboard placement.
Show HTF trend above risk box on signal
Only relevant if Dashboard position = Over Risk Info.
When enabled, a small HTF label appears near the risk box for each new trade.
Signal label vertical offset (ticks)
Vertical spacing between risk info label and HTF label.
Minimum spacing HTF/Risk (ticks)
Ensures a minimum vertical distance so the two labels don’t overlap.
HTF signal label X offset (bars)
Horizontal offset (left/right) relative to the risk info label.
⏳ 7. ORB–FVG Filters (Session & Time Window)
Group: “ORB FVG Filter”
Only same session day
If enabled, FVG entries are only allowed on the same calendar day
as the ORB. When the date changes, all state & drawings are reset.
Limit hours after ORB
Enables a time window after the ORB end.
Trading window after ORB (hours)
Length of that window in hours.
Example: 2.0 → FVG signals only in the first 2 hours after ORB end.
💰 8. Risk Management & Position Sizing
Group: “Risk Management”
Calculate position size
If enabled, the script computes suggested mini and micro contract size for you.
Account size
Your trading account size (in account currency).
Risk mode
Percent – risk is a % of account size (Account risk %).
Fixed amount – risk is a fixed dollar amount (Fixed risk ($)).
Account risk %
Risk per trade as a percentage of account size (e.g. 1.0 for 1%).
Fixed risk ($)
Fixed risk per trade in dollars when using Fixed amount mode.
Micro factor (vs mini)
How much a micro contract is worth relative to a mini.
Example:
0.1 → one micro moves 1/10 of one mini.
Risk Info label
For each new trade, a label is shown above the boxes with:
Stop distance in price and $ risk per mini
Max risk allowed for the trade
Suggested mini and micro size
Text like:
Suggested: 2 mini
Suggested: 5 micro
or Suggested: no trade
This makes the script especially useful for prop-firm rules or strict risk discipline.
🎨 9. Visual Style (Boxes, Labels, ORB Lines)
Group: “Box & Label Style (Trade)”
Label font size (Very small, Small, Normal, Large)
Entry label BG / text color
Stop label BG / text color
TP label BG / text color
Risk info BG / text color
Risk box color (entry–stop zone)
Reward box color (entry–TP zone)
Group: “ORB Style”
ORB high line color
ORB low line color
ORB line width
ORB label font size
ORB label background color
ORB label text color
Show ORB midline
ORB midline color / width / style (Solid / Dashed / Dotted)
⚠️ 10. Alerts
Group: “Alerts”
The script defines three alert conditions:
Long entry FVG breakout
Triggered when a new long signal appears.
Short entry FVG breakout
Triggered when a new short signal appears.
FVG entry (long/short)
Generic alert for any new signal (long or short).
To use them:
Add the indicator to the chart.
Open the Alerts dialog → “Condition”.
Select this script and one of the alert conditions.
Set your preferred expiration and notification settings.
Alerts only fire when Enable FVG entry signals, boxes & alerts is on.
🧩 11. How the trading logic flows (summary)
Build ORB on 1-minute data during the selected session.
Optionally reject the day if ORB is outside the ATR bounds.
Wait for a breakout (close above high or below low), respecting HTF trend filter.
After breakout, look for the first valid FVG in that direction:
Outside the ORB (unless breakout FVG allowed inside)
Confirmed by the next candle (no full reclaim)
Once confirmed:
Compute entry, stop, target.
Draw risk/reward boxes and all labels.
Optionally show HTF signal label over the risk info.
Trigger alerts if enabled.
If you disable FVG signals, only steps 1–3 (plus dashboard) are effectively active.
⚠️ 12. Notes & Disclaimer
Script is intended for intraday trading up to 15-minute timeframes.
All signals are mechanical and do not guarantee profitability.
Always backtest and forward-test on your own data before risking real money.
This script is for educational purposes only and is not financial advice.
🚀 Quick-start guide
Add the script to your chart
Use an intraday timeframe ≤ 15 minutes (1m, 3m, 5m, 15m).
Works best on liquid indices, futures, FX and large-cap stocks.
Set the Morning Range
In “Morning Range Session” choose the exchange’s opening window.
Examples
US index futures (CME): 08:30–08:45 or 08:30–08:35
US stocks (NYSE/Nasdaq): 09:30–09:45 or 09:30–09:35
The ORB is always calculated on 1-minute data internally, so the range stays accurate on higher intraday charts.
Keep the default filters at first
HTF Trend Filter: ON
EMA length = 20
This will only allow trades in the direction of the dominant D/W/M trend.
ATR Filter: OFF (optional; you can enable later once you’re comfortable).
Use the full trade system
In the FVG group leave
“Enable FVG entry signals, boxes & alerts” = ON
Entry mode: Mid
Stop mode: FVG Candle or PrevBar
Risk/Reward: 2.0 as a starting point.
Set your risk
Turn on “Calculate position size”.
Enter your Account size and choose either:
Risk mode = Percent (e.g. 1.0 = 1% per trade), or
Risk mode = Fixed amount (e.g. $250 per trade).
The risk info label will show:
Stop distance in price and $/contract
Max allowed risk
Suggested mini and micro contract size.
Enable alerts (optional)
Open the Alerts dialog → Condition: this script.
Choose one of:
Long entry FVG breakout
Short entry FVG breakout
FVG entry (long/short)
Choose “Once per bar” or “Once per bar close”, and your preferred notification type.
Replay & journal
Use the TradingView bar replay tool to step through past days.
Focus on:
How the ORB defines the structure.
How the first confirmed FVG outside the ORB behaves.
Whether the risk/TP levels fit your own style and product.
🎛 Recommended settings & profiles
These are starting points, not rules. Always adapt to the instrument and your own risk tolerance.
1. Conservative / Trend-following
Timeframe: 5m or 15m
Morning Range Session: 15-minute ORB around the cash or futures open
FVG
Threshold %: 0.05–0.1 (filter out very small gaps)
Auto threshold: OFF (keep it simple)
Allow breakout FVG partly inside ORB: OFF
Enable FVG entry signals/boxes/alerts: ON
Entry mode: Mid
Stop Logic
Stop mode: Pivot
Pivot left/right: 2–3
Stop buffer: +1–2 ticks
HTF Trend Filter
Enabled: ON
EMA length: 20
ATR Filter
Enabled: ON
Daily ATR length: 14
Min ORB vs ATR: 0.3–0.4
Max ORB vs ATR: 1.2–1.5
Risk Management
Risk mode: Percent
Account risk: 0.5–1.0%
Idea: Only trade when the higher-timeframe trend supports the move and the opening range is of a “normal” size for the current volatility.
2. Balanced / Intraday directional
Timeframe: 3m or 5m
FVG
Threshold %: 0.02–0.05
Auto threshold: ON (lets the script adapt to volatility)
Allow breakout FVG partly inside ORB: ON
(first breakout FVG may partly sit inside the ORB)
Entry mode: Edge
Edge offset (ticks): 0 or +1
Stop Logic
Stop mode: FVG Candle
Stop buffer: 0–1 ticks
HTF Trend Filter
Enabled: ON
ATR Filter
Enabled: OFF (optional)
Risk Management
Risk mode: Percent
Account risk: 1.0–1.5% (if this fits your plan)
Idea: Slightly more aggressive entries at the gap edge, still aligned with HTF trend, but with more flexibility on ATR.
3. Aggressive / Scalping around the ORB
Timeframe: 1m or 3m
FVG
Threshold %: 0.0–0.02
Auto threshold: ON
Allow breakout FVG partly inside ORB: ON
Entry mode: NextOpen or Edge with a negative offset (deeper into the gap)
Stop Logic
Stop mode: PrevBar
Stop buffer: 0 or -1 tick
HTF Trend Filter
Enabled: OFF (or ON but treat as soft guidance)
ATR Filter
Enabled: OFF
Risk Management
Risk mode: Percent
Account risk: lower, e.g. 0.25–0.5% per trade
Idea: More trades and tighter stops. Best for experienced traders who understand the limitations of scalping and whipsaw risk.
Final reminder
All of these are templates, not guarantees:
Always check how the system behaves on your market and session.
Start on replay and demo before trading real money.
Adjust filters (HTF, ATR, thresholds) until the signals fit your personal approach.

BPR (Ballanced price range) DetectorHow This BPR Detector Works
This indicator is designed to detect and visualize balanced price ranges (BPRs) on price charts. The indicator has two main components:
Regular FVG Detection - The indicator first detects regular Fair Value Gaps in price action, which are spaces where price has moved quickly leaving a gap. This is necessary because BPRs are derived from regular FVGs.
BPR Detection - When the price action inverts and moves through a regular FVG in the opposite direction, the indicator identifies this as a BPR. This concept is important in Inner Circle Trader (ICT) methodology as it can signal potential changes in trend direction. Additionally the detection logic is refined by incorporating displacement.
The main functionality preserved includes:
Detection of regular FVGs (required to find BPRs)
Conversion of regular FVGs to BPRs when price moves through them creating a FVG in the opposite direction
Visual display of both FVG and BPR zones
Mitigation tracking for both types of imbalances
Displacement visualization that helps identify energetic price moves
Key Settings
FVG Settings - Control the appearance and behaviour of regular Fair Value Gaps
BPR Settings - Control the appearance of Breaker Price Ranges (which have different colours by default)
Mitigation Settings - Define how the indicator determines when an imbalance has been filled
Displacement Settings - Optional highlighting of energetic price moves that may lead to imbalances
