GC Magic Overlay V2This script is based on Guppy method (www.guppytraders.com
) , it was introduced to me by fellow trader @nmike. I am using this script in conjunction to Clones ,Harmonic and other tools.
Script Function:
a. Script plots the fast and slow Exponential moving averages as ribbons.
EMA's used
EMA (close): 25,30,35,40,45,50,55 (Green)
EMA (close): 89,99,109,119,129,139,149 (Red)
b. It draws the Circle dots in Pink for Sell and Black for Buy.
Script Parameters:
a. EMA : 2 emas for cross
b. Signal Exponential moving average
c. which time frame to Plot the above Signal Exponential
d. Show Guppy Slow - Red - Toggle to show red emas on chart
e. Show Guppy Fast - Green- Toggle to show green emas on chart
How to Trade:
a. Wait for the Pink/Black Dot to appear on Chart
b. Do not take trade immediately after the dot appears. Wait for the price to retrace back and touch the ema ribbons.This will keep you away from fake breakouts.
c. Rentries : in examples below
Examples:
Search in scripts for "harmonic"


Pivot Edge ProOverview
Smart Pivot Analytics is a highly accurate technical analysis tool designed to identify and validate significant price levels. Unlike standard pivot indicators that only mark recent highs, this tool backtests each identified pivot against thousands of historical candlesticks to calculate its real-world “success rate.”
Key Features
Historical Backtesting: The indicator scans up to 4,900 historical columns to find every instance where price interacted with a specific pivot level.
Strength Score (%): Each level is assigned a percentage score based on its reversal rate. It calculates how many times the price has successfully reached and rejected the level, providing a statistical “hit rate.”
Dynamic Hit Counter: Displays the exact number of times a level has been tested (hit), helping traders distinguish between new levels and established “old” levels.
Smart Filtering: To keep the chart clean, the indicator automatically filters out weak levels and prevents “clutter” by merging levels that are too close together.
Infinite Left Projection: Lines extend left to infinity, allowing traders to see the historical significance of a level across the entire price history at a glance.
How to Trade with It
Red Levels (High Power > 75%): These are “Top Reaction Zones”. Expect a strong price rejection or significant breakout when these levels are tested.
Orange Levels (Medium Power): Suitable for profit targets or as secondary confirmation for entering a trade.
Encounter: Use these levels in conjunction with your existing strategy. When a high power pivot aligns with your entry signal, the probability of a successful trade increases significantly.
Technical Parameters
Lookback Period: Defines how far back in history the script calculates power.
Touch Radius: The "sensitivity" of the level (how close the price has to get to be considered a "hit").
Minimum Strength: A filter to show only the most reliable levels.

Volume-Weighted Fibonacci PivotThis indicator automatically plots dynamic Fibonacci retracement and extension levels based on a volume-weighted pivot point within a user-defined lookback period or date range. It intelligently calculates a central "pivot" price biased toward high-volume bars, then draws symmetric levels both upward (extensions) and downward (retracements) for balanced confluence analysis.
How It Works (Technical Methodology)
Lookback Period Determination
Multiple filter modes control the data range used for calculations:
"Last X Bars": Fixed number of recent bars (default 400, max 4999).
"Manual Date": User-specified start date.
"Interactive (Chart)": Confirmed start date via input.
"None": Full available history (falls back to max bars).
Optionally, when using "Last X Bars", calculations can pull data from a higher/lower user-selected timeframe via request.security() for multi-timeframe alignment.
A dotted vertical line marks the start point in date-based modes.
Range and Pivot Calculation
Within the selected period:
Highest high and lowest low define the full price range.
Average volume is computed across the period.
Volume-Weighted Pivot: Average close price only from bars where volume > average volume (fallback to simple midpoint if no high-volume bars).
This creates a "smart" central pivot that leans toward areas of greater participation, often aligning with institutional activity.
Fibonacci Level Generation
User-configurable ratios (default: 0.236, 0.382, 0.5, 0.618, 0.786, 1.0, 1.272, 1.414, 1.618).
Levels are calculated symmetrically around the volume-weighted pivot:
Upward: Pivot + (Range × Ratio × Correction Factor) – teal/cyan shades.
Downward: Pivot - (Range × Ratio × Correction Factor) – red shades.
Correction Factor (default 0.5): Scales level spacing for tighter/wider grids without altering ratios.
Only the user-defined number of active lines (default 9) are drawn.
Visual Construction
Central Pivot Line: Thick yellow horizontal line with label showing exact price.
Up/Down Levels: Dashed lines extended into the future, labeled with ratio direction ("Up" or "Dn").
All objects redraw only on the last bar for performance, clearing previous drawings.
Multi-Timeframe Option
When enabled with "Last X Bars":
Pulls high/low/volume data from specified timeframe.
Aligns the pivot and levels to higher-timeframe structure while displaying on current chart – ideal for intraday traders seeking HTF confluence.
How to Use
This tool provides clean, volume-aware Fibonacci grids for identifying potential support/resistance, reversal zones, and targets.
Volume-Weighted Pivot: Often acts as a strong mean reversion level or fair value area.
Upward Levels (Teal): Potential resistance/extensions in bullish moves; watch for reactions on retests.
Downward Levels (Red): Potential support/retracements in bearish moves.
Confluence: High probability when price reacts at levels aligning with other tools (order blocks, pivots, volume profile).
Correction Factor: Lower values (<0.5) for tighter grids in ranging markets; higher (>0.5) for trending markets.
Multi-Timeframe Mode: Use on lower charts (e.g., 15m) with HTF input (e.g., 4H or Daily) to project major structure levels.
Common Setups:
Pullbacks to 0.618–0.786 zones for continuation entries.
Breaks beyond 1.0–1.618 for extension targets.
Reactions near pivot line for mean reversion trades.
Adjust ratios and active line count to match your preferred Fibonacci style (classic retracement vs. extensions).
Disclaimer
This indicator is a technical analysis tool and should be used in conjunction with other forms of analysis. Past performance does not guarantee future results. Always use proper risk management.


Mean-Reversion with CooldownThis strategy requires no indicators or fundamental analysis. It is designed for longer-term positions and works especially well on unleveraged instruments with strong long-term upward trends, such as precious metals. Feel free to experiment with different timeframes — I’ve found that 1-hour charts work particularly well for cryptocurrencies.
The idea is to filter out ongoing bear phases as effectively as possible and capitalize on long-term bull runs.
The script implements an idea that came to me in a state of complete sleep deprivation: open a random long position with a fixed take-profit (TP) and a tight stop-loss (SL).
If the TP is hit — great, we simply try again.
If the SL is triggered — too bad, we pause for a while and then try again.
## Cooldown (Waiting) Mechanism
The waiting mechanism is simple: the more consecutive SL hits we get, the longer we wait before opening the next trade. The waiting time is measured in closed candles, and thus depends on the timeframe you are using.
## Two cooldown calculation modes are currently supported:
### 1. FIBONACCI
The cooldown follows the Fibonacci sequence, based on the number of consecutive losses:
1st loss → wait 1 bar
2nd loss → wait 1 bar
3rd loss → wait 2 or 3 bars (depending on definition)
4th loss → wait 3 or 5 bars
etc.
### 2. POWER OF TWO
The cooldown increases exponentially:
1st loss → wait 2 bars
2nd loss → wait 4 bars
3rd loss → wait 8 bars
4th loss → wait 16 bars
and so on, using the formula 2ⁿ.
## Configurable Parameters
### Cooldown Pause Calculation
The settings allow you to define the SL and TP as percentages of the position value.
The "Cooldown Pause Calculation" option determines how the next cooldown duration is computed after a losing trade.
The system keeps track of how many consecutive losses have occurred since the last profitable trade. That counter is then used to compute how many bars we must wait before opening the next position.
### Maximum Cooldown
The "Max Cooldown Candles" setting defines the maximum number of bars we are allowed to wait before placing a new trade. This prevents the strategy from “locking itself out” for too long and mitigates the fear of missing out (FOMO).
Once the cooldown duration reaches this maximum, the system essentially wraps around and starts the progression again. In the script, this is handled using a simple modulo operation based on the chosen maximum.

Smart Money Concepts [XoRonX]# Smart Money Concepts (SMC) - Advanced Trading Indicator
## 📊 Deskripsi
**Smart Money Concepts ** adalah indicator trading komprehensif yang menggabungkan konsep Smart Money Trading dengan berbagai alat teknikal analisis modern. Indicator ini dirancang untuk membantu trader mengidentifikasi pergerakan institusional (smart money), struktur pasar, zona supply/demand, dan berbagai sinyal trading penting.
Indicator ini mengintegrasikan multiple timeframe analysis, order blocks detection, fair value gaps, fibonacci retracement, volume profile, RSI multi-timeframe, dan moving averages dalam satu platform yang powerful dan mudah digunakan.
---
## 🎯 Fitur Utama
### 1. **Smart Money Structure**
- **Internal Structure** - Struktur pasar jangka pendek untuk entry presisi
- **Swing Structure** - Struktur pasar jangka panjang untuk trend analysis
- **BOS (Break of Structure)** - Konfirmasi kelanjutan trend
- **CHoCH (Change of Character)** - Deteksi potensi reversal
### 2. **Order Blocks**
- **Internal Order Blocks** - Zona demand/supply jangka pendek
- **Swing Order Blocks** - Zona demand/supply jangka panjang
- Filter otomatis berdasarkan volatilitas (ATR/Range)
- Mitigation tracking (High/Low atau Close)
- Customizable display (jumlah order blocks yang ditampilkan)
### 3. **Equal Highs & Equal Lows (EQH/EQL)**
- Deteksi otomatis equal highs/lows
- Indikasi liquidity zones
- Threshold adjustment untuk sensitivitas
- Visual lines dan labels
### 4. **Fair Value Gaps (FVG)**
- Multi-timeframe FVG detection
- Auto threshold filtering
- Bullish & Bearish FVG boxes
- Extension control
- Color customization
### 5. **Premium & Discount Zones**
- Premium Zone (75-100% dari range)
- Equilibrium Zone (47.5-52.5% dari range)
- Discount Zone (0-25% dari range)
- Auto-update berdasarkan swing high/low
### 6. **Fibonacci Retracement**
- **Equilibrium to Discount** - Fib dari EQ ke discount zone
- **Equilibrium to Premium** - Fib dari EQ ke premium zone
- **Discount to Premium** - Fib full range
- Reverse option
- Show/hide lines
- Custom colors
### 7. **Volume Profile (VRVP)**
- Visible Range Volume Profile
- Point of Control (POC)
- Value Area (70% volume)
- Auto-adjust rows
- Placement options (Left/Right)
- Width customization
### 8. **RSI Multi-Timeframe**
- Monitor 3 timeframes sekaligus
- Overbought/Oversold signals
- Visual table display
- Color-coded signals (Red OB, Green OS)
- Customizable position & size
### 9. **Moving Averages**
- 3 Moving Average lines
- Pilihan tipe: EMA, SMA, WMA
- Automatic/Manual period mode
- Individual color & width settings
- Cross alerts (MA vs MA, Price vs MA)
### 10. **Multi-Timeframe Levels**
- Support up to 5 different timeframes
- Previous high/low levels
- Custom line styles
- Color customization
### 11. **Candle Color**
- Color candles berdasarkan trend
- Bullish = Green, Bearish = Red
- Optional toggle
---
## 🛠️ Cara Penggunaan
### **A. Setup Awal**
1. **Tambahkan Indicator ke Chart**
- Buka TradingView
- Klik "Indicators" → "My Scripts" atau paste code
- Pilih "Smart Money Concepts "
2. **Pilih Mode Display**
- **Historical**: Tampilkan semua struktur (untuk backtesting)
- **Present**: Hanya tampilkan struktur terbaru (clean chart)
3. **Pilih Style**
- **Colored**: Warna berbeda untuk bullish/bearish
- **Monochrome**: Tema warna abu-abu
---
### **B. Penggunaan Fitur**
#### **1. Smart Money Structure**
**Internal Structure (Real-time):**
- ✅ Aktifkan "Show Internal Structure"
- Pilih tampilan: All, BOS only, atau CHoCH only
- Gunakan untuk entry timing presisi
- Filter confluence untuk mengurangi noise
**Swing Structure:**
- ✅ Aktifkan "Show Swing Structure"
- Pilih tampilan struktur bullish/bearish
- Adjust "Swings Length" (default: 50)
- Gunakan untuk konfirmasi trend utama
**Tips:**
- BOS = Konfirmasi trend continuation
- CHoCH = Warning untuk possible reversal
- Tunggu price retest ke order block setelah BOS
---
#### **2. Order Blocks**
**Setup:**
- ✅ Aktifkan Internal/Swing Order Blocks
- Set jumlah blocks yang ditampil (1-20)
- Pilih filter: ATR atau Cumulative Mean Range
- Pilih mitigation: Close atau High/Low
**Cara Trading:**
1. Tunggu BOS/CHoCH terbentuk
2. Identifikasi order block terdekat
3. Wait for price pullback ke order block
4. Entry saat price respek order block (rejection)
5. Stop loss di bawah/atas order block
6. Target: swing high/low berikutnya
**Color Code:**
- 🔵 Light Blue = Internal Bullish OB
- 🔴 Light Red = Internal Bearish OB
- 🔵 Dark Blue = Swing Bullish OB
- 🔴 Dark Red = Swing Bearish OB
---
#### **3. Equal Highs/Lows (EQH/EQL)**
**Setup:**
- ✅ Aktifkan "Equal High/Low"
- Set "Bars Confirmation" (default: 3)
- Adjust threshold (0-0.5, default: 0.1)
**Interpretasi:**
- EQH = Liquidity di atas, kemungkinan sweep lalu dump
- EQL = Liquidity di bawah, kemungkinan sweep lalu pump
- Biasanya smart money akan grab liquidity sebelum move besar
**Trading Strategy:**
- Wait for EQH/EQL formation
- Anticipate liquidity grab
- Entry setelah sweep dengan konfirmasi (order block, FVG, CHoCH)
---
#### **4. Fair Value Gaps (FVG)**
**Setup:**
- ✅ Aktifkan "Fair Value Gaps"
- Pilih timeframe (default: chart timeframe)
- Enable/disable auto threshold
- Set extension bars
**Cara Trading:**
1. Bullish FVG = Support zone untuk buy
2. Bearish FVG = Resistance zone untuk sell
3. Price tends to fill FVG (retest)
4. Entry saat price kembali ke FVG
5. Partial fill = valid, full fill = invalidated
**Tips:**
- FVG + Order Block = High probability setup
- Multi-timeframe FVG lebih kuat
- Unfilled FVG = strong momentum
---
#### **5. Premium & Discount Zones**
**Setup:**
- ✅ Aktifkan "Premium/Discount Zones"
- Zones akan auto-update berdasarkan swing high/low
**Interpretasi:**
- 🟢 **Discount Zone** = Area BUY (price murah)
- ⚪ **Equilibrium** = Neutral (50%)
- 🔴 **Premium Zone** = Area SELL (price mahal)
**Trading Strategy:**
- BUY dari discount zone
- SELL dari premium zone
- Avoid trading di equilibrium
- Combine dengan structure confirmation
---
#### **6. Fibonacci Retracement**
**Setup:**
- Pilih Fib yang ingin ditampilkan:
- Equilibrium to Discount
- Equilibrium to Premium
- Discount to Premium
- Toggle show lines
- Enable reverse jika perlu
- Custom colors
**Key Levels:**
- 0.236 = Shallow retracement
- 0.382 = Common retracement
- 0.5 = 50% golden level
- 0.618 = Golden ratio (penting!)
- 0.786 = Deep retracement
**Cara Pakai:**
- 0.618-0.786 = Ideal entry zone dalam trend
- Combine dengan order blocks
- Wait for confirmation candle
---
#### **7. Volume Profile (VRVP)**
**Setup:**
- ✅ Aktifkan "Show Volume Profile"
- Set jumlah rows (10-100)
- Adjust width (5-50%)
- Pilih placement (Left/Right)
- Enable POC dan Value Area
**Interpretasi:**
- **POC (Point of Control)** = Harga dengan volume tertinggi = magnet
- **Value Area** = 70% volume = fair price range
- **Low Volume Nodes** = Weak support/resistance
- **High Volume Nodes** = Strong support/resistance
**Trading:**
- POC acts as support/resistance
- Price tends to return to POC
- Breakout dari Value Area = momentum
---
#### **8. RSI Multi-Timeframe**
**Setup:**
- ✅ Aktifkan "Show RSI Table"
- Set 3 timeframes (default: chart, 5m, 15m)
- Set RSI period (default: 14)
- Set Overbought level (default: 70)
- Set Oversold level (default: 30)
- Pilih posisi & ukuran table
**Interpretasi:**
- 🟢 **OS (Oversold)** = RSI ≤ 30 = Kondisi jenuh jual
- 🔴 **OB (Overbought)** = RSI ≥ 70 = Kondisi jenuh beli
- **-** = Neutral zone
**Trading Strategy:**
1. Multi-timeframe alignment = strong signal
2. OS + Bullish structure = BUY signal
3. OB + Bearish structure = SELL signal
4. Divergence RSI vs Price = reversal warning
**Contoh:**
- TF1: OS, TF2: OS, TF3: OS + Price di discount zone = STRONG BUY
---
#### **9. Moving Averages**
**Setup:**
- Pilih MA Type: EMA, SMA, atau WMA (berlaku untuk ketiga MA)
- Pilih Period Mode: Automatic atau Manual
- Set period untuk MA 1, 2, 3 (default: 20, 50, 100)
- Custom color & width per MA
- ✅ Enable Cross Alerts
**Interpretasi:**
- **Golden Cross** = MA fast cross above MA slow = Bullish
- **Death Cross** = MA fast cross below MA slow = Bearish
- Price above all MAs = Strong uptrend
- Price below all MAs = Strong downtrend
**Trading Strategy:**
1. MA1 (20) = Short-term trend
2. MA2 (50) = Medium-term trend
3. MA3 (100) = Long-term trend
**Entry Signals:**
- Price bounce dari MA dalam trend = continuation
- MA cross dengan konfirmasi structure = entry
- Multiple MA confluence = strong support/resistance
**Alerts Available:**
- MA1 cross MA2/MA3
- MA2 cross MA3
- Price cross any MA
---
#### **10. Multi-Timeframe Levels**
**Setup:**
- Enable HTF Level 1-5
- Set timeframes (contoh: 5m, 1H, 4H, D, W)
- Pilih line style (solid/dashed/dotted)
- Custom colors
**Cara Pakai:**
- Previous high/low dari HTF = strong S/R
- Breakout HTF level = significant move
- Multiple HTF levels confluence = major zone
---
### **C. Trading Setup Combination**
#### **Setup 1: High Probability Buy (Bullish)**
1. ✅ Swing structure: Bullish BOS
2. ✅ Price di Discount Zone
3. ✅ Pullback ke Bullish Order Block
4. ✅ Bullish FVG di bawah
5. ✅ RSI Multi-TF: Oversold
6. ✅ Price bounce dari MA
7. ✅ POC/Value Area support
8. ✅ Fibonacci 0.618-0.786 retracement
**Entry:** Saat price reject dari order block dengan confirmation candle
**Stop Loss:** Below order block
**Target:** Swing high atau premium zone
---
#### **Setup 2: High Probability Sell (Bearish)**
1. ✅ Swing structure: Bearish BOS
2. ✅ Price di Premium Zone
3. ✅ Pullback ke Bearish Order Block
4. ✅ Bearish FVG di atas
5. ✅ RSI Multi-TF: Overbought
6. ✅ Price reject dari MA
7. ✅ POC/Value Area resistance
8. ✅ Fibonacci 0.618-0.786 retracement
**Entry:** Saat price reject dari order block dengan confirmation candle
**Stop Loss:** Above order block
**Target:** Swing low atau discount zone
---
#### **Setup 3: Liquidity Grab (EQH/EQL)**
1. ✅ Identifikasi EQH atau EQL
2. ✅ Wait for liquidity sweep
3. ✅ Konfirmasi dengan CHoCH
4. ✅ Order block terbentuk setelah sweep
5. ✅ Entry saat retest order block
---
### **D. Tips & Best Practices**
**Risk Management:**
- Selalu gunakan stop loss
- Risk 1-2% per trade
- Risk:Reward minimum 1:2
- Jangan over-leverage
**Confluence adalah Kunci:**
- Minimal 3-4 konfirmasi sebelum entry
- Lebih banyak konfirmasi = higher probability
- Quality over quantity
**Timeframe Analysis:**
- HTF (Higher Timeframe) = Trend direction
- LTF (Lower Timeframe) = Entry timing
- Align dengan HTF trend
**Backtesting:**
- Gunakan mode "Historical"
- Test strategy di berbagai market condition
- Record dan analyze hasil
**Market Condition:**
- Trending market = Follow BOS, use order blocks
- Ranging market = Use premium/discount zones, EQH/EQL
- High volatility = Wider stops, wait for clear structure
**Avoid:**
- Trading di equilibrium zone
- Entry tanpa konfirmasi
- Fighting the trend
- Overleveraging
- Emotional trading
---
## 📈 Recommended Settings
### **For Scalping (1m - 5m):**
- Internal Structure: ON
- Swing Structure: OFF
- Order Blocks: Internal only
- RSI Timeframes: 1m, 5m, 15m
- MA Periods: 9, 21, 50
### **For Day Trading (15m - 1H):**
- Internal Structure: ON
- Swing Structure: ON
- Order Blocks: Both
- RSI Timeframes: 15m, 1H, 4H
- MA Periods: 20, 50, 100
### **For Swing Trading (4H - D):**
- Internal Structure: OFF
- Swing Structure: ON
- Order Blocks: Swing only
- RSI Timeframes: 4H, D, W
- MA Periods: 20, 50, 200
---
## ⚠️ Disclaimer
Indicator ini adalah alat bantu analisis teknikal. Tidak ada indicator yang 100% akurat. Selalu:
- Lakukan analisa fundamental
- Gunakan proper risk management
- Praktik di demo account terlebih dahulu
- Trading memiliki resiko, trade at your own risk
---
## 📝 Version Info
**Version:** 5.0
**Platform:** TradingView Pine Script v5
**Author:** XoRonX
**Max Labels:** 500
**Max Lines:** 500
**Max Boxes:** 500
---
## 🔄 Updates & Support
Untuk update, bug reports, atau pertanyaan:
- Check documentation regularly
- Test new features in replay mode
- Backup your settings before updates
---
## 🎓 Learning Resources
**Recommended Study:**
1. Smart Money Concepts (SMC) basics
2. Order blocks theory
3. Liquidity concepts
4. ICT (Inner Circle Trader) concepts
5. Volume profile analysis
6. Multi-timeframe analysis
**Practice:**
- Start with higher timeframes
- Master one concept at a time
- Keep a trading journal
- Review your trades weekly
---
**Happy Trading! 🚀📊**
_Remember: The best indicator is your own analysis and discipline._

NSF/NBF Boxes📘 NSF / NBF Extended Boxes (Wyckoff–VSA Smart Zones)
This indicator automatically detects No Supply (NSF) and No Buying / No Demand (NBF) bars using Wyckoff–VSA principles and marks them with extended boxes and a dashed 50% midline.
🟢 NSF (No Supply) — Bullish accumulation signal
🔴 NBF (No Demand) — Bearish distribution signal
Each box extends forward in time to highlight key supply/demand zones, while the dashed midline represents the equilibrium level within that bar.
When price later retests this 50% level, the script triggers a visual marker and an alert condition, helping you spot potential reversals or continuation confirmations.
🧠 Core Features
Automatic detection of No Supply / No Demand bars
Extended boxes with adjustable length and auto-extension
Midline (50%) retest alerts for precise trade timing
Optional EMA trend filter, volume check, and close bias
Works even on symbols without volume data (crypto, indices, FX)
“Test Mode” included for easy visualization and debugging
⚙️ Usage Tips
Use on 5m–4h charts for crypto or stocks to spot professional activity.
Combine with Wyckoff, VSA, or Smart Money Concepts to confirm accumulation/distribution phases.
Look for NSF retests near support in a downtrend → possible long entry.
Look for NBF retests near resistance in an uptrend → possible short entry.
🧩 Parameters
Ignore Volume: disables volume filters for markets with missing data
Use EMA Trend Filter: only confirm signals in direction of trend
Auto-extend Boxes: keeps zones projecting into future bars
Retest Alerts: triggers when price touches midline after formation
💡 Author’s Note
This tool visualizes the often-hidden behavior of smart money absorption and weak demand exhaustion.
Use it as part of a complete trading plan — not as a standalone buy/sell signal

Swings as Music - Full octaveEvery level corresponds as every note. plot it from high to low and your chart will show you the levels related to the notes vibrations.

Cyclic Reversal Engine [AlgoPoint]Overview
Most indicators focus on price and momentum, but they often ignore a critical third dimension: time. Markets move in rhythmic cycles of expansion and contraction, but these cycles are not fixed; they speed up in trending markets and slow down in choppy conditions.
The Cyclic Reversal Engine is an advanced analytical tool designed to decode this rhythm. Instead of relying on static, lagging formulas, this indicator learns from past market behavior to anticipate when the current trend is statistically likely to reach its exhaustion point, providing high-probability reversal signals.
It achieves this by combining a sophisticated time analysis with a robust price-action confirmation.
How It Works: The Core Logic
The indicator operates on a multi-stage process to identify potential turning points in the market.
1. Market Regime Analysis (The Brain): Before analyzing any cycles, the indicator first diagnoses the current "personality" of the market. Using a combination of the ADX, Choppiness Index, and RSI, it classifies the market into one of three primary regimes:
- Trending: Strong, directional movement.
- Ranging: Sideways, non-directional chop.
- Reversal: An over-extended state (overbought/oversold) where a turn is imminent.
2. Adaptive Cycle Learning (The "Machine Learning" Aspect): This is the indicator's smartest feature. It constantly analyzes past cycles by measuring the bar-count between significant swing highs and swing lows. Crucially, it learns the average cycle duration for each specific market regime. For example, it learns that "in a strong trending market, a new swing low tends to occur every 35 bars," while "in a ranging market, this extends to 60 bars."
3. The Countdown & Timing Signal: The indicator identifies the last major swing high or low and starts a bar-by-bar countdown. Based on the current market regime, it selects the appropriate learned cycle length from its memory. When the bar count approaches this adaptive target, the indicator determines that a reversal is "due" from a timing perspective.
4. Price Confirmation (The Trigger): A signal is never generated based on timing alone. Once the timing condition is met (the cycle is "due"), the indicator waits for a final price-action confirmation. The default confirmation is the RSI entering an extreme overbought or oversold zone, signaling momentum exhaustion. The signal is only triggered when Time + Price Confirmation align.
How to Use This Indicator
- The Dashboard: The panel in the bottom-right corner is your command center.
- Market Regime: Shows the current market personality analyzed by the engine.
- Adaptive Cycle / Bar Count: This is the core of the indicator. It shows the target cycle length for the current regime (e.g., 50) and the current bar count since the last swing point (e.g., 45). The background turns orange when the bar count enters the "due zone," indicating that you should be on high alert for a reversal.
- BUY/SELL Signals: A label appears on the chart only when the two primary conditions are met:
The timing is right (Bar Count has reached the Adaptive Cycle target).
The price confirms exhaustion (RSI is in an extreme zone).
A BUY signal suggests a downtrend cycle is likely complete, and a SELL signal suggests an uptrend cycle is likely complete.
Key Settings
- Pivot Lookback: Controls the sensitivity of the swing point detection. Higher values will identify more significant, longer-term cycles.
- Market Regime Engine: The ADX, Choppiness, and RSI settings can be fine-tuned to adjust how the indicator classifies the market's personality.
- Require Price Confirmation: You can toggle the RSI confirmation on or off. It is highly recommended to keep it enabled for higher-quality signals.

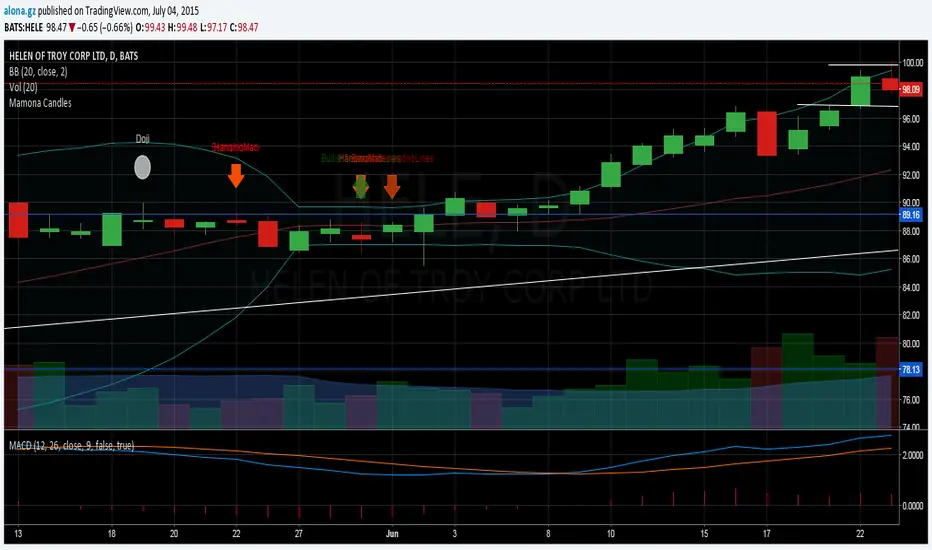
Candlestick Patterns Dashboard Pro+ [ULTIMATE]Unleash the power of automated candlestick analysis with the most comprehensive and customizable pattern detection tool on TradingView. This is not just another pattern scanner; it's a complete trading dashboard designed to identify, score, and confirm high-probability setups, saving you hours of manual chart analysis.
Built with performance and reliability in mind, this script goes beyond simple detection by introducing a unique reliability score for every pattern, advanced confirmation filters, and a powerful on-screen dashboard to keep you informed.
Key Features
📈 Comprehensive Pattern Detection: Automatically identifies 13 of the most effective candlestick patterns, including Bullish/Bearish Engulfing, Hammer, Shooting Star, Doji, Morning/Evening Star, and more.
🔟 Dynamic Reliability Scoring: Every pattern is assigned a score from 1-10 based on its confirmation strength. Factors include candle body size, volume confirmation, trend alignment, and higher-timeframe confluence, giving you a quantifiable measure of a pattern's potential.
📊 The Ultimate Dashboard: Your at-a-glance command center. The on-screen dashboard provides a complete summary of all active patterns, showing you exactly when they last occurred and highlighting the most recent signals. It also includes an "Overall Bias" meter for a quick sentiment check.
🛡️ Trade Smarter with Advanced Confirmation Filters: Eliminate low-quality signals and focus on what matters.
Trend Alignment: Use SMA(50) and SMA(200) to only show patterns that agree with the dominant market trend.
Volume Confirmation: Validate patterns by requiring a surge in volume.
Non-Repainting HTF Confirmation: Ensure your patterns align with the trend on a higher timeframe (e.g., Daily trend for a 4H signal) using a reliable, non-repainting method.
Market Condition Filter: Isolate patterns that occur only in "Trending" or "Ranging" markets.
Time Filter: Restrict pattern detection to specific trading sessions.
🔧 ‘Fuzzy Logic’ for Real-World Trading: Textbook patterns are rare. Use the "Fuzzy Logic" settings to adjust the criteria for patterns like the Hammer, Piercing Line, and Doji, allowing you to catch imperfect but still valid real-world formations.
⚙️ Fully Customizable Scoring: You decide what's important! Adjust the bonus scores for volume, trend, and other factors to create a scoring system that perfectly aligns with your trading strategy.
🚨 Powerful & Customizable Alerts: Never miss an opportunity.
Create alerts for any individual pattern.
Get notified of "Pattern Clusters" when multiple bullish or bearish signals appear in close succession.
Customize the alert messages to be compatible with your favorite trading automation services.
🚀 Performance Optimized: A "Max Bars Back" setting ensures the script runs smoothly and efficiently, even on lower-end devices or extensive historical data.
How To Use This Indicator
For Confirmation: The primary strength of this tool is for confirmation. Do not trade based on patterns alone. Use the detected signals to confirm your own analysis, such as a pattern appearing at a key support/resistance level, a trendline, or a Fibonacci retracement. A Bullish Engulfing pattern at a major support level is a much stronger signal than one appearing in the middle of a range.
For Discovery: Use the Dashboard to quickly scan through your favorite assets. A dashboard full of recent bullish signals on one asset, and bearish on another, can instantly help you focus your attention for the day.
Customizing for Your Style:
Start with the Market Presets ("Forex," "Stocks," "Crypto") for a solid baseline.
Dive into the Scoring Weights to tell the indicator what you value most. A pure volume trader might increase the Volume Bonus score.
Adjust the Fuzzy Logic settings based on your market's volatility. A volatile crypto market might require a more lenient Doji definition than a stable blue-chip stock.
Setting Up Alerts:
Add the indicator to your chart.
Click the "Alert" button in the TradingView toolbar.
Set the "Condition" to "Candlestick Patterns Dashboard Pro+ ".
Choose the specific alert you want from the dropdown (e.g., "Bullish Pattern Detected," "Bearish Pattern Cluster").
Customize the message if needed and click "Create."
A Note of Thanks
This script began as a personal project and has evolved into this ultimate version thanks to invaluable community feedback, bug reports, and suggestions. A special thank you to the users who helped identify and fix critical bugs related to syntax and variable scope. This collaborative effort has made the indicator more robust and reliable for everyone.
Disclaimer: This tool is for educational and analytical purposes only. All trading involves substantial risk. Past performance is not indicative of future results. Please trade responsibly.

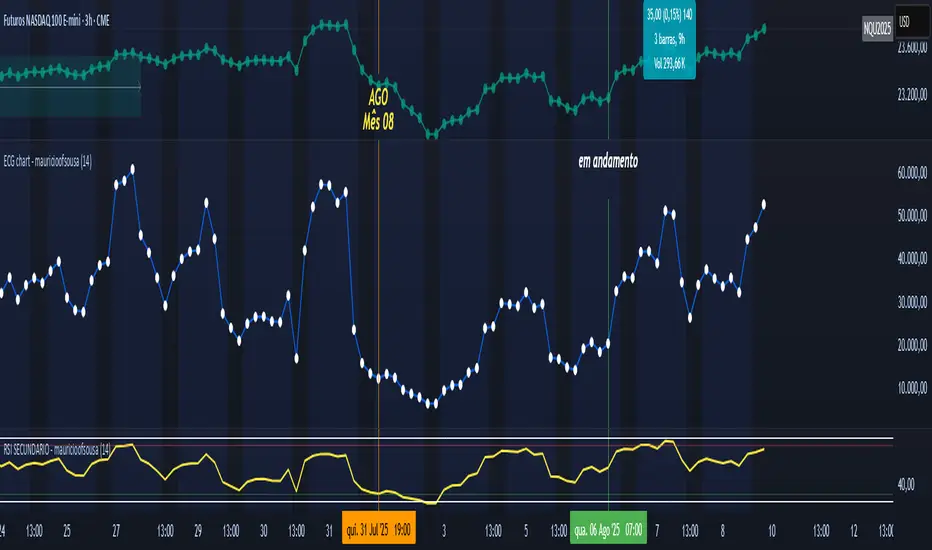
ECG chart - mauricioofsousaMGO Primary – Matriz Gráficos ON
The Blockchain of Trading applied to price behavior
The MGO Primary is the foundation of Matriz Gráficos ON — an advanced graphical methodology that transforms market movement into a logical, predictable, and objective sequence, inspired by blockchain architecture and periodic oscillatory phenomena.
This indicator replaces emotional candlestick reading with a mathematical interpretation of price blocks, cycles, and frequency. Its mission is to eliminate noise, anticipate reversals, and clearly show where capital is entering or exiting the market.
What MGO Primary detects:
Oscillatory phenomena that reveal the true behavior of orders in the book:
RPA – Breakout of Bullish Pivot
RPB – Breakout of Bearish Pivot
RBA – Sharp Bullish Breakout
RBB – Sharp Bearish Breakout
Rhythmic patterns that repeat in medium timeframes (especially on 12H and 4H)
Wave and block frequency, highlighting critical entry and exit zones
Validation through Primary and Secondary RSI, measuring the real strength behind movements
Who is this indicator for:
Traders seeking statistical clarity and visual logic
Operators who want to escape the subjectivity of candlesticks
Anyone who values technical precision with operational discipline
Recommended use:
Ideal timeframes: 12H (high precision) and 4H (moderate intensity)
Recommended assets: indices (e.g., NASDAQ), liquid stocks, and futures
Combine with: structured risk management and macro context analysis
Real-world performance:
The MGO12H achieved a 92% accuracy rate in 2025 on the NASDAQ, outperforming the average performance of major global quantitative strategies, with a net score of over 6,200 points for the year.
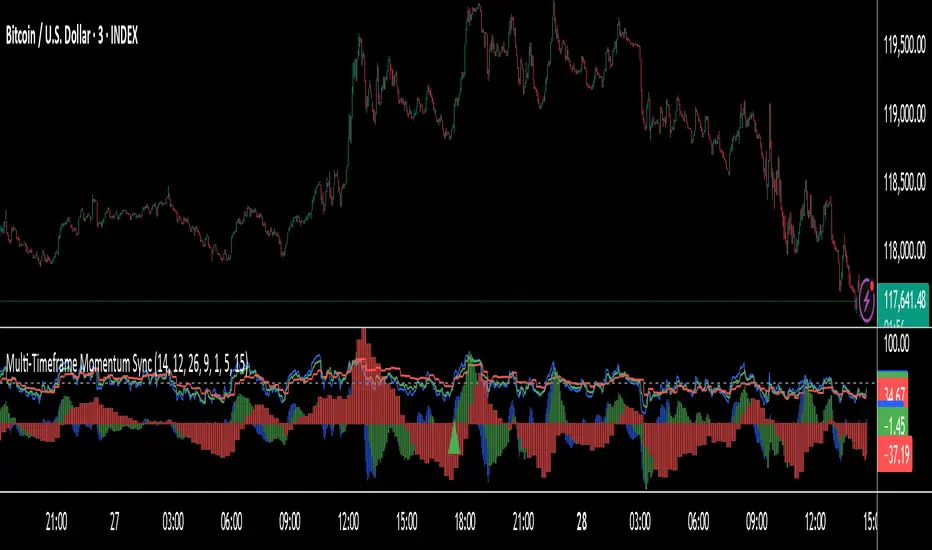
Institutional Momentum Zones (ADX+ROC+DI+MACD+Filters)Institutional Momentum Zones (ADX + ROC + DI + MACD + Filters)
This indicator is designed to help traders visually identify Bullish, Neutral, and Bearish momentum zones on Nifty, indices, or any liquid asset, using a rules-based, institutional-style approach.
It combines multiple professional-grade momentum and trend filters into a single framework:
ADX (Average Directional Index) – Measures trend strength, filters out choppy conditions.
Directional Indicators (+DI / –DI) – Confirms whether bulls or bears are in control.
ROC (Rate of Change) – Quantifies momentum speed and direction.
MACD (optional) – Adds confirmation by checking multi-timeframe momentum alignment.
EMA Filters (optional) – Ensures price is in alignment with long-term trend bias.
Supertrend (optional) – Can be enabled for additional trend confirmation.
How it works:
Bullish Zone (Green) → Strong trend (ADX > threshold) + upward momentum (ROC > 0, +DI > –DI) + optional EMA/MACD/Supertrend confirmation.
Bearish Zone (Red) → Strong trend (ADX > threshold) + downward momentum (ROC < 0, –DI > +DI) + optional EMA/MACD/Supertrend confirmation.
Neutral Zone (Yellow) → Low trend strength (ADX < threshold) or mixed momentum signals.
Features:
Automatic background coloring for zone detection.
On-chart labels marking new zone changes.
EMA50 / EMA200 and Supertrend overlay options.
Signal markers for bullish/bearish entries.
Info panel with live ADX, ROC, DI values, and MACD histogram.
Alert conditions for zone changes (Bull, Bear, Neutral).
Best used for:
Index momentum tracking (e.g., Nifty, Bank Nifty, Dow, S&P500)
Swing trading & positional trading strategies
Filtering trades to avoid entering during low-momentum chop
Tip: For Nifty positional trading, use Daily or 4H charts with EMA & MACD filters enabled for cleaner, high-confidence signals.

N-Pattern Detector (Advanced Logic)Introduction
The N-Pattern Detector (Advanced Logic) is a powerful Pine Script-based tool designed to identify a specific price structure known as the "N-pattern", which often indicates trend continuation or potential breakout points in the market. This pattern combines zigzag pivot logic, retracement filters, volume confirmation, and trend alignment, offering high-probability trading signals.
It is ideal for traders who want to automate pattern detection while applying smart filters to reduce false signals in various markets — including stocks, forex, crypto, and indices.
What is the N-Pattern?
The N-pattern is a 3-leg price formation consisting of points A-B-C-D. It typically follows this structure:
Bullish N-Pattern:
A → Low Pivot
B → Higher High (Impulse)
C → Higher Low (Retracement)
D → Breakout above B (Confirmation)
Bearish N-Pattern:
A → High Pivot
B → Lower Low (Impulse)
C → Lower High (Retracement)
D → Breakdown below B (Confirmation)
The pattern essentially reflects a trend–pullback–breakout structure, making it suitable for continuation trades.
Key Features
1. Intelligent ZigZag Pivot Detection
Uses pivot highs/lows to define key swing points (A, B, C).
Adjustable ZigZag depth to control pattern sensitivity.
Filters noise and avoids false signals in volatile markets.
2. Retracement Validation
Validates the B→C leg as a proper pullback using Fibonacci-based thresholds.
User-defined min and max retracement settings (e.g., 38.2% to 78.6% of A→B leg).
3. Trend Filter via EMA
Filters patterns based on trend direction using a customizable EMA (e.g., 200 EMA).
Only detects bullish patterns above EMA and bearish patterns below EMA (optional).
4. Volume Confirmation
Ensures that impulse legs (A→B, C→D) are supported by stronger volume than the correction leg (B→C).
Adds another layer of confirmation and reliability to detected patterns.
5. Target Projections
Automatically draws 100% A→B projected target from point C.
Optional Fibonacci extensions at 1.272 and 1.618 levels for take-profit planning.
Visually plotted on the chart with colored dashed/dotted lines.
6. Clear Visuals & Labels
Connects all pattern points with colored lines.
Clearly labels points A, B, C, D on the chart.
Uses customizable colors for bullish and bearish patterns.
Includes real-time alerts when a valid pattern is detected.
How to Use It
Add to Chart
Apply the indicator to any chart and time frame. It works across all asset classes.
Adjust Inputs (Optional)
Set ZigZag Depth to control pivot detection sensitivity.
Define Min/Max Retracement levels to match your trading style.
Enable or disable Trend and Volume filters for cleaner signals.
Customize EMA length (default: 200) for trend validation.
Wait for Pattern Confirmation
The indicator constantly scans for valid N-patterns.
A pattern is confirmed only after point D forms (breakout or breakdown).
You’ll see the full pattern drawn with target levels.
Set Alerts
Alerts trigger automatically on confirmation of a bullish or bearish pattern.
You can customize these in TradingView’s alerts panel.

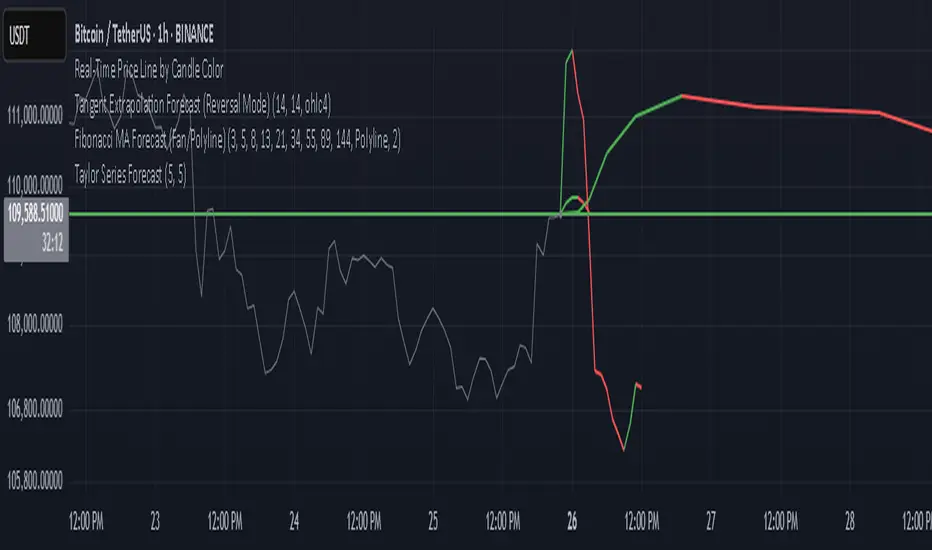
Fibonacci Forecast IndicatorThis indicator projects potential price movements into the future based on user-defined Fibonacci-period moving averages. By default, it calculates Simple Moving Averages (SMAs) for the 3, 5, 8, 13, and 21 bars (though you can customize these values). For each SMA, it measures the distance between the current closing price and that SMA, then extends the price forward by the same distance.
Key Features
1. Fibonacci MAs:
- Uses Fibonacci numbers (3, 5, 8, 13, 21) for SMA calculations by default.
- Fully customizable periods to fit different trading styles.
2. Forecast Projection:
- If the current price is above a given SMA, the forecast line extends higher (bullish bias).
- If the current price is below the SMA, the forecast line extends lower (bearish bias).
- Forecast lines are anchored at the current bar and project forward according to the same Fibonacci intervals.
3. Clean Visualization:
- Draws a series of connected line segments from the current bar’s close to each forecast point.
- This approach offers a clear, at-a-glance visual of potential future price paths.
How to Use
1. Add to Chart:
- Simply apply the indicator to any chart and timeframe.
- Adjust the Fibonacci periods and styling under the indicator settings.
2. Interpretation:
- Each forecast line shows where price could potentially head if the current momentum (distance from the SMA) continues.
- When multiple lines are consistently above (or below) the current price, it may reinforce a bullish (or bearish) outlook.
3. Customization:
- You can modify the number of forecast lines, their color, and line width in the inputs.
- Change or add your own Fibonacci periods to experiment with different intervals.
Notes and Best Practices
- Confirmation Tool: This indicator is best used alongside other forms of technical or fundamental analysis. It provides a “what-if” scenario based on current momentum, not a guaranteed prediction.
- Not Financial Advice: Past performance doesn’t guarantee future results. Always practice proper risk management and consider multiple indicators or market factors before making trading decisions.
Give it a try, and see if these Fibonacci-based projections help visualize where price may be headed in your trading strategy!
HTF Anchored FanSimilar to an Anchored VWAP, this lets you click a bar on an Daily, Weekly, or Monthly chart to add an "Anchored Fan" which displays lines at up to 6 levels above and below the chosen Anchor Point. Useful to measure the retracement during swing moves.
You can reposition the fan by either hovering over the anchor or by clicking the name of the study to "activate" it, and then dragging. You can also change the Anchor Point in Settings.
By default the anchor uses the bar Close, but you can change this manually in settings OR you can use the fancy "Auto high/low" mode which is handy if you are mainly dropping the fan on local swing highs and lows.
The default line measures were chosen for ES (Futures) but the study should be usable with nearly anything as long as you adjust the settings to something appropriate for the ticker. If you want to use this on NQ, for example, it would be reasonable to multiple each of these settings by 3.5 or so.
NOTE: If the fan is way off the left side of the chart it's generally easiest to use Settings to move it back to close to "now".

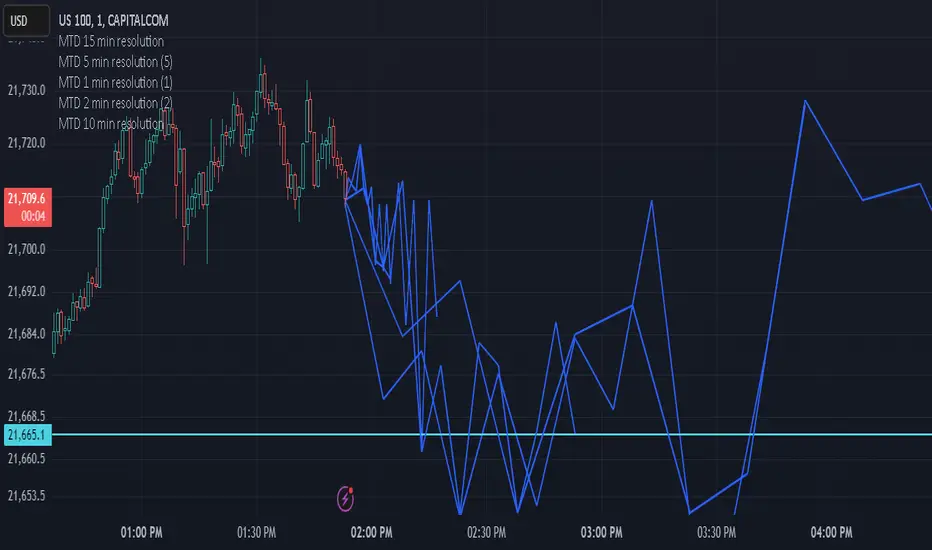
Multi-timeframe Difference Forecast (MTD)Description:
The Multi-timeframe Difference Forecast indicator projects potential future price levels by comparing open prices across multiple timeframe pairs. It uses 12 predefined timeframe pairs where each pair consists of a lower and a higher timeframe. For each pair, the indicator calculates a forecast value by adding the difference between the lower timeframe’s open and the higher timeframe’s open to the current bar’s close. These forecast values are then plotted as points into the future and connected by blue line segments, forming a continuous projection line on your chart.
How It Works:
Timeframe Pairs:
The indicator defines 12 pairs. For example:
Pair 1: Lower timeframe = 15 minutes; Higher timeframe = 150 minutes
Pair 2: Lower timeframe = 30 minutes; Higher timeframe = 165 minutes
⋮
Pair 12: Lower timeframe = 180 minutes; Higher timeframe = 720 minutes
Forecast Calculation:
For each pair, the forecast is computed as:
forecast = close + (lower timeframe open - higher timeframe open)
This produces a series of forecast values that are then plotted on the chart.
Time Offset:
Each forecast point is offset into the future by a number of bars calculated as the ratio between the lower timeframe’s duration (in seconds) and the current chart’s timeframe (in seconds). This adjustment helps align the forecast points correctly on the time axis.
Visualization:
The indicator draws blue lines (width = 2) connecting the current price to each forecast point sequentially, forming a polyline that visually represents the projected price trajectory.
How to Use:
Overlay on Chart:
Apply this indicator to any chart, and it will automatically overlay the forecast line on your current price chart.
Timeframe Flexibility:
The calculations adjust to the chart’s timeframe, so you can use it on various timeframes without needing to change the code.
Interpretation:
The forecast line is intended to provide a visual estimate of potential future price movement based on historical open price differences. It is meant to serve as an additional analytical tool rather than a standalone trading signal.
Disclaimer:
This script is provided for educational and informational purposes only and should not be construed as financial or trading advice. Trading involves significant risk, and past performance is not indicative of future results. You should perform your own analysis and consult with a qualified professional before making any trading decisions. Use this indicator at your own risk.
Smart Money Breakouts [iskess 01-02 11:05]This is an big update to the excellent Smart Money Breakout Script published in Oct 2023 by ChartPrime who, to my knowledge, was the original author.
FULL CREDIT GOES TO CHARTPRIME FOR THIS ORIGINAL WORK.
Per the moderator's rules, you will find below a meaningful, detailed self-contained description that does not rely on delegation to the open source code or links to other content. You will find in the description details on what the script does, how it does that, how to use it, and how it is original.
The "Smart Money Breakouts" indicator is designed to identify breakouts based on changes in character (CHOCH) or breaks of structure (BOS) patterns, facilitating automated trading with user-defined Take Profit (TP) level.
The indicator incorporates essential elements such as volume analysis and a data table to assist traders in optimizing their strategies.
🔸Breakout Detection:
The indicator scans price movements for "Change in Character" (CHOCH) and "Break of Structure" (BOS) patterns, signaling potential breakout opportunities in the market.
🔸User-Defined TP/SL :
Traders can customize the Take Profit (TP) and Stop Loss (SL) through the indicator settings, with these levels dynamically calculated based on the Average True Range (ATR). This allows for precise risk management and profit targets that adapt to market volatility. Traders can also select the lookback period for the TP/SL calculations.
🔸Volume Analysis and Trade Direction Specific Analysis:
The indicator includes a volume checker that provides valuable insights into the strength of the breakout, taking into account trade direction.
🔸If the volume label is red and the trade is long, it suggests a higher likelihood of hitting the Stop Loss (SL).
🔸If the volume label is green and the trade is long, it indicates a higher probability of hitting the Take Profit (TP).
🔸For short trades, a red volume label suggests a higher likelihood of hitting TP, while a green label suggests a higher likelihood of hitting SL.
🔸A yellow volume label suggests that the volume is inconclusive, neither favoring bullish nor bearish movements.
🔸Data Table:
The indicator features a data table that keeps track of the number of winning and losing trades for specific timeframes or configurations. It also shows the percentage of profits vs losses, and the overall profit/loss for the selected lookback period.
This table serves as a valuable tool for traders to analyze performance and discover optimal settings and timeframes.
The "Smart Money Breakouts" indicator provides traders with a comprehensive solution for breakout trading, combining technical analysis of changes in character and breaks of structure, volume insights, and performance tracking while dynamically adjusting TP and SL levels based on market volatility through the ATR.
This version of the script is a "significant improvement" from Chart Prime's original work in the following ways:
- A selectable range of candles for the profit/loss calculations to look back on.
- An updated table that includes the percentage of wins/losses, and and overall P&L during the selected lookback range.
- The user can now select only Long trades, Short trades, or both.
- The percentage gain/loss is now indicated for every trade on the chart.
- The user can now select a different multiplier for Stop Loss or Take Profit thresholds.

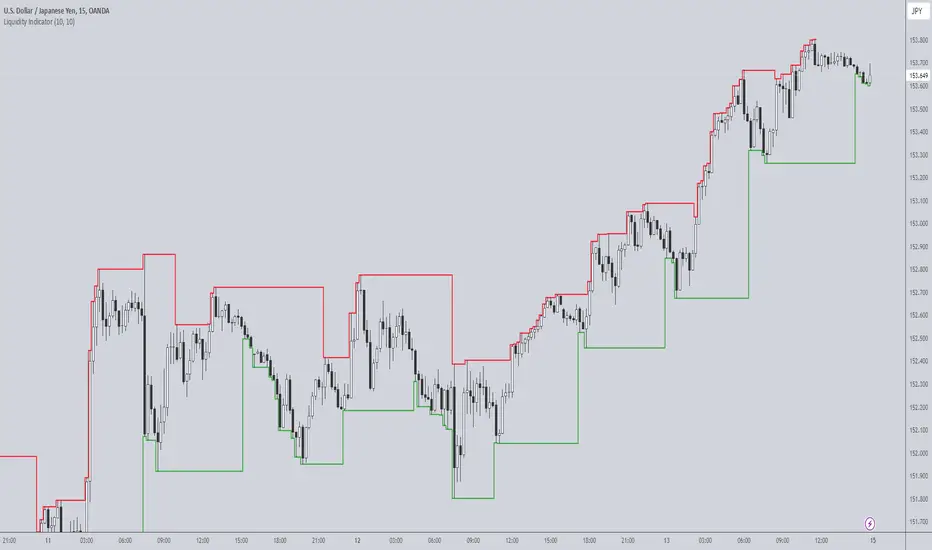
Liquidity IndicatorThe Liquidity Indicator helps identify key price levels where liquidity may be concentrated by highlighting local highs and local lows on the chart. These levels are calculated using a lookback period to determine the highest and lowest points in the recent price action.
Local Highs: Displayed as red lines, these indicate recent peaks where price has experienced rejection or a possible reversal point.
Local Lows: Displayed as green lines, these represent recent troughs where price may find support or experience a bounce.
This indicator is useful for spotting potential areas of interest for price reversal or continuation, as high liquidity zones may lead to more significant price movements.
Key Features:
Adjustable lookback period to define the scope for identifying local highs and lows.
Continuous plotting without any time restrictions, providing real-time insights into liquidity conditions.
Alerts available for when a local high or local low is detected, enabling timely market analysis.
Use Case:
This indicator can be used in conjunction with other technical analysis tools or strategies to help identify significant price levels where liquidity could impact price action. It is suitable for both intraday and swing traders looking for key price zones where potential reversals or continuations might occur.
PDH & PDL Indicator: Previous Day's High/Low with AlertsThe PDH & PDL Indicator plots the Previous Day's High (PDH) and Previous Day's Low (PDL) directly on the chart, providing a clear visual reference for key price levels. These levels are often used by traders to identify potential breakout or breakdown zones and to gauge market strength or weakness.
Features:
PDH (Green Line) : Represents the high of the previous trading day.
PDL (Red Line): Represents the low of the previous trading day.
Alerts:
Get notified when the price crosses above PDH or below PDL.
Custom alert messages to keep you informed in real-time.
Use Cases:
Identify key breakout and breakdown points for potential trade entries or exits.
Confirm the strength of a trend by monitoring price action relative to PDH and PDL.
Useful for intraday, swing, and positional traders who rely on historical price levels for strategy development.
