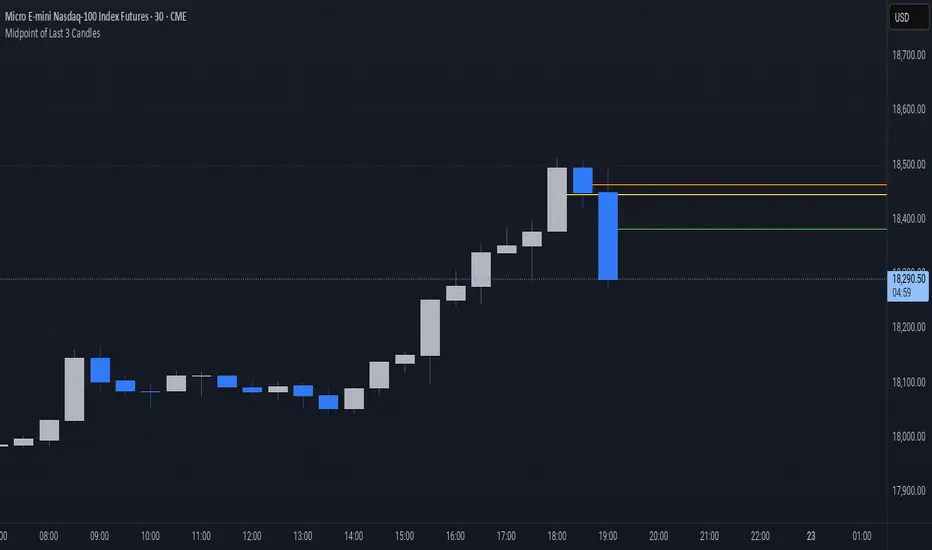
Midpoint of Last 3 CandlesThis indicator highlights the market structure by plotting the midpoints of the current and previous two candles. It draws a horizontal line at the average of the high and low for each of these candles, giving a visual cue of the short-term balance point in price action. These midpoints can act as dynamic support and resistance levels, helping traders assess areas of potential reaction or continuation.
Each line is color-coded for clarity: green represents the current candle, orange marks the previous candle, and yellow indicates the one before that. All lines extend into the future on the chart, allowing you to see how price interacts with these levels as new candles form. This simple yet effective tool can be useful in various strategies, especially those focused on price action, scalping, or intraday analysis.
Search in scripts for "horizontal line"
Opening Price Levels (by Period)This indicator draws clean horizontal lines at the opening prices of key time periods: Year, Quarter, Month, Week, and Day.
Each line is plotted only within its own time range, so there's no visual clutter or vertical jumps between periods.
Perfect for traders who want to:
Identify and react to institutional levels.
Track price behavior relative to major opens.
Keep charts clean and easy to read.
Features:
✅ Toggle visibility for each period (Year, Quarter, Month, Week, Day).
🎯 Accurate open levels, aligned with your chart's timeframe and session settings.
✨ Clean segments — each line only spans its original period.

Dynamic Volume Profile PoC SwiftedgeOverview
The Dynamic Volume Profile PoC is a powerful and visually intuitive indicator designed to help traders identify key support and resistance levels using a unique combination of pivot points, volume analysis, and dynamic Point of Control (PoC) levels. This script overlays directly on your chart, providing clear visual cues for potential breakout and rejection zones, making it easier to spot high-probability trading opportunities.
What It Does
This indicator combines three core components to deliver actionable insights:
Pivot Points: Identifies significant swing highs and lows to establish potential support and resistance levels.
Volume Oscillator: Measures volume momentum to confirm the strength of price movements, ensuring that breakouts or rejections are backed by significant volume.
Dynamic Point of Control (PoC): Calculates the midpoint between consecutive pivot points to create dynamic PoC levels, which act as key areas where price is likely to either break through (breakout) or reverse (rejection).
These components work together to highlight critical price levels where the market is likely to react, giving traders a clear framework for decision-making.
How It Works
Pivot Detection: The script uses pivot highs and lows (based on user-defined Left Bars and Right Bars) to identify significant price levels. These pivots form the foundation for calculating PoC levels.
PoC Calculation: Each time a new pivot is detected, the script calculates the midpoint between the current pivot and the previous pivot, creating a dynamic PoC level. These levels are plotted as horizontal lines on the chart, with a maximum of Max PoC Lines to Show (default: 2) visible at any time.
Volume Confirmation: A volume oscillator (short EMA of volume minus long EMA of volume) is used to filter breakouts and rejections. Breakouts or rejections are only signaled if the volume oscillator exceeds the Volume Threshold (default: 20), ensuring that price movements are supported by strong volume.
Visual Cues:
PoC levels are drawn as cyan lines with optional semi-transparent zones (controlled by Show PoC Zones). These zones are colored green for potential breakouts (price above PoC) and red for potential rejections (price below PoC).
Labels above and below each PoC level indicate trading opportunities: "Long if breakout"/"Long if rejected" (green) and "Short if breakout"/"Short if rejected" (red), depending on the price's direction relative to the PoC.
Break signals ("B") are plotted above or below bars when price crosses a pivot level with sufficient volume, colored red for downward breaks and green for upward breaks.
How to Use
Add the Indicator: Add the "Dynamic Volume Profile PoC " to your chart in TradingView.
Adjust Settings:
Left Bars and Right Bars (default: 15): Control the sensitivity of pivot detection. Lower values make the script more sensitive to smaller price swings.
Volume Threshold (default: 20): Set the minimum volume oscillator value required to confirm breakouts or rejections. Increase this for stricter confirmation.
Max PoC Lines to Show (default: 2): Define how many PoC levels are displayed at once.
Show PoC Zones (default: true): Toggle semi-transparent zones around PoC levels for better visualization.
Label Spacing Factor (default: 0.5): Adjust the vertical spacing between labels and the PoC box. Increase this value (e.g., to 1.0 or 2.0) for more spacing, or decrease it (e.g., to 0.3) for less.
Interpret the Signals:
Look for PoC levels (cyan lines) as key areas of interest.
Use the labels to identify potential trades: "Long if breakout" indicates a buy opportunity if price breaks above the PoC, while "Short if rejected" suggests a sell if price fails to break through.
Watch for "B" signals to confirm breakouts or rejections with volume support.
Combine with Your Strategy: Use the PoC levels and break signals as part of your broader trading strategy, such as trend-following or mean-reversion setups.
Why This Script is Unique
The Dynamic Volume Profile PoC stands out by combining pivot points, volume analysis, and dynamic PoC levels into a single, cohesive tool. Unlike traditional volume profile indicators that require a fixed range, this script dynamically updates PoC levels based on recent price action, making it more responsive to current market conditions. The addition of volume confirmation ensures that signals are backed by market participation, reducing false breakouts. The visually appealing design, with customizable spacing and semi-transparent zones, makes it easy to interpret key levels at a glance, even for traders unfamiliar with Pine Script.
Notes
This script works best on timeframes where pivot points are meaningful (e.g., 1H, 4H, or daily charts).
Adjust the Label Spacing Factor to ensure labels are well-spaced for your chart's zoom level and instrument.
For instruments with high volatility, you may need to increase the Volume Threshold to filter out noise.

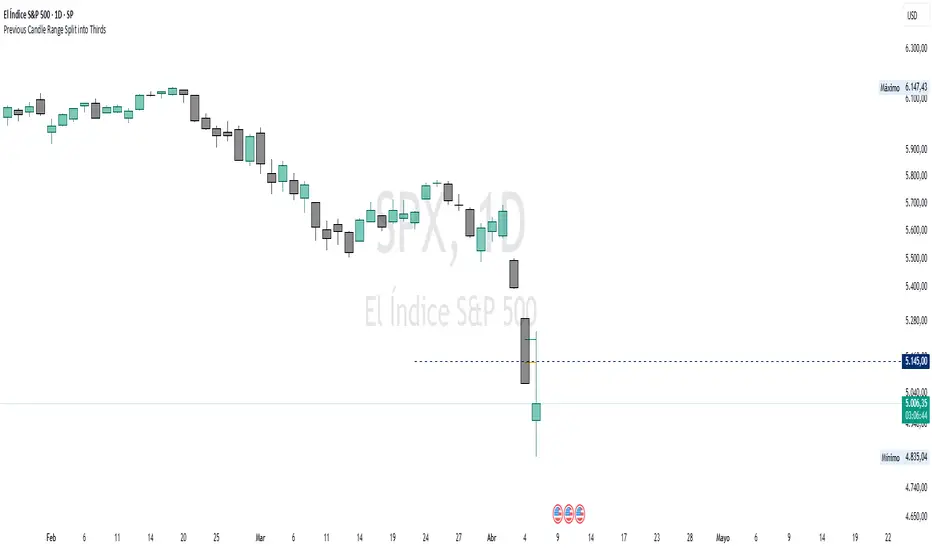
Previous Candle Range Split into ThirdsThis script plots two horizontal lines over the previous candle to divide its total range (high to low) into three equal parts. The first line marks 33% of the range from the low, and the second marks 66%. This helps users visually identify whether the previous candle closed in the lower, middle, or upper third of its range, providing context on potential buyer or seller dominance during that session.
Users can customize the color, width, and style (solid, dotted, dashed) of each line, as well as toggle their visibility from the script's input settings.
This indicator is designed as a discretionary analysis tool and does not generate buy or sell signals.
Pre-Market High/Low (Static Lines + Labels)
Pre-Market Range ✅
Draws the Pre-Market High & Low from 4:00 AM to 9:30 AM ET using accurate 1-minute intraday data.
Static Lines 📏
Plots dashed horizontal lines that remain visible all day across all timeframes — including 1m, 5m, 15m, 1h, 4h, and Daily.
Price Labels 🔖
Includes real-time price labels so you can easily reference exact pre-market levels on the chart.
Session Lock 🕒
Lines are locked in after 9:30 AM and remain visible even if you switch timeframes or turn off extended hours.
Trading Utility 🎯
Ideal for identifying key breakout levels, intraday support/resistance zones, and setting risk parameters.

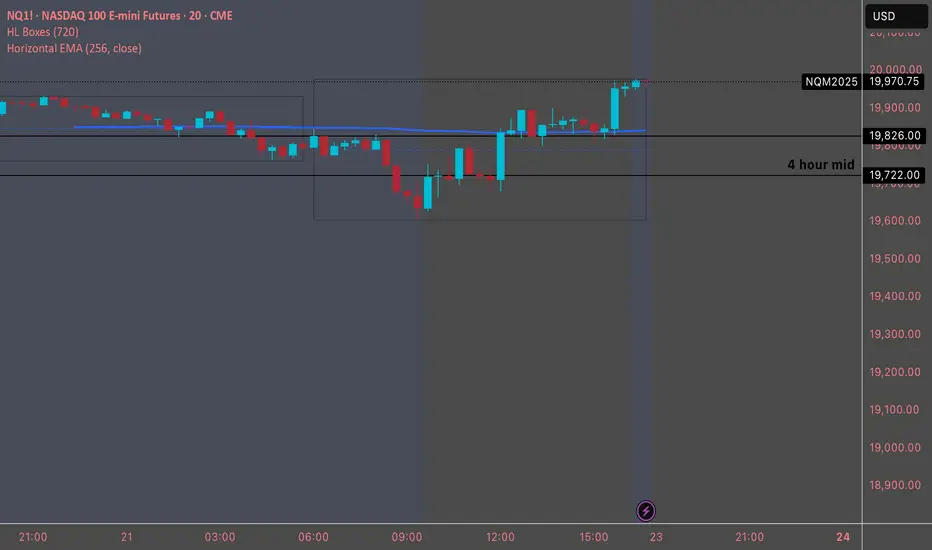
Horizontal EMADesigned to plot a horizontal Exponential Moving Average (EMA) line on a TradingView chart. The script allows users to specify the period and source for the EMA calculation. The line remains fixed at the calculated EMA value, providing a visual reference for the trend over the specified period. The script uses version 5 of Pine Script and draws a blue horizontal line at the EMA value on the chart, updating as new data is available.
ATR Multiples from LOD/HODAn indicator that plots ATR (Average True Range) multiples from the current Low of Day (LOD) and High of Day (HOD). The indicator should:
Calculate the Low of Day (LOD) and High of Day (HOD) dynamically for the current trading session.
Use the ATR (Average True Range), with a customizable length, as the base measurement.
Plot multiple levels above the LOD and below the HOD, based on user-defined ATR multiples (e.g., 1x ATR, 2x ATR, 3x ATR, etc.).
Customizable Inputs:
ATR Length
ATR Multiples (Up to 5 levels)
Line color and style for each level
Display the ATR multiples on the chart as horizontal lines extending throughout the trading session.

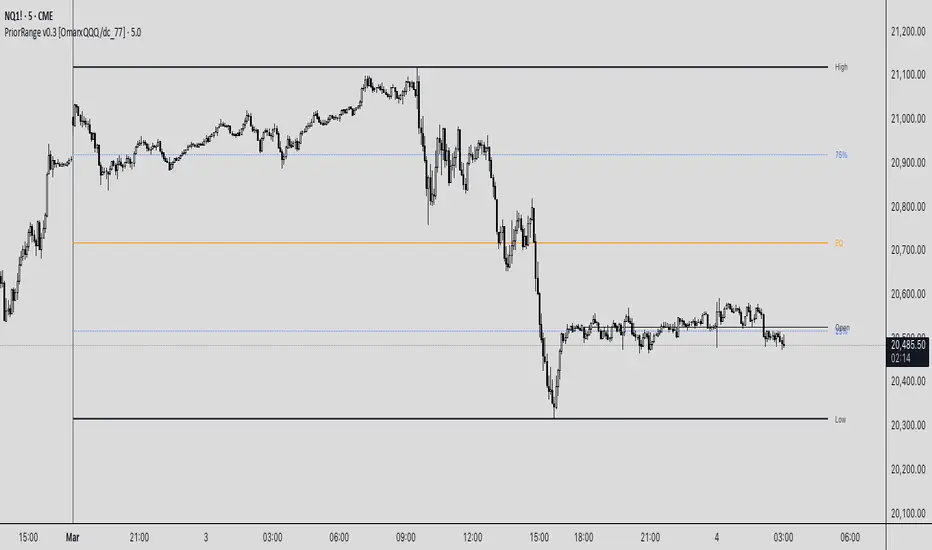
PriorRange v0.3 [OmarxQQQ/dc_77]PriorRangeLevels is a versatile indicator that plots key price levels based on prior period ranges across multiple timeframes. This tool helps traders identify potential support, resistance, and breakout zones by displaying the High, Low, 75%, 50% (EQ), and 25% levels from the previous period.
Key Features:
- Multi-timeframe analysis from 1-minute to Monthly charts
- Time zone flexibility with options for major global markets (NYC, London, Tokyo, etc.)
- Customizable display for each level (High, Low, 75%, EQ, 25%, Open)
- Clean, organized settings interface with grouped options
- Anchor line marking the start of prior periods
- Current period open price reference
How It Works:
The indicator detects new periods based on your selected timeframe and calculates the range of the previous period. It then plots horizontal lines at the High, Low, and three internal levels (75%, 50%, 25%) extending forward by your specified number of bars. These levels serve as potential support/resistance zones and decision points for your trading strategy.
Trading Applications:
- Use High/Low levels as potential breakout targets or reversal zones
- Monitor price reaction to the EQ (50%) level to gauge trend strength
- Identify intraday support/resistance based on previous period ranges
- Plan entries and exits around established market structure
Each component can be individually customized with different line styles, colors, and widths to match your chart preferences and analytical needs.
Originally created by @dc_77 with enhanced organization, multi-timeframe capabilities, and improved user interface. As Requested by many people.
populi a populo pro populo
GLGT
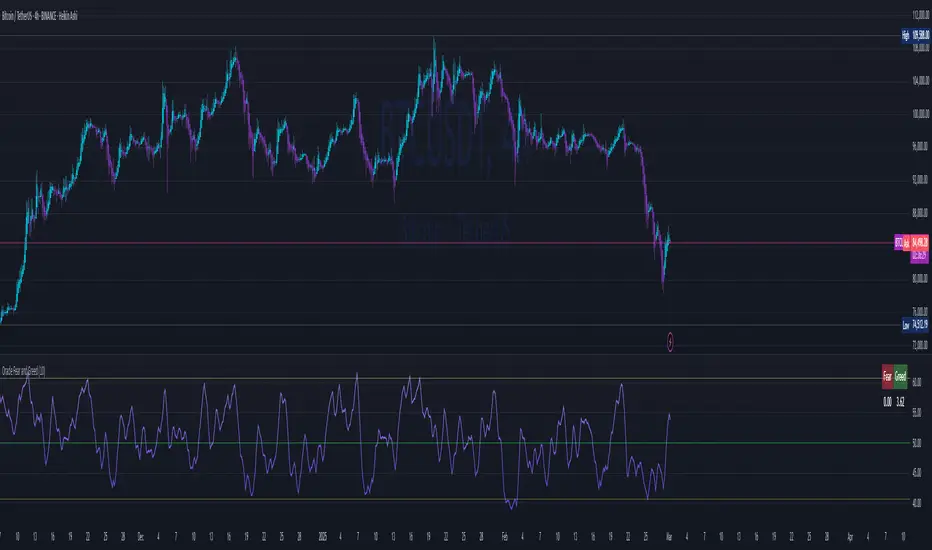
Oracle Fear and GreedCustom Fear and Greed Oscillator with Movement Table
This indicator provides a unique perspective on market sentiment by calculating a custom fear/greed oscillator based on Heikin-Ashi candles. The oscillator is centered at 50, with values above 50 suggesting bullish sentiment ("greed") and below 50 indicating bearish sentiment ("fear"). The calculation incorporates candle body size, range, and a custom "candle strength" measure, providing an innovative approach to understanding market behavior.
Key Features:
Heikin-Ashi Based Oscillator:
Utilizes Heikin-Ashi candles to compute a custom oscillator. The value is centered at 50, with deviations indicating the prevailing market sentiment.
Dynamic Gradient Coloring:
The oscillator line is dynamically colored with a smooth gradient—from blue (representing fear) at lower values to pink (representing greed) at higher values—making it visually intuitive.
Horizontal Levels:
Two additional horizontal lines are drawn at 40.62 ("Bottom") and 60.74 ("Top"), which may serve as potential oversold and overbought boundaries respectively.
Fast Movement Metrics:
Every 5 bars, the indicator calculates the percentage change in the Heikin-Ashi close. This fast movement analysis distinguishes rapid downward moves (fast fear) from rapid upward moves (fast greed), helping to capture sudden market shifts.
Information Table:
A table in the top-right corner displays the most recent fast movement values for both fear and greed, offering quick insights into short-term market dynamics.
Usage Tips:
Adjust the smoothing period to match your preferred trading timeframe.
Use the oscillator alongside other analysis tools for more robust trading decisions.
Ideal for those looking to experiment with new approaches to sentiment analysis and momentum detection.
Disclaimer:
This indicator is intended for educational and experimental purposes. It should not be used as the sole basis for any trading decisions. Always combine with comprehensive market analysis and risk management strategies.
You can add this description when publishing your indicator on TradingView to help other users understand its features and intended use.
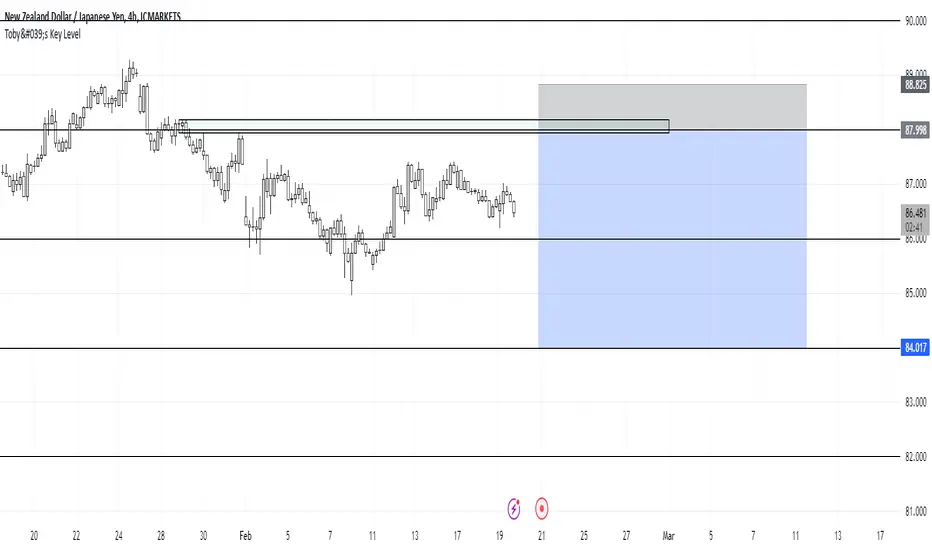
Toby's Key LevelsAn Indicator that helps determine Key Areas on the chart. You set the values you want the horizontal lines to update. They horizontal lines will be used for exits and entries of trade. My recommendation for these Key Areas are as follows ( These recommendations are mostly for day trading and swing trading ):
XAU: Value distance of 50 ex. XAUUSD.
NAS: Value distance of 250 ex. NAS100/USTEC.
ETH: Value distance of 100 ex. ETHUSD.
AUD pairs: Value distance of 0.0200 ex. GBPAUD, EURAUD.
CAD pairs: Value distance of 0.0100 ex. NZDCAD, EURCAD.
CHF pairs: Value distance of 0.0100 ex. CADCHF, GBPCHF.
GBP pairs: Value distance of 0.00350 ex. EURGBP.
JPY pairs: Value distance of 2.00 ex. EURJPY, GBPJPY.
NZD pairs: Value distance of 0.015 ex. GBPNZD, AUDNZD.
Note:
These are subject to change and you can alter the lines anyhow you want to suit your trading style. These are what I recommend. Remember, Market is King.
Safe Trading!
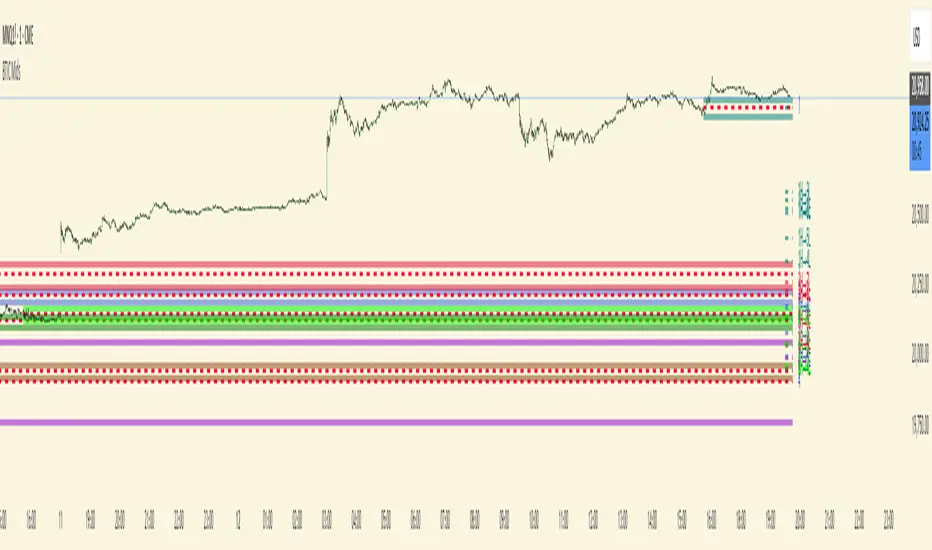
BTIC Range MidpointsThis code analyzes and displays price ranges from 15:15-15:44 ET, the Basis Trade at Index Close session.
It draws horizontal lines showing:
The high of each session
The low of each session
The midpoint (50%) of each session
Connections between different session ranges (50% points between highs and lows)
Key features include:
Works only on 15-minute timeframes or lower
Stores up to 20 days of historical sessions (configurable)
Filters out ranges too far from current price
Color-codes different session ranges
Provides customizable line styles and colors
Labels each range with identifiers
The indicator essentially helps traders identify important price levels from BTIC sessions, which could serve as potential support/resistance areas for future price action.
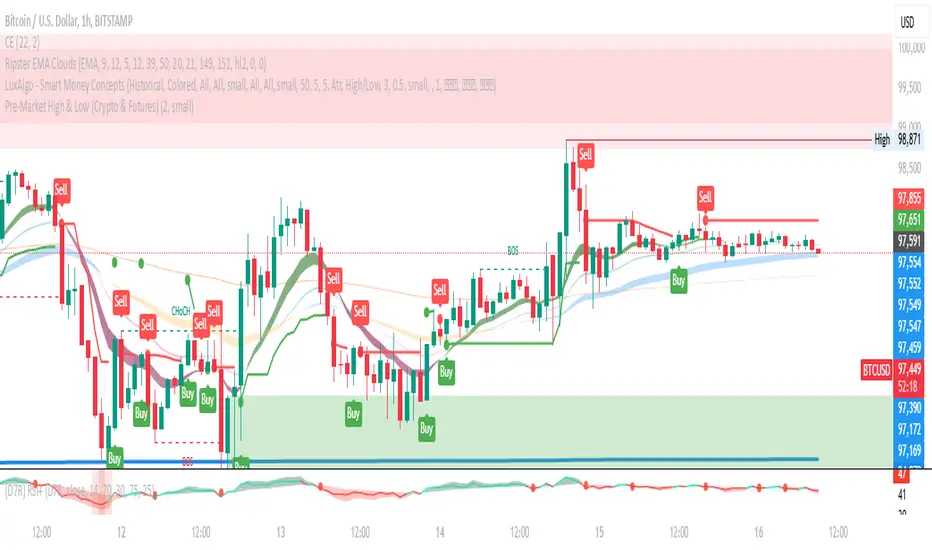
Pre-Market High & LowIndicator: Pre-Market High & Low
This indicator tracks the high and low price levels of a stock during the pre-market session (4:00 AM - 9:30 AM EST), before the official market open. It dynamically updates during pre-market hours, identifying the highest and lowest prices reached. Once the pre-market session ends, these levels are saved and plotted on the chart as reference points for the regular market session.
Key Features:
Dynamic Updates: Continuously tracks the high and low during pre-market hours.
Visual Indicators: Plots horizontal lines representing the pre-market high (green) and low (red).
Post-Market Reference: Once pre-market ends, these levels remain visible for the regular market session as reference points for potential breakout or breakdown levels.
How to Use:
Use this indicator to identify potential breakout or breakdown levels that may happen at the market open.
The green line represents the highest price reached during pre-market, while the red line indicates the lowest price.
The indicator will stop updating once the pre-market session closes (9:30 AM EST) and will remain visible as reference levels throughout the trading day.
Ideal for:
Day traders looking for pre-market support and resistance levels.
Traders analyzing the initial market reaction based on pre-market price action.
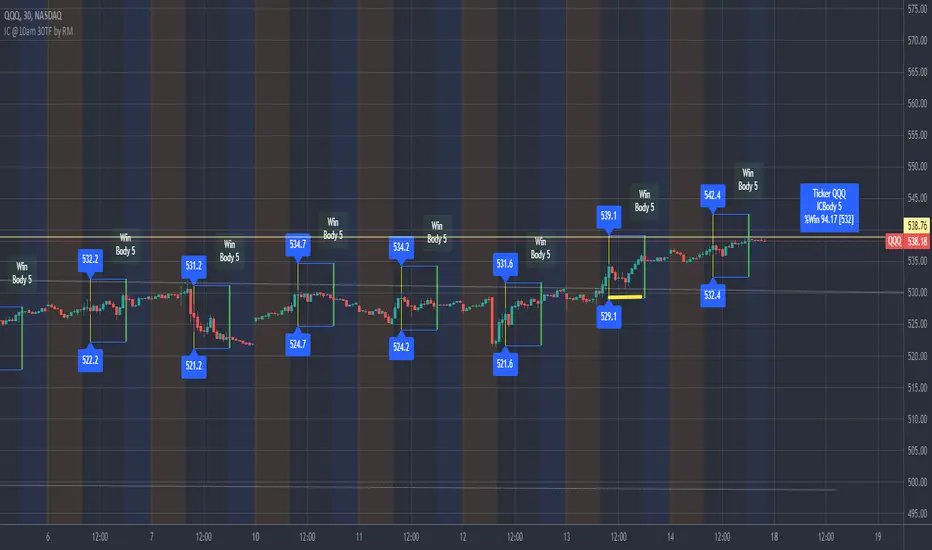
IronCondor 10am 30TF by RMThe IronCondor 10am 30TF indicator shows Iron Condor trades win rate over a large number of days.
The default ETFs in this indicators are "QQQ", "SPY", "RUT" , "CBTX" and "SPX", other entries have not been tested.
Iron Condor quick explanation:
- Iron Condors trades have four options, generally, are based around a Midpoint price (Current Market Price Strike) and
- Two equally distances Strikes for the SELL components (called the Body of the Iron Condor)
- Further away from the two SELLs, another Two BUYs for protection (not considered in this indicator)
- Iron Condors are used for Passive Income based on small gains most of the time.
The IronCondor 10am 30TF has its logic created based on the premises that:
- Most days the market prices stay within a range.
- As example the S&P market prices would stay within 1% on about 80% of the time
- The moving markets (bullish or bearish) occur about 20% of the time
- The biggest market price volatility generally occurs before market opens and then around the first hour or so of trade in the day.
- After the first hour or so of the market the prices would be most likely to stay within a range.
The operation is simple:
- At the Trade Star time in the day (say 10:30 Hrs.) draws a vertical yellow line, then
- Creates two blue horizontal lines for the SELL limits in the Iron Condor Body, at +/- 1% price boundary (check Ticker list below for values)
- At the Trade End time (say 16:00 Hrs.) checks that none of the SELL limits have been broken by highs or lows during the trade day
(The check is done calculating at Trade End time the high/lows 10 bars back for 30 min TF - timeframe)
- There is a label at each Trade End time with Win/Loss and Body value.
- There is one final label with overall calculated past performance in Win percentage out of 'n' trades
Defaults and User Entries:
- The User can modify the Midpoint price called 'IronCondor Midpoint STRIKE' (default is the Candle Close at the selected time)
- The User can modify the Body value called 'IronCondor Body' (default is the Ticker's selected value as per list below)
"QQQ" or "SPY" Body = 5
"RUT" or "CBTX" Body = 20
"SPX" Body = 60
* Disclaimer: This is not a Financial tool, it cannot used as any kind of advice to invest or risk moneys in any market,
Markets are volatile in nature - with little or no warning - and will drain your account if you are not careful.
Use only as an academic demonstrator => * Use at your own risk *
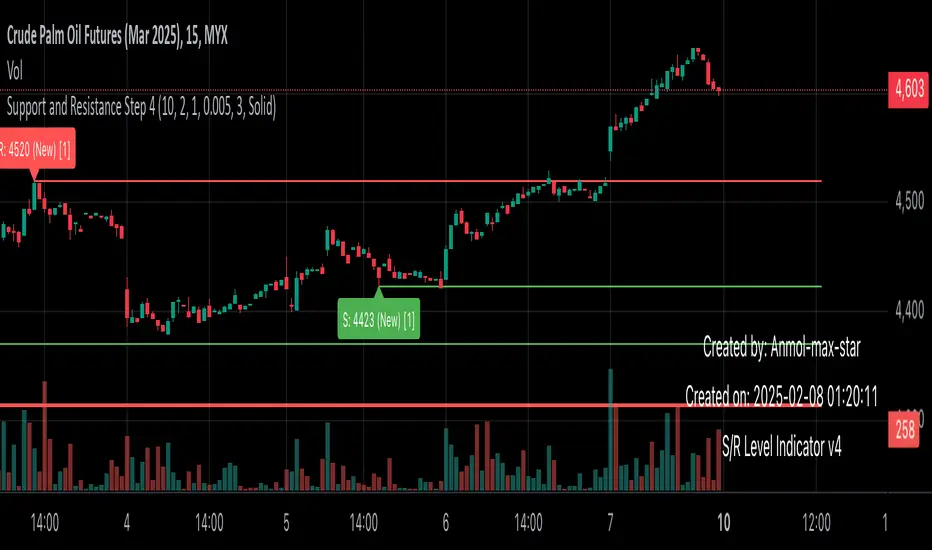
Support and Resistance all in one The Support and Resistance Indicator (v4) is designed to identify and track key price levels in financial markets. Here's how it works:
Core Functionality
Level Detection
Uses pivot points to identify significant price levels
Looks for swing highs (resistance) and swing lows (support)
Requires price action to pivot over a specified period (default 10 bars)
Dynamic Level Management
Maintains separate arrays for support and resistance levels
Limits maximum displayed levels (default 10) to prevent chart clutter
Removes oldest levels when maximum is reached
Ensures new levels are sufficiently distant from existing ones (minimum 1% separation)
Touch Detection System
Monitors price interaction with established levels
Counts when price comes within 0.1% of any level
Updates touch count and strength classification
Categories: "New" (1 touch), "Moderate" (2 touches), "Strong" (3+ touches)
Visual Representation
Draws horizontal lines at each level
Updates line width based on strength (thicker for stronger levels)
Shows labels with price and strength information
Color coding: Red (new/moderate levels), Green (strong levels)
Displays triangles (▼▲) at pivot points
Trading Applications
Support/Resistance Trading
Strong levels (3+ touches) suggest reliable trading zones
More touches indicate higher probability reversal points
Use for stop loss and target placement
Breakout Trading
Monitor breaks of strong levels
Higher touch count suggests more significant breakouts
Watch for false breakouts at weaker levels
Risk Management
Place stops beyond strong levels
Use level strength to adjust position size
Consider multiple timeframe analysis
Best Practices
Use with other indicators for confirmation
Consider market context and trend
Monitor level strength development
Don't rely solely on touch count
Watch for price reaction at levels
Customization Options
Adjust pivot length for different timeframes
Modify minimum distance between levels
Change required touches for "Strong" classification
Toggle strength labels display
Choose line style (Solid/Dashed/Dotted)
This indicator helps identify key price levels where market participants have shown interest, making it valuable for trade planning and risk management
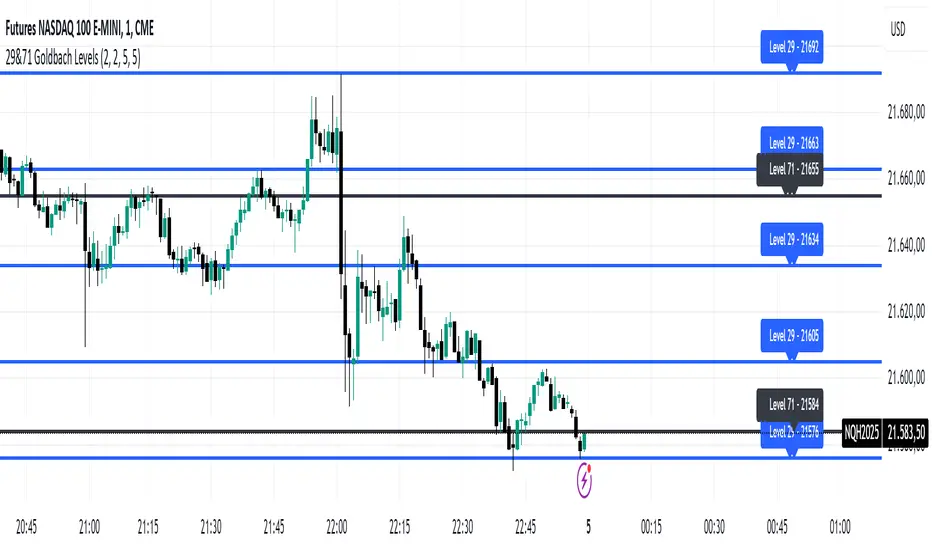
29&71 Goldbach levelsThe indicator automatically plots horizontal lines at the 29 and 71 price levels on your chart. These levels serve as psychological barriers in the market, where price action may react or consolidate, just as prime numbers are fundamental in the theory of numbers.
---
Features:
- 29 Level: Identifies significant areas where market participants may encounter support or resistance, similar to the importance of prime numbers in Goldbach's conjecture.
- 71 Level: Marks another key zone that might indicate possible price breakouts or reversals, offering traders a reference point for decision-making.
- Customizable: You can adjust the colors, line styles, or alerts associated with these levels to fit your trading preferences.
How to Use:
- Use the 29 and 71 levels to spot potential areas of support or resistance on the chart.
- Watch for price reactions at these levels for possible breakout or reversal setups.
- Combine the levels with other technical indicators for added confirmation.
---
This indicator blends the theory of prime numbers with market analysis, offering traders a novel approach to identifying key levels that might influence price movements.
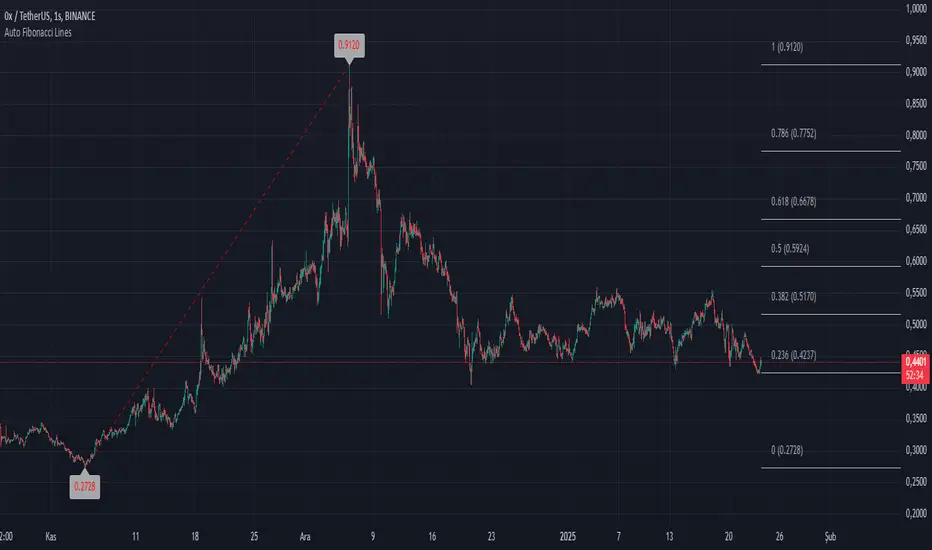
Auto Fibonacci LinesThis TradingView script is a modded version of the library called "VisibleChart" created by Pinecoder.
This version has the option for users to change the Fibonacci lines and price labels. This makes the script user-friendly.
Fibonacci extensions are a tool that traders can use to establish profit targets or estimate how far a price may travel after a retracement/pullback is finished. Extension levels are also possible areas where the price may reverse. This study automatically draws horizontal lines that are used to determine possible support and resistance levels.
It's designed to automatically plot Fibonacci retracement levels on chart, aiding in technical analysis for traders.
First, the highest and lowest bars on the chart are calculated. These values are used for Fibonacci extensions.
These values update as traders scroll or zoom their charts, this shows that it is a useful indicator that can dynamically calculate and draw visuals on visible bars only.
EMA with Bar Count
---
### **Key Features and Functionalities**
#### 1. **Multi-Timeframe Exponential Moving Averages (EMA)**
- The script calculates and plots EMAs for various timeframes (e.g., 1 minute, 5 minutes, 60 minutes, daily, and custom intervals).
- Users can customize the length and resolution of each EMA using inputs.
- Different colors are assigned to each EMA for easy identification on the chart.
#### 2. **Background Coloring**
- Optional background coloring (`bgcolor`) indicates whether the current price is above or below the 1-hour 20 EMA.
- Green indicates the price is above, and red indicates the price is below the EMA.
#### 3. **Bar Count Labeling**
- The script tracks bar counts and displays labels at specific intervals (e.g., every 3 bars).
- Label size and text color can be customized through user inputs.
#### 4. **Inside and Outside Bar Detection**
- Detects and highlights "Inside Bars" and "Outside Bars" on the chart.
- **Inside Bar**: The current bar's high and low are within the previous bar's range.
- **Outside Bar**: The current bar's range exceeds the previous bar's range.
- These patterns are marked with shapes for visual identification.
#### 5. **Bullish/Bearish Candle Streaks**
- Identifies and marks streaks of three consecutive bullish or bearish candles.
- **Bullish Streaks**: Marked with green shapes above the bar.
- **Bearish Streaks**: Marked with red shapes above the bar.
#### 6. **Time-Based Marking**
- The script includes an option to highlight specific time intervals (e.g., 7:30 AM) with a colored vertical line or background shading.
- Configurable time inputs allow flexibility.
#### 7. **Micro Gap Detection**
- Highlights gaps between the opening price of the current bar and the closing price of the previous bar.
- Blue shapes indicate bullish gaps.
- Purple shapes indicate bearish gaps.
#### 8. **TR (Trading Range) Detection**
- Identifies bars with significant overlap based on a user-defined threshold.
- Displays "TR" labels when overlap conditions are met.
#### 9. **Bar Coloring**
- Optionally colors bars based on specific conditions:
- Green: Bullish breakout (high and low higher than the previous bar, closing above the midpoint).
- Red: Bearish breakout (high and low lower than the previous bar, closing below the midpoint).
#### 10. **50% Midpoint Line**
- Displays a horizontal line at the 50% midpoint of the bar's range, customizable for the current or last bar only.
#### 11. **Pattern Detection**
- Recognizes specific candlestick patterns (e.g., IOI, OII, IOO).
- Provides alerts for detected patterns or predefined thresholds.
#### 12. **Alerts**
- Configurable alerts for:
- Specific patterns (e.g., IOI, OII, IOO).
- Bar range exceeding a user-defined threshold.
- Bullish or bearish streaks.
#### 13. **Gap Detector**
- Identifies gaps between bars and marks them with shaded boxes.
- Bullish gaps are shaded green, while bearish gaps are shaded red.
#### 14. **Advanced Customization**
- Extensive user inputs allow traders to tailor the indicator to their trading style.
- Includes support for various levels of detail (e.g., debug mode, label visibility, etc.).
#### 15. **ZigZag and Wedge Patterns**
- Optional zigzag lines to connect swing highs and lows.
- Detects wedge patterns using customizable settings for pivot points and angle differences.
---
### **Use Case Scenarios**
1. **Trend Identification**: Use multi-timeframe EMAs to confirm overall market direction.
2. **Range Trading**: Trade within ranges using detected inside and outside bars as key levels.
3. **Breakout Trading**: Use patterns like IOI and OII to anticipate breakouts.
4. **Scalping**: Exploit bullish and bearish streaks or micro gaps for quick trades.
5. **Pattern-Based Alerts**: Set up alerts for specific market conditions or candlestick patterns.
### **Why This Indicator Is Useful**
- Combines multiple trading tools into a single, customizable script.
- Saves time by automating complex calculations and pattern detections.
- Improves decision-making with clear visual cues and configurable alerts.
Let me know if you'd like any additional explanations or adjustments!

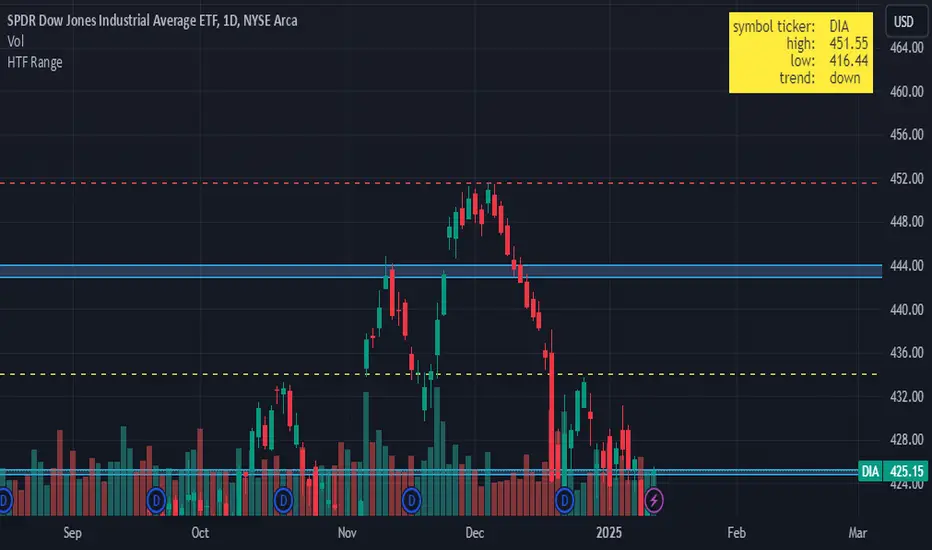
HTF RangeThis Pine Script indicator, HTF Range , is a tool designed to help traders visualize predefined ranges (highs and lows) and analyze price action within those levels. It's particularly useful for identifying key levels and trends for a set of pre-configured assets, such as cryptocurrencies, stocks, and forex pairs.
Key Features:
1. Predefined Symbol Ranges:
Stores a list of assets (tickers) with corresponding high, low, and trend information in an array.
Automatically matches the current symbol on the chart (syminfo.ticker) to fetch and display relevant range data:
High Range: The upper price level.
Low Range: The lower price level.
Trend: Indicates whether the trend is "up" or "down."
Example tickers: BTCUSDT, ETHUSDT, GBPUSD, NVDA, and more.
2. Range Visualizations:
Extremeties: Draws dashed horizontal lines for the high and low levels.
Half-Level: Marks the midpoint of the range with a dashed yellow line.
Upper and Lower Quarters: Highlights upper and lower portions of the range using shaded boxes with customizable extensions:
3. Configurable Inputs:
Enable/Disable Levels: Toggles for extremeties, half-levels, and quarter-levels.
Table Info: Option to display a table summarizing the range data (symbol, high, low, and trend).
4. Dynamic Calculations:
Automatically calculates the difference between the high and low (diff) for precise range subdivisions.
Dynamically adjusts visuals based on the trend (up or down) for better relevance to the market condition.
5. Table Display:
Provides a detailed summary of the asset's range and trend in the top-right corner of the chart:
Symbol ticker.
High and low levels.
Overall trend direction.
Use Case:
This indicator is ideal for traders who:
Trade multiple assets and want a quick overview of key price ranges.
Analyze price movements relative to predefined support and resistance zones.
Use range-based strategies for trend following, breakout trading, or reversals.
JJ Psychological Levels (125 Increments)Psychological Levels Indicator
Description:
The Psychological Levels Indicator is a versatile tool designed for traders to identify key price levels that often act as support or resistance zones in the market. These levels are plotted at regular intervals, customizable by the user, starting from a base price level. This is particularly useful for spotting psychological price points that traders and investors frequently monitor.
Key Features:
1.Dynamic Psychological Levels:
- The script calculates and displays horizontal lines at price levels separated by customizable increments (default: 125 points).
- These levels are dynamically adjusted to the visible range of the chart.
2. Customizable Inputs:
- Starting Level: Set the base level from which increments are calculated (e.g., 0 or 1000).
- Step Size: Define the interval between levels (e.g., 125 for indices like Bank NIFTY).
3. Visual Representation:
- Horizontal lines are drawn at each psychological level, helping traders quickly identify key zones.
- Labels are placed next to each level, displaying the corresponding price for easy reference.
4. Application Across Instruments:
- This indicator works seamlessly with various asset classes, including stocks, indices, forex, and cryptocurrencies.
How to Use:
1.Identify Key Price Zones:
- Use the plotted psychological levels to spot areas where price action is likely to react.
- Levels such as 1125, 1250, and 1375 (for a step size of 125) are visually highlighted.
2. Plan Trades Around Key Levels:
- These levels can act as support/resistance or breakout points, providing opportunities for entry, exit, and stop-loss placement.
3. Customizable Settings:
- Adjust the starting level and step size to tailor the indicator to your trading instrument or strategy.
Why Psychological Levels Matter:
Psychological levels are widely followed by traders and often coincide with key market turning points due to their significance in human behavior and market psychology. They are frequently used by institutional traders, making them valuable reference points for intraday and swing trading.
Custom Settings:
- **Starting Level:** Default: `0`
- **Step Size:** Default: `125`
Disclaimer:
This indicator is a technical analysis tool and is not intended to provide financial advice. Always combine it with other indicators and perform your due diligence before making trading decisions.

ENIGMA Signals with Retests Select higher Time FrameENIGMA Signals with Retests – Script Description
The "ENIGMA Signals with Retests" script is a unique indicator designed for traders who prefer precision trading based on price action retests of key levels derived from higher timeframes. This tool is ideal for those employing multi-timeframe analysis strategies, helping them detect high-probability trade entries when the price interacts with significant support and resistance levels.
What Does This Script Do?
This indicator identifies key levels from a higher timeframe selected by the user (e.g., 4-hour or daily), then tracks price action on lower timeframes to provide actionable buy and sell signals when the price retests these levels. It visually plots the key levels on the chart and triggers alerts for potential trade opportunities when conditions are met.
How It Works
Key Level Detection:
The script uses custom functions to detect recent swing highs and swing lows on the selected higher timeframe (such as 4H or Daily). These levels represent potential areas of support and resistance where price reactions are likely to occur.
Multi-Timeframe Analysis:
The indicator leverages the request.security() function to retrieve price data from the user-defined higher timeframe and plots horizontal lines on the chart for the most recent swing highs and lows.
Retest-Based Signals:
Once the key levels are plotted, the script continuously monitors the price on the lower timeframe:
A Buy Signal is triggered when the price closes below a key high level and then moves back above it, indicating a potential bullish retest.
A Sell Signal is triggered when the price closes above a key low level and then moves back below it, indicating a potential bearish retest.
These retest signals are displayed as green and red arrows on the chart, helping traders identify optimal entry points.
Alerts for Retests:
The script includes built-in alert conditions that notify traders when a valid retest signal occurs. This allows traders to react promptly without constantly monitoring the chart.
How to Use the Script
Select Your Key Timeframe:
From the input settings, choose a higher timeframe that suits your trading style (e.g., 4H for intraday trading or Daily for swing trading).
Adjust Visual Preferences:
Customize the line style (solid, dashed, or dotted) and length of the plotted levels.
Toggle labels for the levels on or off as per your preference.
Trade Execution:
Once a retest signal appears on the lower timeframe, consider entering a trade in the direction of the signal. The buy signal suggests a potential long entry, while the sell signal indicates a potential short entry.
Set Alerts:
Use the alert conditions provided to get notified whenever a valid retest occurs. This helps in reducing screen time and improving trading efficiency.
Underlying Concepts
This script is grounded in the principles of support and resistance, retests, and breakout trading. By focusing on multi-timeframe key levels, it aligns with widely used trading concepts like:
Breakout and Retest: Entering trades after a confirmed breakout and successful retest of a significant level.
Swing Highs and Lows: Recognizing swing points to identify strong price reaction zones.
Multi-Timeframe Confluence: Enhancing trade probability by ensuring that the signals on lower timeframes correspond with key levels from higher timeframes.
Why This Script Is Unique
Unlike many generic trend-following or scalping indicators, "ENIGMA Signals with Retests" offers:
Precision Signals: It only provides signals when specific retest conditions are met, reducing false signals and noise.
Multi-Timeframe Customization: Users can tailor the higher timeframe to their strategy, making it versatile for various trading styles.
Alert Functionality: Alerts are integrated, allowing traders to stay updated without constantly monitoring the charts.
This script is perfect for traders looking for a systematic way to trade retests of key levels across multiple timeframes. Whether you're a scalper, day trader, or swing trader, "ENIGMA Signals with Retests" can help improve your precision and timing in the market.

EBL - Enigma BOS Logic Select Higher Time FrameThe "EBL – Enigma BOS Logic" is a unique multi-timeframe trading indicator designed for traders who rely on structured price action and key level retests to find high-probability trade opportunities. This indicator automates the identification of significant price levels on a higher timeframe, plots them across all lower timeframes, and provides actionable signals (buy/sell) when price retests those levels. It is ideal for traders who focus on lower timeframes for precise entries while using higher timeframe structure for trend confirmation.
How the Indicator Works
Key Level Detection:
The indicator allows the user to select a key level timeframe (e.g., 1H, 4H, Daily, Weekly). It then identifies Break of Structure (BOS) levels on the selected timeframe.
When a bullish-to-bearish or bearish-to-bullish reversal is detected on the selected timeframe, the corresponding high or low of the reversal candle is stored as a key level.
These key levels are plotted as horizontal lines on all lower timeframes, helping the trader visualize critical support and resistance zones across multiple timeframes.
Retest Confirmation:
Once a key level is established, the indicator continuously monitors the price action on lower timeframes.
If the price touches or crosses a key level, it is considered a retest, and an alert is generated.
The indicator plots a retest marker (customizable as a circle or diamond) at the exact price level where the retest occurred, providing a clear visual cue for the trader.
Trading Signals:
When a retest is detected, a table is displayed on the chart with the following information:
The trading pair.
The signal direction (Buy/Sell).
The price at which the retest occurred.
This table gives traders instant insight into actionable opportunities, making it easier to focus on live market conditions without missing critical retests.
Key Features
Multi-Timeframe Analysis: The indicator focuses on a higher timeframe selected by the user, ensuring that only the most relevant key levels are plotted for lower timeframe trading.
Dynamic Retest Signals: It dynamically identifies when price retests a key level and provides both visual markers and real-time alerts.
Customizable Retest Markers: Users can customize the retest marker's shape (circle/diamond) and color to suit their preferences.
Signal Table: A built-in table displays clear buy or sell signals when retests occur, ensuring that traders have all the necessary information at a glance.
Alerts: The indicator supports real-time alerts for retests, helping traders stay informed even when they are not actively monitoring the chart.
How to Use the Indicator
Select a Key Level Timeframe:
In the input settings, choose a higher timeframe (e.g., 4H or Daily) to define key levels.
The indicator will calculate Break of Structure (BOS) levels on the selected timeframe and plot them as horizontal lines across all lower timeframes.
Monitor Lower Timeframes for Retests:
Switch to a lower timeframe (e.g., 15m, 5m) to wait for price to approach the key levels plotted by the indicator.
When a retest occurs, observe the signal table and retest marker for actionable trade signals.
Act on Buy/Sell Signals:
Use the information provided by the signal table to make trading decisions.
For a buy signal, wait for bullish confirmation (e.g., price holding above the retested level).
For a sell signal, wait for bearish confirmation (e.g., price holding below the retested level).
Trading Concepts and Underlying Logic
The indicator is based on the Break of Structure (BOS) concept, a core principle in price action trading. BOS levels represent points where the market shifts its trend direction, making them critical zones for potential reversals or continuations.
By focusing on higher timeframe BOS levels, the indicator helps traders align their lower timeframe entries with the overall market trend.
The concept of retests is used to confirm the validity of a key level. A retest occurs when the price returns to a previously identified BOS level, offering a high-probability entry point.
Use Cases
Scalping: Traders who prefer lower timeframe scalping can use the indicator to align their trades with higher timeframe key levels, increasing the likelihood of successful trades.
Swing Trading: Swing traders can use the indicator to identify key reversal zones on higher timeframes and plan their trades accordingly.
Intraday Trading: Intraday traders can benefit from the real-time alerts and signals generated by the indicator, ensuring they never miss critical retests during active trading hours.
Conclusion
The "EBL – Enigma BOS Logic" is a powerful tool for traders who want to enhance their price action trading by focusing on key levels and retests across multiple timeframes. By automating the identification of BOS levels and providing clear retest signals, it helps traders make more informed and confident trading decisions. Whether you are a scalper, intraday trader, or swing trader, this indicator offers valuable insights to improve your trading performance.

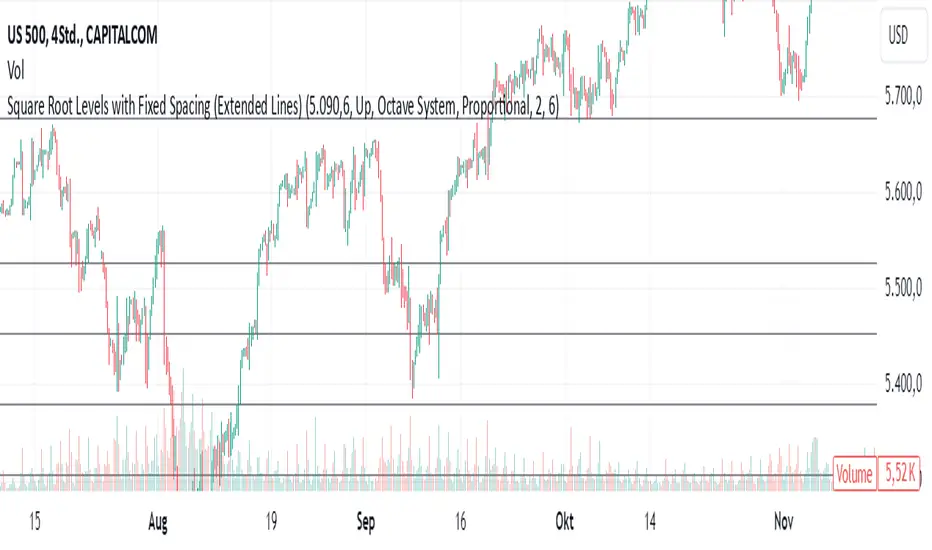
Jenkins Square Root Levels Square Root Levels with Fixed Spacing (Extended Lines)
This script calculates and displays horizontal levels based on the square root of a price point. It offers two calculation modes, Octave System and Square Root Multiples, allowing traders to identify key support and resistance levels derived from price harmonics.
The methodology is inspired by the teachings of Michael Jenkins, to whom I owe much gratitude for sharing his profound insights into the geometric principles of trading.
Features and Functions
1. Calculation Modes
Octave System:
Divides the square root range into specified steps, called "octave divisions."
Each division calculates levels proportionally or evenly spaced, depending on the selected spacing mode.
Multiple repetitions (or multiples) extend these levels upward, downward, or both.
Square Root Multiples:
Adds or subtracts multiples of the square root of the price point to create levels.
These multiples act as harmonics of the original square root, providing meaningful levels for price action.
2. Spacing Modes
Proportional: Levels are scaled proportionally with each multiple, resulting in increasing spacing as multiples grow.
Even: Levels are spaced equally, maintaining a consistent distance regardless of the multiple.
3. Direction
Up: Calculates levels above the price point only.
Down: Calculates levels below the price point only.
Both: Displays levels on both sides of the price point.
4. Customization Options
Price Point: Enter any key high, low, or other significant price point to anchor the calculations.
Octave Division: Adjust the number of divisions within the octave (e.g., 4 for quarter-steps, 8 for eighth-steps).
Number of Multiples: Set how far the levels should extend (e.g., 3 for 3 repetitions of the octave or square root multiples).
5. Visualization
The calculated levels are plotted as horizontal lines that extend across the chart.
Lines are sorted and plotted dynamically for clarity, with spacing adjusted according to the chosen parameters.
Acknowledgments
This script is based on the trading methodologies and geometric insights shared by Michael S. Jenkins. His work has profoundly influenced my understanding of price action and the role of harmonics in trading. Thank you, Michael Jenkins, for your invaluable teachings.
P/L CalculatorDescription of the P/L Calculator Indicator
The P/L Calculator is a dynamic TradingView indicator designed to provide traders with real-time insights into profit and loss metrics for their trades. It visualizes key levels such as entry price, profit target, and stop-loss, while also calculating percentage differences and net profit or loss, factoring in fees.
Features:
Customizable Input Parameters:
Entry Price: Define the starting price of the trade.
Profit and Stop-Loss Levels (%): Set percentage thresholds for targets and risk levels.
USDT Amount: Specify the trade size for precise calculations.
Trade Type: Choose between "Long" or "Short" positions.
Visual Representation:
Entry Price, Profit Target, and Stop-Loss levels are plotted as horizontal lines on the chart.
Line styles, colors, and thicknesses are fully customizable for better visibility.
Real-Time Metrics:
Percentage difference between the live price and the entry price is calculated dynamically.
Profit/Loss (P/L) and fees are computed in real time to display net profit or loss.
Alerts:
Alerts are triggered when:
The live price hits the profit target.
The live price crosses the stop-loss level.
The price reaches the specified entry level.
A user-defined percentage difference is reached.
Labels and Annotations:
Displays percentage difference, P/L, and fee information in a clear label near the live price.
Custom Fee Integration:
Allows input of trading fees (%), enabling accurate net profit or loss calculations.
Price Scale Visualization:
Displays the percentage difference on the price scale for enhanced context.
Use Case:
The P/L Calculator is ideal for traders who want to monitor their trades' performance and make informed decisions without manually calculating metrics. Its visual cues and alerts ensure you stay updated on critical levels and price movements.
This indicator supports a wide range of trading styles, including swing trading, scalping, and position trading, making it a versatile tool for anyone in the market.
