Average Range Levels [Pro+]Description:
The Average Range Levels builds on the concepts of ADR projections showcased in its lite version.
Average Daily Range (ADR) is a common metric used to measure volatility in an asset. It calculates the average difference between the highest and lowest price over a time interval – normally five days.
The Inner Circle Trader teaches the importance of this metric from an algorithmic point of view; in particular the 1/3ADR price level is deemed to be a threshold used to determine the area at which a Judas Swing – false move to trick market participants, protraction, manipulation – might exhaust.
Another key difference in the ICT-use of this metric compared to the classic approach is that the average range is calculated from New York midnight Time, rather than the daily candle's open.
This exact concept was upscaled to higher Timeframe fractals obtaining the Average Weekly Range (AWR) and the Average Monthly Range (AMR). The latter two metrics are anchored at the first Monday’s midnight (New York Time) of the respective interval – however they also have the option to be anchored at the True Week Open (Tuesday’s Daily Open) and True Month Open (Second Week Open).
It is crucial to remember that the elements of Time are key when it comes to interpreting how price action will, or won't, react to these levels: what Time of the day is it? what day of the week? what week of the month?
If one thinks about the Power of Three of a candle (Accumulation, Manipulation Distribution), it is highly unlikely that a Manipulation event will happen later in the candle’s development – seeing the 1/3ADR hold in London session or New York open, seeing the 1/3AWR hold on Tuesday or Wednesday, or seeing price race to the 1/3AMR early on in the month gives undeniable edge to an Analyst.
Apart from the 1/3 level seen from a Judas perspective, the opposing 1/3 level, and the full AR projections, are excellent algorithmic levels at which we will see orderflow or reactions worth studying. These can be take profit targets, reversal opportunities, pyramid entries, …
Last but not least, the tool is equipped with a Data Table. You have a clear narrative but you are unsure of when price will expand? Track the previous 5 ARs and the current Range for Daily, Weekly, and Monthly – the smaller the AR the higher the chance for an expansion, the larger the AR the higher the chance for a consolidation.
Tool Features:
Auto Color the drawings based on your chart’s background or choose your own
Decide whether to consider daily candles, or New York (00:00 to 00:00 NY Time) for the basis of the calculation
Show the last 10 Historical Levels
– See the AR Range, the AR price levels and 1/3AR price levels by hovering over the text labels
Plot the AR levels from their Time Anchor, or as offset markers on the side for a cleaner look
Show/Hide all elements individually
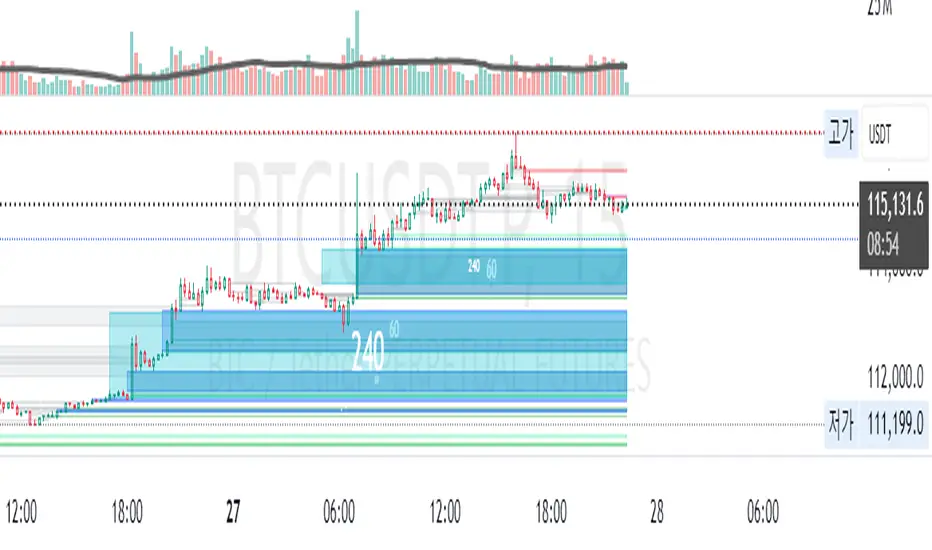
In the Idea below, you can see how INDEX:BTCUSD hit the 1/3AMR level at the end of the second week of the month. The subsequent rejection from this level suggests we might have witnessed a Judas Swing, hence we flip to bullish bias.
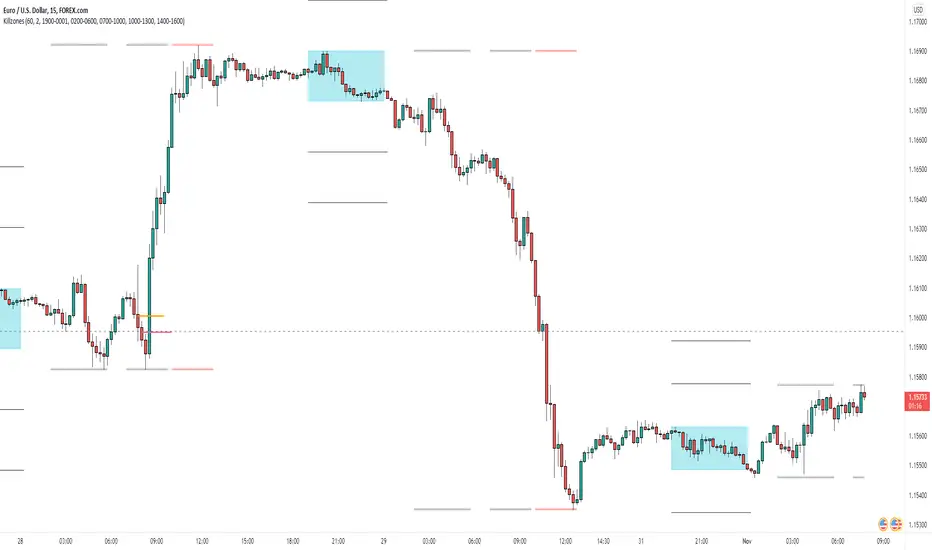
In the more recent AWR levels, we can see how price did not touch any level until friday – this is a consolidation week with low probability setups. This was expected, if one looks at the precious two week's ranges and respective average ranges in the Data Table: both breached the AR value, due to to the great expansion higher.
Lastly for the ADR levels we can see how the Judas higher got beautifully stopped at the 1/3 level, and the full ADR level on the opposite side catches price while it falls.
To Get Access, and Level Up see the Author's Instructions below!
This indicator is available only on the TradingView platform.
⚠️ Intellectual Property Rights ⚠️
While this tool's base concepts are public, its interpretation, code, and presentation are protected intellectual property. Unauthorized copying or distribution is prohibited.
⚠️ Terms and Conditions ⚠️
This financial tool is for educational purposes only and not financial advice. Users assume responsibility for decisions made based on the tool's information. Past performance doesn't guarantee future results. By using this tool, users agree to these terms.
Paid script